
Applying the Sustainability Barometer Approach to Assess Urban Sustainability
Abstract
:1. Introduction
- It gives equal attention to people and the ecosystem in quantified and combined themes, since both are essential for sustainable development in the long term. This means that it has two comprehensible and broad dimensions of ecosystem well-being and human well-being, which cover all environmental and human well-being needs.
- It consists of an analytical hierarchy, developed from a shared vision of sustainability to specific measurements via identifying elements and objectives.
- It is a powerful visual and analytical tool that helps users articulate and assess overall sustainability and specific areas of concern.
- Its methodological structure provides a communication performance that allows researchers to combine different indicators and show how each contributes to the performance of themes and the overall vision. Too often, the communicative power of indicators is obscured by hidden assumptions and excessive complexity. This remarkable advantage provides appropriate indicators of socioeconomic and environmental dimensions, which make the effects of the dimensions mutually measurable.
- Flexibility was the most notable feature of this application method in current research because it can be applied to support a broad range of uses and can be scaled according to needs and resources without losing the central message or sacrificing essential features. This means that it can be applied from the local to the global scale.
- Its ease of use makes many users prefer this method to mathematical and statistical methods.
- Its scale is divided into five parts, from zero to one, allowing the user to control the situation in several parts.
2. Materials and Methods
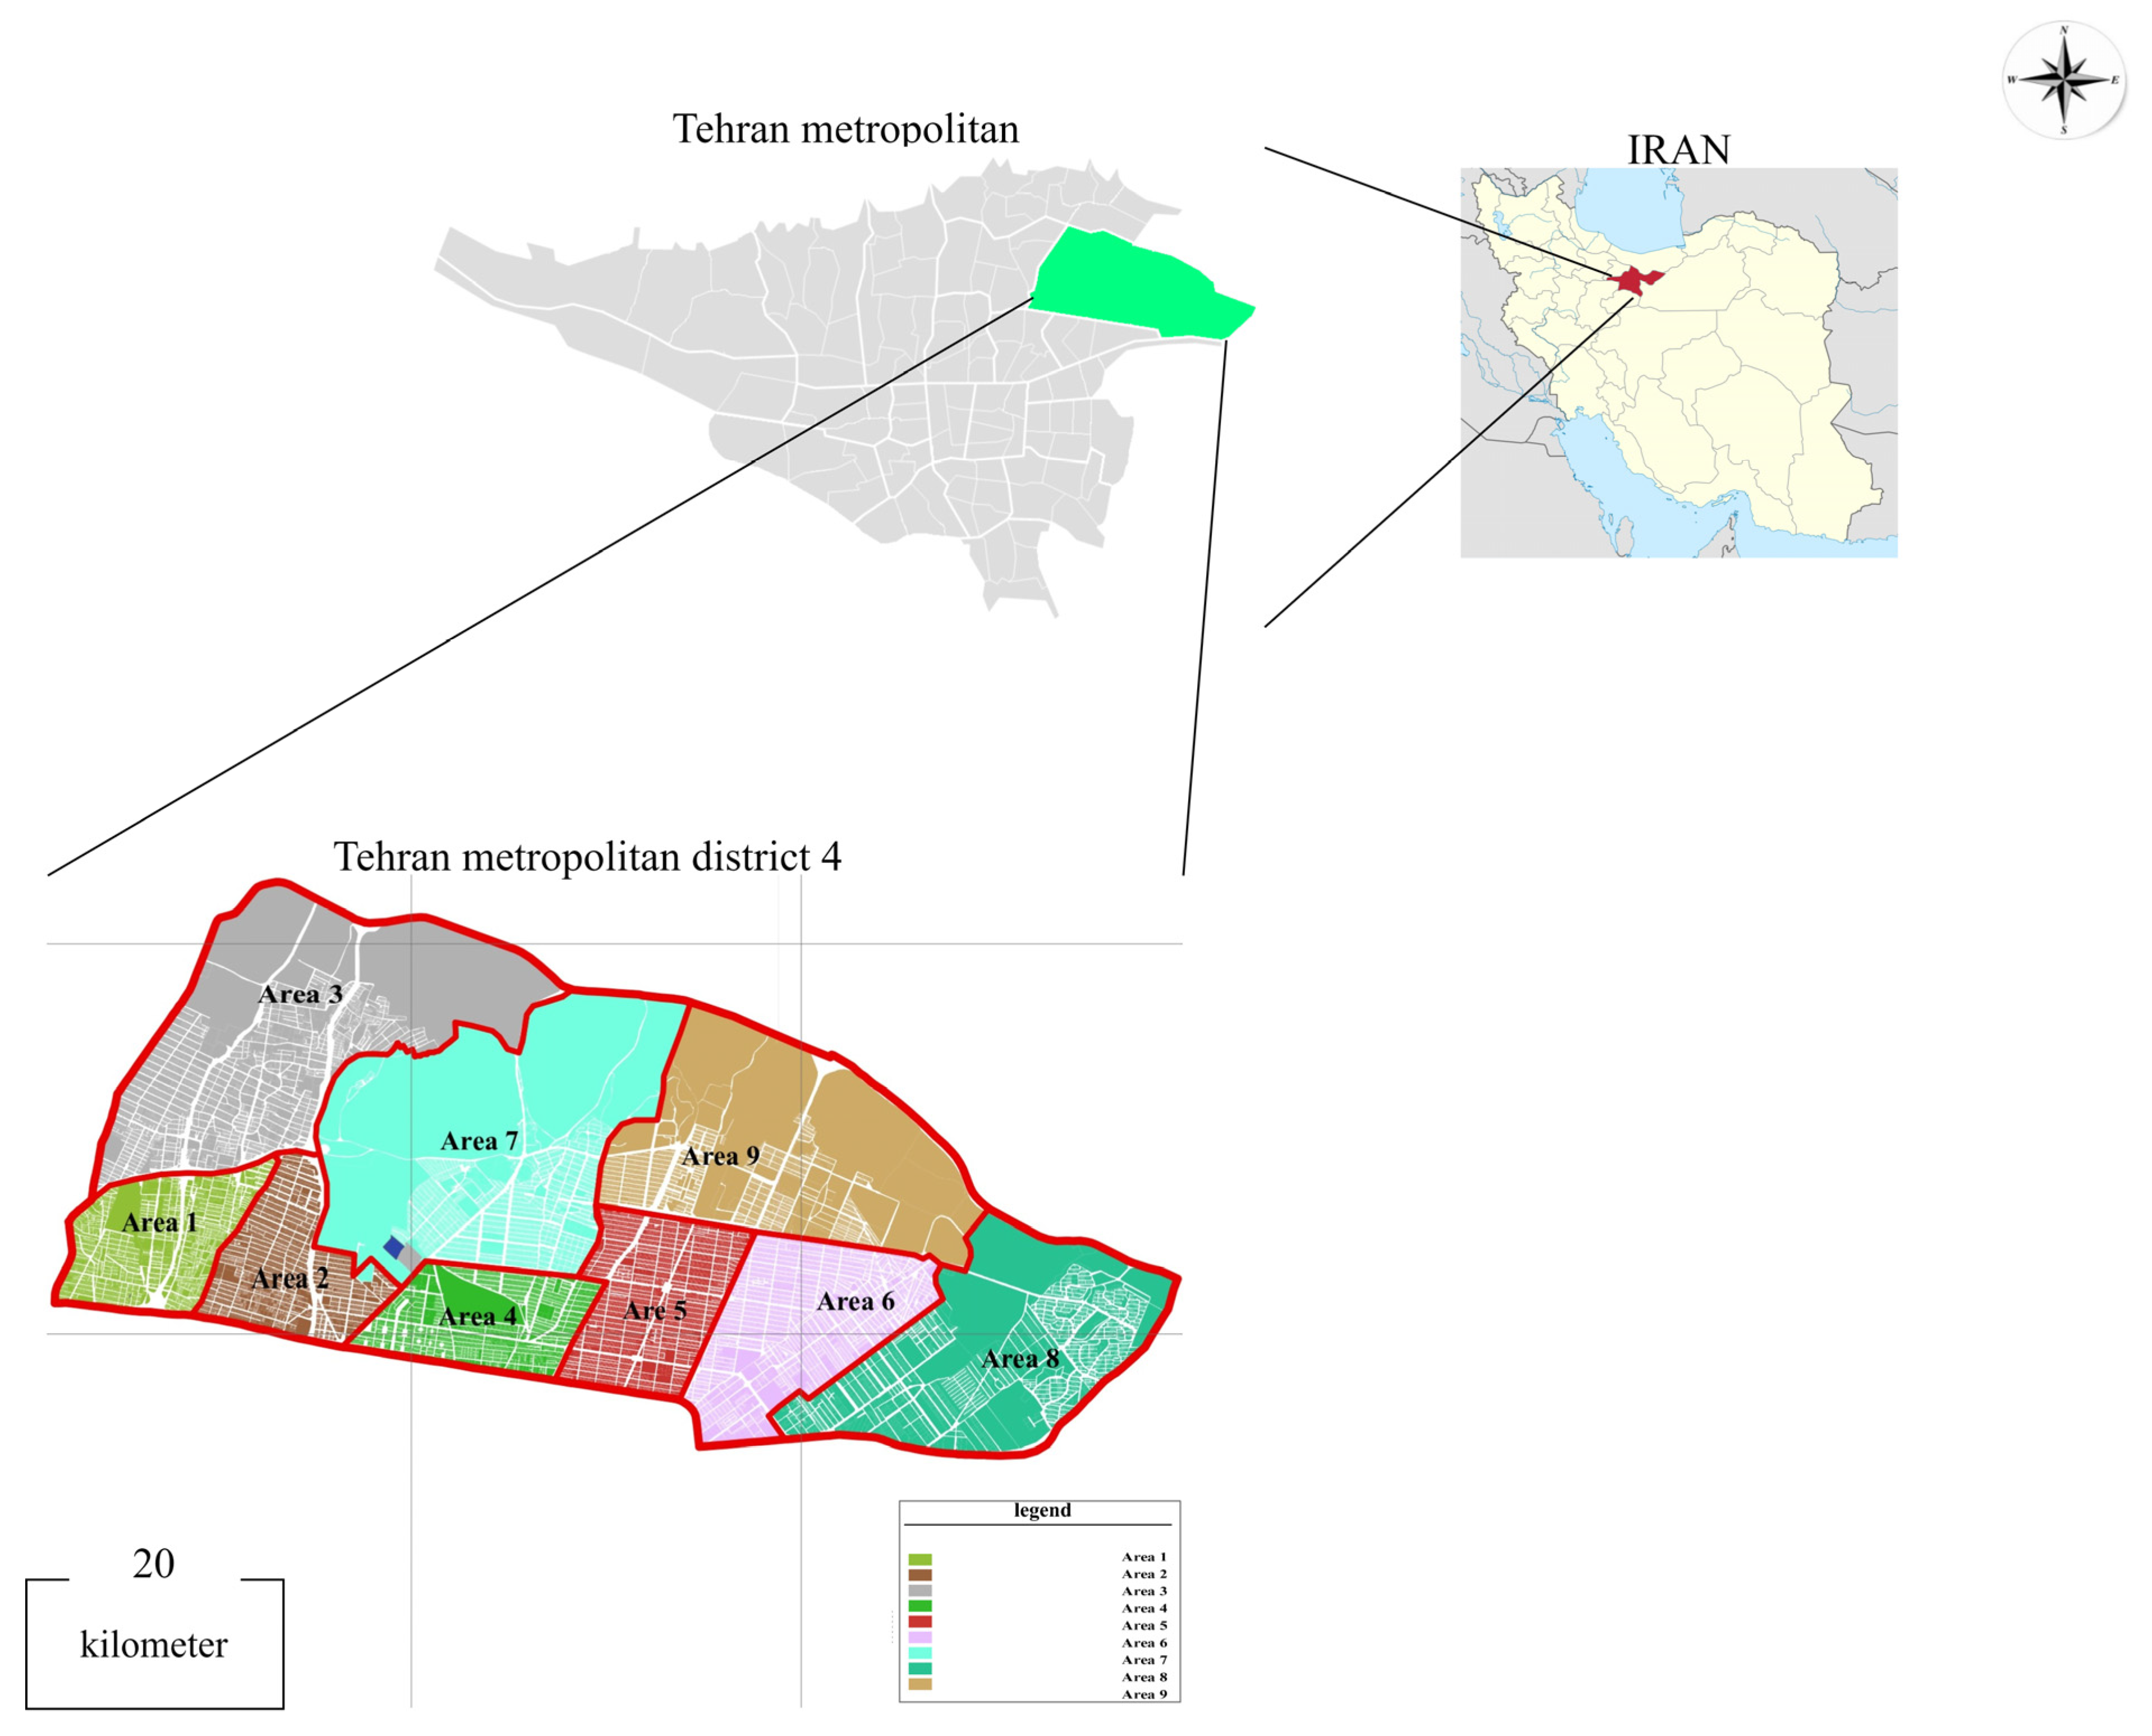
2.1. Study Area
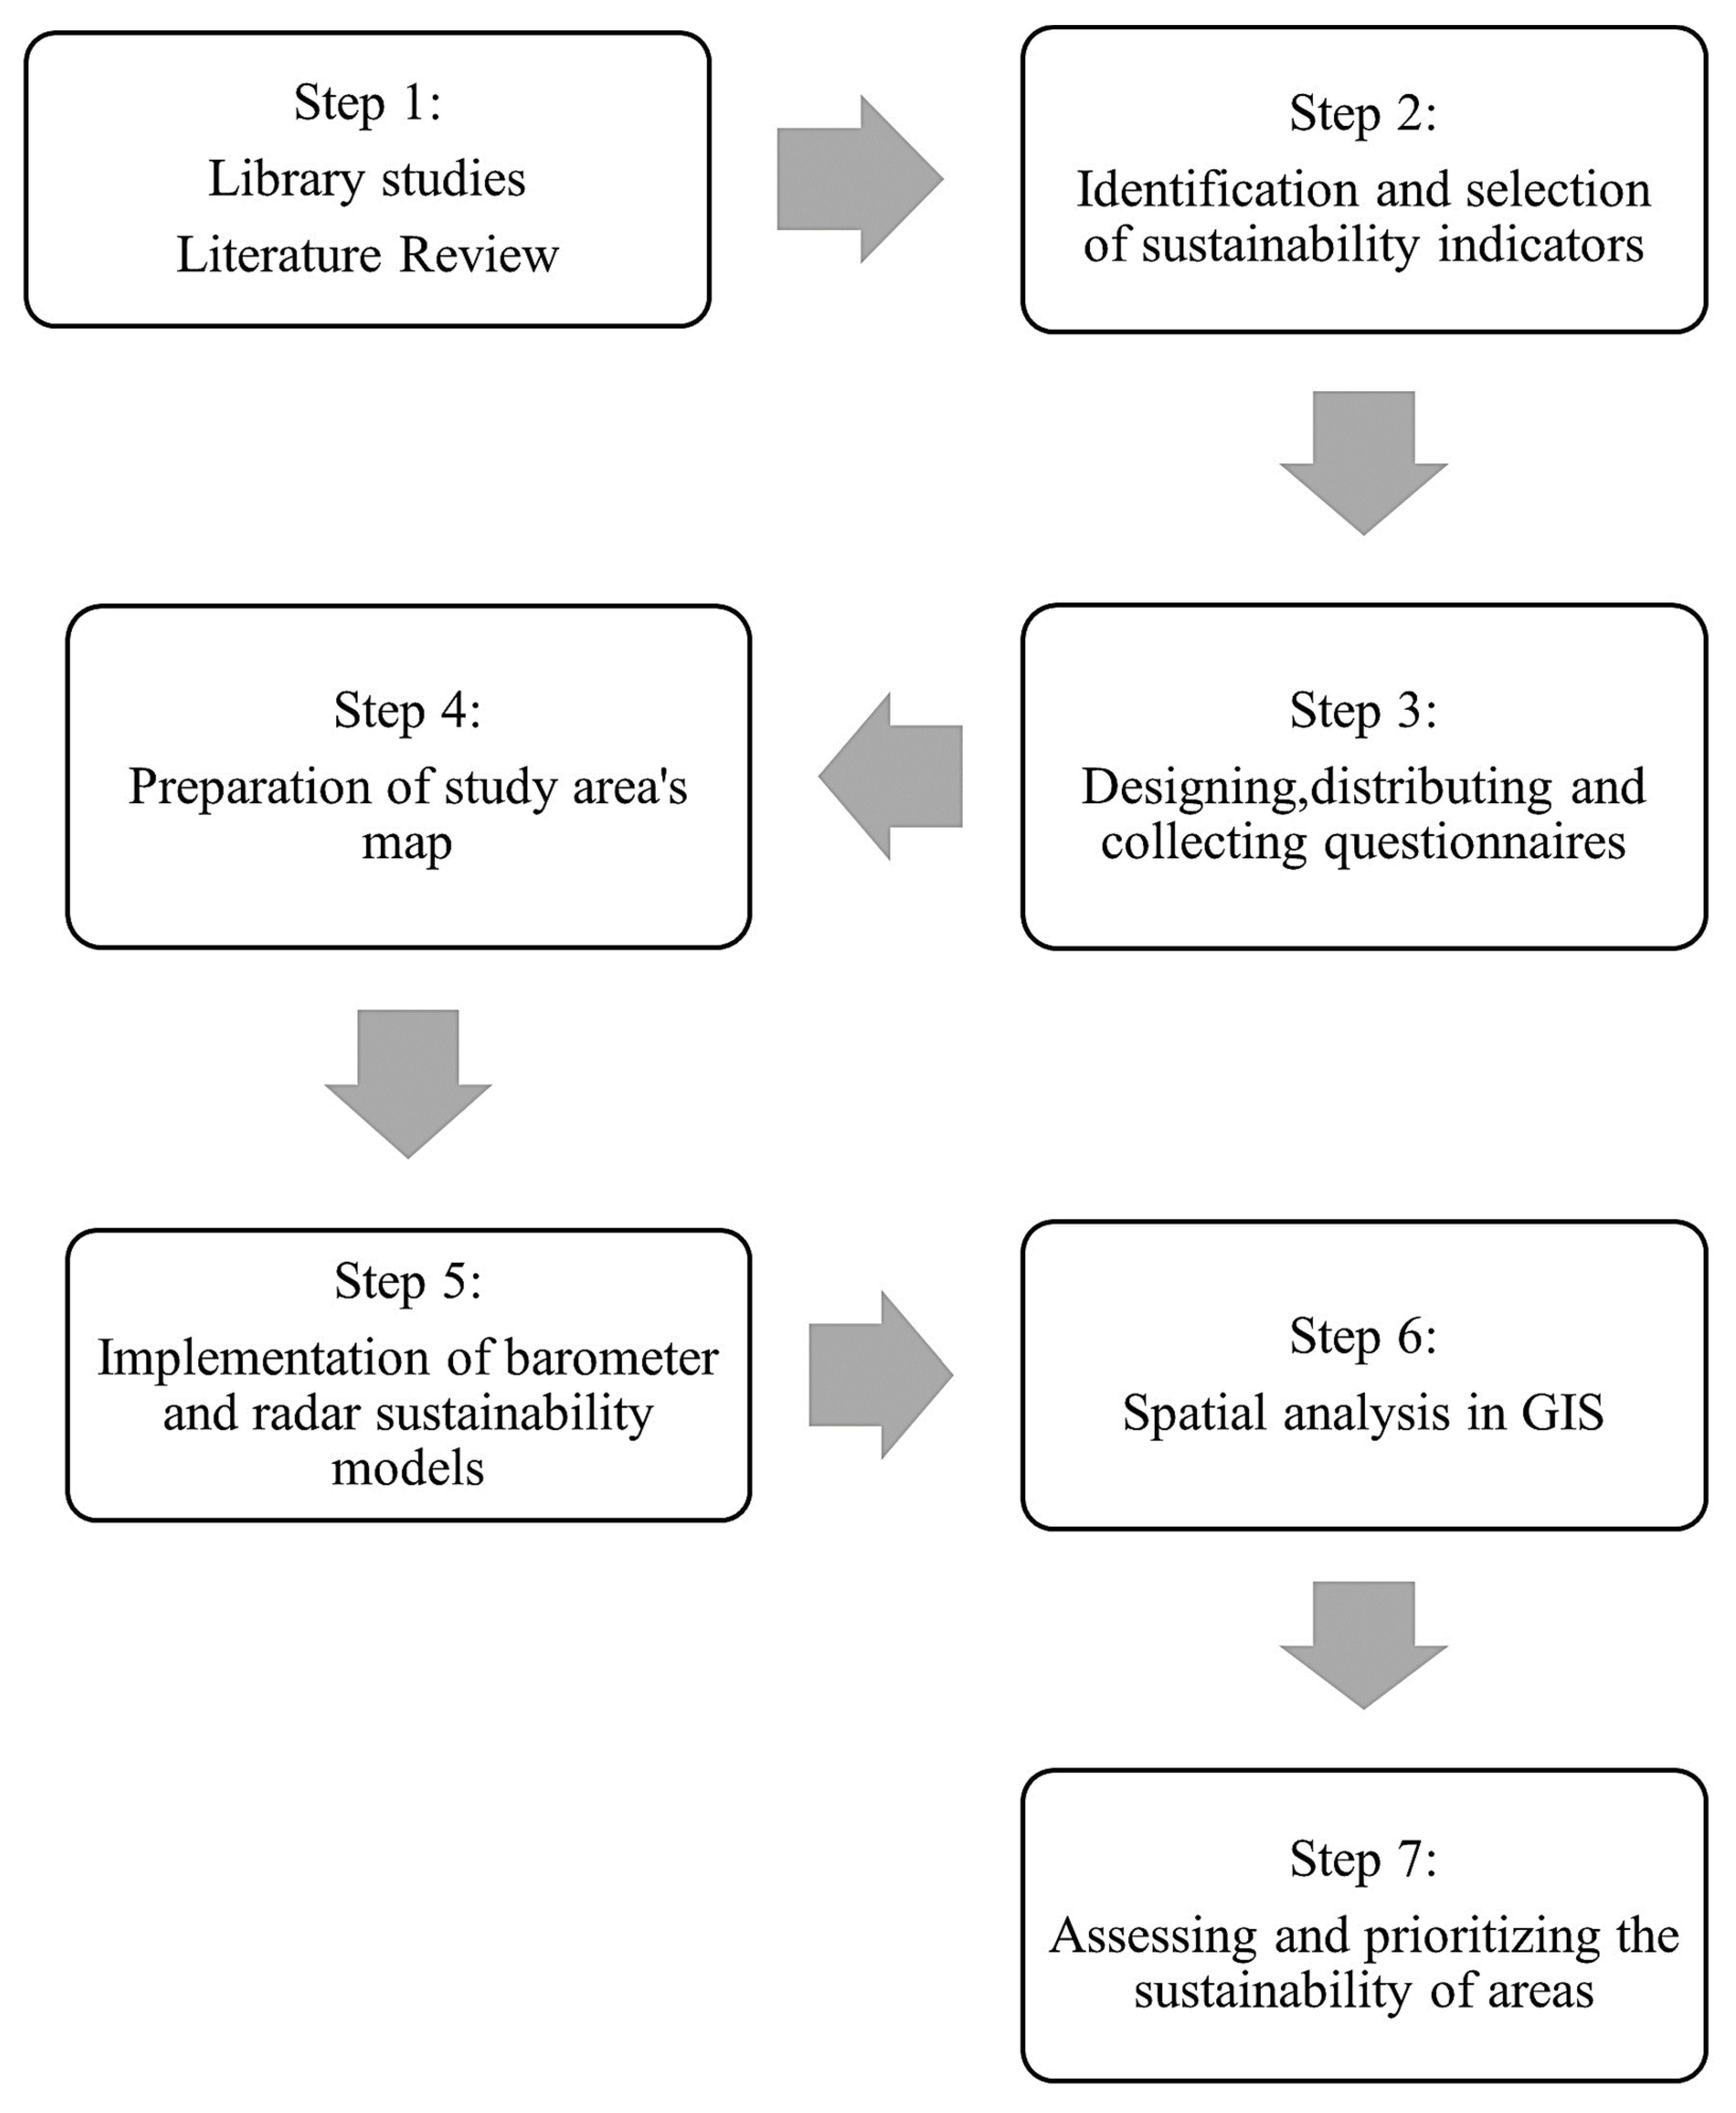
2.2. Research Process
2.3. Barometer of Sustainability Method
2.3.1. Stages of the IUCN Approach Cycle
2.3.2. Indicator Selection Process
2.3.3. Steps of Preparation
- Preparing the raw data: The initial value of each indicator—obtained based on reference to the relevant organizations—was considered.
- Preparing the table of the aligned data: Some of the indicators in the raw data table were not aligned. Thus, they were aligned in a way that the non-aligned data were subtracted from a fixed number (100 in this study).
- Preparing the data table with the real values: The weight of each indicator was calculated using the Shannon entropy weighting method as presented in Equation (1) [98] and multiplied in the aligned data. This weighting system can be expressed in a series of steps. In step 1, the decision matrix has to be normalized using the equation below.
- 4.
- Preparing the table of the same scale data: Since each indicator in the data table had a different unit, the comparison was made by unscaling the data with the help of the equations for unscaling the data with a positive dimension (Equation (2)) and unscaling the data with a negative dimension (Equation (3)) as below.
- 5.
- Callcuating the barometer of sustainability
2.3.4. Sustainability Radar Tool
3. Results and Discussion
3.1. Urban Sustainability of the 9 Regions Based on Three Dimensions of Sustainability
3.1.1. Evaluation of Environmental Dimension
3.1.2. Evaluation of Socioeconomic Dimension
3.1.3. Evaluation of Cultural Dimension
3.2. Assessment of Urban Sustainability in District 4 Based on Two Broad Dimensions
3.2.1. Sustainability of Ecosystem Well-Being
3.2.2. Human Well-Being Sustainability
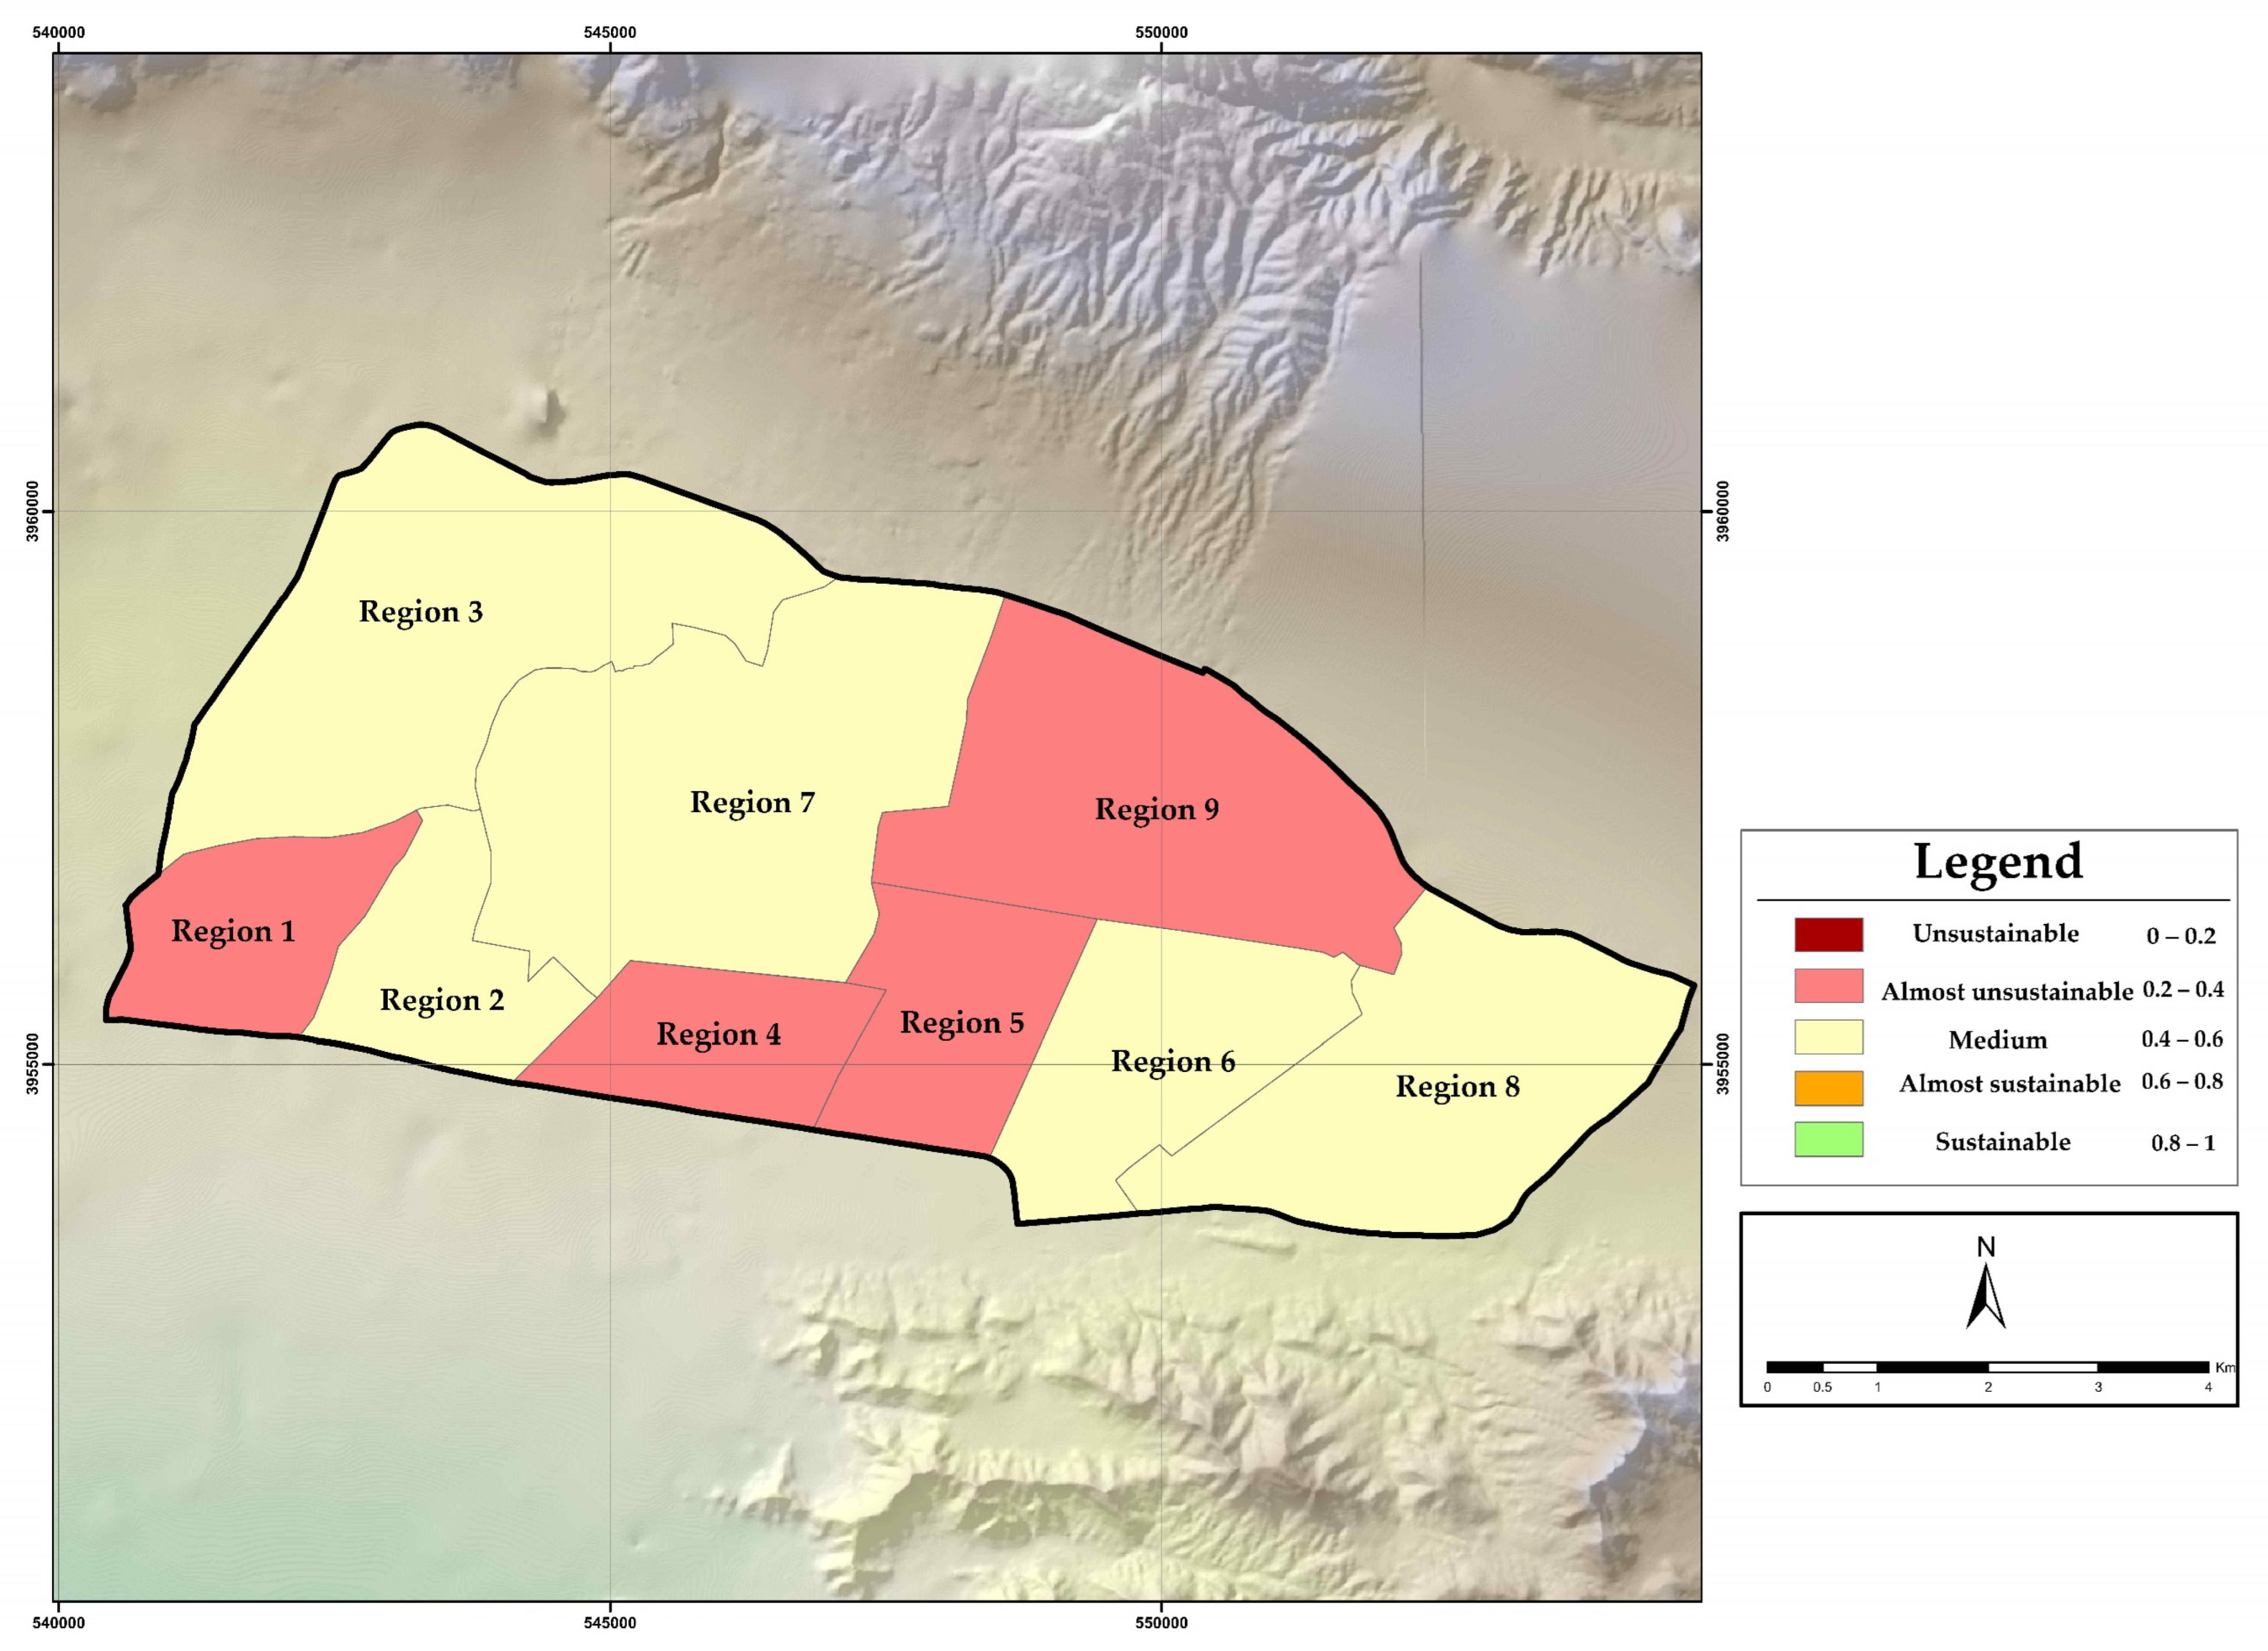
3.3. Overall Sustainability
4. Conclusions
Author Contributions
Funding
Institutional Review Board Statement
Informed Consent Statement
Data Availability Statement
Conflicts of Interest
Appendix A

| No. | Basic Indicators | Importance Rate | ||||
|---|---|---|---|---|---|---|
| Very Important 5 | Important 4 | Moderate 3 | Less Important 2 | Not Important 1 | ||
| 1 | Number of cultural corporations | 276 [71%] | ||||
| 2 | Number of cinemas | 228 [59%] | ||||
| 3 | Number of libraries | 288 [75%] | ||||
| 4 | Number of tourist attractions | 192 [50%] | ||||
| 5 | Number of religious centers | 312 [81%] | ||||
| 6 | Number of mosques | 252 [65%] | ||||
| 7 | Number of museums | 276 [71%] | ||||
| 8 | Number of theaters | 204 [53%] | ||||
References
- Huang, L.; Wu, J.; Yan, L. Defining and measuring urban Sustainability: A review of indicators. J. Landsc. Ecol. 2015, 30, 1175–1193. [Google Scholar] [CrossRef]
- Flood, C.E.; Wong, M.Y. Social Stability in Times of Change Effects of Group Fusion and Water Depth on Sociality in a Globally Invasive Fish. Anim. Behav. 2017, 129, 71–79. [Google Scholar] [CrossRef]
- Zheng, W.; Shen, G.Q.; Wang, H.; Hong, J.; Li, Z. Decision support for sustainable urban renewal: A multi-scale model. J. Land Use Policy 2017, 69, 361–371. [Google Scholar] [CrossRef] [Green Version]
- Yan, Y.; Shan, P.; Wang, C.; Quan, Y.; Wu, D.; Zhao, C.; Wu, G.; Deng, H. Assessment of urban sustainability efficiency based on general data envelopment analysis: A case study of two cities in western and eastern China. Environ. Monit. Assess. 2017, 189, 191. [Google Scholar] [CrossRef] [PubMed]
- Yang, W.; Jiang, X. Evaluating Sustainable Urbanization of Resource-Based Cities Based on the McKinsey Matrix: Case Study in China. J. Urban Plan. Dev. 2018, 144, 05017020. [Google Scholar] [CrossRef]
- Harsimran, K.; Garg, P. Urban Sustainability Assessment Tools: A Review. J. Clean. Prod. 2019, 210, 146–158. [Google Scholar]
- Yi, P.; Dong, Q.; Li, W. Evaluation of City Sustainability Using the Deviation Maximization Method. Sustain. Cities Soc. 2019, 50, 101529. [Google Scholar] [CrossRef]
- Zinatizadeh, S.; Azmi, A.; Monavari, M.; Sobhanardakani, S. Evaluation and prediction of Sustainability of urban areas: A case study for Kermanshah city, Iran. J. Cities 2017, 66, 1–9. [Google Scholar] [CrossRef]
- Ameen, R.F.M.; Mourshed, M. Urban sustainability assessment framework development: The ranking and weighting of sustainability indicators using analytic hierarchy process. Sustain. Cities Soc. 2019, 44, 356–366. [Google Scholar] [CrossRef]
- Tang, J.; Zhu, H.; Liu, Z.; Jia, F.; Zheng, X. Urban Sustainability Evaluation under the Modified TOPSIS Based on Grey Relational Analysis. Int. J. Environ. Res. Public Health 2019, 16, 256. [Google Scholar] [CrossRef] [Green Version]
- Egilmez, G.; Gumus, S.; Kucukvar, M. Environmental Sustainability benchmarking of the U.S. and Canada metropolis: An expert judgment-based multi-criteria decision making approach. Cities 2015, 42, 31–41. [Google Scholar] [CrossRef]
- Larimian, T.; Zarabadi, Z.S.S.; Sadeghi, A. Developing a fuzzy AHP model to evaluate environmental Sustainability from the perspective of Secured by Design scheme—A case study. Sustain. Cities Soc. 2013, 7, 25–36. [Google Scholar] [CrossRef]
- Mateusz, P.; Danuta, M.; Malgorzata, Ł.; Mariusz, B.; Kesra, N. TOPSIS and VIKOR methods in study of sustainable development in the EU countries. Procedia Comput. Sci. 2018, 126, 1683–1692. [Google Scholar] [CrossRef]
- Shmelev, S. Multidimensional Sustainability Assessment for Megacities. In Green Economy Reader: Lectures in Ecological Economics and Sustainability; Springer: Berlin/Heidelberg, Germany, 2017; pp. 205–236. [Google Scholar]
- Haidar, H.; Hewage, K.; Umer, A.; Ruparathna, R.; Chhipi-Shrestha, G.; Culver, K.; Sadiq, R. Sustainability assessment framework for small-sized urban neighbourhoods: An application of fuzzy synthetic evaluation. Sustain. Cities Soc. 2018, 36, 21–32. [Google Scholar] [CrossRef]
- Sen, N.; Ghosh, A.; Saha, A.; Karmaker, B.R. Sustainability Status of Indian States: Application and Assessment of MCDM Frameworks. In Proceedings of the IEEE Symposium on Computational Intelligence in Multi-Criteria Decision-Making (MCDM), Orlando, FL, USA, 9–12 December 2014. [Google Scholar]
- Kim, Y.; Chung, E.-S.; Jun, S.-M.; Kim, S.U. Prioritizing the best sites for treated wastewater instream use in an urban watershed using fuzzy TOPSIS. Resour. Conserv. Recycl. J. 2013, 73, 23–32. [Google Scholar] [CrossRef]
- Guijt, I.; Moiseev, A.; Prescott-Allen, R. IUCN Resource Kit for Sustainability Assessment; IUCN—The World Conservation Union: Gland, Switzerland, 2001. [Google Scholar]
- Poveda, C.A. Sustainability Assessment: A Rating System Framework for Best Practices: With a Theoretical Application to the Surface Mining Recovery Process for the Development and Operations of Oil Sands Projects; Emerald Publishing: Bingley, UK, 2017. [Google Scholar]
- Mulliner, E.; Malys, N.; Maliene, V. Comparative analysis of MCDM methods for the assessment of sustainable housing affordability. Omega 2016, 59, 146–156. [Google Scholar] [CrossRef]
- Sharifi, A.; Kawakubo, S.; Milovidova, A. Urban sustainability assessment tools: Toward integrating smart city indicators. Urban Syst. Des. 2020, 345–372. [Google Scholar] [CrossRef]
- Shmelev, S.E.; Shmeleva, I.A. Methods and indicators for urban sustainability assessment. In Sustainable Cities Reimagined; Shmelev, S.E., Ed.; Routledge: Abingdon on Thames, UK, 2019. [Google Scholar] [CrossRef]
- Cohen, M. A Systematic Review of Urban Sustainability Assessment Literature. Sustainability 2017, 9, 2048. [Google Scholar] [CrossRef] [Green Version]
- Ayik, C.; Ayataç, H.; Sertyesilisik, B. A Gap Analysis on Urban Sustainability Studies and Urban Sustainability Assessment Tools. Archit. Res. 2017, 7, 1–15. [Google Scholar] [CrossRef]
- Anastasios, T. Methods and Tools for the Assessment of Urban Sustainability. Master’s Thesis, University of Hellenic, Thessaloniki, Greece, 2017. [Google Scholar]
- Guimarães, E.; Barbosa, J.A.; Bragança, L. Critical Overview of Urban Sustainability Assessment Tools. In Proceedings of the Sustainable Urban Communities towards a Nearly Zero Impact Built Environment (SBE16), Vitoria, Brazil, 7–9 September 2016; Volume 2, p. 293. [Google Scholar]
- Prescott-Allen, R. Barometer of Sustainability: Measuring and Communicating Wellbeing and Sustainable Development; International Union for Conservation of Nature and Natural Resources (IUCN): Gland, Switzerland, 1997. [Google Scholar]
- Batalhão, A.C.D.S.; Teixeira, D.; Godoi, E.L.D. The Barometer of Sustainability as a Monitoring Tool of the Sustainable Development Process in Ribeirão Preto, Brazil. J. Environ. Sci. Eng. A 2017, 6, 120–126. [Google Scholar]
- Mofarah Bonab, M.; Majnouni Toutakhane, A.; Soleymani, A.R.; Aftab, A. Assessment and Analysis of Sustainability Status in Metropolises, Case Study: All Ten Regions of Tabriz. Geogr. Res. 2018, 33, 140–157. [Google Scholar]
- Kumar, A. A System Assessment of Dasudi Gram Panchart; IUCN: Gland, Switzerland, 1999. [Google Scholar]
- Guidolini, J.F.; Giarolla, A.; Toledo, P.M.; Valera, C.A.; Ometto, J.P.H.B. Water Sustainability at the River Grande Basin, Brazil: An Approach Based on the Barometer of Sustainability. Int. J. Environ. Res. Public Health 2018, 15, 2582. [Google Scholar] [CrossRef] [PubMed]
- Fallah-Alipour, S.; Boshrabadi, H.M.; Zare Mehrjerdi, M.R.; Hayati, D.A. Framework for Empirical Assessment of Agricultural Sustainability: The Case of Iran. Sustainability 2018, 10, 4823. [Google Scholar] [CrossRef] [Green Version]
- Mirchooli, F.; Sadeghi, S.H.; Darvishan, A.K.; Strobl, J. Multi-dimensional assessment of watershed condition using a newly developed barometer of Sustainability. Sci. Total Environ. 2021, 791, 148389. [Google Scholar] [CrossRef] [PubMed]
- The Studies and Planning Center of Tehran Municipality: Department of Infrastructure and comprehensive Plan. Tehran Metropolitan Status of Environment (SOE); The Studies and Planning Center of Tehran Municipality, Department of Infrastructure and comprehensive Plan: Tehran, Iran, 2011.
- Iran Statistics Center. Report of the 2017 Census of Housing and Population of Tehran Metropolis; Iran Statistics Center: Tehran, Iran, 2017. [Google Scholar]
- Robati, M.; Rezaei, F. Evaluation and ranking of urban Sustainability based on sustainability assessment by fuzzy evaluation model. Int. J. Environ. Sci. Technol. 2021, 19, 625–650. [Google Scholar] [CrossRef]
- Mercer Human Recourse Consulting (MHRC). Quality of Living Global City Rankings Mercer Survey. 2019. Available online: https://mobilityexchange.mercer.com/quality-of-living (accessed on 9 September 2019).
- Arcadis. Citizen Centric Cities: 2018 Arcadis Sustainable Cities Index; Arcadis: Amsterdam, The Netherlands, 2018. [Google Scholar]
- UN-Habitat. State of the World’s Cities 2012/2013: Prosperity of Cities; United Nations Human Settlements Programe: Nairobi, Kenya, 2012. [Google Scholar]
- World Health Organization (WHO). Global Reference List of 100 Core Health Indicators (Plus Health-Related SDGs), 2nd ed.; WHO: Geneva, Switzerland, 2018.
- Global Platform for Sustainable Cities; World Bank. Urban Sustainability Framework, 1st ed.; World Bank Group: Washington, DC, USA, 2018. [Google Scholar]
- OECD. OECD Regions and Cities at a Glance 2018; OECD Publishing: Paris, France, 2018. [Google Scholar]
- Zeng, X.; Yu, Y.; Yang, S.; Lv, Y.; Sarker, M.N.I. Urban Resilience for Urban Sustainability: Concepts, Dimensions, and Perspectives. Sustainability 2022, 14, 2481. [Google Scholar] [CrossRef]
- Becker, H.; Theis, K. Sustainable Development in Germany—Indicator Report 2016; Federal Statistical Office: Wiesbaden, Germany, 2016; Available online: https://www.destatis.de/EN/Themes/Society-Environment/Sustainable-Development-Indicators/Publications/Downloads/indicator-report-2016.html (accessed on 1 July 2019).
- Fiksel, J.; Eason, T.; Frederickson, H. A Framework for Sustainability Indicators at EPA. 2012. Available online: https://www.epa.gov/sustainability/report-framework-sustainability-indicators-epa (accessed on 30 February 2021).
- Gonzalo, M.B.; Bovea, M.D.; José Ruá, M. Sustainability on the urban scale: Proposal of a structure of indicators for the Spanish context. Environ. Impact Assess. Rev. 2015, 53, 16–30. [Google Scholar] [CrossRef] [Green Version]
- Hong, S.; Kweon, I.; Lee, B.-H.; Kim, H. Indicators and Assessment System for Sustainability of Municipalities: A Case Study of South Korea’s Assessment of Sustainability of Cities (ASC). Sustainability 2019, 11, 6611. [Google Scholar] [CrossRef] [Green Version]
- Hoornweg, D.; Ruiz Nunez, F.; Freire, M.; Palugyai, N.; Villaveces, M.; Herrera, E.W. City Indicators: Now to Nanjing; Policy Research Working Papers, No. 4114; World Bank: Washington, DC, USA, 2007. [Google Scholar] [CrossRef] [Green Version]
- Hosseinzadeh, S.R.; Beigi, R.K.; Eastgoldi, M.; Aldini, R.S. An assessment of environmental Sustainability in urban areas using multi-criteria decision-making method—Linear assignment (Case Study: City of Bandar Turkman). J. Stud. Hum. Settl. Plan. 2011, 6, 31–51. [Google Scholar]
- Ibrahim, F.I.; Omar, D.; Mohamad, N.H. Theoretical Review on Sustainable City Indicators in Malaysia. Procedia Soc. Behav. Sci. 2015, 202, 322–329. [Google Scholar] [CrossRef] [Green Version]
- Michael, F.L.; Zainon Noor, Z.; Figueroa, M.J. Review of urban sustainability indicators assessment—Case study between Asian countries. J. Habitat Int. 2014, 44, 491–500. [Google Scholar] [CrossRef]
- Ministry of Urban Development, Housing and Construction. National Report on Housing & Sustainable Urban Development; Ministry of Urban Development, Housing and Construction: Addis Ababa, Ethiopia, 2014. [Google Scholar]
- Robati, M.; Monavari, S.M.; Majedi, H. Urban environment quality assessment by using composite index model. Environ. Prog. Sustain. Energy 2015, 34, 1473–1480. [Google Scholar] [CrossRef]
- Zangishehei, S.; Khosravi, E.; Moradi, T. Studying the Sustainability of Urban Neighborhoods (Case Example: Javanshir Neighborhood of Kermanshah). In Proceedings of the Second International Conference on Civil Engineering, Architecture and Urban Design Art and Urban Design, Bangkok, Thailand, 31 August 2017; Civilica: Tehran, Iran, 2017; pp. 175–192. [Google Scholar]
- Marsoumi, N.; Khazaei, K. Spatial distribution of urban services and its role in the sustainable development of the city, a case study of the mother city of Tehran. J. Urban Plan. Res. 2013, 18, 21–40. [Google Scholar]
- Meshkini, A.; Borhani, K.; Shabanzadeh Namini, R. Spatial analysis Measuring urban social Sustainability (study: 22 districts of Tehran). Int. Q. Iran. Geogr. Soc. 2013, 39, 186–211. [Google Scholar]
- Movahed, A.; Ebadi, M. The role of people’s participation in the development of localities (case study: Davodieh neighborhood, District 3, Tehran). Sustain. City Mag. 2014, 2, 17–32. [Google Scholar]
- Tehran Municipality Studies Center. The Atlas of Urban Sustainability Assessment of Tehran Metropolis; Tehran Municipality Information and Communication Technology Organization: Tehran, Iran, 2017. [Google Scholar]
- Arcadis. Citizen Centric Cities: 2016 Arcadis Sustainable Cities Index; Arcadis: Amsterdam, The Netherlands, 2016. [Google Scholar]
- Farhoudi, R.; Rahmani, M.; Timouri, I. Measuring the sustainable development of urban neighborhoods using fuzzy logic and geographic information system (case study: District 17 of Tehran Municipality). Hum. Geogr. Res. 2011, 43, 89–110. [Google Scholar]
- Van Dijken, K.; Dorenbos, R.; Kamphof, R. The Reference Framework for Sustainable Cities (RFSC): Testing Results and Recommendations; Nicis Institute: Den Haag, The Netherlands, 2012. [Google Scholar]
- EIU. The Green City Index: A Summary of the Green City Index Research Series; EIU: Munich, Germany, 2012. [Google Scholar]
- Hass, J.; Brunvoll, F.; Hoie, H. Overview of Sustainable Development Indicators Used by National and International Agencies; OECD Statistics Working Papers, 2002/02; OECD Publishing: Paris, France, 2002. [Google Scholar]
- Li, C.; Li, J. Assessing Urban Sustainability Using a Multi-Scale, Theme-Based Indicator Framework: A Case Study of the Yangtze River Delta Region, China. Sustainability 2017, 9, 2072. [Google Scholar] [CrossRef] [Green Version]
- Mega, V.; Pedersen, J. Urban Sustainability Indicators; Office for Official Publications of the European Communities: Luxembourg, 1998. [Google Scholar]
- Yan, Y.; Wang, C.; Quan, Y.; Wu, G.; Zhao, Z. Urban sustainable development efficiency towards the balance between nature and human well-being: Connotation, measurement, and assessment. J. Clean. Prod. 2018, 178, 67–75. [Google Scholar] [CrossRef]
- Mahmoudi, B.; Faqihi, J.; Makhdoom, M.; Awatafi Hammat, M. Evaluation of sustainability process at local levels based on IUCN approach, case study: Manj traditional area in Lordegan city. J. Nat. Environ. 2015, 68, 653–663. [Google Scholar] [CrossRef]
- United Nations. Commission on Sustainable Development Report on the Fifth Session; United Nations: New York, NY, USA, 1997.
- Jain, D.; Tiwari, G. Sustainable mobility indicators for Indian cities: Selection methodology and application. J. Ecol. Indic. 2017, 79, 310–322. [Google Scholar] [CrossRef]
- Urban China Initiative. The China Urban Sustainability Index 2014 Report; Urban China Initiative: Beijing, China, 2014. [Google Scholar]
- City of Zurich Urban Development, Department of the Mayor. Sustainability Monitoring in the City of Zurich. Startseite Portal der Stadt Zürich—Stadt Zürich. 2016. Available online: https://www.stadt-zuerich.ch/ (accessed on 10 August 2019).
- Sasanpour, F.; Movahed, A.; Mostafavi Saheb, S.; Yousefi Fshky, M. Evaluating sustainability urban neighborhoods in the neighborhoods of SAQEZ City. Geogr. Urban Plan. Res. GUPR 2014, 2, 73–94. [Google Scholar] [CrossRef]
- Kazemian, G.; Meshkini, A.; Bigleri, S. Performance evaluation Urban management in the Sustainability of two neighborhood of the 4th district of Tehran (Mohlehi Magdieh, Shams). Abadou Kalad. J. Appl. Res. Geogr. Sci. 2011, 21, 7. [Google Scholar]
- Science for Environment Policy. Indicators for Sustainable Cities. In-depth Report 12. Produced for the European Commission DG Environment by the Science Communication Unit, UWE, Bristol. 2018. Available online: http://ec.europa.eu/science-environment-policy (accessed on 26 November 2022).
- Azani, M.; Mokhtari Melkabadi, R.; Moulai, S. Survey of sustainable development indicators of places in the 13th region of Isfahan. Res. J. Spat. Plan. Geogr. 2013, 2, 119–142. [Google Scholar]
- National Council for Sustainable Development (NCSD). The Evaluation Results of Sustainable Development Indicators for 2015 Report; National Council for Sustainable Development (NCSD): Taiwan, China, 2015. [Google Scholar]
- Phillis, Y.A.; Kouikoglou, V.S.; Verdugo, C. Urban sustainability assessment and ranking of cities. J. Comput. Environ. Urban Syst. 2017, 64, 254–265. [Google Scholar] [CrossRef]
- Ngina Ndeke, E. A Critical Review of the Development of Sustainability Indicators for the City of Cape Town: A Focus on Environmental and Socio-Economic Sustainability. Master’s Thesis, Stellenbosch University, Stellenbosch, South Africa, 2011. [Google Scholar]
- Van Leeuwen, C.J.; Frijns, J.; van Wezel, A.; van de Ven, F.H.M. City Blueprints: 24 Indicators to Assess the Sustainability of the Urban Water Cycle. Water Resour. Manag. 2012, 26, 2177–2197. [Google Scholar] [CrossRef]
- Watson, J. European Green City Index; Siemens AG: Munich, Germany, 2009. [Google Scholar]
- Xu, C.; Wang, S.; Zhou, Y.; Wang, L.; Liu, W. A Comprehensive Quantitative Evaluation of New Sustainable Urbanization Level in 20 Chinese Urban Agglomerations. Sustainaility 2016, 8, 91. [Google Scholar] [CrossRef] [Green Version]
- Saraei, M.H.; Lotfi, S.; Ebrahimi, S. Evaluation and measurement of the level of Sustainability of the development of the neighborhoods of Babolsar city. J. Urban Plan. Res. 2010, 2, 37. [Google Scholar]
- Azami Amoli, J. Measuring the level of Sustainability of urban neighborhoods based on sustainable development indicators (Study example: Tandest and Siahteli neighborhood of Babul city). Geogr. Mag. 2017, 52, 367. [Google Scholar]
- Centre of Regional Science (SRF)—Vienna UT. Smart Cities: Ranking of European Medium-Sized Cities; Centre of Regional Science (SRF)—Vienna UT: Vienna, Austria, 2007. [Google Scholar]
- Rahm Bezi, K.; Musazadeh, H.; Hosseinnejad, M. Measuring the economic and social Sustainability of urban neighborhoods using the multi-criteria decision-making technique (ahp), a case study: The urban logic of Gorgan. Amash Shahri 2017, 25, 105. [Google Scholar]
- Fenni, Z.; Sarmi, F. The approach of sustainable neighborhood development in the metropolis of Tehran, the case of: Bahar neighborhood of region 7. 9 Q. Geogr. Dev. 2013, 11, 35–56. [Google Scholar] [CrossRef]
- Robati, M.; Rezaei, F. Sustainability Assessment of Indexes and Model; Persian, Iranian Student Booking Agency Publisher: Tehran, Iran, 2021. [Google Scholar]
- Samadi, A.; Oji Mehr, S. Calculating the level of sustainable urban development using the SAFE hierarchical fuzzy inference system, a case study of several selected Iranian cities. Urban Manag. 2011, 9, 167–182. [Google Scholar]
- Ahadnejad Reveshti, M.; Mohammadi Hamidi, S.; Sobhani, N. Measurement Urban neighborhoods with an emphasis on sustainable urban sustainability approach (SUN) (Case Study: Miandoab City). Geogr. Reg. Plan. 2017, 7, 77–94. [Google Scholar]
- Khasali Babli, M. Sustainable Development of Neighborhoods, Case Study: Haft Chenar Neighborhood of Tehran. In Proceedings of the 4th National Conference on Architecture and Urban Planning, Tehran, Iran, 5 July 2016. [Google Scholar]
- Abdullahi, A. Evaluation of urban Sustainability using ANP, SAW, TOPSIS techniques (Case study: Kerman city). Reg. Plan. 2017, 7, 107–120. [Google Scholar]
- Forum for the Future. Sustainable Cities Index: Ranking the Largest 20 British Cities; Yumpu: Diepoldsau, Switzerland, 2010. [Google Scholar]
- Australian Conservation Foundation (ACF). Sustainable Cities Index: Ranking Australia’s 20 Largest Cities in 2010; ACF: Melbourne, Australia, 2010. [Google Scholar]
- Gong, W.; Lyu, H. UNIDO—United Nations Industrial Development Organization. 2018. Available online: https://www.unido.org/sites/default/files/files/201802/BRIDGE%20for%20Cities_Issue%20Paper_2.pdf (accessed on 20 September 2021).
- Esmailzadeh, H.; Kanuni, R.; Heydari, M.; Yarmoradi, K. Evaluation of the level of Sustainability of Tajrish neighborhood of Tehran metropolis. Sustain. City 2015, 3, 127. [Google Scholar]
- Alfaro-Navarro, J.-L.; López-Ruiz, V.-R.; Peña, D.N. A New Sustainability City Index Based on Intellectual Capital Approach. Sustainability 2017, 9, 860. [Google Scholar] [CrossRef]
- Li, X.; Li, X.; Woetzel, J.; Zhang, G.; Zhang, Y. The China Urban Sustainability Index 2013; Urban China Initiative: Beijing, China, 2014. [Google Scholar]
- Shannon, C.E. A mathematical theory of communication. Bell Syst. Tech. J. 1948, 27, 379–423. [Google Scholar] [CrossRef] [Green Version]
- Nazmfar, H.; Saeideh, A.; Feizizadeh, B.; Eshghi, A. An integrated approach of the analytic network process and barometer model mapping of human settlement sustainability in Ardebil Province, Iran. Appl. Geomat. 2022, 14, 237–252. [Google Scholar] [CrossRef]


| Urban Area | Population | Area (km2) |
|---|---|---|
| 1 | 59,725 | 3,520,807 |
| 2 | 89,606 | 3,394,948 |
| 3 | 107,822 | 11,650,524 |
| 4 | 76,664 | 3,306,257 |
| 5 | 124,634 | 4,028,956 |
| 6 | 182,898 | 5,197,350 |
| 7 | 116,508 | 12,226,016 |
| 8 | 62,361 | 8,463,356 |
| 9 | 97,043 | 9,589,067 |
| Main Dimensions | Categories | Components | Basic Indicators | Normalization Values of the 9 Regions | ||||||||
|---|---|---|---|---|---|---|---|---|---|---|---|---|
| 1 | 2 | 3 | 4 | 5 | 6 | 7 | 8 | 9 | ||||
| Ecosystem well-being (E1) | Environmental (E1,1) | Land use capability (E1,1,1) | 1. Land use planning per capita % | 0.020 | 0 | 0.647 | 0.038 | 0.585 | 1 | 0.652 | 0.223 | 0.085 |
| 2. Urban decay ratio % | 0.507 | 1 | 0.072 | 0.820 | 0.527 | 0.107 | 0 | 0.331 | 0.265 | |||
| Health and environmental quality (E1,1,2) | 3. Number of parks and green spaces collection | 0.428 | 1 | 0.586 | 0.413 | 0.172 | 0.551 | 0.310 | 0.310 | 0 | ||
| 4. Parks and green space area % | 0.519 | 0.589 | 0.461 | 0.165 | 0.102 | 0.298 | 1 | 0 | 0.0008 | |||
| 5. Number of plant species | 1 | 0.666 | 0.333 | 0 | 0.666 | 0.333 | 0.666 | 0.333 | 0.333 | |||
| 6. Air pollution % | 0.459 | 0 | 1 | 0.108 | 0.648 | 0.459 | 0.432 | 0.054 | 0.495 | |||
| 7. Water pollution% | 0.233 | 0.077 | 1 | 0 | 0.864 | 0.330 | 0.572 | 0.019 | 0.203 | |||
| 8. Noise pollution% | 0 | 0.095 | 0.047 | 0.428 | 0.428 | 1 | 0.428 | 0.190 | 0.190 | |||
| 9. Soil pollution % | 1 | 0.952 | 0.142 | 0.333 | 0.190 | 0.666 | 0 | 0.761 | 0.190 | |||
| 10. Satisfaction rate with collection of garbage | 0.75 | 1 | 0.75 | 0.75 | 0.5 | 0.5 | 0.5 | 0 | 0.25 | |||
| 11. Street and urban space cleaning | 0.333 | 1 | 1 | 1 | 0.666 | 0.666 | 0.666 | 0 | 0.666 | |||
| 12. Number of recycling pat | 0 | 1 | 0.75 | 0.5 | 0.5 | 0 | 0.5 | 0.25 | 0 | |||
| 13. Waste generation % | 0 | 0.242 | 0.390 | 0.108 | 0.526 | 1 | 0.460 | 0.020 | 0.302 | |||
| Energy consumption and transportation (E1,1,3) | 14. Water consumption % | 0.0024 | 0.091 | 0 | 0.328 | 0.004 | 0.082 | 0.002 | 1 | 0.0028 | ||
| 15. Power consumption % | 0.692 | 0.832 | 0.289 | 0 | 0.117 | 0.272 | 0.688 | 1 | 0.030 | |||
| 16. Natural gas consumption % | 0.006 | 0 | 0.313 | 1 | 0.202 | 0.470 | 0.127 | 0.184 | 0.500 | |||
| 17. Mean time to reach the bus stop (minutes) | 1 | 0.148 | 0.851 | 0.185 | 0.296 | 0.037 | 0 | 0.666 | 0.333 | |||
| 18. Mean time to reach the subway station (minutes) | 0.166 | 0.277 | 0.444 | 0 | 0.055 | 0.305 | 0.361 | 1 | 0.916 | |||
| Human well-being (H1) | Socioeconomic (H1,1) | Safety and security (H1,1,1) | 19. Security rate for women and children | 0.75 | 1 | 0.75 | 0.75 | 0 | 0.5 | 0.5 | 0.5 | 0.75 |
| 20. Feeling of security and social peace | 0.75 | 1 | 0.5 | 0.5 | 0 | 0.75 | 0.5 | 0.5 | 0.75 | |||
| Demographic characteristics and social welfare (H1,1,2) | 21.Population density % | 0 | 0 | 0.5 | 0 | 0.5 | 1 | 0.5 | 0 | 0.5 | ||
| 22.Population growth rate % | 0.144 | 0.837 | 0 | 0.454 | 0.725 | 0.537 | 0.240 | 0.685 | 1 | |||
| 23.Age variation% | 0.751 | 0.827 | 0 | 0.650 | 0.171 | 0.771 | 0.628 | 0.785 | 1 | |||
| 24. Family size | 0 | 0 | 0.333 | 0.333 | 0 | 0.666 | 0.666 | 1 | 0.666 | |||
| 25. Sex ratio % | 0 | 0.2 | 0.2 | 0.2 | 0.1 | 1 | 0.9 | 1 | 0.6 | |||
| 26.Aging population % | 0.906 | 1 | 0.195 | 0.565 | 0.634 | 0 | 0.218 | 0.233 | 0.562 | |||
| 27. Rate of mortality per 1000 people | 0 | 0.242 | 0.391 | 0.1373 | 0.5273 | 1 | 0.4608 | 0.0209 | 0.3028 | |||
| 28. Divorce rate per 1000 people | 0.931 | 0.819 | 0.472 | 0.820 | 1 | 0.165 | 0.121 | 0 | 0.411 | |||
| 29. Immigration rate per 1000 people | 0 | 0.121 | 0.390 | 0.1371 | 0.5276 | 1 | 0.4609 | 0.0206 | 0.3028 | |||
| 30. Dependency burden or rate | 0.302 | 0.046 | 0.486 | 0.254 | 0.337 | 0 | 0.018 | 1 | 0.715 | |||
| 31. Satisfaction with the amount of income | 0.25 | 1 | 0.75 | 0.25 | 0.25 | 0 | 0.75 | 0.75 | 0 | |||
| 32. Employment rates | 0.359 | 0.902 | 1 | 0.770 | 0 | 0.953 | 0.928 | 0.252 | 0.148 | |||
| 33. Quality of life | 0 | 1 | 0.75 | 0 | 0 | 0.5 | 0 | 0.25 | 0.25 | |||
| 34. Average cost of buying one square metre of a house | 0.637 | 0.658 | 1 | 0.410 | 0.400 | 0.008 | 0 | 0.252 | 0.197 | |||
| 35. Employment rate per 10,000 people | 0.341 | 0.687 | 0.076 | 0.555 | 0.805 | 1 | 0.104 | 0 | 0.095 | |||
| 36. Percentage of female-headed households | 0 | 0.307 | 0.384 | 0.153 | 0.538 | 1 | 0.461 | 0 | 0.307 | |||
| 37. Ratio of the population to the people with higher education | 0.410 | 0.330 | 1 | 0.174 | 0.764 | 0.584 | 0.660 | 0 | 0.421 | |||
| 38. Literacy rate | 0.896 | 0.778 | 1 | 0.657 | 0.874 | 0 | 0.070 | 0.807 | 0.756 | |||
| Infrastructure and urban services (H1,1,3) | 39. Number of fire stations | 0.5 | 0.5 | 1 | 0 | 0.5 | 0.5 | 1 | 0.5 | 0.5 | ||
| 40. Number of banks | 0.379 | 0.172 | 1 | 0.310 | 0.655 | 0.344 | 0.206 | 0 | 0.137 | |||
| 41. Number of petrol stations | 0.5 | 0.5 | 1 | 0.5 | 0 | 0 | 0.5 | 1 | 0.5 | |||
| 42. Number of hospitals | 1 | 0 | 1 | 0 | 1 | 0 | 0.5 | 0.5 | 0 | |||
| 43. Number of health centres | 0.052 | 0.210 | 0.263 | 0 | 0.157 | 0.421 | 0.368 | 1 | 0.263 | |||
| 44. Access to fire stations (minutes) | 0.777 | 0.555 | 1 | 0.444 | 1 | 0 | 0.111 | 0.111 | 0 | |||
| 45. Access to police stations (minutes) | 0 | 0 | 0.25 | 0.125 | 0.125 | 0 | 1 | 0.875 | 0.25 | |||
| 46. Access to hospitals (minutes) | 0.5 | 1 | 0.5 | 0.125 | 0 | 0.75 | 0.75 | 0.375 | 0.75 | |||
| 47. Access to health centers (minutes) | 0.428 | 1 | 0.527 | 0 | 0.142 | 0 | 0.285 | 0.142 | 0 | |||
| Cultural (H1,2) | Cultural places (H1,2.,1) | 48. Number of cultural corporations | 0 | 0 | 0 | 0 | 0 | 1 | 1 | 0 | 0 | |
| 49. Number of cinemas | 0 | 0 | 1 | 0 | 0 | 1 | 1 | 0 | 1 | |||
| 50. Number of libraries | 0.25 | 1 | 0.75 | 0 | 0 | 0 | 0.5 | 0.5 | 0.25 | |||
| 51. Number of tourist attractions | 0 | 0 | 0.5 | 0 | 0 | 0 | 1 | 1 | 1 | |||
| Religious places (H1,2.,2) | 52. Number of religious centers | 0 | 0.5 | 0 | 0.1 | 0 | 0.4 | 1 | 0.6 | 0.3 | ||
| 53. Number of mosques | 0.2277 | 0.2273 | 0.090 | 0 | 0.090 | 1 | 0.545 | 0.090 | 0.2723 | |||
| E1.1 | |
|---|---|
| E1,1,1 | |
| Indicators | Source |
| Land use planning per capita % Urban decay ratio% | [1,41,44,45,46,47,48,49,50,51,52,53,54] [55,56,57,58] |
| E1,1,2 | |
| Number of parks and green spaces collection Parks and green space area % Number of plant species | [8,39,51,57,59,60,61] [8,39,46,55,62,63,64,65,66] [63,67,68] |
| Air pollution % Water pollution% Noise pollution% | [1,3,37,38,39,40,42,63,66,69,70] [1,4,39,40,41,59,63] [9,39,41,57,63,69,71,72] |
| Soil pollution % Satisfaction rate with garbage collection Street and urban space cleaning Number of recycling pat Waste generation % | [40,41,45,63,67] [39,41,50,57,58,72,73,74] [57,58,72,73,75] [53,58,72,73] [3,8,41,63,76,77] |
| E1,1,3 | |
| Water consumption % Power consumption % Natural gas consumption % | [3,38,39,41,46,50,51,59,63,66,70,78,79,80,81] [3,46,49,50,62,63,64,70,77,78] [4,39,51,63,64,81] |
| Mean time to reach the bus stop (minutes) Mean time to reach the subway station (minutes) | [1,37,38,39,41,56,60,63] [3,38,41,46,63,82] |
| H1,1 | |
| H1,1,1 | |
| Security rate for women and children Feeling of security and social peace | [41,57,72,73,83,84,85] [9,42,54,63,72,75,86,87] |
| H1,1,2 | |
| Population density % Population growth rate % Age variation% Family size Sex ratio % Aging population % | [3,8,39,41,63,64,72,74,77] [1,3,39,41,56,59,63,64,88] [3,58,63] [8,53,75,88] [56,58,63,82,89,90] [39,47,55,76,78] |
| Rate of mortality per 1000 people Divorce rate per 1000 people Immigration rate per 1000 people Dependency burden or rate Satisfaction with the amount of income Employment rates | [39,41,43,44,56,61,63,76,77,82,88,89] [56,58] [39,63,67,71,89,91,92] [38,41,51,59,63] [41,44,58,71,76,78] [38,39,41,44,52,59,61,63,67] |
| Quality of life Average cost of buying one square metre of a house Employment rate per 10,000 people Percentage of Female-headed households Ratio of the population to the people with higher education Literacy rate | [1,4,37,39,41,50,63,65,76,78,80,85,93,94] [37,38,47,50,59,68,69,76,83,95] [58,91] [58] [44,56,64,82,91] [8,38,41,56,60,61,63,67,68,82] |
| H1,1,3 | |
| Number of fire stations Number of banks Number of petrol stations Number of hospitals Number of health centers Access to fire stations (minutes) Access to police stations (minutes) Access to hospitals (minutes) Access to health centers (minutes) | [5,58,82] [8,58,72] [8,55,58,72,81] [8,43,52,53,63,64,77,81,88] [53,60,61,63,81] [56,58,60] [55,56,58,60] [39,41,42,43,76] [3,39,41,43,61,63,76] |
| H1,2 | |
| H1,2,1 | |
| Number of cultural corporations Number of cinemas Number of libraries Number of tourist attractions | [47,53,56,72] [14,37,72,96] [5,47,81,88,96,97] [8,39,41,49,51,94] |
| H1,2,2 | |
| Number of religious centers Number of mosques | [8,75,88] [56,63,72] |
| Sector | Range |
|---|---|
| Unsustainable | 0–0/2 |
| Almost unsustainable | 0/2–0/4 |
| Medium | 0/4–0/6 |
| Almost sustainable | 0/6–0/8 |
| Sustainable | 0/8–1 |
Publisher’s Note: MDPI stays neutral with regard to jurisdictional claims in published maps and institutional affiliations. |
© 2022 by the authors. Licensee MDPI, Basel, Switzerland. This article is an open access article distributed under the terms and conditions of the Creative Commons Attribution (CC BY) license (https://creativecommons.org/licenses/by/4.0/).
Share and Cite
Robati, M.; Rezaei, F. Applying the Sustainability Barometer Approach to Assess Urban Sustainability. Urban Sci. 2022, 6, 85. https://doi.org/10.3390/urbansci6040085
Robati M, Rezaei F. Applying the Sustainability Barometer Approach to Assess Urban Sustainability. Urban Science. 2022; 6(4):85. https://doi.org/10.3390/urbansci6040085
Chicago/Turabian StyleRobati, Maryam, and Fatemeh Rezaei. 2022. "Applying the Sustainability Barometer Approach to Assess Urban Sustainability" Urban Science 6, no. 4: 85. https://doi.org/10.3390/urbansci6040085