Article

Validity of Reference Time Intervals in Noise Indicators for Aircraft Noise Policy in Vietnam

1
Department of Architectural Design, Interdisciplinary Faculty of Science and Engineering, Shimane University, Matsue 690-8504, Japan
2
Airport Environment Improvement Foundation, Tokyo 105-0011, Japan
3
Department of Architecture, Kumamoto University, Kumamoto 860-8555, Japan
4
Kobayasi Institute of Physical Research, Tokyo 185-0022, Japan
5
Rion Co., Ltd., Tokyo 185-8533, Japan
*
Author to whom correspondence should be addressed.
Urban Sci. 2020, 4(2), 19; https://doi.org/10.3390/urbansci4020019
Submission received: 31 January 2020 / Revised: 15 April 2020 / Accepted: 16 April 2020 / Published: 20 April 2020
(This article belongs to the Collection Urban Acoustic Environments)

Abstract

:
Many decibel-based noise indicators are used in noise policy to evaluate aircraft sound in the environment. Among those, day–evening–night-weighted sound pressure level ( L den ), day–night-weighted sound pressure level ( L dn ), and nighttime average sound pressure level ( L night ) are the most widely used. However, the designation of reference time intervals (e.g., day, evening, and night) differs depending on the country’s lifestyle and culture. A dataset—extracted from socio-acoustic surveys conducted in Vietnam (2005–2019)—was analyzed to investigate temporal patterns of the Vietnamese lifestyle and changes in L den , L dn , and L night when temporal interval segmentations in these indicators were adjusted. Traffic congestion hours, go-to-bed time, and wake-up time in southern Vietnam were approximately one hour later than those in northern and central Vietnam. Further, a small-scale and Internet-based questionnaire survey on Vietnamese life rhythms was conducted to examine Vietnamese people’s daily behaviors. These data were compared with the relevant data of Japanese individuals, extracted from the Survey on Time Use and Leisure Activities of Japan. Differences in sleeping times and mealtimes were found between Japanese and Vietnamese data. We suggest an appropriate reference time interval for aircraft noise policy in Vietnam, referring to the current national and international noise standards and regulations.

1. Introduction

1.1. Study Background

The growth of aviation has enriched people’s lives by connecting people and places. However, it has led to an environmental problem—aircraft noise. As one of the world’s fastest growing economies, Vietnam is planning many new airports and implementing airport expansion to handle the country’s stressed aviation infrastructure [1]. Therefore, the impact of aircraft noise is especially serious for residents living in areas close to these new and expanded airports. However, Vietnam has no noise criteria or regulations applicable to managing the sound environment around airports, except those for general environmental noise [2]. In response to the development of air traffic and airport development in Vietnam, the establishment of an aircraft noise policy is an urgent issue.
Since 2005, we have repeatedly conducted socio-acoustic surveys in Vietnam to accumulate data for the foundation of a noise policy framework [3,4,5,6,7,8,9,10,11,12,13]. In these surveys, noise indexes such as day–evening–night-weighted sound pressure level ( L den ), day–night-weighted sound pressure level ( L dn ), and nighttime average sound pressure level ( L night 
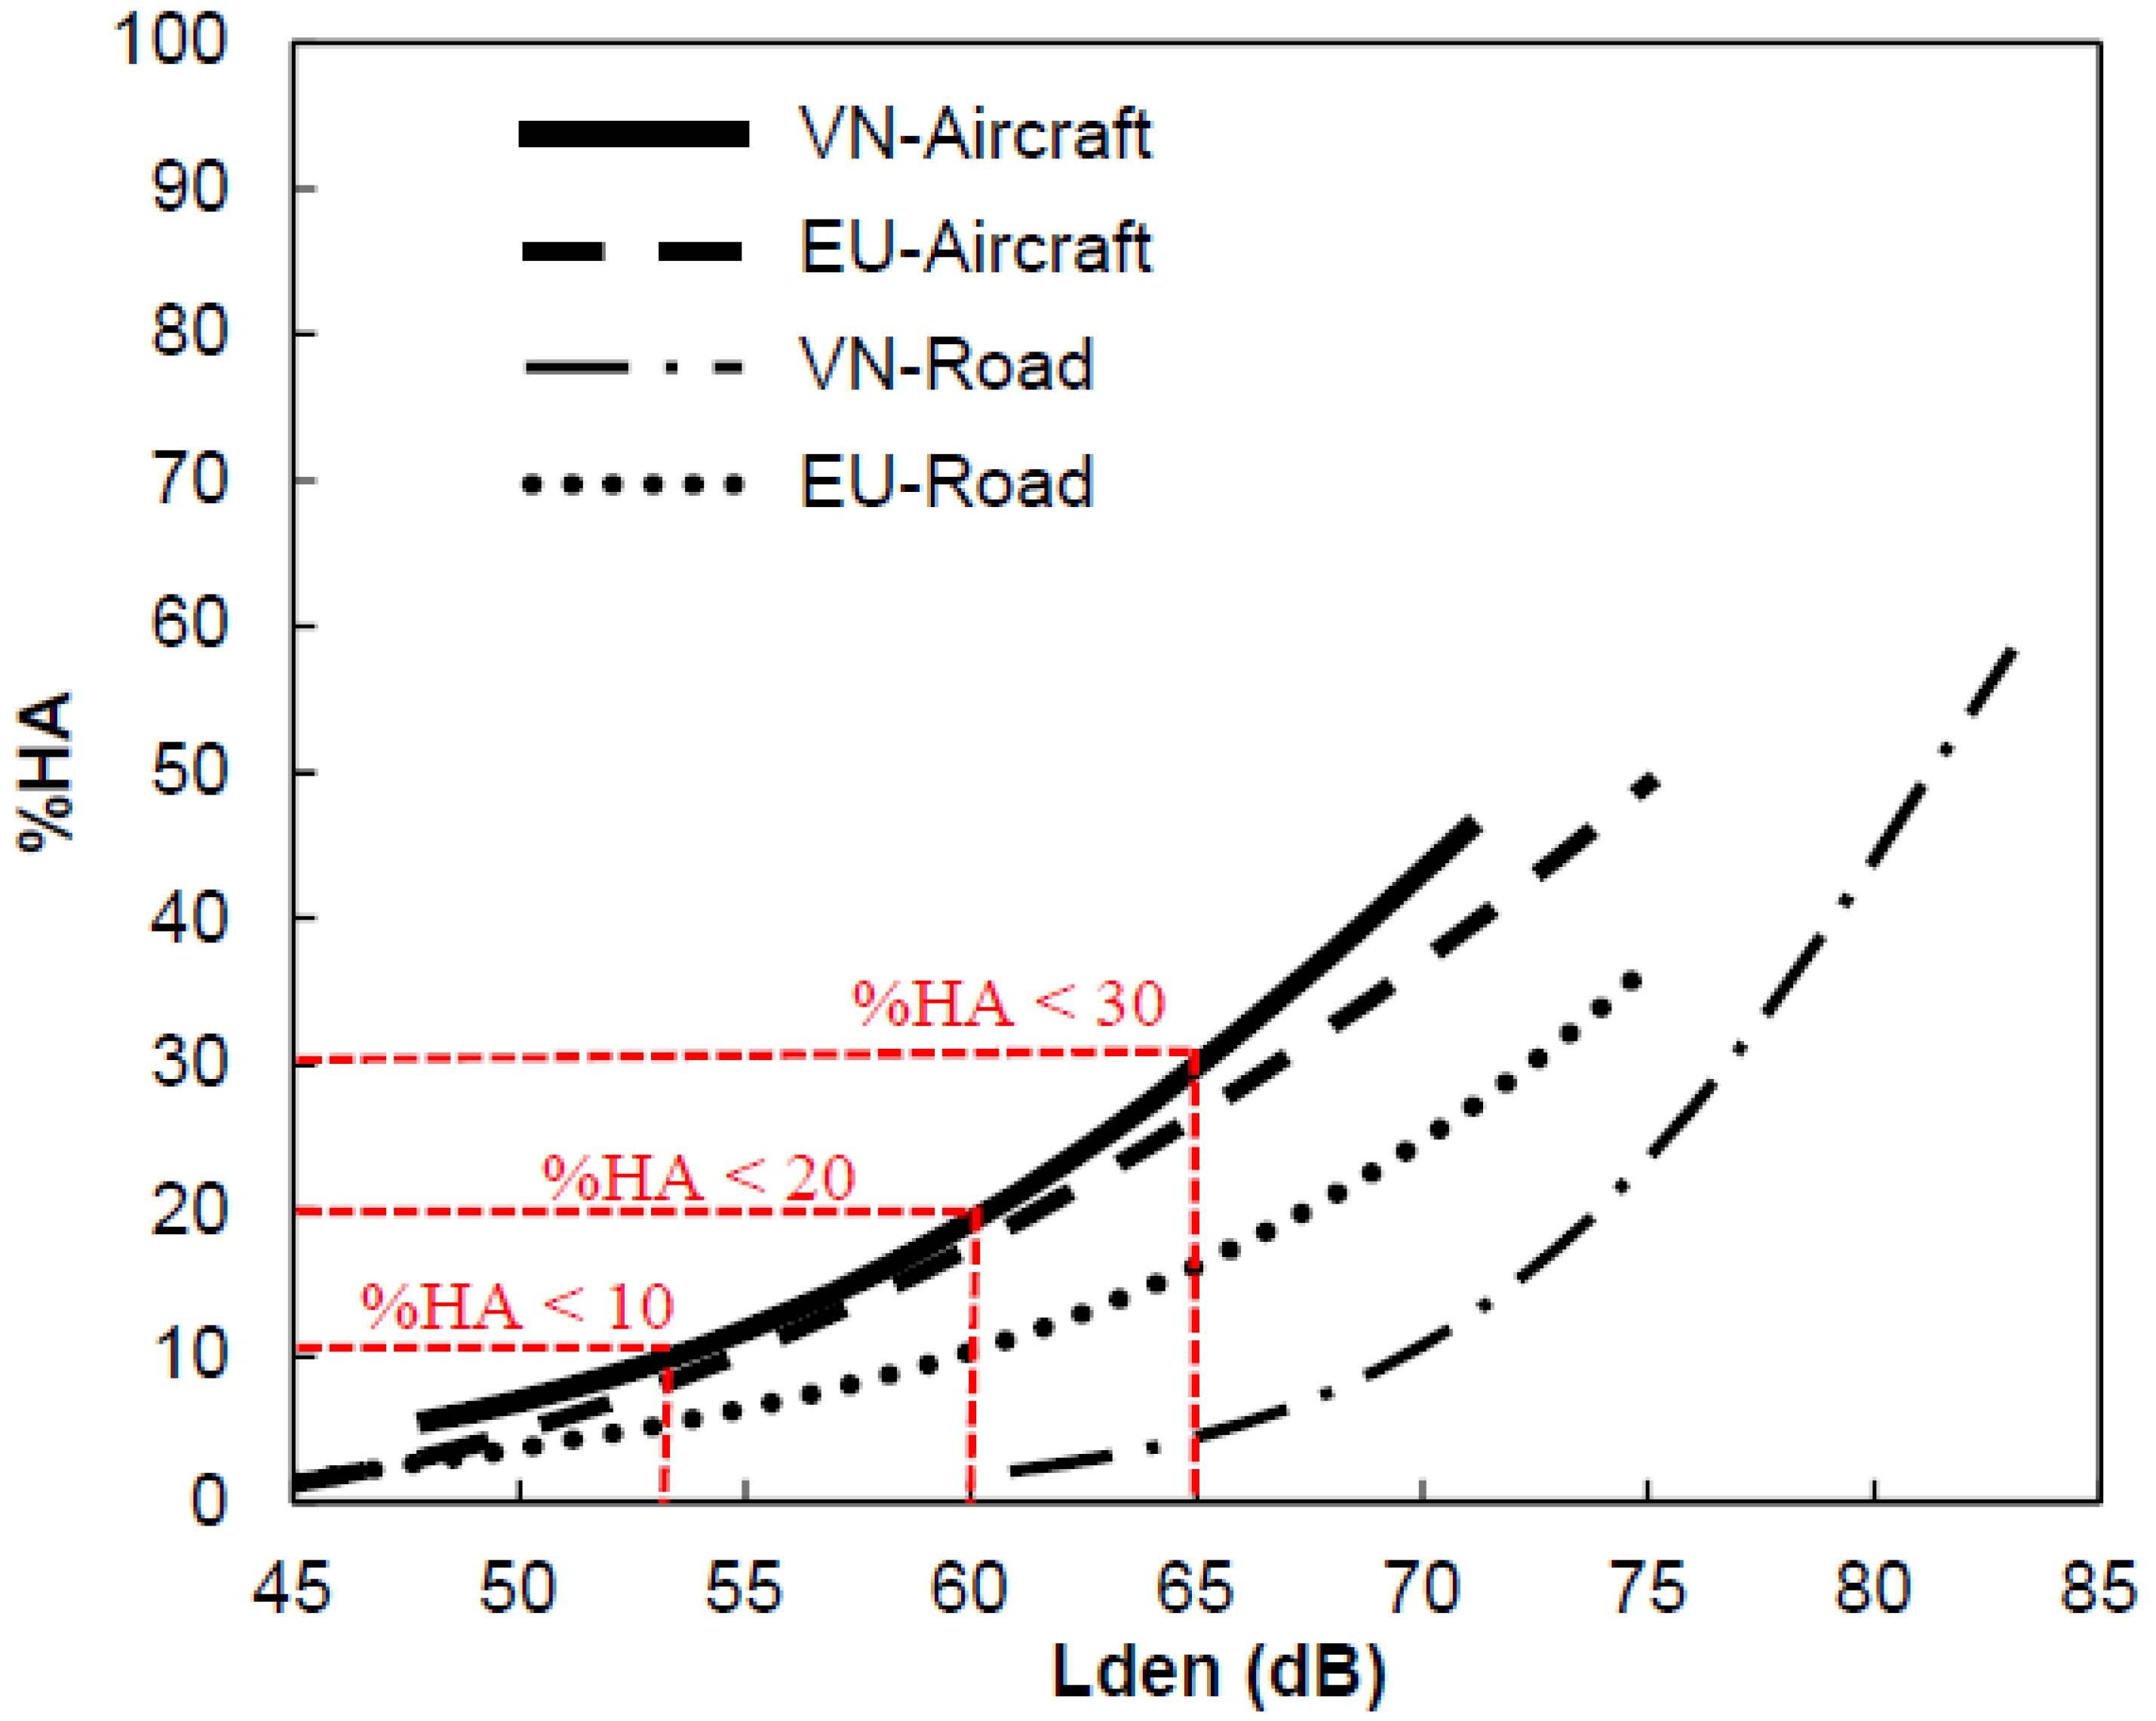
) have been used to assess the exposure–response relationships for noise annoyance and sleep effects. Therefore, representative exposure–response relationships have been established and compared with those in the European Union (EU) and Japan as a prerequisite for formulating noise policies in Vietnam.

1.2. Difference in National Choices of Reference Time Intervals Used in the Noise Indicators and the Associated Exposure Criteria between Vietnam and other Countries

Among many decibel-based noise indicators that are used in noise policy to describe aircraft sound in the environment, L den , L dn , and L night are the most widely used. For example, while some EU Member States have adopted L den and L night as noise indexes for strategic noise mapping, the L dn , calculated by dividing 24 h into two parts (day and night), is used in the United States, Denmark, The Netherlands, Norway, and so on [14]. However, the designation of reference time intervals, such as day, evening, and night, in these noise indicators differs depending on the lifestyle and culture of the country. Differences in the assessment of the reference time intervals in a day were found in the legislative and technical aspects of national approaches to control community noise.
The Technical Study Group on Noise Policies and Regulations (TSG 3) of the International Institute of Noise Control Engineering cataloged community noise regulations, guidelines, and legal standards at the national and regional levels of its member countries [15]. Germany adopted the segmentation of day (from 6:00 to 22:00) and night (from 22:00 to 6:00). Portugal adopted day (7:00 to 20:00), evening (20:00 to 23:00), and night (23:00 to 7:00) in its general regulation on noise. In guidelines issued by the Swedish Environmental Protection Agency, day (7:00 to 18:00), evening (18:00 to 22:00), and night (22:00 to 7:00) were used to define the limits on permitted noise levels. Switzerland applied day (6:00 to 22:00), early night (22:00 to 0:00), and night (5:00 to 6:00) in noise abatement ordinances for civil aircraft noise (note, 0:00–5:00 was not regulated). The final report of TSG 3 revealed that there were differences in national choices of the descriptors of exposure to noise and the associated exposure criteria. It was also emphasized that national guidelines for noise immission reflected economic and technical considerations relevant to the circumstances of each country.
Currently, in the studies on the impacts of transportation noise in Vietnam, the following two reference time intervals were adopted: (i) daytime (6:00 to 22:00) and nighttime (22:00 to 6:00) for L dn and (ii) daytime (6:00 to 18:00), evening (18:00 to 22:00), and nighttime (22:00 to 6:00.) for L den [11,12,13]. These time intervals are based on the Vietnamese Environmental Standard TCVN 5949-1998 issued in 1998 (Table 1), in which noise limits are respectively specified as upper bounds of permissible average sound pressure levels in LAeq for these three reference time intervals [16]. The values of noise limits in the daytime, evening, and nighttime are 50, 45, and 40 dB, respectively, for areas requiring exceptional quietness, while those for areas of commerce, service and production are 75, 70, and 50 dB, respectively.
In 2010, TCVN 5949:1998 was superseded by a newer national technical regulation on noise QCVN 26:2010/BTNMT, issued by the Ministry of Natural Resources and Environment (Table 2) [17]. This regulation prescribes the maximum noise limits in areas where humans live and work. This regulation aims to control all man-made noise, regardless of noise sources and their location. With this standard, “special” areas are denoted as noise-sensitive areas such as medical establishments, libraries, kindergartens, schools, churches, temples, and pagodas, while “usual” areas contain apartment buildings, detached or terraced houses, hotels, guest houses, and administrative agencies. Dividing a day into three intervals in TCVN 5949:1998 was replaced by dividing a day into two intervals in QCVN 26:2010/BTNMT. Permissible noise limits in the daytime and the nighttime in special areas are 55 and 45 dB, respectively, and usual areas are 70 and 55 dB, respectively.
Like other developed countries, Japan has established various measures to limit or reduce the number of people affected by aircraft noise, such as standards and regulations for aviation operation, airport planning, and expansion relating to noise abatement. Currently, the government and policymakers in Vietnam are cooperating with the Japanese government and experts in developing a national aircraft noise policy based on the noise policy implemented in Japan. To confirm whether Vietnam can apply similar aircraft noise standards to Japan, noise limits for general environmental noise between Vietnam and Japan were compared to clarify the differences in their sound environment requirements.
Table 3 shows a comparison of Vietnamese national technical regulation on noise QCVN 26:2010/BTNMT and Japan Environmental Quality Standard for General Noise [18]. Note here that we applied the definition of the day–night level ( L dn ) by neglecting the difference in time intervals: the nighttime in Vietnam starts 1 h earlier than Japan, resulting in the daytime interval being 1 h shorter in Vietnam. The daytime noise limit for general area in Vietnam almost equals that in an area adjacent to the road carrying arterial traffic in Japan, but the nighttime limit is 10 dB lower. Therefore, in L dn , Vietnam’s regulation is slightly stricter than Japan for the area facing a trunk road. The noise limit for special areas in Vietnam is 5 dB higher than in Japan.
Table 4 shows the noise guidelines of Japan, the “Environmental Quality Standards for Aircraft Noise,” which was ratified in 1973 and revised in 2007 [19]. In the revision, Japan adopted L den as the rating index for aircraft noise. The reference time intervals are daytime (7:00 to 19:00), evening (19:00 to 22:00), and nighttime (22:00 to 7:00), and a penalty of 5 and 10 dB applies to noise events occurring in the evening and nighttime, respectively. This determination of time intervals is based on the results of national census data and the Survey on Time Use and Leisure Activities of Japan, i.e., on the data of time intervals for various activities in the daily life of people aged ≥ 15 years [20]. The value of noise limit L den is 57 for areas exclusively for residential use, while the limit for other areas, which are not for residential use but for other activities of normal life, is 62 dB.

1.3. Study Purpose

In Vietnamese national technical regulation on noise, QCVN 26:2010/BTNMT, the segmentation of the reference time intervals is different from other countries, and if it is appropriate to be used for establishing aircraft noise standards for Vietnam has not been verified. Since there are no census data that could be referred to in defining these time intervals, data accumulated in the socio-acoustic surveys in Vietnam from 2005 to 2019 [3,4,5,6,7,8,9,10,11,12,
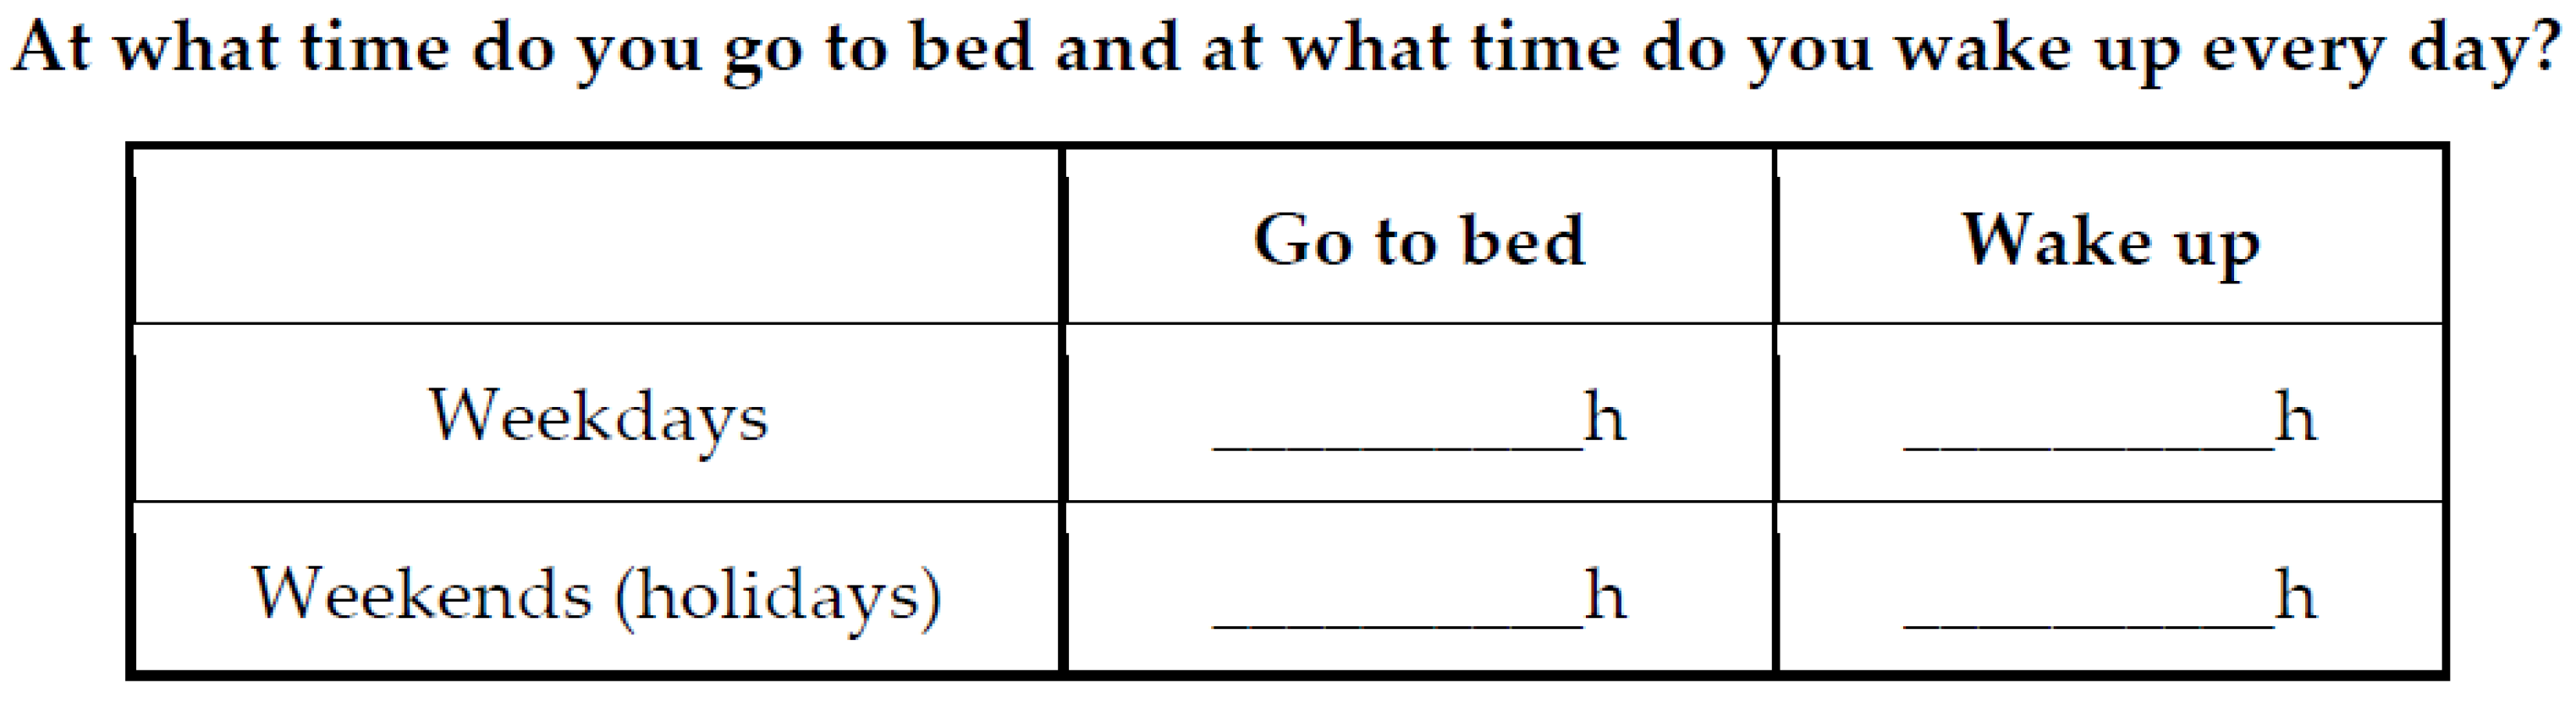
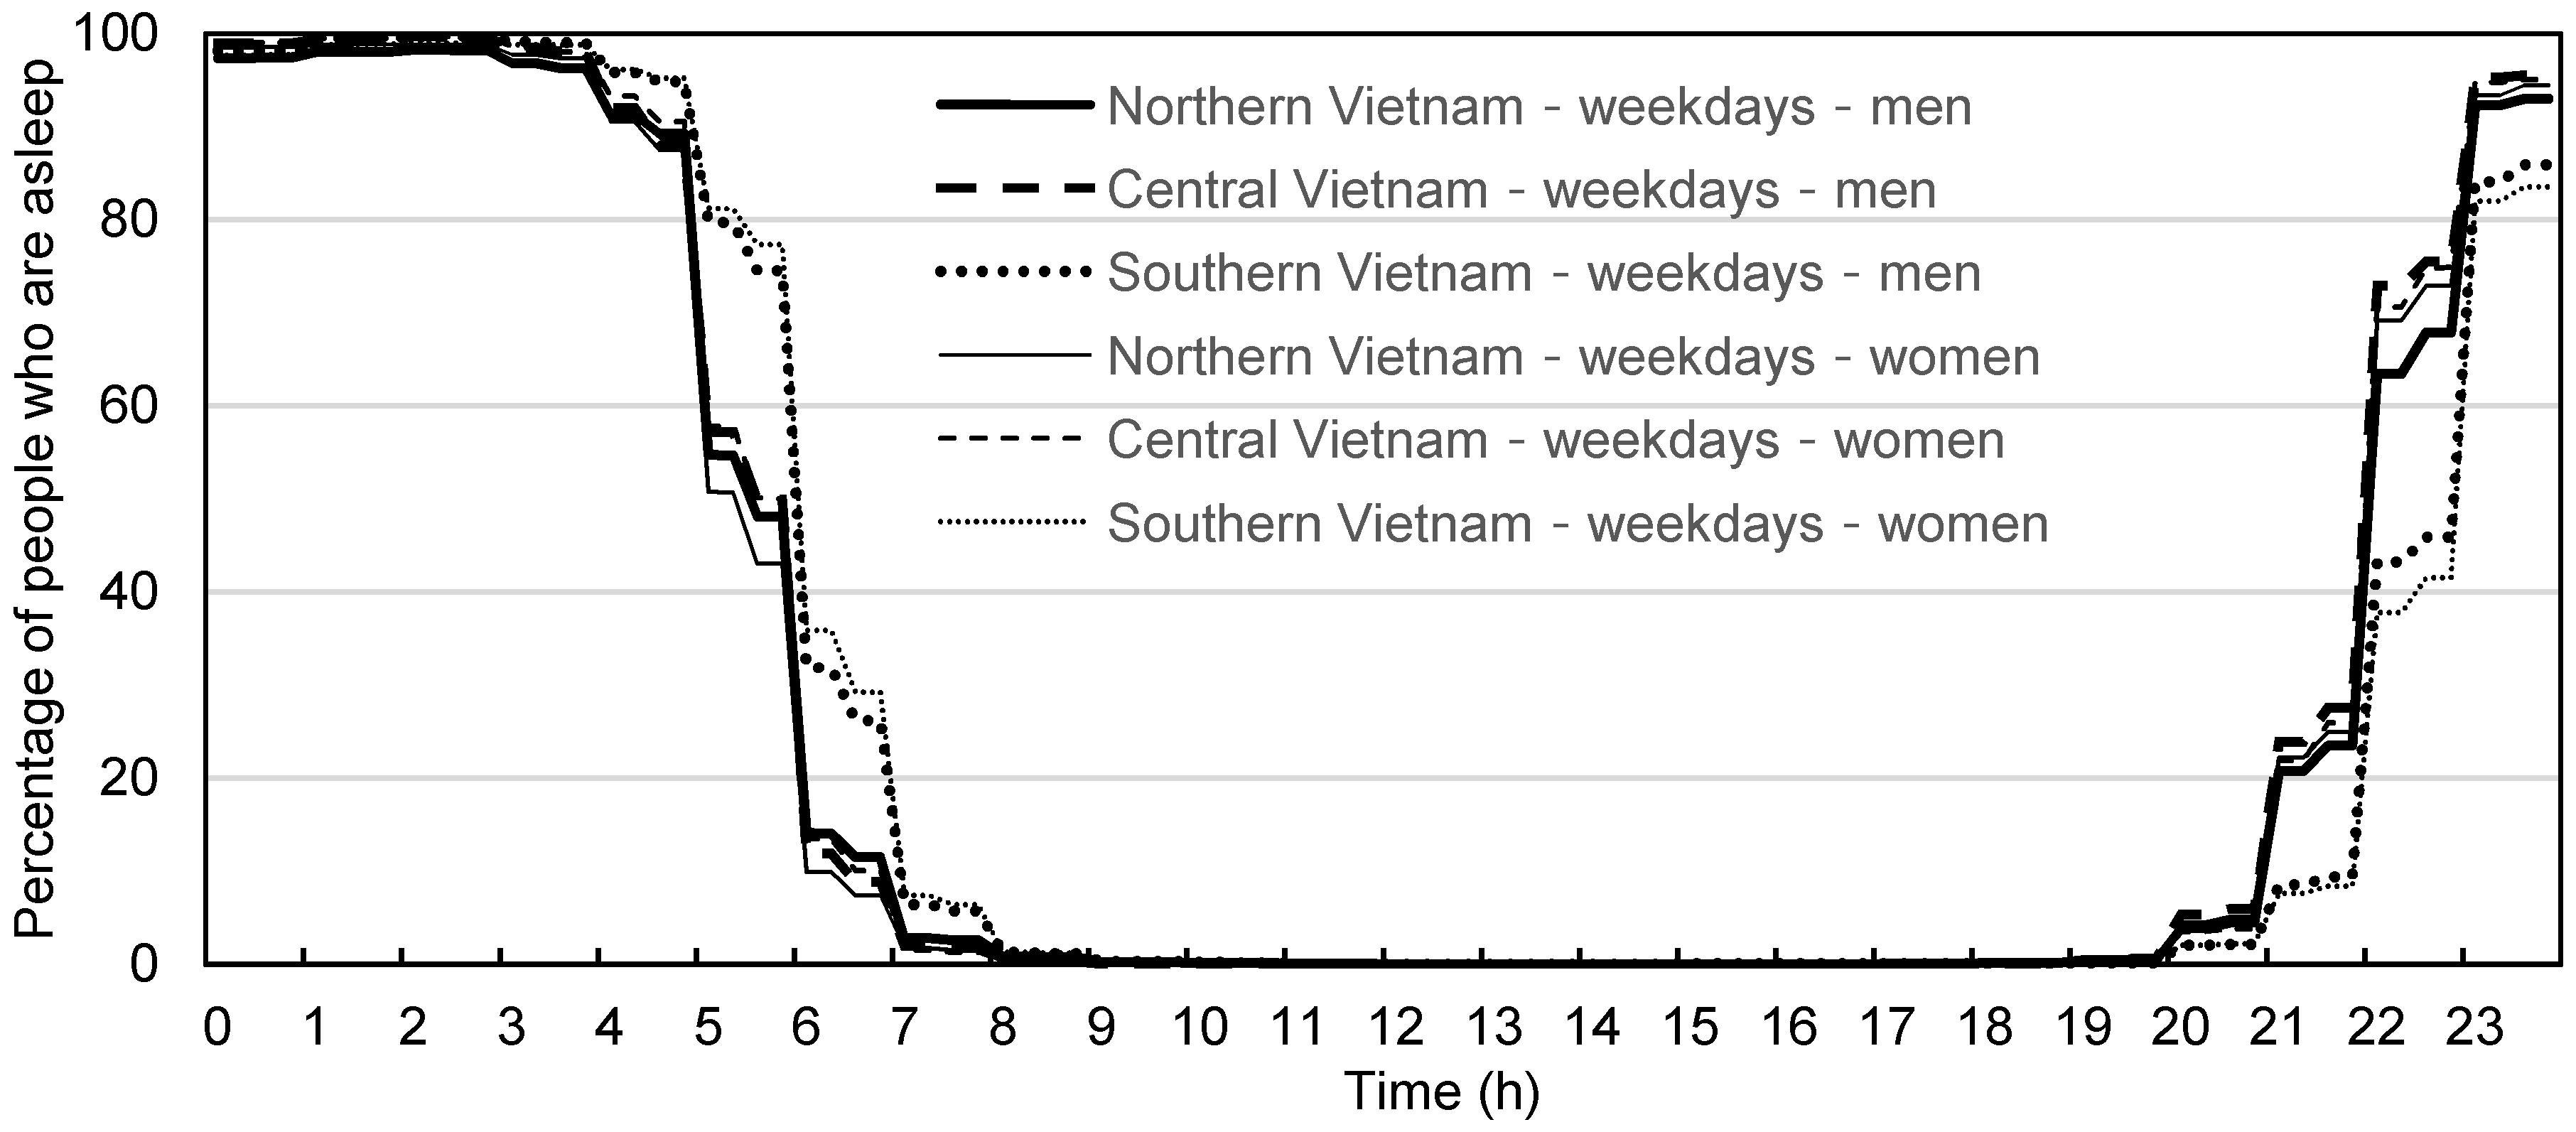
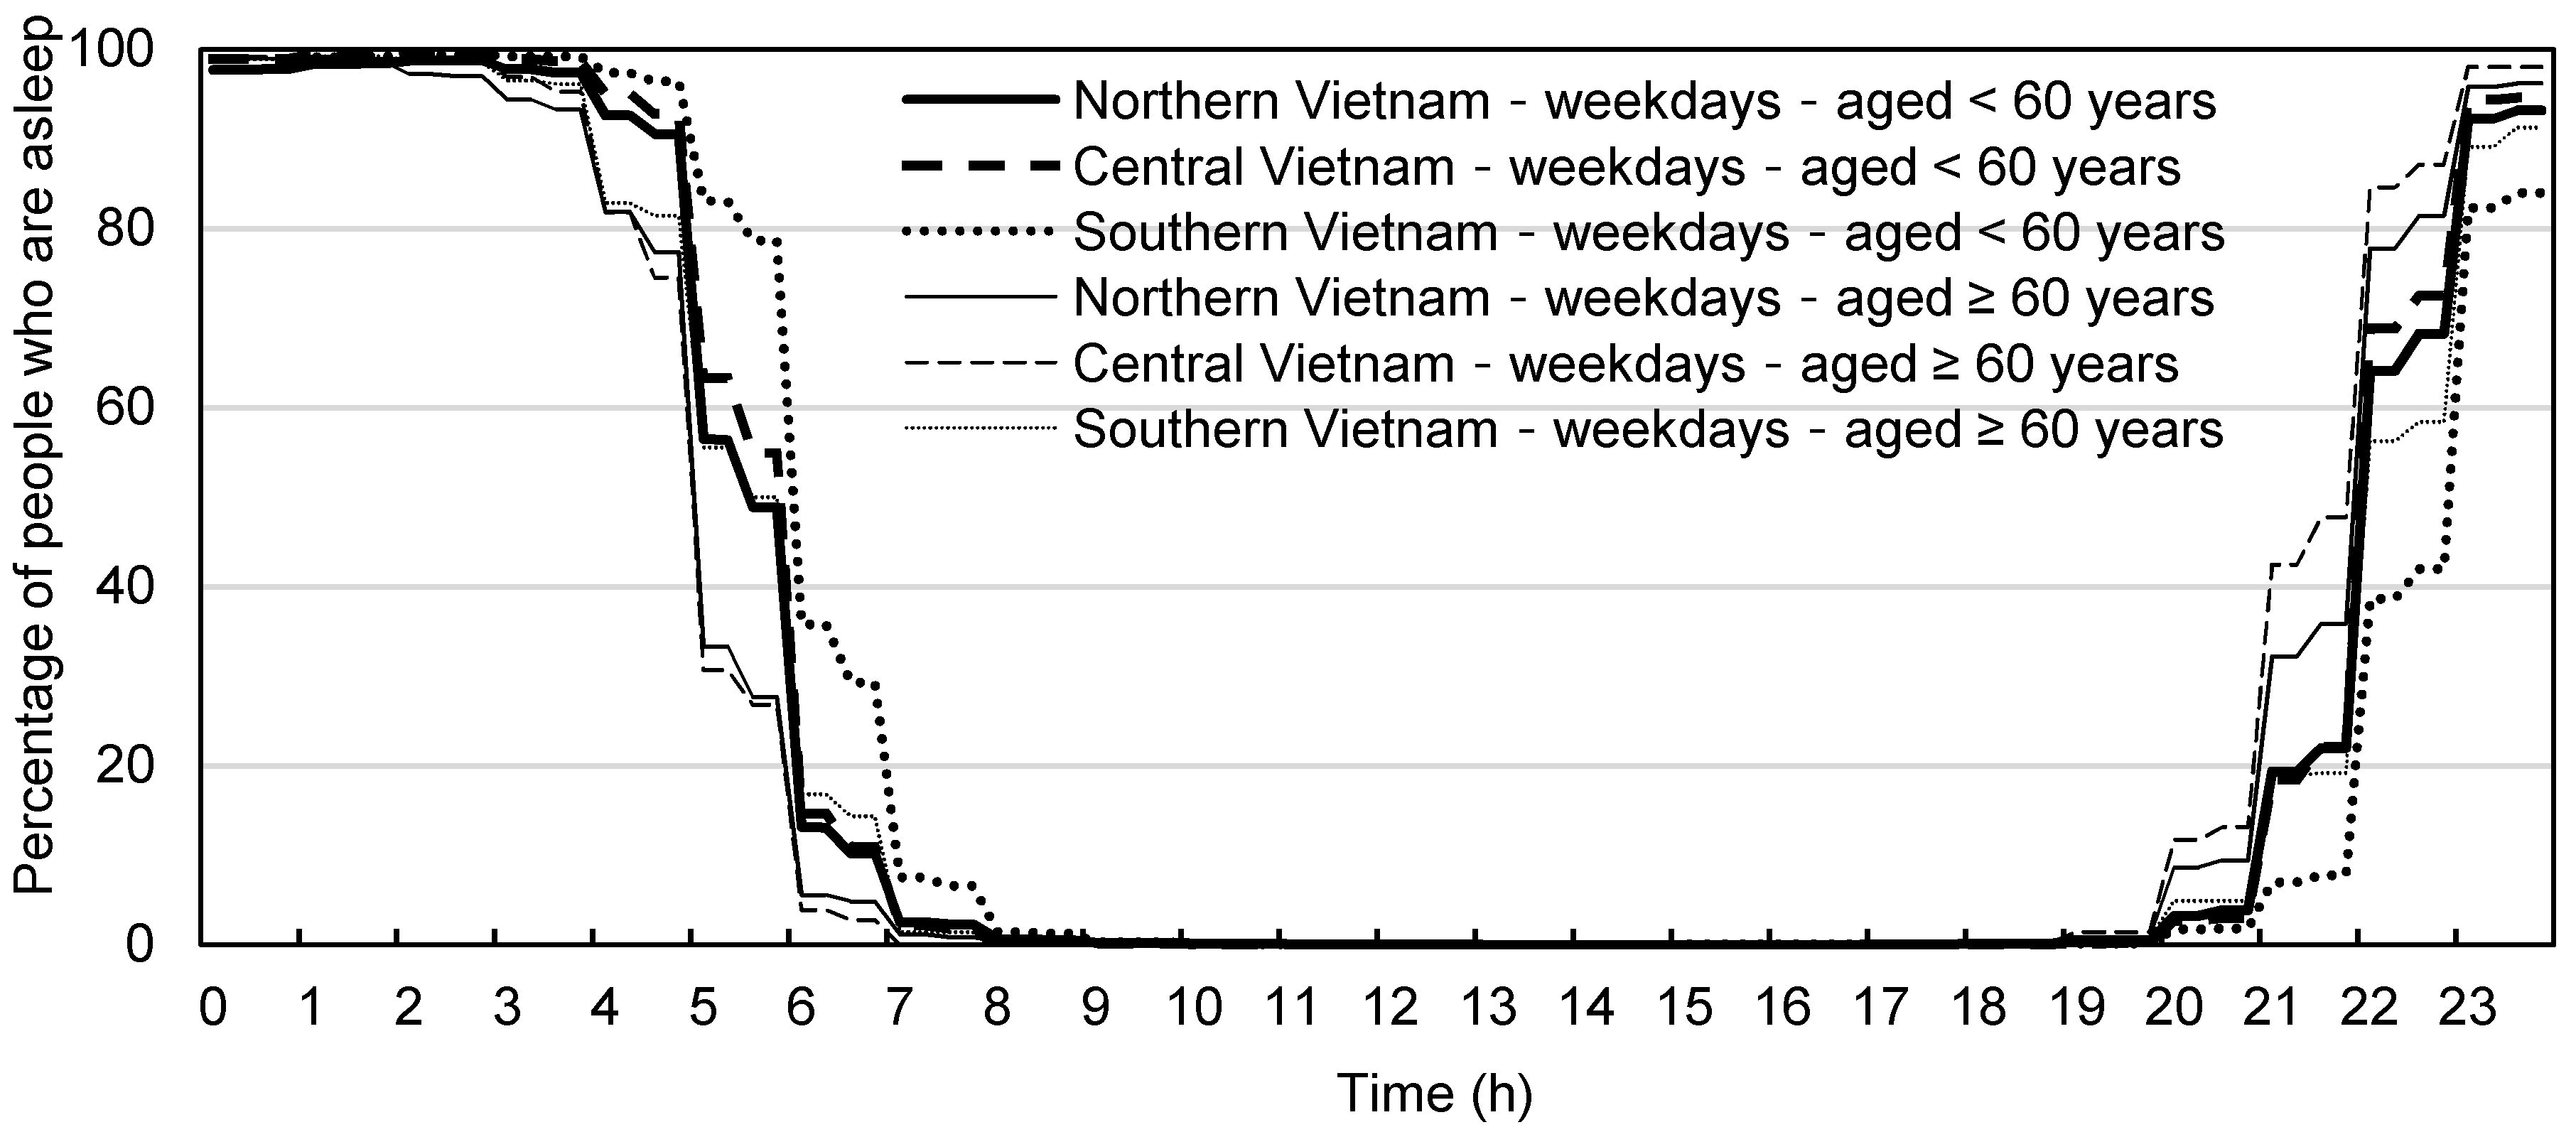
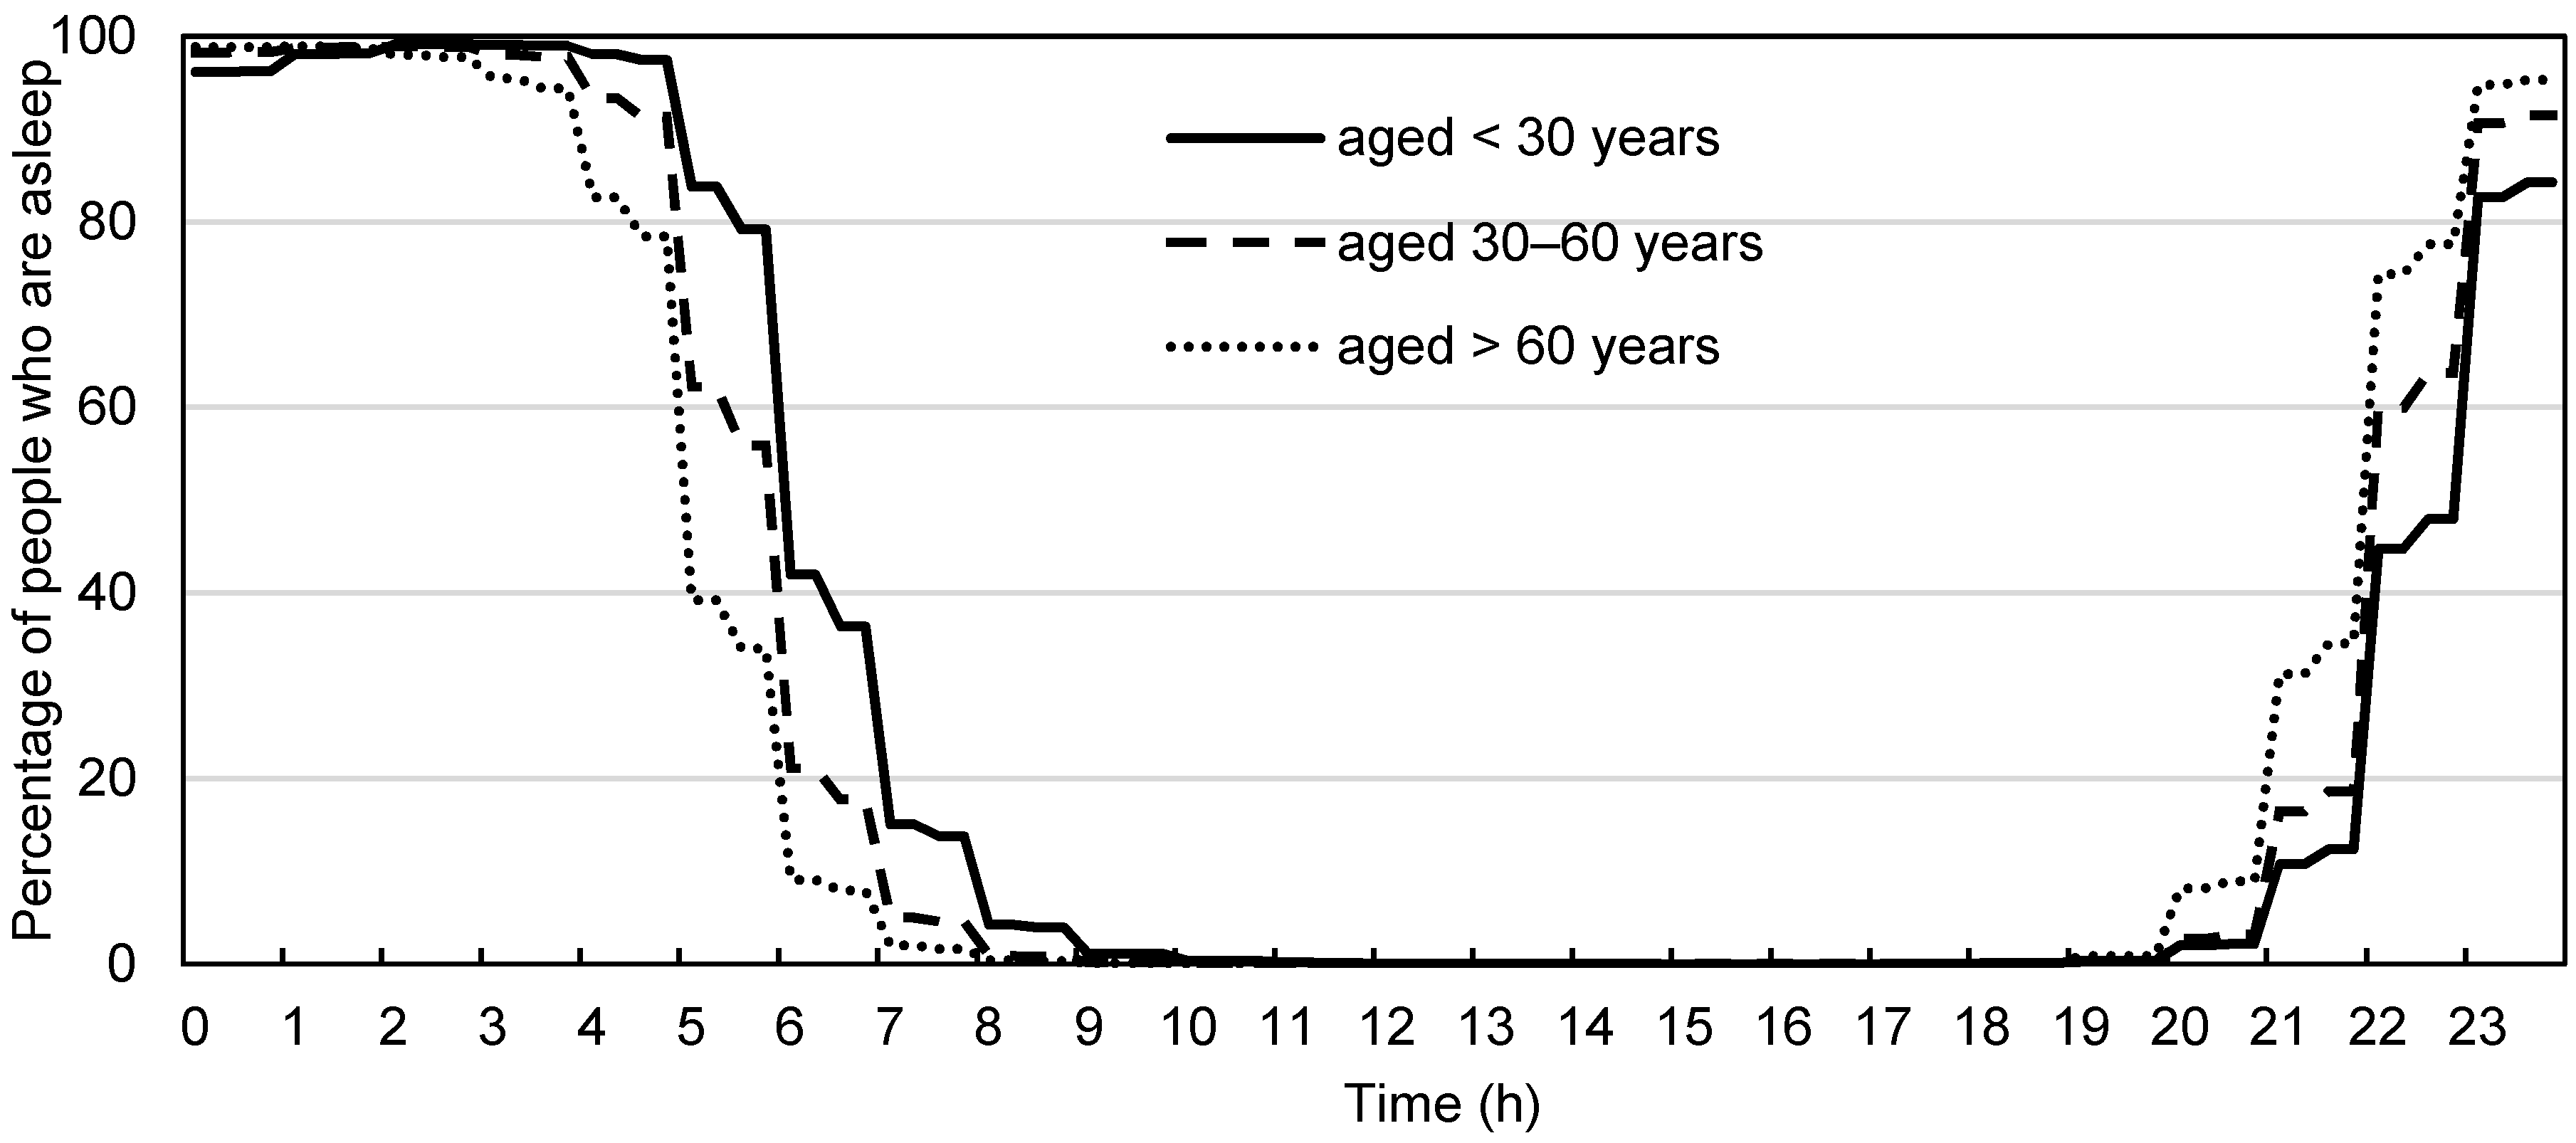
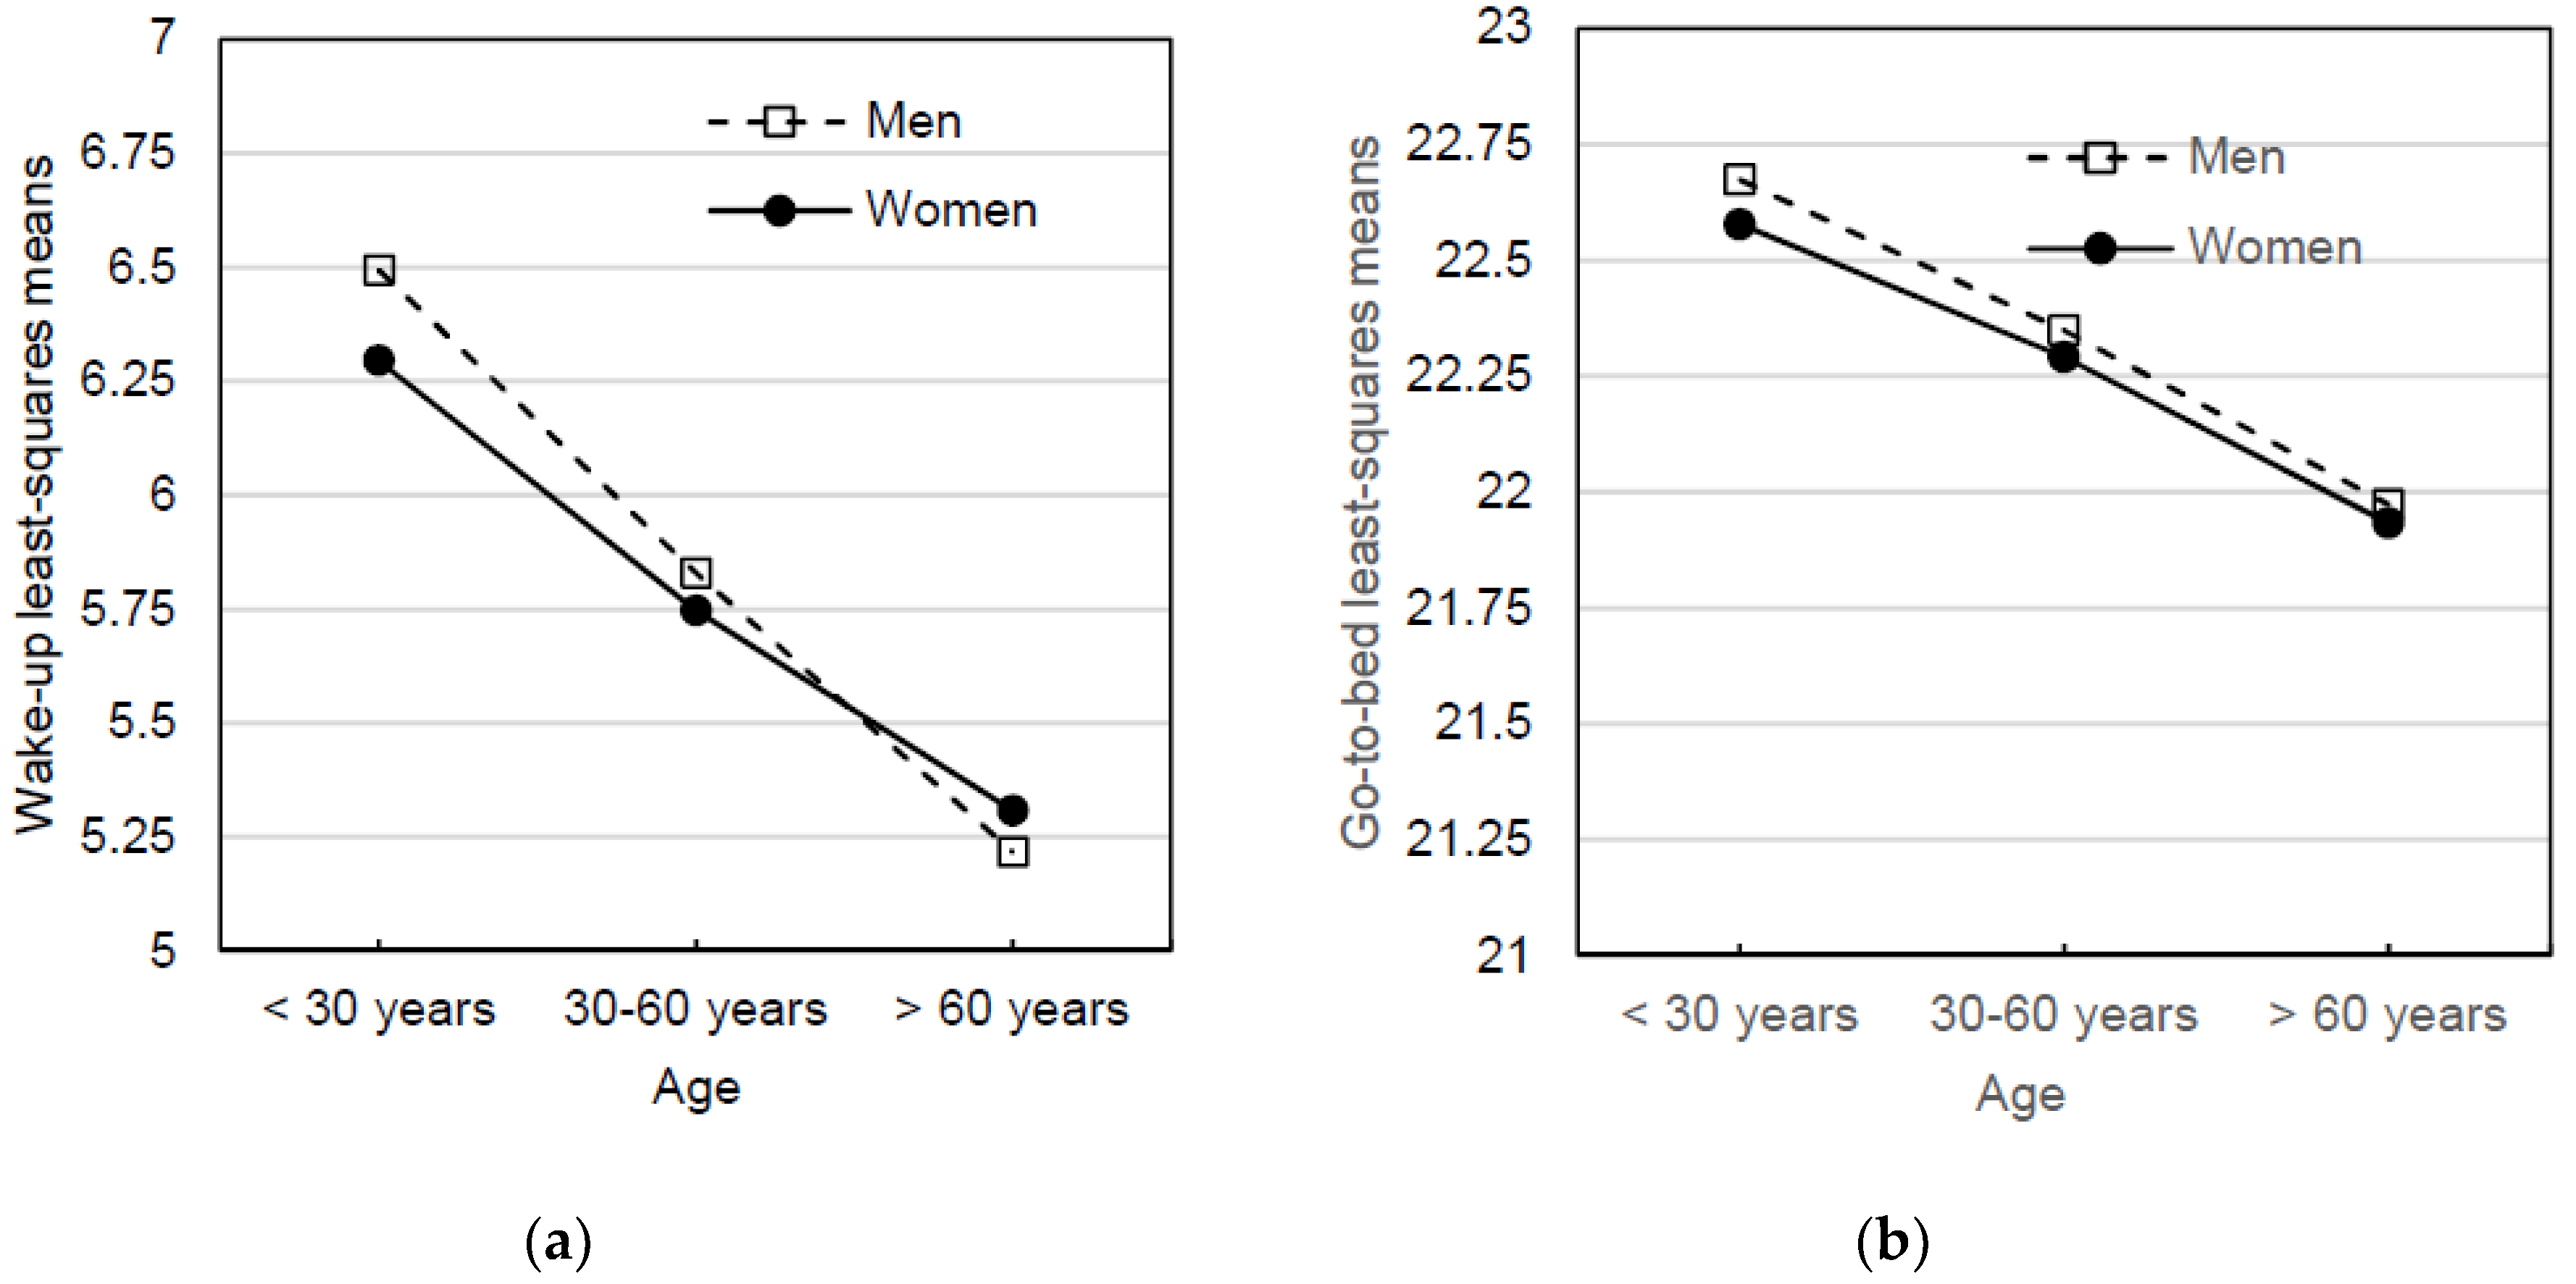
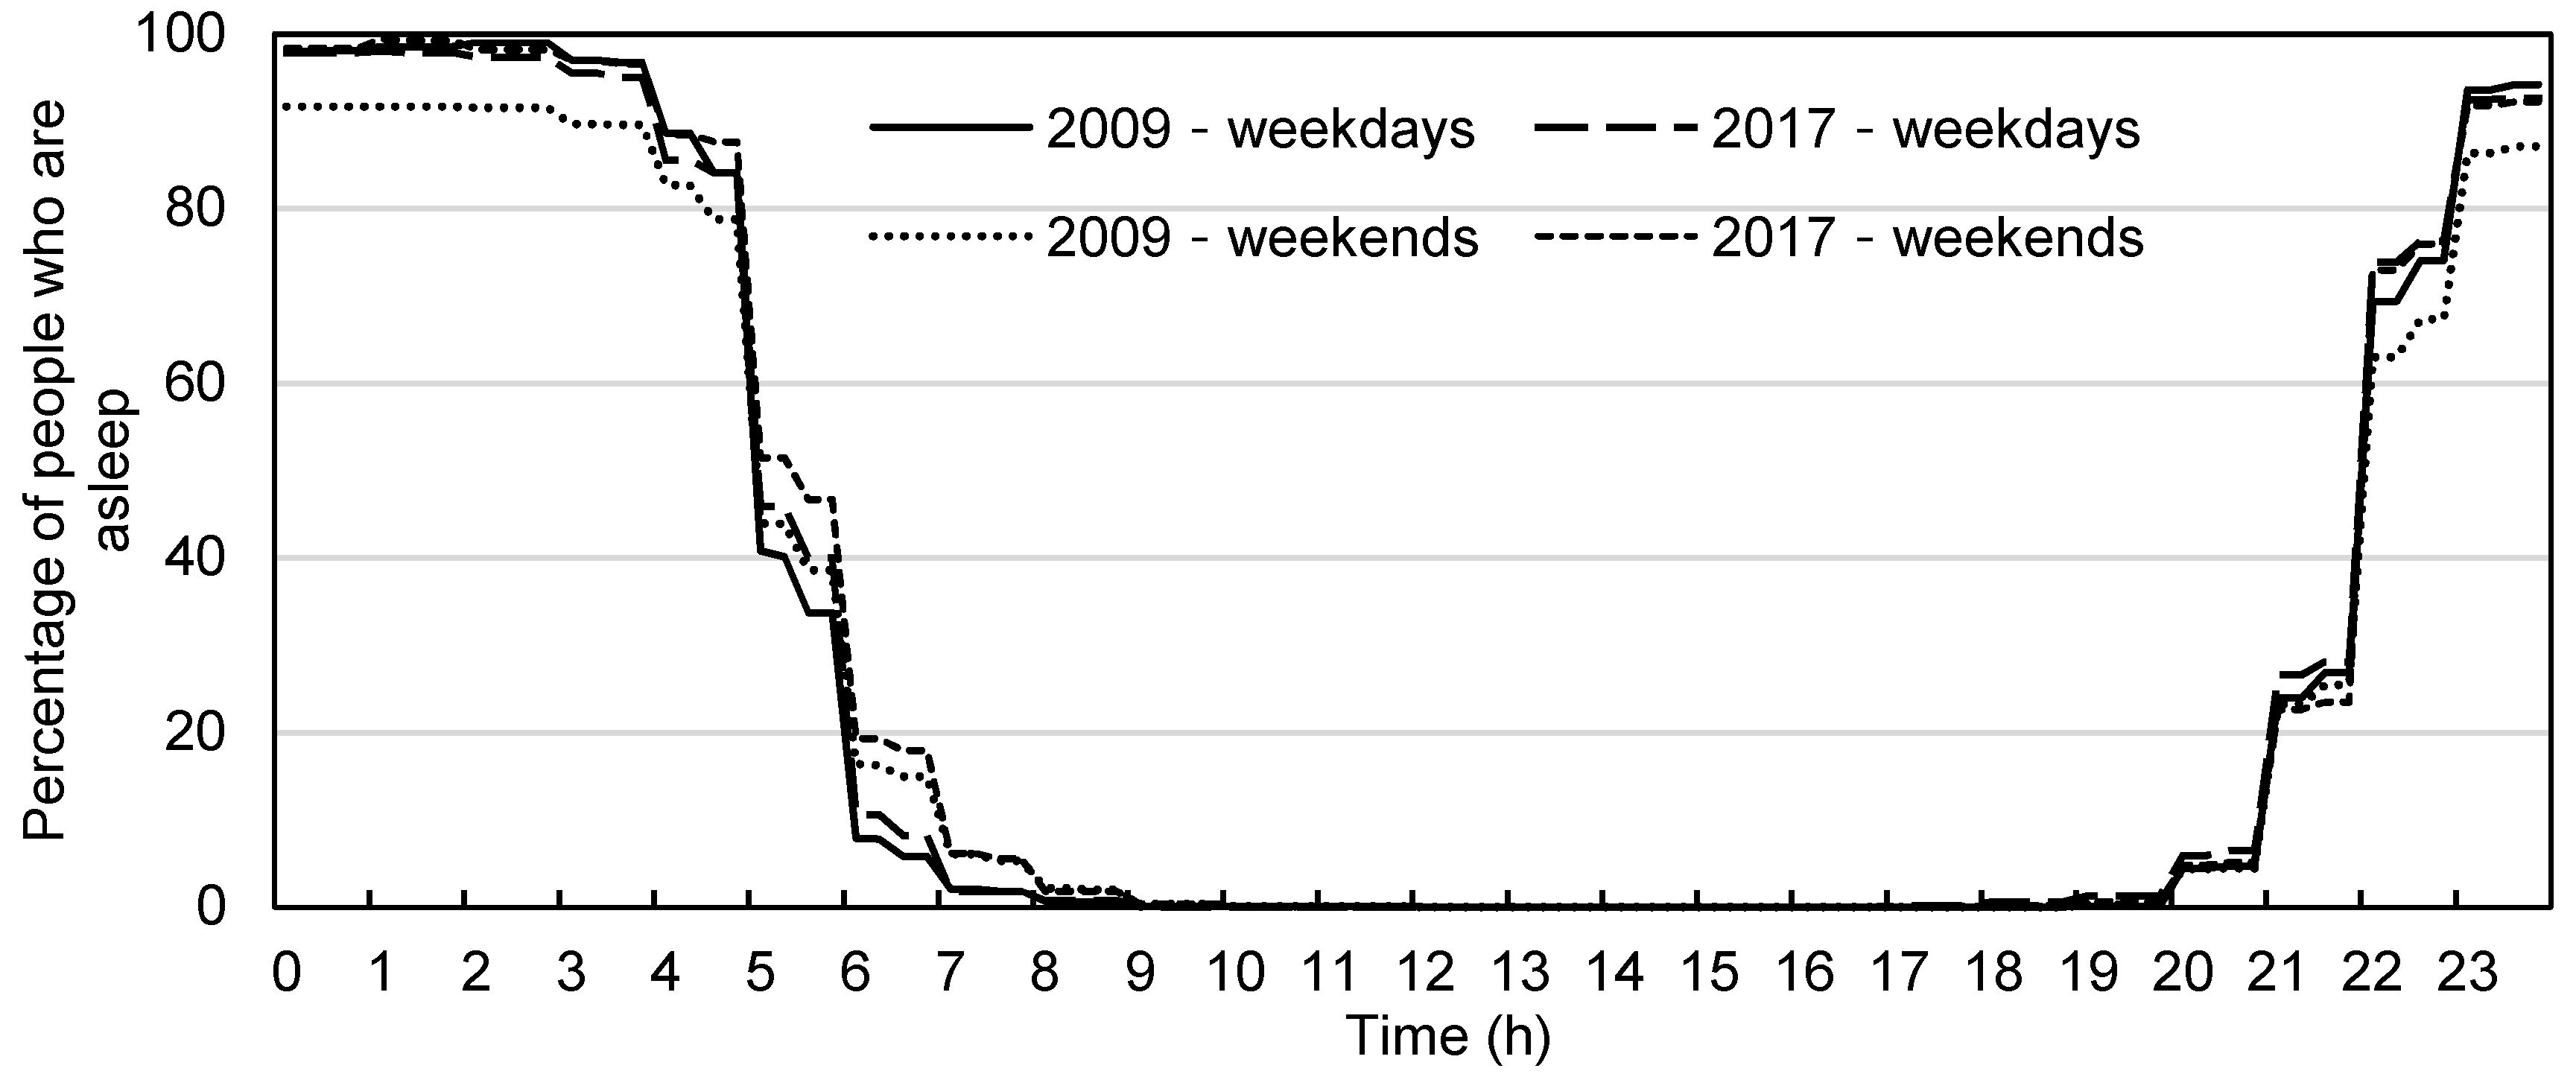
13] were used to verify the validity of the time intervals in the current standards and regulations and the future aircraft noise standards. All the data indicating the time zones of go-to-bed time, wake-up time, and other living activities in various parts of Vietnam were examined.
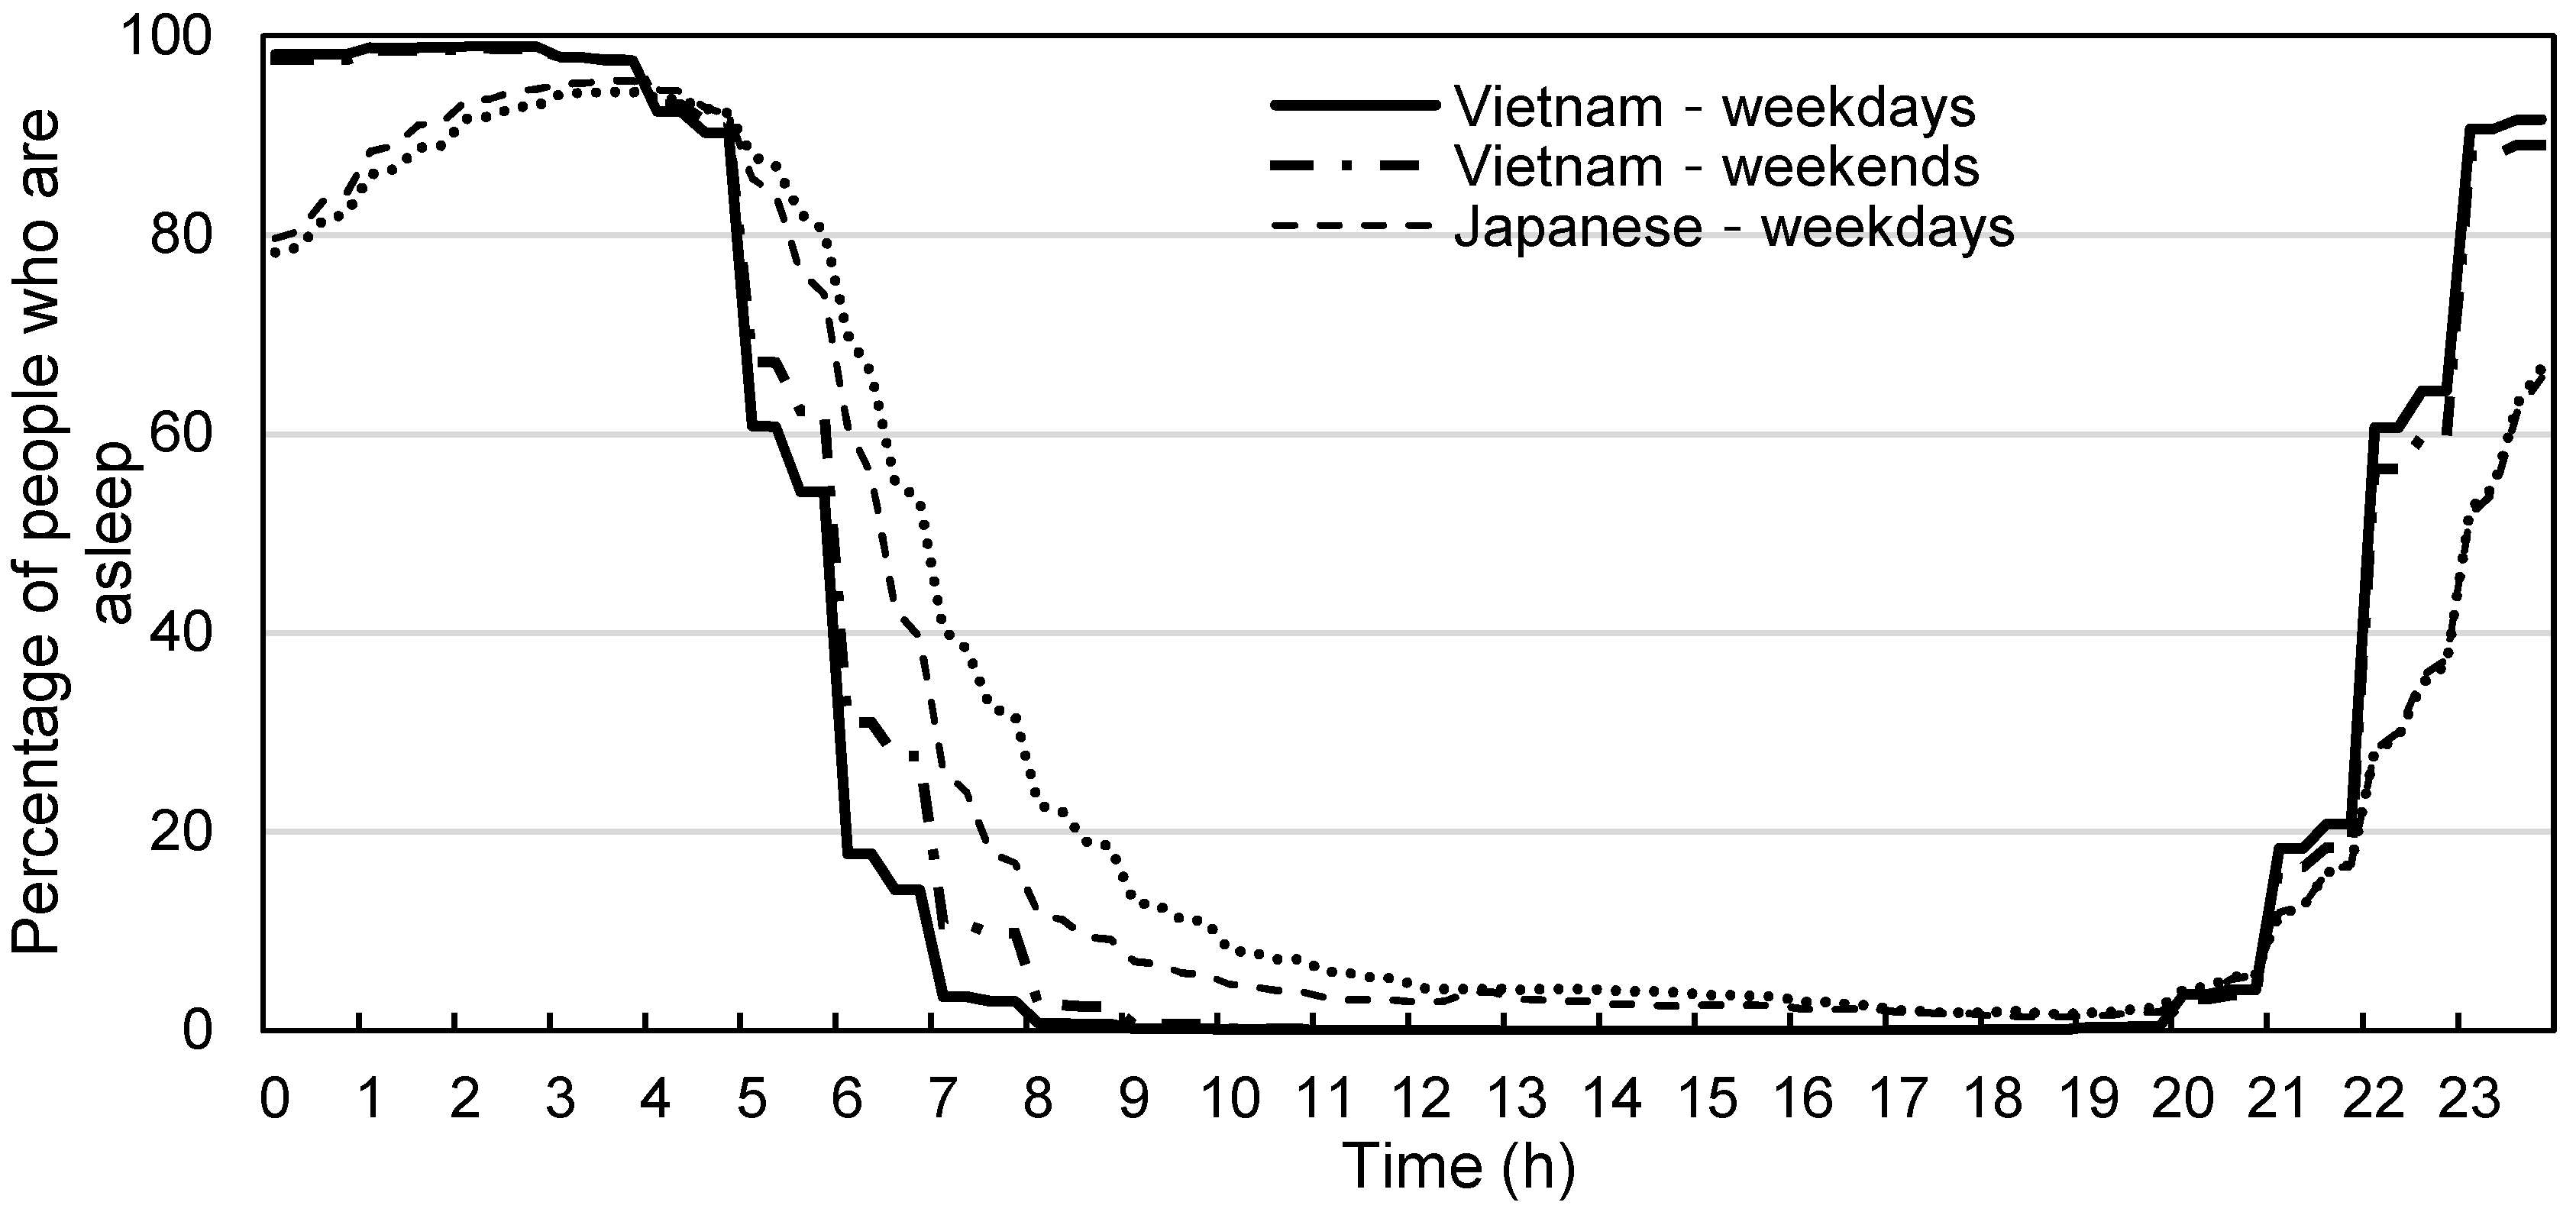
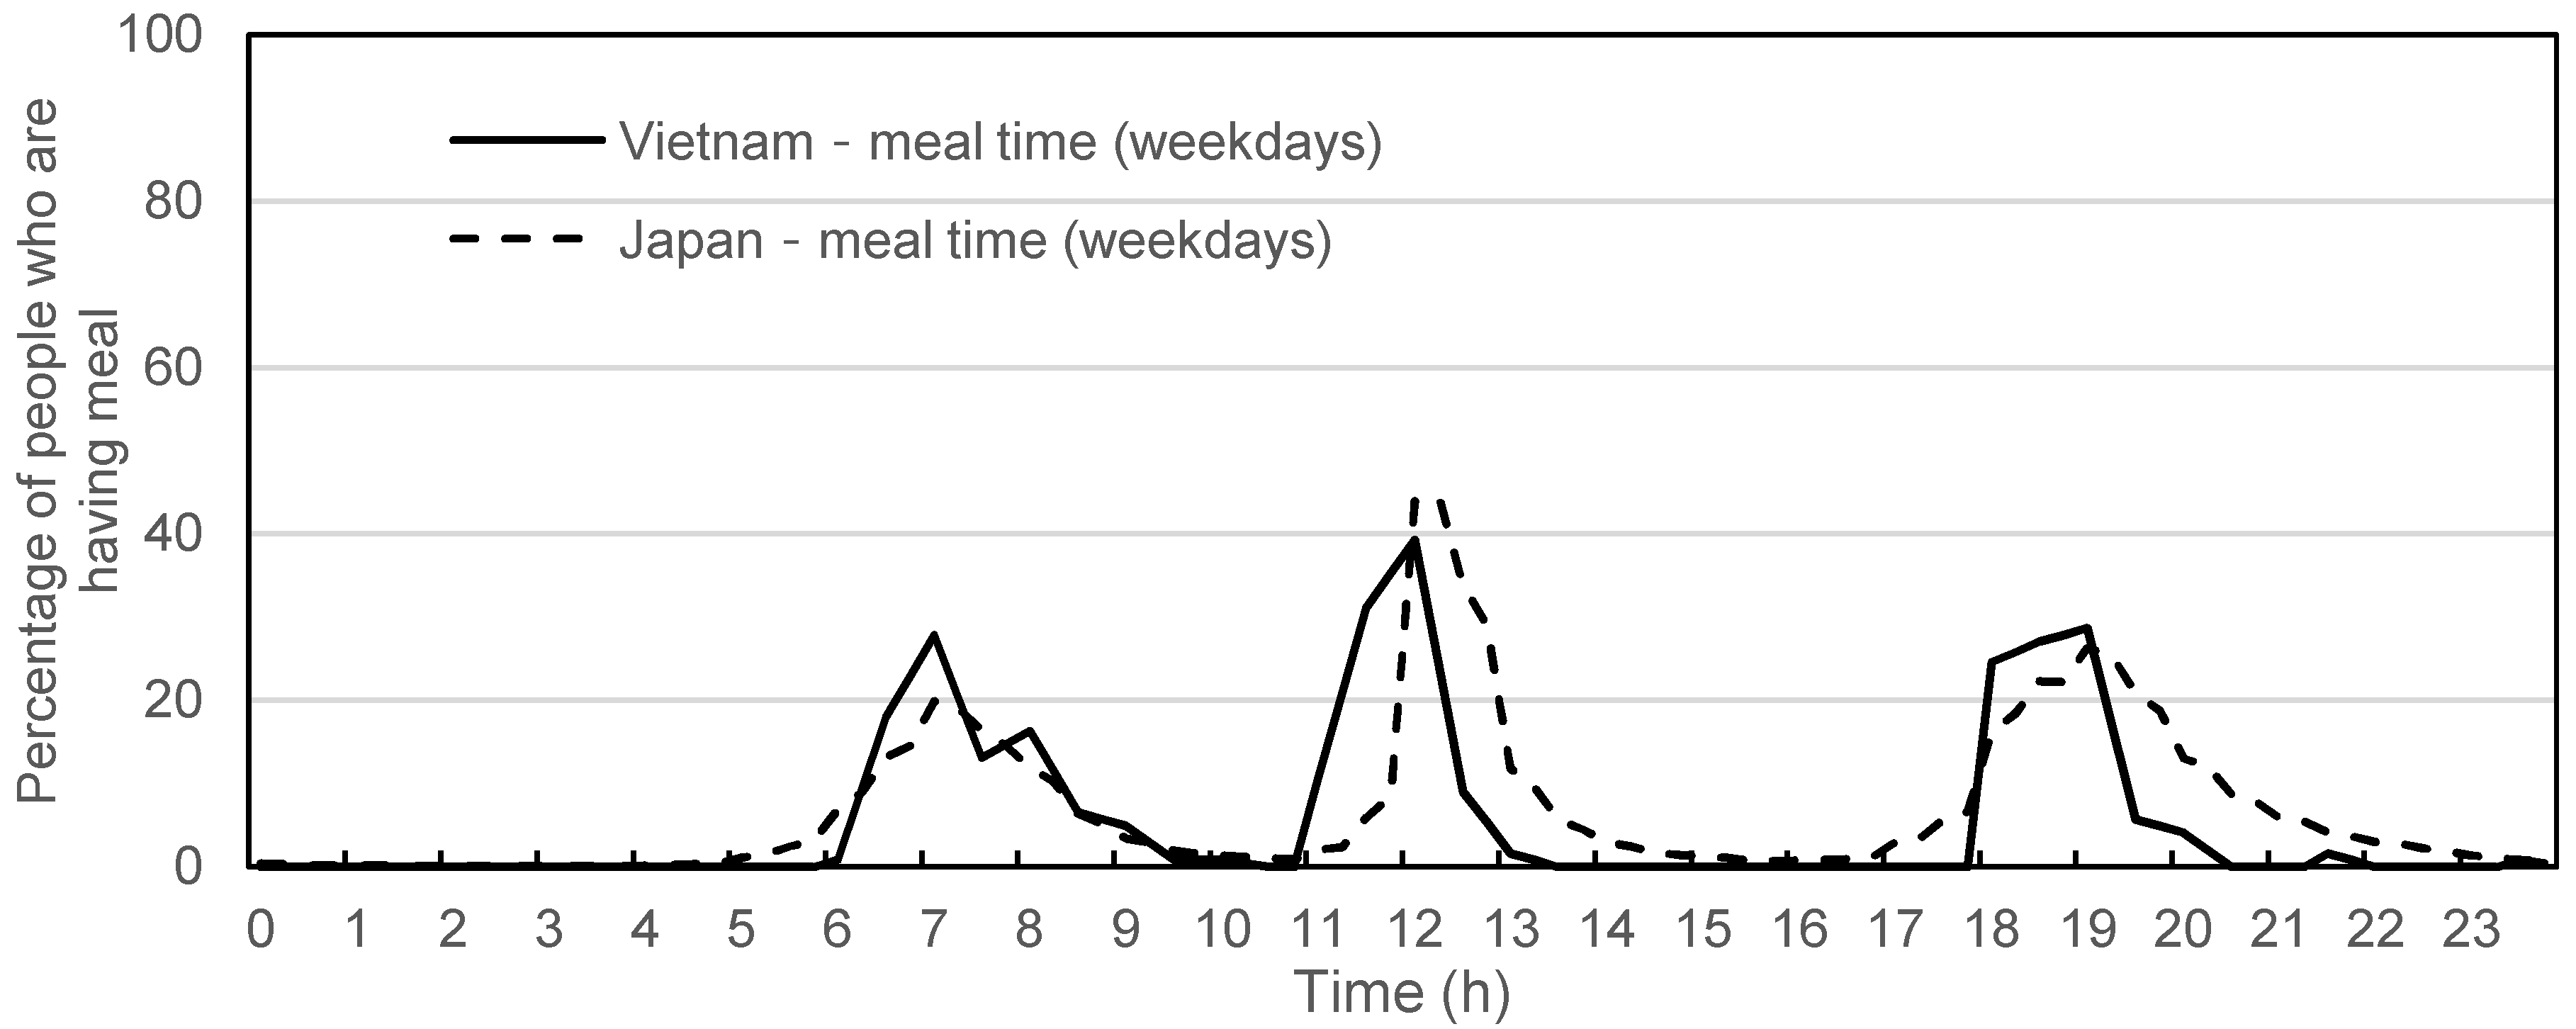
The dataset also allowed for the comparison of data between men and women, weekends and weekdays, and people of different ages and regions. Based on the analysis, a logical approach in deciding the time intervals of the noise indicator could be achieved and used to clarify the difference from the time interval segmentations in the current standards and regulations. With the awareness that people’s living habits may change over time, a comparison of past and present data is necessary to ensure that the assessment of the noise indicator is appropriate for future policies and the modern lifestyle of Vietnamese citizens. As an additional investigation, a small-scale and Internet-based questionnaire survey on Vietnamese people’s life rhythms was conducted to compare the temporal patterns of daily activities of Vietnamese people with Japanese people and track changes, if any, in the modern lifestyle of Vietnamese citizens.
This study aimed to assess appropriate reference time intervals in noise indicators for the establishment of an airport noise management policy in Vietnam concerning the actual temporal patterns of the Vietnamese lifestyle. This study also aimed to provide reliable data to determine a valid aircraft noise exposure limit that fits the national economic and environmental considerations and values of residents living around Vietnam’s airports.

2. Materials and Methods

2.1. Socio-Acoustic Surveys on the Effects of Transportation Noise in Vietnam

2.1.1. Questionnaire Data

Thirteen socio-acoustic surveys on the effects of transportation noise have been conducted in Vietnam from 2005 to 2018 [3,4,5,6,7,8,9,10,11,12,13]. The surveys were performed using a questionnaire form designed following the technical requirements specified in ISO/TS 15666 and labeled as “Survey on the living environment”—without informing the respondents that the purpose of the survey is to investigate the noise impact [21]. Among these surveys, the two conducted in 2005 and 2018 did not include the questionnaire items that concerned periods of daily activities. Therefore, they were excluded from the analysis of the datasets. Consequently, the datasets of 11 socio-acoustic surveys on transportation noise conducted in five cities in Vietnam over 10 years from 2007 to 2017 (Table 5) were analyzed to investigate the temporal patterns of Vietnamese lifestyle. The accumulated datasets included responses from 6210 residents from northern Vietnam, 2161 from central Vietnam, and 3033 from southern Vietnam.
In these surveys, the wake-up and go-to-bed times of respondents on weekdays and weekends were asked using the question format as shown in Figure 1. The data were extracted and analyzed to investigate the awake and sleeping time intervals of Vietnamese people. The data were classified by age group (<60 and ≥60), sex (men and women), day (weekdays and weekends) for each of the three regions of Vietnam (northern, central, and southern Vietnam). The various temporal patterns of the respondents’ sleeping activities were compared to decide a time interval segmentation representative of Vietnamese people.

2.1.2. Traffic Volume and Noise Exposure Data

In the surveys on road traffic noise, survey sites were selected to cover a wide range of noise exposure levels, traffic volumes and characteristics of streets, such as the road width and type of the neighborhood. The range of investigated streets was diverse, including residential streets, busy streets with many shops and commercial centers, and streets with a mixture of residences, public utilities, and shops. The data of road traffic volumes monitored at the survey sites were analyzed to investigate their hourly changes, which were assumed to reflect residents’ working and rest hours; particularly, two peak times in hourly traffic volumes in the morning and in the evening indicate the time when residents leave their homes for work and when they return home after work, respectively. This helped us to determine the starting time of the daytime and evening. The data of hourly changes in aircraft movements were used to evaluate flight operation hours of the airport, aircraft noise impact, its relations to residents’ life rhythm, and the validity of the noise evaluation indicators.
Traffic volume and noise exposure data were estimated using field measurements that were conducted during the period of the questionnaire surveys for all socio-acoustic surveys. Road traffic volume was counted by replaying the recorded video for 10 min every hour. For road traffic noise exposure, L A e q ,   1 s   was measured for 24 h on weekdays on the shoulders of selected roads. For aircraft movements, numbers of take-off and landing operations were counted from the measurement data obtained at the two nearest sites to the runway end. Aircraft noise levels were measured for seven successive days using sound level meters at selected sites.

2.2. Noise Exposure and Number of Flights at Residential Areas Around Three Major Airports

The latest data collected in residential areas around three major airports of Vietnam, Noi Bai Airport (NBIA) in the north, Da Nang Airport (DAD) in the center, and Tan Son Nhat Airport (TIA) in the south, in 2017, 2018, and 2019, respectively, were used to evaluate the measured values of various noise   indicators , i.e., Lden, Ldn, Lday, and Lnight, when the segmentation of time intervals was adjusted differently. The number of flights provide the data of nighttime flight operations at major airports in Vietnam. The calculated noise levels were used to examine the applicability of the noise limits in the current national and international standards for residential areas around the airports in Vietnam.

2.3. Data of the Survey on Time Use and Leisure Activities of Japan and the Questionnaire Survey of Vietnamese People’s Life Rhythms

The Survey on Time Use and Leisure Activities of Japan has been conducted every five years since 1951 to obtain basic information on the social life of the population, such as the status of main activities (study, training, volunteer activities, sports, hobbies, entertainment, travel, or excursions) in the allocation of lifetime and leisure time [20]. The survey provided important information that is indispensable for various administrative measures related to the improvement of social life, such as the promotion of work–life balance and gender equality [22]. The survey data were referenced to decide the time segmentation of the noise indicator used in the environmental standards of Japan.
There has been no survey on Vietnamese people’s life rhythms that is equivalent to the Survey on Time Use and Leisure Activities of Japan. To make it possible to refer to the standards of Japan, in this study, the survey was conducted to examine the daily life behaviors and time use of Vietnamese people, referring to the form of the survey in Japan. The information of the activities that are greatly involved in the consideration of the noise indicators, such as sleep and meals, as well as respondents’ demographic information, were included in the questionnaire of Vietnamese people’s life rhythms (Table 6). This questionnaire was composed in Vietnamese and created using a Google form. Vietnamese people living in Vietnam were contacted and responded via a survey on the Internet. Vietnam stretches 1650 km from the north to the south, which causes significant variations in regional lifestyle and culture, and the land use surrounding large airports varies. First, the link to the questionnaire was sent to about 200 users accessible via social networks from the north and south regions in Vietnam. To ensure that the obtained dataset was in good accordance with the demographic statistics of Vietnam, the response data obtained after one week were summarized and compared to the general population structure of Vietnam [23]. Next, any users who omitted key information were sent the link again. A good balance between male and female participants was obtained, but there was a lack of data from people aged > 60 years. In the next recruitment, the link was sent to users aged > 60 years. A total of 122 responses obtained after another week were included in the final analysis.
In this study, data regarding Japanese people’s daily behavior for each time period were extracted and compared with data of the surveys conducted with Vietnamese respondents.

3. Results

3.1. Respondents’ Demographic Data

Respondents’ demographic data for all surveys were analyzed and are summarized in Table 7. The data used for the analysis were confirmed to be representative of the situation in Vietnam. However, the survey data were limited to people aged 20 years and older. The time of day for young people aged < 20 years should be considered carefully in a further study with an awareness that noise effects on the young are different as compared to older people.

3.2. Hourly Changes of Air Traffic and Road Traffic Volumes in Hanoi and Around NBIA, DAD, and TIA

Figure 2 shows a comparison of the trend of average hourly road traffic volume monitored at eight survey sites in Hanoi downtown (HN) in 2005 with the volumes around three major airports of Vietnam (i.e., NBIA in the north, DAD in the center, and TIA in the south). The two peaks in the morning and the evening indicate rush hours. The changes monitored near NBIA show that traffic rush hours were 6:00–8:00 and 16:00–18:00, which differed slightly from DAD and HN. The rush hours of Ho Chi Minh City—8:30–10:00 and 18:00–19:00—were later than those for HN/NBIA/DAD, suggesting a difference in residents’ lifestyles.
Hourly air traffic volumes (landings and take-offs per hour) in the day (24 h) at the three airports, as shown in Figure 3, indicate that most flight operations take place between 6:00 and 23:00 Hourly air traffic volumes at DAD are lower than at NBIA and flight operations are largely concentrated in the daytime hours from 6:00 to 22:00 The hourly average air traffic volumes at TIA are higher than at NBIA and DAD, which is consistent with the scale of the airports. More nighttime flights are operated in TIA than NBIA and DAD.
Comparing the results of past surveys and recent surveys, it is worth noting that the situation has changed remarkably, and the frequency of flight operations during the nighttime has increased considerably in all three airports. When the night flight number increases, the effects of high-level night noise exposure are more serious (e.g., disturbing people’s sleep). Thus, it is important to define the night interval in the noise control policy. The air movements have more than doubled in the last three years. In particular, there are many more flights between 22:00 and 2:00 now. Considering that traffic volume and flight movement numbers are still high after 21:00 in most cities and around major airports in Vietnam, the feasibility of the Vietnamese Environmental Standard TCVN 5949-1998 is questionable as it is challenging to cut down 25 dB of daytime noise level to meet the nighttime noise limit.

3.3. Comparison of Wake-up and Go-to-bed Times Among Residents in the Northern, Central, and Southern Regions of Vietnam

The data for wake-up and go-to-bed times were extracted from the datasets of all surveys in Table 5, in which Hanoi and Thai Nguyen represent northern Vietnam, Da Nang and Hue represent central Vietnam, and Ho Chi Minh represents southern Vietnam. Thai Nguyen is a small city located 70 km north of Hanoi and Hue is the old capital, located near Da Nang. The wake-up and go-to-bed times were classified by age groups and sex for weekdays and weekends. Thereafter, they were compared among the three regions of Vietnam (northern, central, and southern Vietnam), as shown in Figure 4, Figure 5, Figure 6 and Figure 7. Based on the reported go-to-bed and wake-up times, the percentage of sleeping people was determined for every 15-min segment on the x-axis of the 24-h timeline (Figure 4, Figure 5, Figure 6 and Figure 7).
In this study, the time period in which the percentage of sleeping respondents varied from less than 50% to more than 50% was defined as the average go-to-bed time. Similarly, the time period at which the percentage of people who were sleeping varied from more than 50% to less than 50% was defined as the average wake-up time. Respondents’ average go-to-bed time on weekdays was in the range 10–10:15 p.m., except for those aged < 60 years in southern Vietnam, who go to bed one hour later than the others. Given the negative effects on individuals’ sleep, employing a rate of 25% (i.e., one-quarter of the people sleeping) would be the more flexible decision. Then, the daytime can start at about 5:30–6:00 and the start of nighttime would remain as defined previously.
There was no change in the go-to-bed time between weekdays and weekends except for respondents in central Vietnam, who go to bed one hour later on weekends. As shown in Figure 5, there were negligible sex differences in sleeping time in all regions.
On weekdays, the average wake-up time of respondents aged < 60 years was 6:00–6:15 in all three regions, whereas the average wake-up time of respondents aged ≥ 60 years in northern and central Vietnam was one hour earlier than respondents aged < 60 years (i.e., 5:00–5:15). Respondents aged ≥ 60 years in southern Vietnam wake up later than those in northern and central Vietnam. All respondents woke up 30 min to 1 h earlier on the weekdays than on the weekends, except for respondents aged < 60 years in northern Vietnam, who had no change in wake-up time between weekdays and weekends.
The data of Vietnamese people’s sleeping time on weekdays were classified in three age groups: < 30 years, 30–60 years, and > 60 years (Figure 7). People aged < 30 years woke up later than those aged > 60 years.

3.4. Analysis of Variance (ANOVA)

An ANOVA was conducted to examine whether the mean go-to-bed and wake-up times of respondents differed by age, sex, region, and time of day. As shown in Table 8, comparison between the least-square means indicated that people wake up between 5:00 and 6:30 and go to bed between 22:00 and 23:00. Respondents aged > 60 years go to bed and wake up about half an hour earlier than those aged < 30 years, while respondents aged 30–60 wake up between these times. The results suggest that it is necessary to modify the time the day “starts” and the time the night “starts” by one hour earlier if the new standards and regulations wish to prioritize the aging population. Consistent with the results concerning road traffic rush hours, wake-up and go-to-bed times in southern Vietnam are approximately one hour later than those in northern and central Vietnam.
Table 9 shows the results of the effect test to determine the significance of the effects of respondents’ age, sex, living region, and day, as well as their interaction effects on wake-up and go-to-bed time. All the main effects of sex, age, region, and day were significant; age had the most significant effect, and sex had the least significant effect. While the interaction effects of Age*Sex, Age*Region, Age*Day, Sex*Region were significant in the wake-up-time model, only Age*Region and Sex*Region were significant in the go-to-bed-time model. The interaction effect of Age*Sex indicates the impact of sex on the wake-up time adjusted by age. This interaction effect had a similar tendency in the go-to-bed-time model but was not as pronounced as that in the wake-up-time model.
Interaction plots for the go-to-bed time and wake-up time with the interaction effect of age and sex are shown in Figure 8. The age-related effect on sleeping time differed between men and women. The interaction between age and sex was significant for wake-up time (the curves cross), but not for go-to-bed time (the curves are parallel). Men tended to wake up earlier as they aged. This tendency was milder among women. For go-to-bed time, the relationship was almost the same between men and women. The interaction effect of age and region is significant in both the wake-up- and go-to-bed-time models. Respondents aged 30–60 years in central Vietnam go to bed and wake up in the time just in between those aged > 60 years and those aged < 30 years. While those in southern Vietnam wake up later, like those aged < 30 years, those in northern Vietnam wake up earlier, like those aged > 60 years. The same trend was observed in the go-to-bed-time model.
This result indicates the time break at the beginning and end of the day or nighttime segmentation when calculating the L dn . Accordingly, as the go-to-bed and wake-up time (estimated in Table 8), defined by the time at which the percentage of people who were sleeping changed from more than 50% to less than 50%, or vice versa, go-to-bed and wake-up time can be said to be 22:00 to 23:00 and 5:30 to 6:30, respectively. Given the negative effects of excessive noise on people’s sleep, these should be 5:30/6:00 and 22:00. This result is consistent with the outcomes drawn from Figure 4, Figure 5 and Figure 6. These segmentations fit better with the sleeping temporal patterns of Vietnamese people than those in the current national regulations and standards, which applies reference time intervals of 6:00 to 21:00 for daytime and 21:00 to 6:00 for nighttime.
The recently published Environmental Noise Guidelines for the European Region by the World Health Organization (WHO) Regional Office in Europe [24] provided recommended noise limits for road, rail, and aircraft using L den   and L night . L den averages the noise out over a 12-h day, a four-hour evening, and an eight-hour night. Particularly, L night   averages the noise from 23:00 to 7:00 These segmentations fit well to the sleeping temporal patterns of the young Vietnamese population. Since older Vietnamese adults wake up and go to bed about one hour earlier than their younger counterparts, it may be preferable to set the daytime and nighttime one hour earlier than the standard decided for the general population.

3.5. Comparison of Go-to-bed and Wake-up Times between Surveys in 2009 and 2017

The temporal changes in the rate of sleeping people obtained in the surveys conducted around NBIA in 2009 and 2017 were compared to clarify if the sleeping temporal patterns of Vietnamese people changed by time (Figure 9). In the ANOVA, which was conducted to determine differences in respondents’ sleeping time between the two surveys, the p-value for the wake-up time model was 0.676 (F = 0.175), while the p-value for the go-to-bed time model was 0.934 (F = 0.0069). This indicates that there was no significant difference in the sleeping time patterns between the two surveys. The difference in wake-up time between weekdays and weekends was slightly larger than that for go-to-bed time. This shows that people tended to wake up later but did not change their go-to-bed time, according to the recent survey.

3.6. Comparison of Temporal Pattern of Daily Activities between Japanese and Vietnamese People

In this section, data of Vietnamese people’s sleeping time from the socio-acoustic surveys were compared with the relevant data of Japanese people, extracted from the Survey on Time Use and Leisure Activities of Japan. According to the pattern shown in Figure 10, the difference between Japan and Vietnam is remarkable in the early morning and at midnight. Many Japanese respondents were not asleep at midnight. However, almost 100% of Vietnamese respondents were. This difference did not exist at 23:00. Regarding the difference between weekdays and weekends, there was only a slight difference between 5:00 and 8:00, and there seems to be no difference at other times. At a 50% sleeping rate, go-to-bed and wake-up times were the same on weekdays and weekends for Vietnamese respondents, and there is about half an hour difference in the wake-up time of Japanese respondents. At a 25% sleeping rate, there was a difference of about 45 min for wake-up time, but no difference in bedtime among Japanese respondents. Therefore, if the criteria are set following a 25% sleeping rate on weekdays, the daytime could be set from 6:00 to 22:00 for Vietnam and from 7:00 to 22:00 for Japan. Consequently, Japan has adopted a 7:00 to 22:00 interval for the daytime and an evening time of 19 to 22:00 in its present noise-related regulations. In summary, Vietnamese respondents went to bed and woke up earlier than Japanese respondents, signifying that the nighttime interval in noise indicators, which should be proposed for Vietnam’s future aircraft noise standards, might differ to that of Japan.
A total of 122 responses were obtained from the Questionnaire Survey of Vietnamese people’s Life Rhythms. The temporal patterns of mealtimes obtained in both surveys were compared to clarify when respondents ate breakfast, lunch, and dinner (Figure 11). While breakfast time was consistent between Vietnamese and Japanese respondents, lunchtime and dinnertime differed between the two countries. Lunchtime was earlier in Vietnam than in Japan. This result is consistent with the earlier working time of Vietnamese citizens. The percentage of Japanese respondents who ate dinner after 19:00 was much higher than the percentage of Vietnamese respondents, indicating that the evening interval in noise indicators of Vietnam may be designated one hour earlier than that of Japan.

3.7. Measured L d e n , L d n , and L d a y L n i g h t Noise Indicators Adjusted by Different Time Intervals Segmentation

The WHO guidelines recommend reducing noise levels produced by aircrafts to below 45 dB Lden for average noise exposure, as aircraft noise above this level is associated with adverse health effects [24]. They also recommend levels below 40 dB Lnight for night noise exposure, as nighttime aircraft noise above this level is associated with adverse effects on sleep [24]. Vietnam’s National Technical Regulation on Noise (QCVN 26:2010/BTNMT) regulates noise limits in the daytime and the nighttime to be 55 and 45 in special areas, respectively, and 70 and 55 in usual areas, respectively. This regulation is somewhat consistent with the WHO’s guidelines, but only for special areas; it is much higher than what the WHO recommends for usual areas.
Looking at the aircraft noise levels we recently measured in residential areas around the three major airports in Vietnam—NBIA in 2017, DAD in 2018, and TIA in 2019—Ldn under 55 dB is not applicable for residential areas near the airports (Table 10). Seven sites—NBIA3–NBIA-10 (except site A6)—that are located within 5 km from the endpoints of the runways on each side of NBIA have noise levels exceeding 55 dB. Ldn measured at sites DAD-5 and DAD-6, the closest sites under the landing and take-off paths of DAD, were 63 and 56 dB, respectively. The latest data collected in three residential areas in Ho Chi Minh City show that the noise levels measured at site TIA-5, the closest to the end of the runway on the landing side reached 78 dB (Ldn) and 79 dB (Lden). The noise level measured at TIA-1, which is located 7 km east of the runway end of TIA, was 65 dB (Ldn). The difference between estimated Ldn, adjusted by the time interval segmentation proposed by this study, was consistent with QCVN 26:2010/BTNMT and TCVN 5949-1998—from 0.1 to 1.0 dB and from 0.2 to 0.8 dB, respectively. These discrepancies in noise levels are non-significant. However, time intervals that match individuals’ actual lifestyle are recommended.
The past decade has seen an increase in nighttime flight operations at major airports in Vietnam, resulting in a spike in the number of night noise events, especially from 0:00–4:00, compared to the data collected in previous surveys (Figure 3). The aircraft movement distribution in different time intervals considered in this study (Table 11) shows that the aircraft movements operated from 22:00 to 6:00 occupied 17%, 24%, and 18% the total number of flights in a day at NBIA, DAD, and TIA, respectively. Applying the proposed nighttime interval will result in fewer nighttime flights than applying the current QCVN. However, it maintains the same definition as in TCVN. Moreover, Ldn, defined by different time intervals, differed only within 1.0 dB, as shown in Table 10.

4. Discussion

4.1. Appropriate Time Interval Segmentation and Noise Limit Value

The results of analyzing wake-up and go-to-bed times using the data from the socio-acoustic surveys in Vietnam from 2007 to 2017, as shown in Section 3, indicated that the time intervals’ classification of the QCVN 26:2010/BTNMT noise index is not necessarily appropriate. This suggests the necessity of changing the calculation of the noise indicators for future noise policy. Adjusting the Ldn calculation might make the measured values fluctuate less than 1 dB, depending on the distribution of flight movements over 24 h.
There is no available standard for aircraft noise in Vietnam. A representative exposure–response curve for aircraft noise annoyance in Vietnam, plotted by a logistic regression function (Figure 12), was referenced to consider the limit values of aircraft noise policy in Vietnam. Following the EU position paper [25], Lden was selected as the noise indicator for predicting annoyance in the socio-acoustic surveys in Vietnam. The percentage of highly annoyed persons (%HA) was used as the descriptor of noise annoyance. %HA was calculated by counting the percentage of respondents who chose 8, 9, or 10 (top 27%) on an 11–point numerical scale (0–10), which was consistent with the definition of %HA in the EU position paper. The curve for aircraft noise in Vietnam was almost coincident to that in the EU position paper for %HA. In other words, Vietnamese residents are possibly annoyed to the same degree as European people when exposed to the same noise level. However, they may be more annoyed by aircraft noise than road traffic noise.
In the WHO’s guidelines, noise exposure limits were determined based on a benchmark—an absolute risk of 10% HA population—in the exposure–response relationships [21]. However, it is not feasible to apply these noise limits to Vietnam because it is not possible to reduce noise levels to lower than 55 dB due to the high-level noise exposure of road and air traffic noise. Therefore, it is more realistic to set noise limit values at a risk level from 20% to 30% HA in the short term. Thus, the noise exposure limit for aircraft noise in Vietnam could be set in a range from 60 (20% HA) to 65 dB (30% HA) for average noise exposure, L dn , with the two reference time intervals of day (6:00 to 22:00) and night (22:00 to 6:00). These values are more feasible than the permissible noise limits of 55 dB in the daytime and 45 dB in the nighttime (or 55 dB, L dn ), which was prescribed in the QCVN 26:2010/BTNMT for specialized areas. However, they are stricter than the permissible noise limits, which are 70 and 55 dB for the daytime and the nighttime (or 69 dB, L dn . ) in usual areas. If overall environmental noise in Vietnam can be reduced, and people demand a less noisy living environment, this limit should be considered to coincide with the WHO’s recommendation. The noise criteria for planning areas around the airport should be stricter than those for general environmental noise, considering the severe response to aircraft noise based on the noise exposure–response relationships proposed for Vietnam.

4.2. Limitations and Implications

Although the analytical results in this study show that there was no significant difference in go-to-bed and wake-up time in the previous surveys, the change in the temporal patterns of respondents’ sleeping time and other daily activities needs to be further studied over a longer time span to make appropriate recommendations for future policies. In addition, the limited amount of data obtained in the online Questionnaire Survey of Vietnamese people’s life rhythms owing to time constraints limits the reliability of this study. The authors are planning to conduct a full-scale survey on the actual time that Vietnamese people perform their daily activities, referring to the methods used in the Survey on Time Use and Leisure Activities of Japan.
Implications from this study include the development of an aircraft noise indicator in Vietnam that considers the following future noise policy: (1) adjusting the reference time intervals of the noise indicator; (2) recommending the limits for aircraft noise referring to the WHO’s recently published Environmental Noise Guidelines for the European Region; and (3) establishing national guidelines for noise emission that are relevant to the circumstances, lifestyle, and culture of each country’s population.

5. Conclusions

In this study, the validity of time interval segmentation for environmental noise indicators was examined based on the data analysis of past questionnaire surveys conducted in Vietnam. Temporal patterns of sleeping activities were analyzed to investigate the awake and sleeping time intervals of Vietnamese people to inform better environmental noise indexes, especially for an appropriate rating of aircraft noise. The results showed that Vietnamese citizens wake up between 5:00 and 6:00 and go to bed between 22:00 and 23:00 This differed from the time segmentation in the current regulation on environmental noise in Vietnam, in which two reference time intervals of daytime (6:00 to 21:00) and nighttime (21:00 to 6:00) (QCVN 26:2010/BTNMT) were adopted.
Go-to-bed and wake-up times of Vietnamese respondents were found to differ by regions (e.g., wake-up and go-to-bed times in southern Vietnam are approximately one hour later than those in northern and central Vietnam). This finding indicates that different time segmentations can be assigned depending on the region in which the corresponding standards and regulations are applied. Some countries, such as Belgium, set different time intervals in their noise guidelines depending on the region. Although the start of nighttime in southern Vietnam could be set one hour later than in other regions, it is necessary to define a nighttime interval for all of the regions or assign different time interval segmentations depending on the regions, considering the negative effects of nighttime aircraft noise on the residents’ health. A full-scaled questionnaire survey on Vietnamese people’s life rhythms is planned to provide a basis for a multilateral discussion on this issue.
Temporal patterns of Vietnamese people’s lifestyle were compared with those of Japanese citizens. We compared the noise indicators for noise evaluation in Vietnam and Japan. The comparison suggested that the appropriate reference time intervals for aircraft noise indicators in Vietnam that are recommended for the next policy implementation phase are L dn , with the two reference time intervals of day (6:00 to 22:00) and night (22:00 to 6:00), and L den , with three reference time intervals of daytime (6:00 to 18:00), evening (18:00 to 22:00), and nighttime (22:00. to 6:00).

Author Contributions

Conceptualization, T.L.N., I.Y., and T.Y.; formal analysis, T.L.N., I.Y., and T.Y.; investigation, T.L.N., I.Y., T.Y., K.M., and M.O.; writing—original draft preparation, T.L.N., I.Y., and T.Y.; writing—review and editing, T.L.N., I.Y., T.Y., K.M., and M.O.; supervision, T.L.N.; project administration, T.L.N.; funding acquisition, T.L.N. All authors have read and agreed to the published version of the manuscript.

Funding

This study was financially supported by Grant–in–Aid for Research Activity Start–up (No. 17H06875) and Grant–in–Aid for Young Researcher’s Scientific Research (No. 19K15150) by Japan Society for Promotion of Science (No. 19K15150).

Acknowledgments

We gratefully acknowledge the staff of Civil Aviation Authority of Vietnam (CAAV), Noi Bai International Airport, and all the lecturers and students of National University of Civil Engineering and Hanoi University of Mining and Geology for supporting the social survey and noise measurement. This work was performed within the framework of a technical collaboration and cooperation program toward the establishment of monitoring and measuring technology of aircraft noise in Vietnam between RION Co., Ltd. and the CAAV.

Conflicts of Interest

The authors declare no conflict of interest.

References

  1. The 2018 Annual World Airport Traffic Report, Airports Council International World. Available online: https://aci.aero/news/2018/09/20/aci-world-publishes-annual-world-airport-traffic-report/ (accessed on 27 March 2020).
  2. Guidance Manual for the Monitoring and Evaluation of Aircraft Noise around Airports in Vietnam, Homepage of Civil Aviation Authority of Vietnam, Ministry of Transport. Available online: https://caa.gov.vn/van-ban/554-qd-chk-13217/ (accessed on 27 March 2020).
  3. Phan, H.Y.T.; Yano, T.; Phan, H.A.T.; Nishimura, T.; Sato, T.; Hashimoto, Y.; Lan, N.T. Social surveys on community response to road traffic noise in Hanoi and Ho Chi Minh City. In Proceedings of the 9th Congress of the International Commission on the Biological Effects of Noise (ICBEN), Machantucket Connecticut, MA, USA, 21–25 July 2008; pp. 699–706. [Google Scholar]
  4. Yano, T.; Yamashita, T.; Izumi, K. Social survey on community response to railway noise: Comparison of responses obtained with different annoyance scales. In Proceedings of the Inter-Noise, Liverpool, UK, 30 July–2 August 1996; pp. 2299–2302. [Google Scholar]
  5. Nguyen, T.L.; Yano, T.; Nguyen, H.Q.; Hoang, T.L.; Nishimura, T.; Morihara, T.; Hashimoto, Y.; Sato, T. Community response to aircraft and combine noises in Hanoi. In Proceedings of the 39th International Congress and Exposition on Noise Control Engineering (Inter-Noise), Lisbon, Portugal, 13–16 June 2010. [Google Scholar]
  6. Nguyen, T.L.; Yano, T.; Nguyen, H.Q.; Nishimura, T.; Fukushima, H.; Sato, T.; Morihara, T.; Hashimoto, Y. Community response to aircraft noise in Ho Chi Minh City and Hanoi. Appl. Acoust. 2011, 72, 814–822. [Google Scholar] [CrossRef]
  7. Nguyen, T.L.; Yano, T.; Nguyen, H.Q.; Nishimura, T.; Fukushima, H.; Sato, T.; Morihara, T.; Hashimoto, Y. Comparison of models to predict annoyance from combined noise in Ho Chi Minh City and Hanoi. Appl. Acoust. 2012, 73, 952–959. [Google Scholar] [CrossRef]
  8. Nguyen, T.L.; Yano, T.; Nguyen, H.Q.; Tuyen, K.; Nguyen, T.; Fukushima, H.; Kawai, K.; Nishimura, T.; Sato, T. Aircraft and road traffic noise annoyance in Da Nang City, Vietnam. In Proceedings of the 41st International Congress and Exposition on Noise Control Engineering (Inter-Noise), New York, NY, USA, 19–22 August 2012. [Google Scholar]
  9. Morihara, T.; Shimoyama, K.; Nguyen, T.L.; Nguyen, H.Q.; Yano, T.; Kawai, K. A study on community response to road traffic and railway noises and vibrations in Hue, Vietnam. In Proceedings of the 42nd International Congress and Exposition on Noise Control Engineering (Inter-Noise), Innsbruck, Austria, 15–18 September 2013. [Google Scholar]
  10. Nguyen, T.L.; Yano, T.; Nishimura, T.; Sato, T. Exposure–response relationships for road traffic and aircraft noise in Vietnam. Noise Control. Eng. J. 2016, 64, 243–258. [Google Scholar] [CrossRef]
  11. Nguyen, T.L.; Nguyen, T.L.; Morinaga, M.; Yokoshima, S.; Yano, T.; Sato, T.; Yamada, I. Community response to a step change in the aircraft noise exposure around Hanoi Noi Bai International Airport. J. Acoust. Soc. Am. 2018, 143, 2901–2912. [Google Scholar] [CrossRef] [PubMed]
  12. Trieu, B.L.; Nguyen, T.L.; Thanh Loc, B.; Yano, T.; Hiraguri, Y.; Morinaga, M.; Morihara, T. Assessment of health effects of aircraft noise on residents living around Noi Bai International Airport. In Proceedings of the Inter-Noise and NOISE-CON Congress and Conference Proceedings, Madrid, Spain, 16–19 June 2019; Volume 259, pp. 4973–4982. [Google Scholar]
  13. Bui, T.L.; Nguyen, T.L.; Hiraguri, Y.; Morinaga, M.; Mori, J.; Morihara, T.; Trieu, B.L. Comparing noise contours calculated using existing and measurement-based NPD data for two major airports in Vietnam. In Proceedings of the Inter-Noise and NOISE-CON Congress and Conference Proceedings, Madrid, Spain, 16–19 June 2019; Volume 259, pp. 4963–4972. [Google Scholar]
  14. European Commission. Directive 2002/49/EC of the European Parliament and of the Council of 25 June 2002 relating to the assessment and management of environmental noise. Off. J. Eur. Commun. 2002, 189, 12–25. [Google Scholar]
  15. Survey of Legislation, Regulations, and Guidelines for Control of Community Noise; Final report of the I-INCE Technical Study Group on Noise Policies and Regulations (TSG 3); International Institute of Noise Control Engineering: Shanghai, China, 2009.
  16. Vietnam Standard TCVN 5949-1998; Acoustics—Noise in Public and Residential Areas—Maximum Permitted Noise Level; Ministry of Science and Technology of Vietnam: Hanoi, Vietnam, 1998.
  17. National Technical Regulation QCVN 26: 2010/BTNMT; National Technical Regulation on Noise; Ministry of Natural Resources and Environment of Vietnam: Hanoi, Vietnam, 2010.
  18. Environmental Standards for Noise. Ministry of the Environment, Government of Japan. Available online: https://www.env.go.jp/en/air/noise/noise.html (accessed on 27 March 2020).
  19. Environmental Quality Standards for Aircraft Noise. Ministry of the Environment, Government of Japan. Available online: https://www.env.go.jp/kijun/oto2.html (accessed on 27 March 2020).
  20. Survey on Japanese’s Social Life Demonstrated by Type of Activity and the Percentage of Activity Participant and Corresponding Time Period (for People of 15 Years Old and over) on Weekdays, Homepage of Japan’s Statistical Office, Ministry of Internal Affairs and Communication. Available online: http://www.stat.go.jp/data/shakai/2016 (accessed on 27 March 2020).
  21. International Organization for Standardization. Acoustics—Assessment of Noise Annoyance by Means of Social and Socio-Acoustic Surveys; ISO/TS 15666; ISO: Geneva, Switzerland, 2003. [Google Scholar]
  22. Takamura, S. Economic empowerment of women in Japan. In Proceedings of the 4th Global Forum on Gender Statistics, Dead Sea, Jordan, 27–29 March 2012. [Google Scholar]
  23. KHV Investment and Consulting. [Population Pyramid of Vietnam 2016 (Status as of April 2016)]. Available online: https://kehoachviet.com/thap-dan-so-viet-nam-2016/ (accessed on 27 March 2020).
  24. World Health Organization (WHO). Environmental Noise Guidelines for the European Region; WHO Regional Office for Europe: Copenhagen, Denmark, 2018. [Google Scholar]
  25. European Communities. Position paper on dose-response relationships between transportation noise annoyance. In EU’s Future Noise Policy WG-Dose/Effect; Office for Official Publications of the European Communities: Luxembourg, 20 February 2002. [Google Scholar]
Figure 1. Question format asking the wake-up and go-to-bed times on weekdays and weekends.
Urbansci 04 00019 g001
Figure 2. Hourly average road traffic volume in the day (24 h) observed in Hanoi downtown (2005) and at sites near NBIA (2009), DAD (2011), and TIA (2008).
Urbansci 04 00019 g002
Figure 3. Hourly average frequency of flight operations in the day (24 h) at NBIA (2009, 2017), DAD (2011, 2018), and TIA (2008, 2019).
Urbansci 04 00019 g003
Figure 4. Vietnamese people’s sleeping temporal pattern by region (northern, central, and southern Vietnam).
Urbansci 04 00019 g004
Figure 5. Sex differences in Vietnamese people’s sleeping temporal pattern by region (northern, central, and southern Vietnam) on weekdays.
Urbansci 04 00019 g005
Figure 6. Age differences in Vietnamese people’s sleeping temporal pattern by region (northern, central, and southern Vietnam) on weekdays.
Urbansci 04 00019 g006
Figure 7. Age differences in Vietnamese people’s sleeping time on weekdays.
Urbansci 04 00019 g007
Figure 8. Interaction plots for the go-to-bed time and wake-up time with an interaction effect of age (years; <30 (0), 30–60 (1), >60 (2)) and sex (male (0), female (1)). (a) Wake-up time least-square means; (b) Go-to-bed time least-square means.
Urbansci 04 00019 g008
Figure 9. Comparison of sleeping time between the 2009 and 2017 surveys conducted at Noi Bai airport.
Urbansci 04 00019 g009
Figure 10. Comparison of sleeping temporal pattern between Japanese and Vietnamese respondents.
Urbansci 04 00019 g010
Figure 11. Comparison of breakfast, lunch, and dinner temporal patterns between Japanese and Vietnamese respondents.
Urbansci 04 00019 g011
Figure 12. Exposure–response relationships for road traffic and aircraft noise, synthesized from the data of socio-acoustic surveys in Vietnam compared with those in the European Union position paper (Lden–%HA relationships).
Urbansci 04 00019 g012
Table 1. Vietnamese National Standard “TCVN 5949-1998—Acoustics—Noise in public and residential areas—permitted maximum noise level”.
Land Use in Receiving AreaLA (dB) by Time
6:00–18:0018:00–22:0022:00–6:00
1. Areas that need special quietness: hospitals, libraries, kindergartens, nursing homes, schools, churches, and temples504540
2. Residential areas, hotels, hostels, and administrative offices605550
3. Residential areas that scatter in the areas of commerce, service, and production757050
Table 2. Vietnamese National Technical Regulation on Noise (QCVN 26:2010/BTNMT)—permissible noise limits (in decibel), LA (dB).
No.AreaFrom 6:00 to 21:00From 21:00 to 6:00
1Special areas5545
2Usual (general *) areas7055
* Noted by the authors.
Table 3. Comparison of noise limits for general environmental noise between Vietnam and Japan (dB).
Area CategoryVietnam: Vietnamese National Technical Regulation on Noise 26:2010/BTNMTArea CategoryJapan: Environmental Quality Standard for General Noise
6:00–21:0021:00–6:00Ldn 6:00–22:0022:00–6:00Ldn
Special554555Areas where quietness is specially required (area AA)504050
Usual (general)705569Areas used exclusively for residences (area A) and areas used mainly for residences (area B)554555
Areas used for commerce and industry as well as for a significant number of residences (area C)605060
Area A facing the road with two or more lanes605562
Area B facing the road with two or more lanes, and area C facing the road with one or more lanes656067
Area adjacent to the road carrying arterial traffic (indoor and closed window)70 (45)65 (40)72 (72.4)
Table 4. Japanese Environmental Quality Standards for Aircraft Noise (revised in 2007).
Area CategoryLimit value Lden in dB
I57
II62
Area category I refers to areas used exclusively for residential purposes Area category II refers to other areas
Table 5. List of 11 datasets extracted from the result of the 13 socio-acoustic surveys in Vietnam.
YearCitiesNoise SourceNumber of Responses
2007Ho Chi MinhRoad traffic noise1471
2008Ho Chi MinhAircraft and combination of aircraft and road traffic noise1562
2009HanoiAircraft and combination of aircraft and road traffic noise824
2010HanoiCombination of railway and road traffic noise575
2011Da NangRoad traffic and aircraft noise1020
2012HueRoad traffic and combination of railway and road traffic noise1141
2013Thai NguyenRoad traffic noise813
2014HanoiAircraft noise890
2015.3HanoiAircraft noise1109
2015.4HanoiAircraft noise1286
2017HanoiAircraft noise623
Table 6. Questionnaire items of the surveys.
No.QuestionsAnswer Options
Q1Respondents’ sexMale/female/other
Q2Respondents’ age (years)(1) ≤ 19; (2) 20–30; (3) 31–40 (4) 41–50; (5) 51–60; (6) > 60
Q3Respondents’ occupationStudent, agriculture, full-time job, homemaker, part-time job, other
Q4Number of working hours per week(1) < 15 h, (2) 15 to 29 h, (3) 30 to 34 h, (4) 35 to 39 h, (5) 40 to 48 h, (6) 49 to 59 h, (7) ≥ 60 h, (8) not fixed
Q5Wake-up time on weekdays(0–23 h)
Q6Wake-up time on weekends(0–23 h)
Q7Go-to-bed time on weekdays(0–23 h)
Q8Go-to-bed time on weekends(0–23 h)
Q9Breakfast time(0–23 h)
Q10Lunch time(0–23 h)
Q11Dinner time(0–23 h)
Q12Time and location of daily activities (for each of 30-min time intervals)
Table 7. Respondents’ demographic factors.
RegionCityYearNoise Source SexAge
MaleFemale20s30s40s50s60s70s
SouthHo Chi Minh2007Road trafficn7237374063883241979950
%49.550.527.726.522.113.56.83.4
SouthHo Chi Minh2008Aircraftn4114612242541841146526
%47.152.925.829.321.213.17.53.0
SouthHo Chi Minh2008Road traffic and aircraftn30636621121213167439
%45.554.531.431.519.510.06.41.3
NorthHanoi2009Aircraftn3704301971881881416233
%46.353.824.423.223.217.47.74.1
NorthHanoi2009Road traffic and aircraftn2802751451211351104510
%50.549.525.621.423.919.48.01.8
NorthHanoi2010Railway and road trafficn23424288103881037332
%49.250.818.121.118.121.115.06.6
CenterDa Nang2011Aircraftn245276113138131744223
%47.053.021.726.525.114.28.14.4
CenterDa Nang2011Road trafficn2372411419199793934
%49.650.429.218.820.516.48.17.0
CenterHue2012Railway and road trafficn2963271471071101188260
%47.552.523.617.117.618.913.19.6
NorthThai Nguyen2013Road trafficn3884091812031461448742
%48.751.322.525.318.217.910.85.2
NorthHanoi2014Aircraftn41234917320618015310252
%54.145.920.023.820.817.711.86.0
NorthHanoi2015.3Aircraftn56150824624926117212645
%52.547.522.422.723.715.711.54.1
NorthHanoi2015.9Aircraftn61263529628726622212868
%49.150.923.422.721.017.510.15.4
NorthHanoi2017Aircraftn294321831331471099855
%47.852.213.321.323.517.415.78.8
Totaln5369557726512680239018031091539
%49.051.023.824.021.416.29.84.8
Demographics of Vietnam (%) (2014)%49.350.727.623.219.515.014.7
Table 8. Comparison between the least-squares means of go-to-bed time and wake-up time by age, sex, region, and day.
ItemEffectCategoryLeast Sq. MeanStd. ErrorMean
Wake-up timeAge (years)<30 (0)6.40.0166.4
30–60 (1)5.80.0105.7
>60 (2)5.30.0225.2
SexMale (0)5.80.0135.9
Female (1)5.80.0135.8
RegionNorth (0)5.60.0125.6
Central (1)5.60.0195.7
South (2)6.20.0196.3
DayWeekdays (0)5.70.0135.7
Weekends (1)6.00.0146.0
Go-to-bed timeAge (years)<30 (0)22.60.01522.6
30–60 (1)22.30.01022.3
>60 (2)22.00.02021.9
SexMale (0)22.30.01222.3
Female (1)22.30.01222.3
RegionNorth (0)22.10.01122.2
Central (1)22.10.01722.1
South (2)22.60.01722.7
DayWeekdays (0)22.30.01222.3
Weekends (1)22.30.01222.4
Table 9. Analysis of variance for the effects of age (<30, 30–60, >60 years), sex (male, female), living region (northern, central, and south), and day (weekdays and weekends) on wake-up and go-to-bed time.
ItemSourceNparmDFSum of SquaresF RatioProb > F
Wake-up timeAge222190.0940.8<0.001
Sex1113.211.3<0.001
Region22675.7290.3<0.001
Day11300.4258.1<0.001
Age*Sex2240.917.6<0.001
Age*Region4436.07.7<0.001
Age*Day2254.023.2<0.001
Sex*Region2211.24.80.008
Sex*Day110.90.80.379
Region*Day220.70.30.742
Go-to-bed timeAge22732.9380.9<0.001
Sex1114.014.5<0.001
Region22657.1341.6<0.001
Day1126.727.8<0.001
Age*Sex221.91.00.371
Age*Region4416.24.20.002
Age*Day224.32.30.105
Sex*Region229.34.90.008
Sex*Day110.30.30.582
Region*Day220.50.30.773
A*B: interaction effects of A effect and B effect.
Table 10. L den , L dn , and L day L night noise indicator values when different time interval segmentation was adjusted.
Survey SitesInterval Segmentation Proposed by This StudyInterval Segmentation Consistent with QCVN 26:2010/BTNMTInterval Segmentation Consistent with TCVN 5949-1998
6–2222–6Ldn6–2121–6Ldn6–1818–2222–6Lden
NBIA (2017)
NBIA-151.046.853.951.047.554.751.150.746.854.6
NBIA-250.746.653.750.647.454.450.850.146.654.3
NBIA-357.454.361.157.354.961.857.457.154.361.7
NBIA-458.055.261.957.956.062.857.858.655.262.6
NBIA-571.868.675.571.769.176.271.771.368.676.1
NBIA-650.344.152.150.345.152.950.549.244.152.9
NBIA-761.257.164.361.357.264.761.659.157.164.8
NBIA-861.958.865.862.058.966.162.359.458.866.2
NBIA-961.258.365.061.358.365.361.559.858.365.4
NBIA-1055.752.659.455.952.659.756.253.752.659.8
NBIA-1154.451.858.454.551.858.754.753.251.858.9
NBIA-1233.830.237.534.030.337.833.531.630.238.2
NBIA-1334.628.637.734.828.537.835.229.528.638.0
DAD (2018)
DAD-145.141.848.645.142.249.245.742.541.848.9
DAD-250.648.454.950.549.055.750.850.548.455.5
DAD-353.551.157.653.451.658.353.752.651.158.1
DAD-563.061.768.062.762.569.062.464.561.768.6
DAD-656.258.364.056.457.263.556.555.358.364.2
TIA (2019)
TIA-160.758.565.060.659.065.660.461.558.565.6
TIA-263.160.767.263.061.267.962.863.760.767.9
TIA-574.771.778.474.672.379.174.575.271.779.1
Table 11. Aircraft movement distribution at NBIA, DAD, and TIA in different time intervals.
Survey Interval Segmentation Proposed by This StudyInterval Segmentation Consistent with QCVN 26:2010/BTNMTInterval Segmentation Consistent with TCVN 5949-1998All Day
6–2222–66–2121–66–1818–2222–6
NBIA (2017)Landing17336157521254836209
Take-off17437168431393537211
DAD (2018)Landing95288934712428123
Take-off1053410336852034139
TIA (2019)Landing28777265992147377364
Take-off30856294702446456364

