Communication

Revisiting Acoustics Education Using Mobile Devices to Learn Urban Acoustic Environments: Recent Issues on Current Devices and Applications

1
Environmental Acoustics Laboratory, Department of Architecture, Graduate School of Engineering, Kobe University, Kobe 657-8501, Japan
2
Department of Architecture, Chiba Institute of Technology, 2-17-1 Tsudanuma, Narashino, Chiba 275-8588, Japan
3
Faculty of Design, Kyushu University, 4-9-1 Shiobaru, Minami, Fukuoka 815-8540, Japan
*
Author to whom correspondence should be addressed.
Urban Sci. 2019, 3(3), 73; https://doi.org/10.3390/urbansci3030073
Submission received: 19 June 2019 / Revised: 9 July 2019 / Accepted: 9 July 2019 / Published: 17 July 2019
(This article belongs to the Collection Urban Acoustic Environments)

Abstract

:
In this paper, we revisit the acoustics education program using mobile devices to better understand urban environments. We begin with a summary of our past projects to demonstrate a model case of the concept. In these projects, the output was mainly supposed to be a noise map with measured sound pressure levels (SPLs) and sound spectra. This methodology can obviously be applied to larger-scale urban studies. Including measured sound spectra can be another advantage. Next, current problems in measurement accuracy due to recent device developments are explained and the required examinations are stated. Finally, the accuracy of the current versions of the applications as well as recently available devices are discussed. The results of this study provide information regarding the measurement accuracy of mobile devices, and some suggestions for their practical use are given, which are also useful for additional studies pertaining to the urban acoustic environment.

1. Introduction

1.1. Background

Introductory urban acoustics education to better understand the urban acoustic environment is part of the curriculum in various university departments related to environmental studies (e.g., architecture, building sciences, urban/regional planning, environmental sciences, etc.). In such educational programs, urban acoustics education is studied as a part of urban studies, and the soundscape-based method is often employed [1,2]. For example, in departments related to architecture and civil engineering in Japan, 10% of acoustics classes include “soundscape” as a keyword in the syllabi [3]. Even if it is not mentioned clearly, it is common practice to use a similar method in “sound education” [2] in various classes related not only to acoustics but also to architectural/urban (regional) planning. It is mainly used for awakening students’ interest in the sounds of the indoor and outdoor environments around them. An introductory teaching program of this type usually suggests that students make a simple “sound map” to record where and when they hear sounds, what the sounds are, and their impression of the sounds, or to list them in a table [1,2,4]. This is effective in many cases for students to learn and be aware of how a city environment sounds. It can increase students’ interest in typical indoor and outdoor noise problems, which are often dealt with by novel ideas based on soundscape techniques [5,6,7,8,9]; e.g., road traffic noise, neighboring noises in urban areas, and indoor acoustic environments of various built environments, such as schools or public buildings. In this way, students will learn about the acoustic environment, and eventually the urban environment as well, by knowing those noise problems.
On the other hand, there are also engineering-oriented courses on architectural/environmental acoustics in architectural and environmental departments of universities. In the curricula of these engineering disciplines, the basics of the physical criteria of sound, such as sound pressure level (SPL), frequency spectra, etc., are taught in typical textbooks (e.g., [10]). In this case, for a more profound understanding, it is better for students to obtain a clear idea of the relationship between their impression and a physical measure (e.g., sound pressure level, etc.). Often this is explained in a classroom, possibly with a demonstration; however, the idea is limited to some typical but abstract cases. It is useful for students to make measurements in situ where they hear particular sounds in daily life. In this way, it is expected that students will take this opportunity to discuss their surrounding sound environment not only qualitatively, but also quantitatively.
Considering the above situations, we proposed an introductory teaching program of urban acoustic environments using a mobile device (hereafter, this term is used for both smartphones and tablets) with applications for acoustic measurements [11,12,13]. In these studies, the outcome was supposed to be a map with the following characteristics: comments on the acoustic environment at some specific points, in a certain area in a city, where a characteristic sound was heard, and its physical measurement data (e.g., sound spectra and A-weighted sound pressure levels) measured by mobile device (iOS) applications [11,12]. This is a kind of simple sound map describing urban acoustic environments. By adding the measured value of, for example, SPL at various points, typical physical phenomena such as attenuation due to the shielding effect by other buildings can be understood by looking at the SPL data recorded on the map [11]. Also, sound spectrum data give clearer characteristics of the sound heard. If such an outcome is expected in introductory acoustics courses, many professional measurement apparatuses are needed; however, in many cases it is not realistic to provide all students with professional instruments to use freely, considering the number of students and the cost involved. Instead, mobile devices allow students to easily carry out tasks with their own smartphones, which almost never require additional cost to prepare the materials for the course studies.
The demand for introductory acoustics education has increased not only in universities but also in primary schools. In Japan, scientific aspects of sound are taught in science courses in primary, junior high, and high schools, and the acoustic environment and its relationship with life has long been included as a topic in junior high school home economics curricula, according to the guidelines for the course of study for junior high schools by the Ministry of Education, Culture, Science, and Sports [14]. However, now it has moved to primary schools under the title “Life and Sounds” according to the new guidelines for primary school home economics [15]. In the commentary for the guidelines, there are suggestions such as “[learning] how to devise to live comfortably by taking up domestic and neighbouring sounds,” “measuring the sounds in the school and feel and understand their intensity,” etc. [16]. These suggestions seem to be somewhat relevant to urban and indoor soundscape studies. Textbooks pertaining to teaching methods for home economics in primary schools that are used in university educational departments include these topics; in one, the use of smartphone applications for sound level measurement is suggested [17]. In response to this, there is a growing discussion on teaching methods using mobile devices, mainly tablets. For example, Kawahara et al. [18] developed teaching materials using iPads. In their program, pupils are supposed to “collect” various sounds in their school using iPads by taking videos and playing them back for other pupils to identify the sounds in “quiz” style. The program helps pupils become aware of the various sounds in their environment, and this is closely related to indoor soundscapes. Similar educational activities (without recording) were introduced in [4,19]. In these programs, no measurements were made; however, they can be accompanied by measured SPL, etc., in possible future studies. As above, in many cases, acoustics education is closely related to a soundscape-based approach, and through this one can learn various acoustical problems.

1.2. Urban Acoustic Environmental Research Using Mobile Devices: State of the Art

The use of mobile devices, e.g., smartphones, tablets, etc., has been studied mainly for sound map studies. These mobile devices are small and handy, thus can be effectively used to make sound maps, etc. For example, Kanjo [20] developed an original application called Noise SPY for smartphones, which can turn a smartphone into a data logger to record instantaneous SPLs and corresponding positions (using GPS). The data can be used to produce a sound map quite efficiently. The application was calibrated with a precise measurement system by comparing the recorded levels. In the same paper, example data were collected with this application by participants moving on a bicycle, and a challenge is pointed out, e.g., there are some discrepancies in the measured data by the effect of the movement of the person on the bicycle taking measurements. However, in general, this study is one of the most inspiring works on the application of mobile devices for urban acoustic environment studies.
Another example, with a detailed preliminary accuracy test and discussion, is reported by D’Hondt et al. [21]. They used mobile phones to take SPL measurements for participatory noise mapping and stated the requirement for applying SPL measurement. They used a certain Nokia model with their in-house NoiseTube sensing system and checked the measurement accuracy in detail. Similar studies using smartphones for noise mapping have been reported (for example, see [22,23,24,25]). The accuracy of the results when using a mobile phone for large-scale participatory noise sensing was also studied by Aumond et al. [26]. Can et al. [27] reported that using mobile devices to collect noise data is better than using the interpolation method to produce noise maps, so the use of smartphones and tablets may be growing.
However, with the rapid development of mobile devices, continued observation of measurement accuracy is necessary. In the works mentioned above, original applications were used. However, in our previous work [11,12,13], we used commercial applications. In this case, the measurement accuracy of the applications also needs to be continuously checked: The results of the accuracy tests of our previous work may no longer be applicable to verify currently available tools even for educational purposes in a quantitative sense. A simple pilot examination showed that the measured values by some devices show quite large discrepancies compared with those of class 1 sound level meters (SLMs). Therefore, we should revisit the accuracy of acoustics measurement by using current devices with new applications.
It should be noted that the requirement for measurement accuracy depends on the purpose. When quantitative evaluation is desirable, accuracy counts. However, in primary or secondary education, for example, relative values for comparison with perceptive differences can be useful. The present work is directed toward professional courses in higher education, thus it is supposed that measurement accuracy is highly desirable.

1.3. Outline of the Present Work

In this paper, we first give an outline of our past projects to illustrate a model case of the basic idea of the work in Section 2. In these projects, the output was basically supposed to be noise maps with measured SPLs and sound spectra, with subjective comments. This procedure could be applied to larger-scale urban acoustic environment studies. Including the measurement of sound spectra can be another advantage. Next, the present problems, due to recent developments in devices and applications, are explained and required examinations are given in Section 3. Finally, the accuracy of the current versions of the applications as well as several types of recently available devices are discussed in Section 4. Although this study is primarily aimed at acoustics education in schools at various levels, as the program supposes a simple sound map as the output to help students to understand urban as well as indoor and outdoor acoustic environments in various spaces (also as a part of urban studies), it will also be applicable to studies of urban soundscapes and similar studies on a larger scale using mobile devices.

2. Summary of Previous Results from This Project

In this section, we summarize the main results of our previous studies on acoustics education using smartphones to introduce and provide the basic idea of the concept and output of this project. It will also be useful to understand the current problems, which are detailed in the next section. Note that the results of the accuracy testing presented in this section were obtained from iOS devices used in 2012–2016 and are not applicable to current models and are presented here for comparison.

2.1. Main Results from the Initial Project (2012–2014)

2.1.1. Devices and Applications Employed in the Project

There are two types of mobile devices (i.e., smartphones, tablets, etc.): iOS devices (iPhones, iPads, etc.) and Android devices. In many cases the same application is available for both. Therefore, we examine the accuracy of acoustic measurements of both types.
When choosing applications, simple, easy-to-use, and easily purchasable applications for sound pressure levels (SPLs) and power spectrum measurement are needed. In selecting the applications, two points were considered: (1) Inexpensive, i.e., affordable for students; and (2) SPL measurement with calibration function. After some preliminary tests, SPL Meter (Studio Six Digital [28], now available from Andrew Smith [29]) for SPL measurement (A- and C-weighted), and bs-spectrum (Bismark) [30] for sound power spectrum measurement were selected for this project. Before using them in practice, an accuracy test is necessary. The results of accuracy testing of various applications and devices have been reported [31]; however, only the accuracy of overall SPL with A and C weighting was tested in that study. In many cases, this is good, as they are typically used for measurement in urban acoustic problems. However, to clarify the characteristics of the applications and devices, detailed testing including the frequency response of their sensitivity is useful.
In order to examine the accuracy of these applications and devices, first measured SPL values by SPL Meter on iOS and Android devices was tested. The measured SPL values were compared with those measured by a class 1 SLM (Ono Sokki, LA-4350). The test was performed in an anechoic chamber. A broadband noise was emitted from a loudspeaker. Then, using the calibration function of SPL Meter, calibration was made so that it showed the same level as the class 1 SLM. After this calibration, 1/1 octave band noises (125–4 kHz) were measured by both the class 1 SLM and the smartphones (both with A-weighting). The details of the testing method are summarized in Appendix A. An example of the test results is shown in Figure 1.
As for Android devices, several models from different manufacturers were tested, of which an example (Xperia SO-01C, Android OS 4.2) is shown in Figure 1b. The measurement values were widely scattered and showed somewhat large discrepancies with the class 1 SLM at many frequencies; a trend of higher values than the class 1 SLM was observed. In the testing, individual differences were observed between models. As shown in Figure 1b, nonlinearity was observed for many devices. Therefore, we had to conclude that Android devices would not be suitable for this project because they were not expected to obtain accurate results.
On the other hand, iOS devices (iPhones, iPads, iPod Touch, etc.) showed better agreement with the class 1 SLM. An example of the comparison results is shown in Figure 1a (iPhone 4, iOS 5.0). Although the iOS devices tend to give lower values at the 125 Hz band and for noises lower than 40 dB(A), the error is within a few decibels at other frequencies and levels. Therefore, SPL Meter on iOS devices can be reasonably accurate and was used for the present purpose. The discrepancies in the 125 Hz band observed in the results from iOS devices were inferred to be attributed to the properties of the preamplifier in the devices.
Regarding the sound power spectrum measurement application, iOS devices with bs-spectrum only were examined. In an anechoic chamber, the same sound was measured by iOS devices with bs-spectrum and reliable PC software for professional use. Then the measured results were compared. Figure 2 shows an example of the measured results. At low frequencies (lower than 100 Hz), discrepancies were observed, but in other frequency ranges the result by bs-spectrum on an iOS device was considered to be accurate, and it was concluded that it could be used for the present purpose.
Also, considering the outdoor measurement, a windscreen was made with a block of plastic foam, and its effect was examined. From the results of the examination, it was confirmed that it hardly affected the measured level and was effective at avoiding the influence of wind if the wind speed was less than 6 m/s.

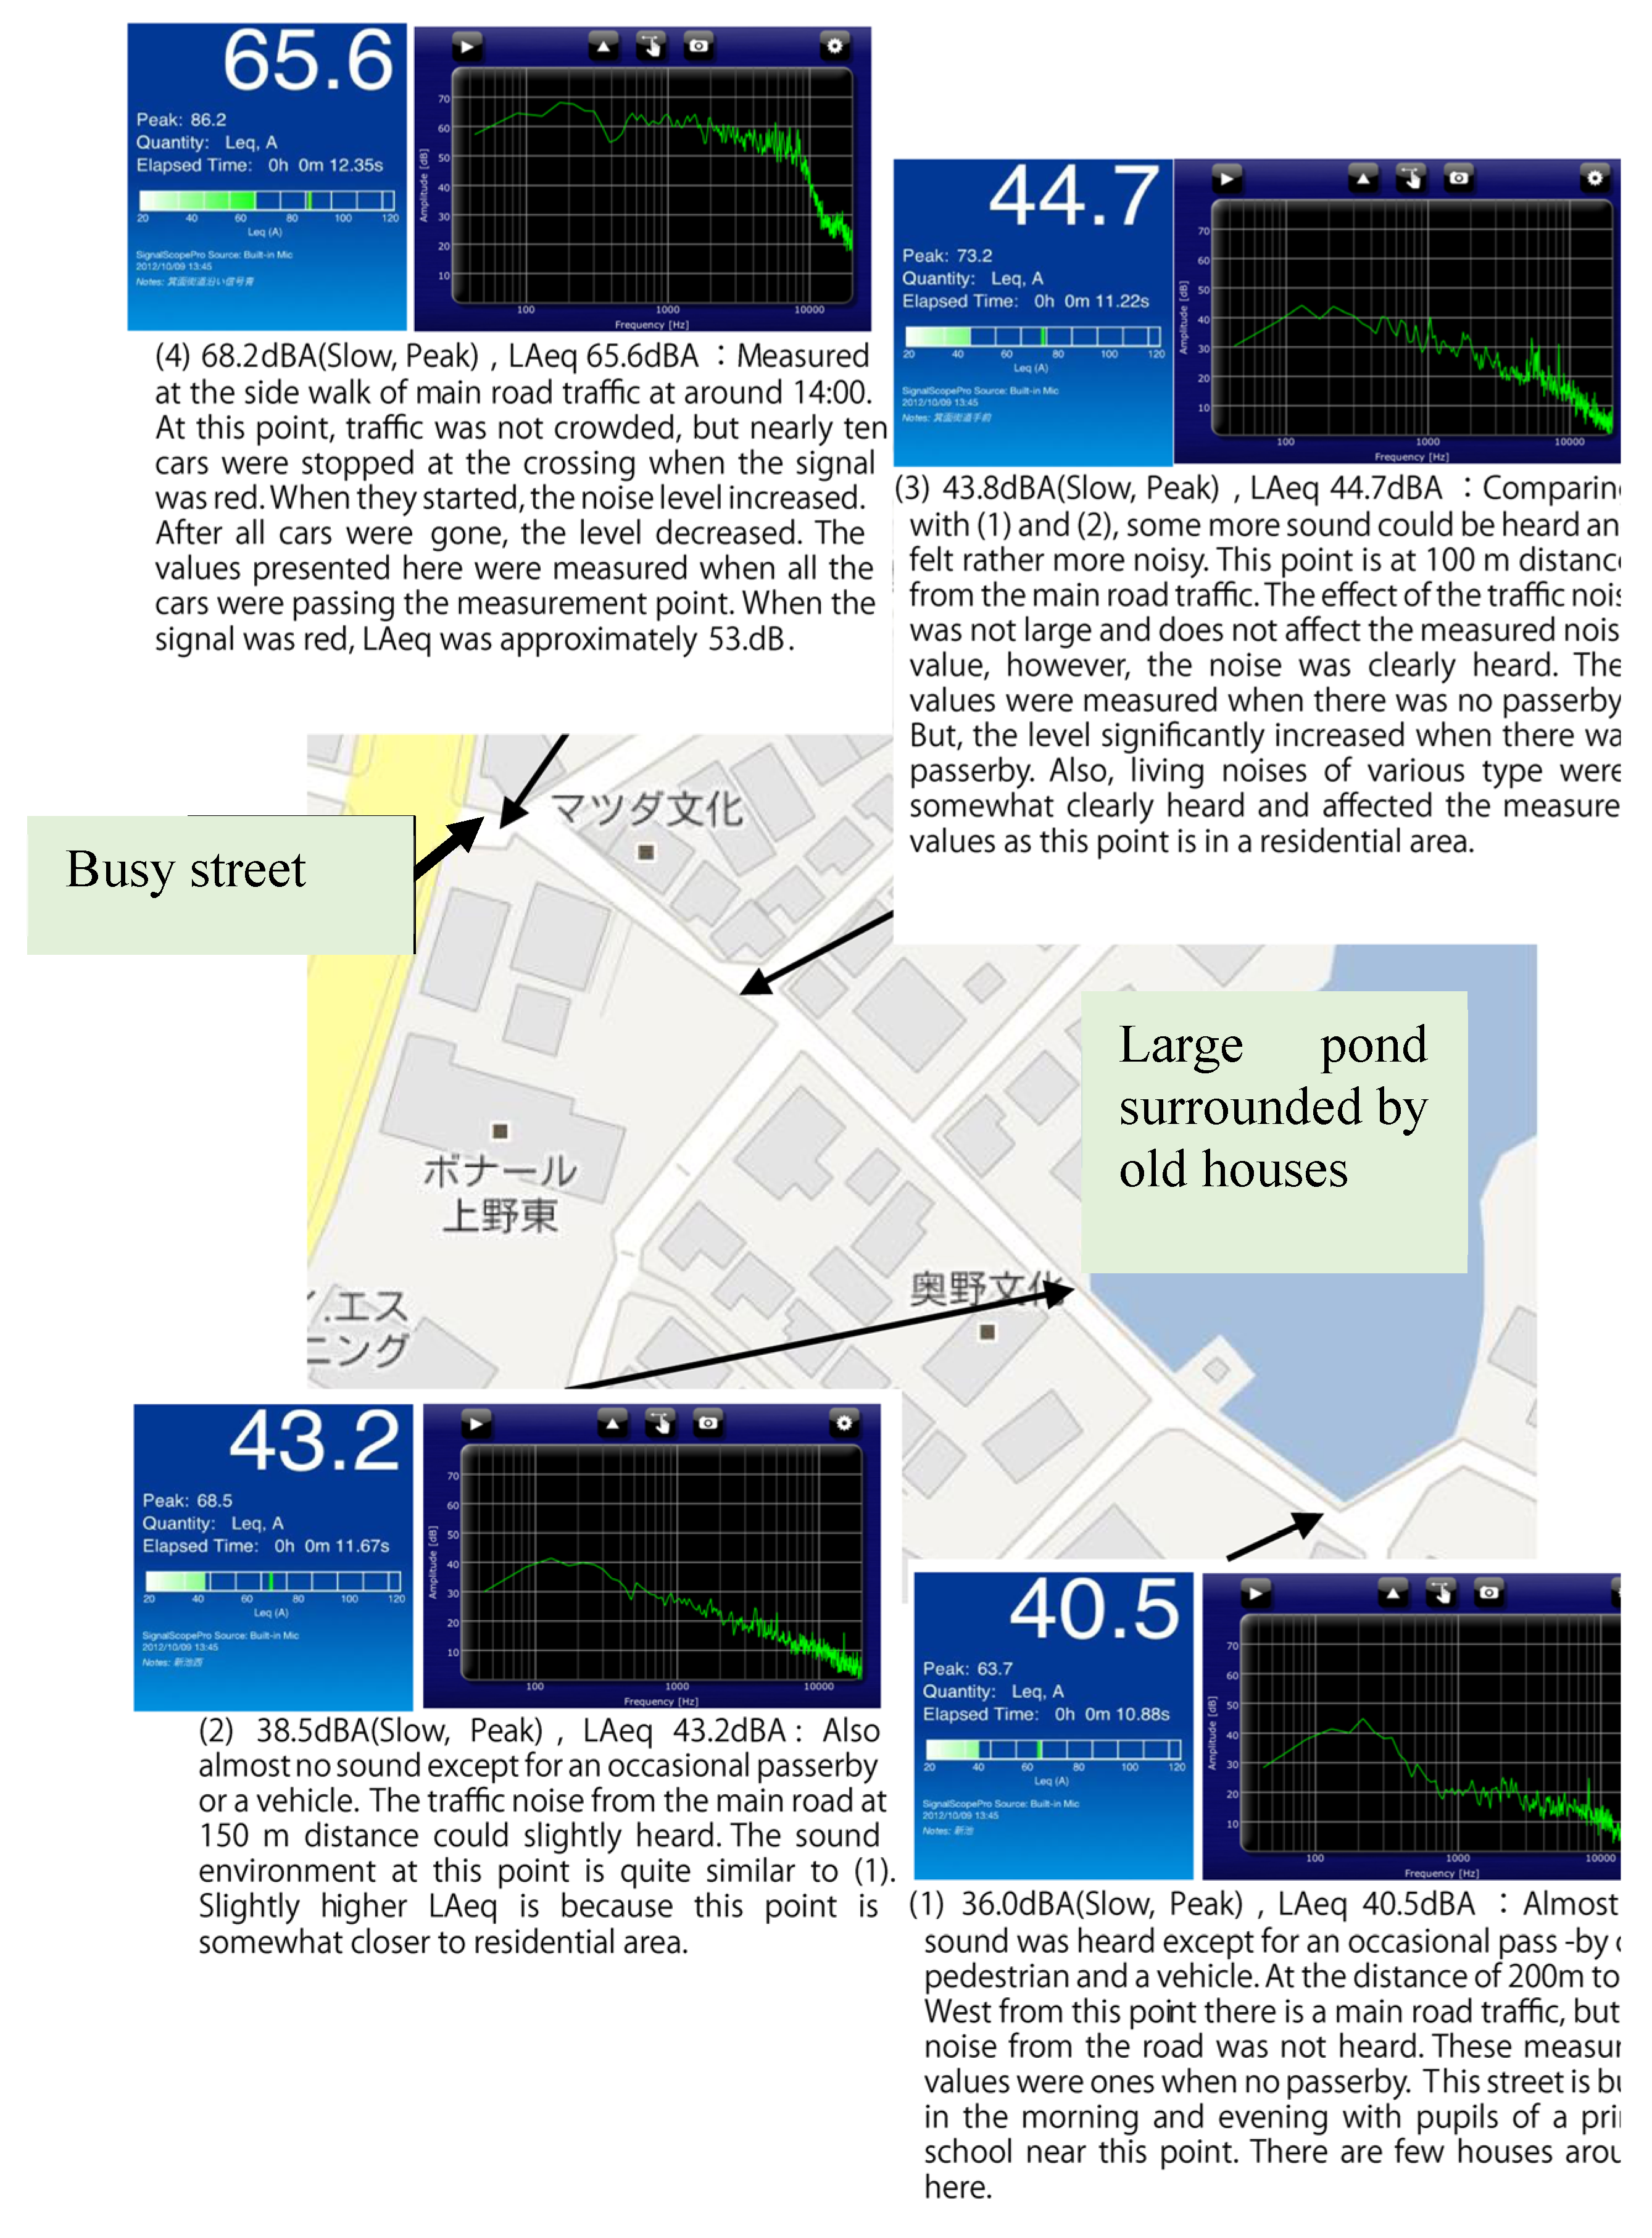
2.1.2. Procedure and Examples of Students’ Work

After the examination above, it was decided to use iOS devices (iPhone, iPod Touch, iPad Mini, etc.) only with SPL Meter and bs-spectrum, and, as a trial, students were asked to carry out some measurement exercises:
Step 1: Calibrate SPL Meter by comparing with class 1 SLM. (Requires supervision by instructor.)
Step 2: Choose field of measurement.
Step 3: Walk in the field, and when you hear a characteristic sound, make a measurement there.
Step 4: Record measured results and subjective impression of the acoustic environment in a note.
Step 5: Make a sound map after the survey by putting the results and comments on a map.
There are two types sound map: One indicating only noise levels, and one indicating both noise levels and power spectra.
Related to the indoor acoustical environment, students performed an additional task:
Discuss the sound insulation effect of a window by comparing A- and C-weighted SPL.
The sound map with sound spectra is perhaps significant, as it can be used to observe the physical nature of a perceived sound directly. A typical example is presented in Figure 3. In this work, measurements were made in a residential area. Measurement points were chosen to be places that were considered to be different sound environments with significant subjective features: It was expected that students could find various features of sound spectra. After the measurement, the students understood not only the differences of the sound environment among the points from the noise levels, but also subjective features of various sounds from the spectra. This experience can also inspire interest in various nonacoustical characteristics of residential areas, etc. As the student work was carried out within a limited time frame, the output sound maps were limited to a small area, but the method can be applied to larger urban areas.

2.2. Basic Studies on the Use of Advanced Applications (2015–2016)

The preceding subsection summarized our basic studies and trial tests conducted during 2012–2014 [11,12]. From the above results, an acoustics education with mobile devices was confirmed to be potentially effective, even though SPL and power spectra are measured. However, in order to have a more detailed discussion, more advanced measurement was considered to be useful. For example, Leq can be useful for evaluating fluctuating noise such as road traffic noise, railway noise, etc. For this purpose, the results of preliminary tests of Signal Scope Pro 7 (Faber Acoustics), an application that measures Leq, were introduced [32].
This is a sophisticated multifunctional acoustic measurement application that includes SLM (A-, C-, and Z-weightings and integration function for Leq), FFT analyzer (line spectrum, 1/1-, and 1/3-octave band levels) and an oscilloscope. We considered using this application as the second step of the project, though it is somewhat expensive. Before using it, the measurement accuracy of Leq(A) was tested by the same method as that employed to test SPL Meter in Section 2.1.1. An example of the comparison results is shown in Figure 4.
As long as the low-range mode was used in the application, the measured results were in good agreement with those by the class 1 SLM, therefore, it was confirmed that this application could be used for acoustics education.
An example of possible output from the teaching program using this application is shown in Figure 5. It is similar to Figure 3, but in this example Leq(A) is used instead of L(A) slow peak.
Using Leq instead of L(A) can help students measure the noise level when it fluctuates strongly. Of course, one should be careful to avoid an occasional sudden strong noise that does not characterize the acoustic environment of the measurement point. A disadvantage of this application is that it is much more expensive than SPL Meter. Recent free applications such as SLA Lite enable users to measure Leq, but the integration time is limited [33]. Its accuracy on various devices in measuring environmental noise (over all values) was compared with the class 1 SLM and analyzed statistically [34], but a detailed analysis of details of the errors, such as frequency dependence, was not done. However, at least that study provides evidence of its accuracy in 2015.

3. Recent Issues: Problems with Current Devices and Applications

With the rapid development of iOS devices (as well as operating systems) and applications, and emerging new applications, the results of the accuracy tests in previous studies are no longer applicable. For example, the low sensitivity to low-frequency sound was improved in new models of iOS devices. Also, after the microphone characteristics of iOS devices were publicized, some applications adjusted the sensitivity and removed the calibration function
However, we saw that sound level measurement applications such as SPL Meter, which was used in the initial project, showed strongly biased values and could not be calibrated when used with iPad series. The bias is different depending on the model and type of iPad. Note that one version of SPL Meter is bundled in Audio Tools [28], an application suite for various acoustic measurements, and can be calibrated through the general settings, but another version of SPL Meter does not have the calibration function. The accuracy problem will occur with the latter version. A simple pilot test measuring overall A-weighted SPL of a pink noise by SPL Meter without calibration in an iPad Air (March 2019) showed maximum discrepancy of 14 dB compared with the value measured by the class 1 SLM. The discrepancy became much smaller by calibration, but the maximum error was more than 1.1 dB. Also, a tendency of error fluctuation of measured sound depending on the SPL was observed, which suggests that there is some nonlinear behavior in the device itself, as SLA Lite, which had a much smaller error, showed similar nonlinear behavior. This nonlinear tendency was hardly observed in iPhone 8 and XS as long as the measured sound was larger than 40 dBA. Considering this tendency, using iPads for acoustics education seems to need careful attention if quantitative discussion is important. In order to clarify this tendency, a detailed examination of the measurement accuracy of these applications on iPad family devices is required.
As mentioned in the introduction, in the near future, tablets will be used much more for acoustics education as part of home economics in primary schools in Japan, and measurement accuracy tests of current devices and applications will be necessary.

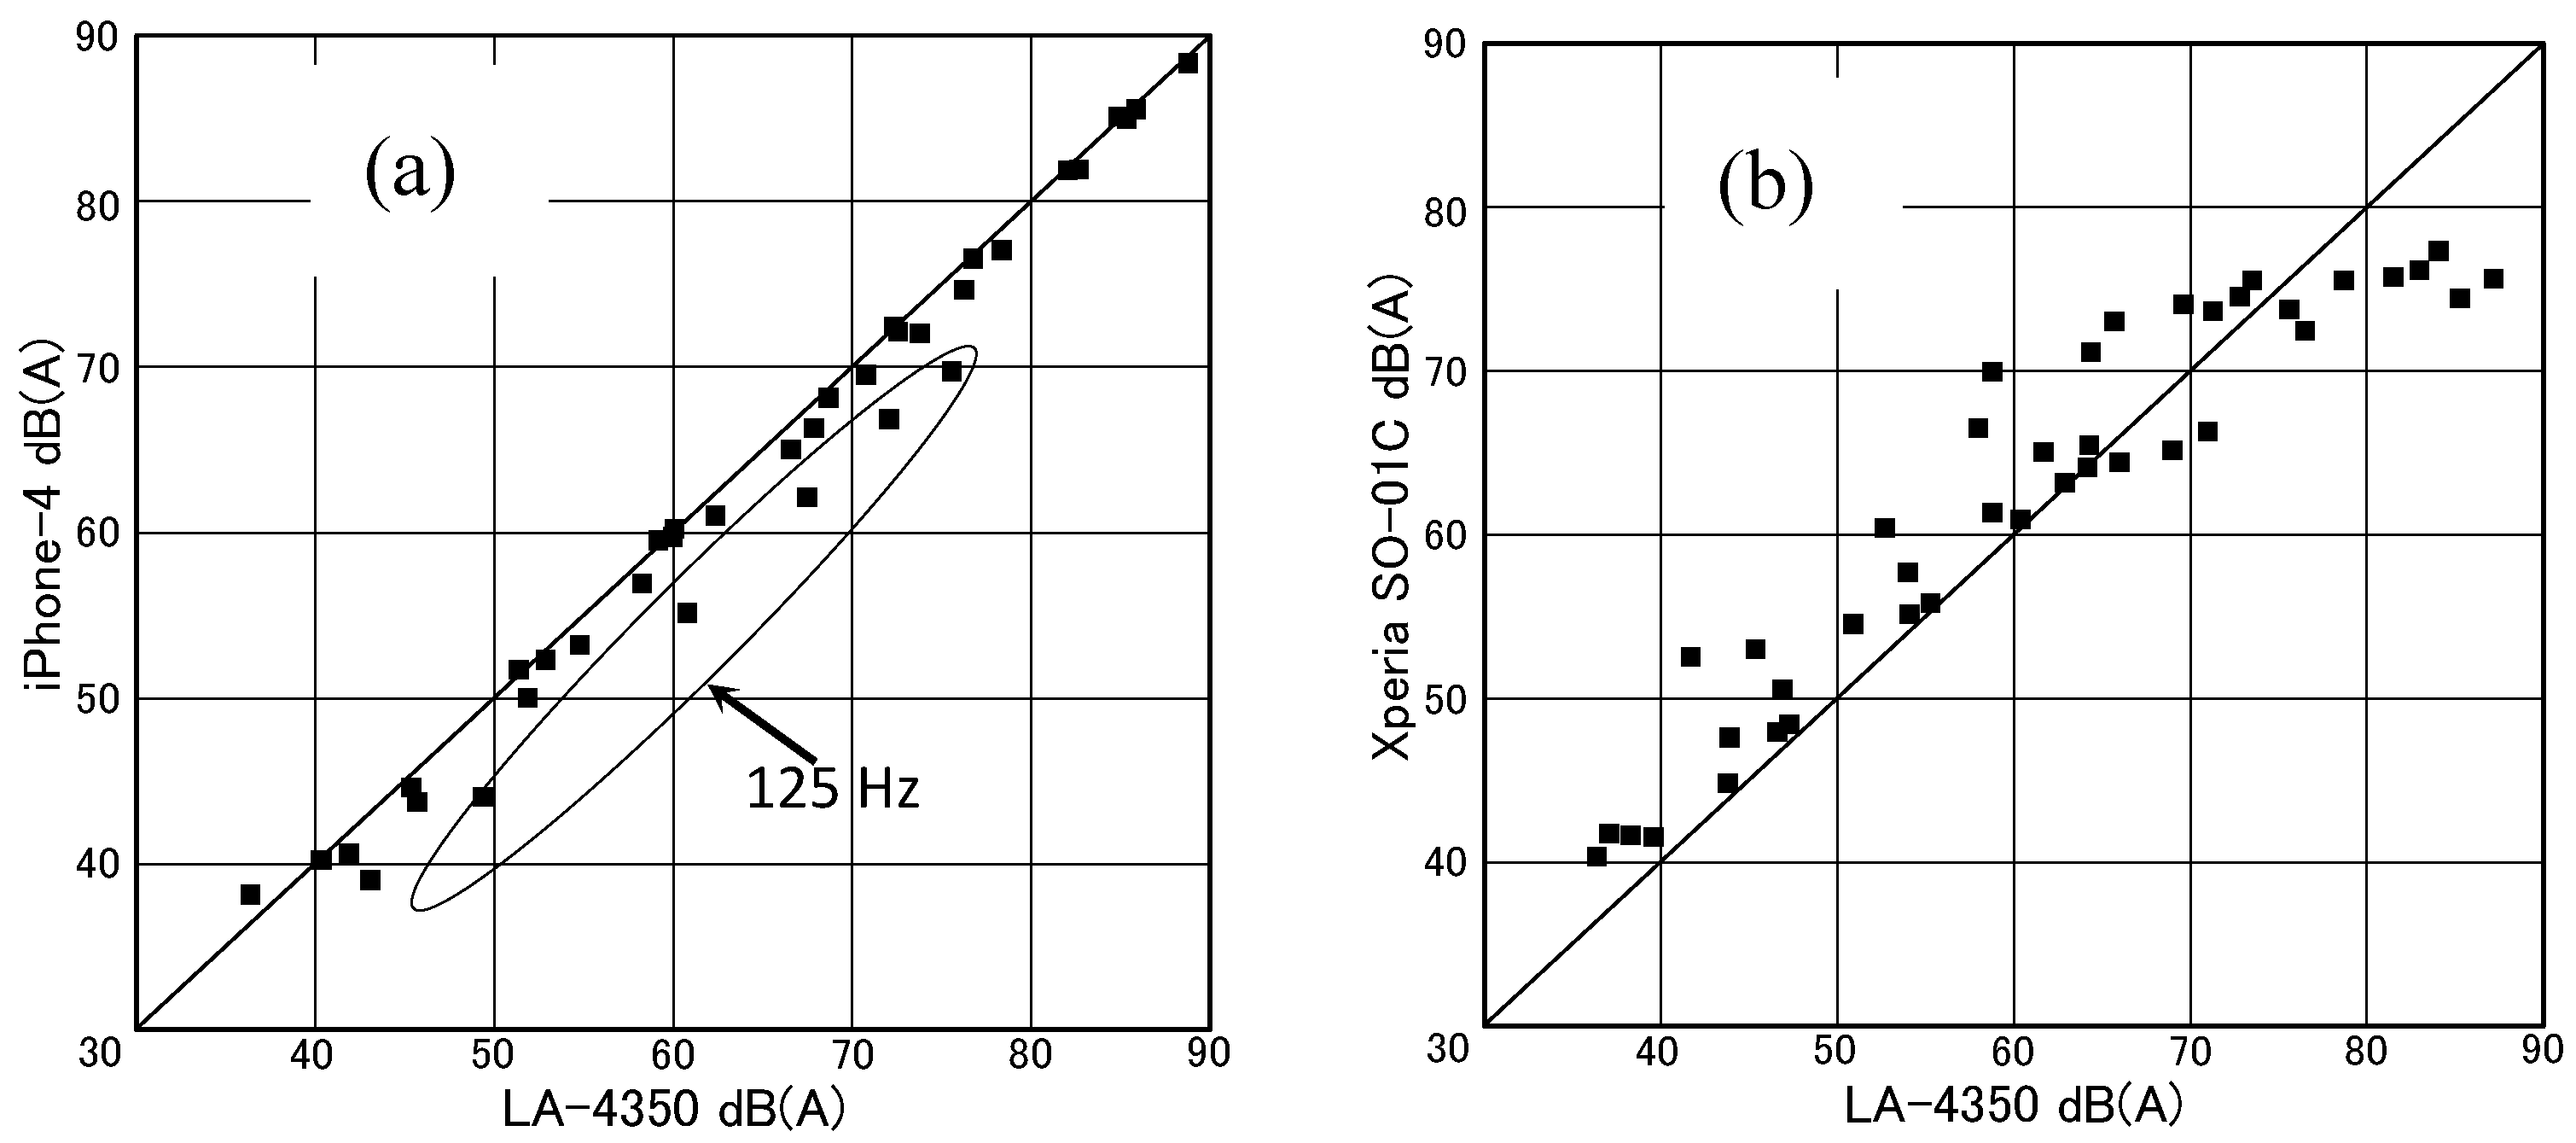
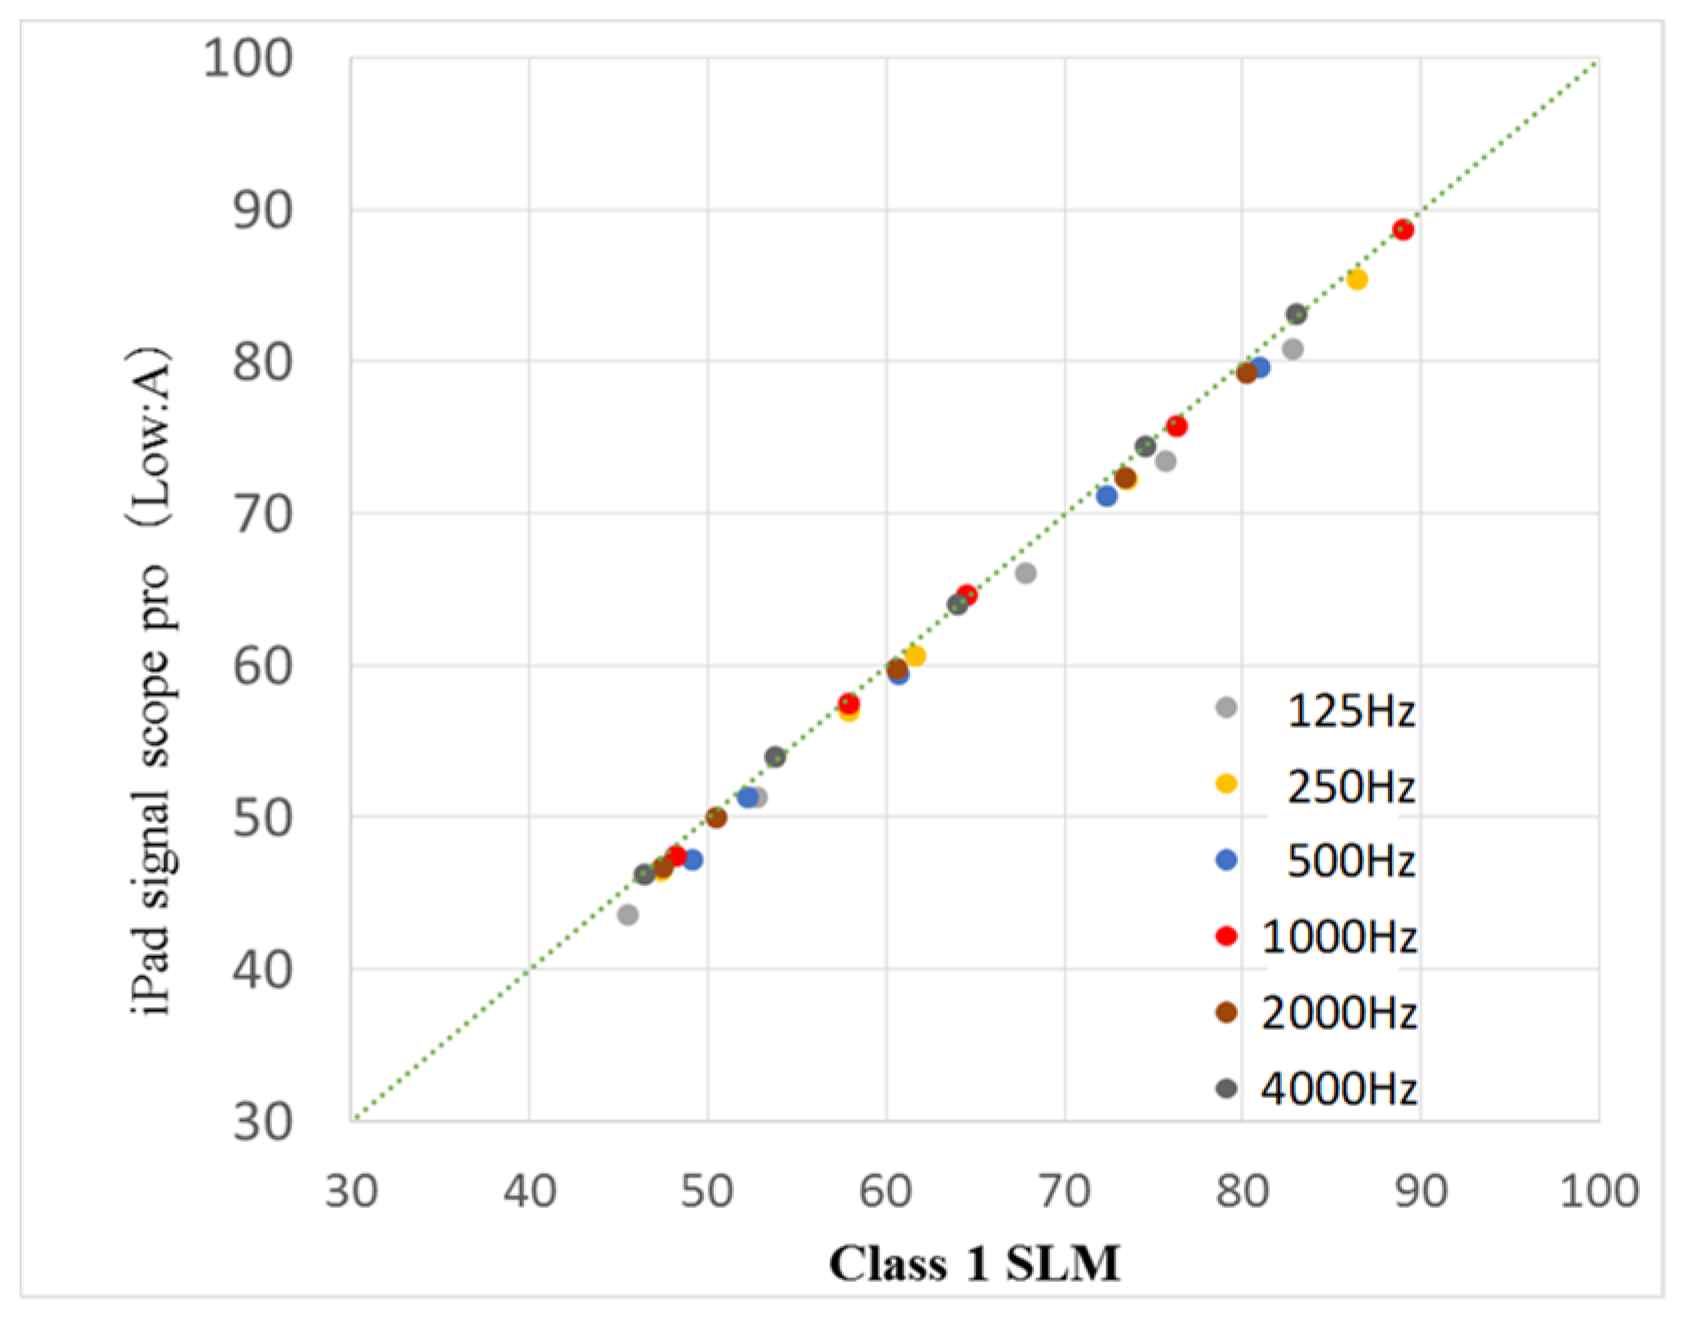
4. Measurement Accuracy Tests of Current Devices and Applications

In this section, results of accuracy tests of current devices and applications are presented and discussed. In the accuracy tests, typical currently available devices were examined: iPhone8, iPad (2017 and 2018), iPad Pro (2016), and iPad Mini (2015, 2019). Well-known SPL measurement applications that are currently available were used: SPL Meter (Andrew Smith, separate version, not bundled with Audio Tools, without calibration function) and SLA Lite (Toon LLC, with calibration function). A standardized class 1 SLM (Rion, NL-62) was used for reference. In this test, other current devices were also tested, and similar results were obtained.
First, for calibration of SLA Lite, 1 kHz 1/1-octave band noise was emitted from a loudspeaker, for which the SPL was set to approximately 60 dB(A) at the measuring point in a semi-anechoic chamber. For this noise, at the measuring point, Leq(A) (10 sec) was measured by both the class 1 SLM and SLA Lite on mobile devices. Using the difference of measured values between the class 1 SLM and mobile devices, SLA Lite was calibrated (in all devices) by setting the trimming value in its calibration function.
The test was performed according to the following procedure:
(1)
First, 1/1-octave band noises of the center frequencies from 125 to 4 kHz were emitted from the loudspeaker.
(2)
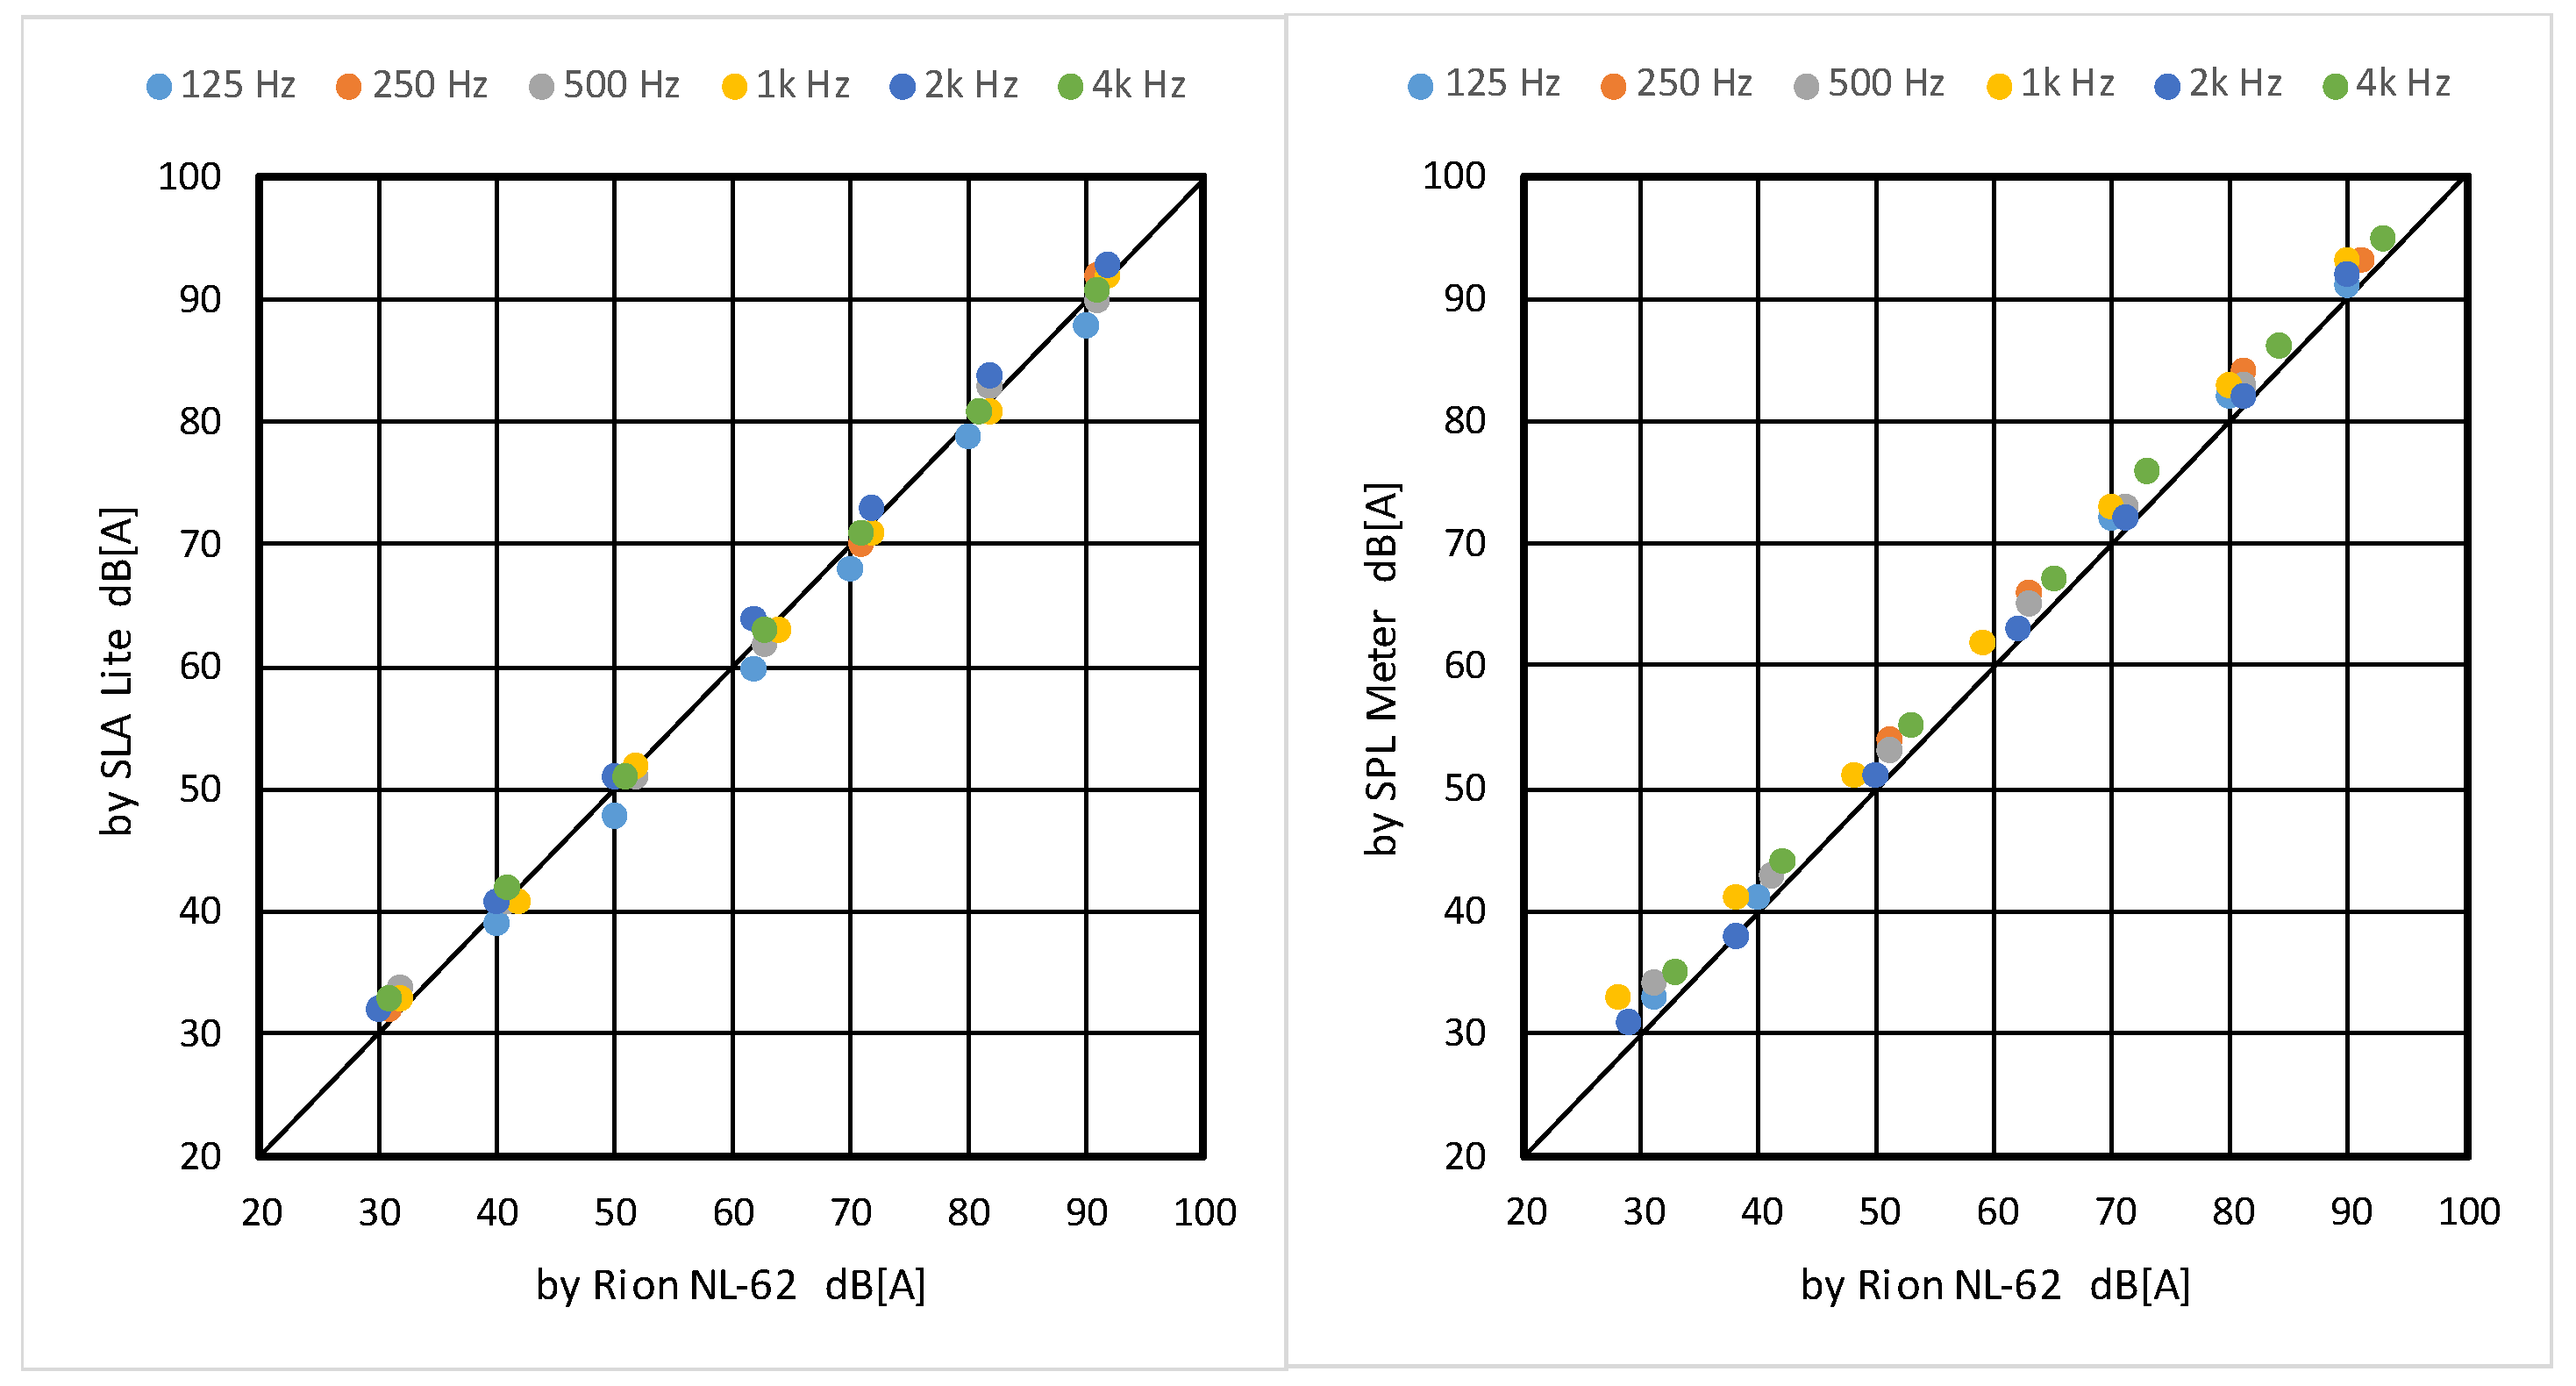
For each octave band noise, its SPL (A-weighted) was measured by the class 1 SLM and mobile devices with SPL Meter and SLA Lite simultaneously for comparison, and the measured values were read. Measurements were carried out starting from approximately 90 dB(A) and decreasing by approximately 10 dB(A) down to 30 dB(A). The same measurement was repeated for each band noise.
(3)
The values read from the measurements were plotted in a graph to check the agreement.
The results for SPL Meter and SLA Lite on iPhone 8 are shown in Figure 6.
SLA Lite (Figure 6, left) shows reasonably good agreement with the class 1 SLM. In this test, the calibration value was −1 dB. In the case of low SPL around 30 dB(A), SLA Lite showed somewhat higher levels than the class 1 SLM, which can be attributed to the effect of internal noise in the mobile device. Except for this, most plots are on a 45° line, therefore, SLA Lite can be considered to have reasonably good accuracy on iPhone 8.
Regarding SPL Meter (Figure 6, right), although it could not be calibrated (as it is a version without calibration function), it showed reasonably good agreement with the class 1 SLM, with a slightly higher value of about 1 dB. If it could be calibrated with the same trimming value as SLA Lite, the accuracy would be improved, so SPL Meter bundled with Audio Tools that could be calibrated would have better accuracy. Also, discrepancies at lower sound levels around 30 dBA are observed.
Comparing the two applications, it can be seen that the data scattering is smaller for SPL Meter. Although SLA Lite gives more accurate values, its data scattering is larger.
Next, the results for SPL Meter and SLA Lite on iPad Pro are shown in Figure 7.
Again, SLA Lite (Figure 7, left) shows reasonably good agreement with the class 1 SLM. In this case, the calibration value was 6 dB. Quite similar tendencies to the iPhone 8 are observed: Discrepancies at low levels and larger data scattering. On the other hand, the values from SPL Meter (Figure 7, right) show quite large discrepancies with those from the class 1 SLM of more than 10 dB(A). The same problem at lower levels around 30 dB(A) is again observed. However, data scattering is smaller than SLA Lite. Therefore, if calibration were available, this could have better accuracy.
A similar tendency was observed for all iPad family devices, including iPad Mini.
In summary, the following main points can be highlighted:
(1)
SLA Lite shows good agreement with the class 1 SLM in both iPhone 8 and iPad Pro.
(2)
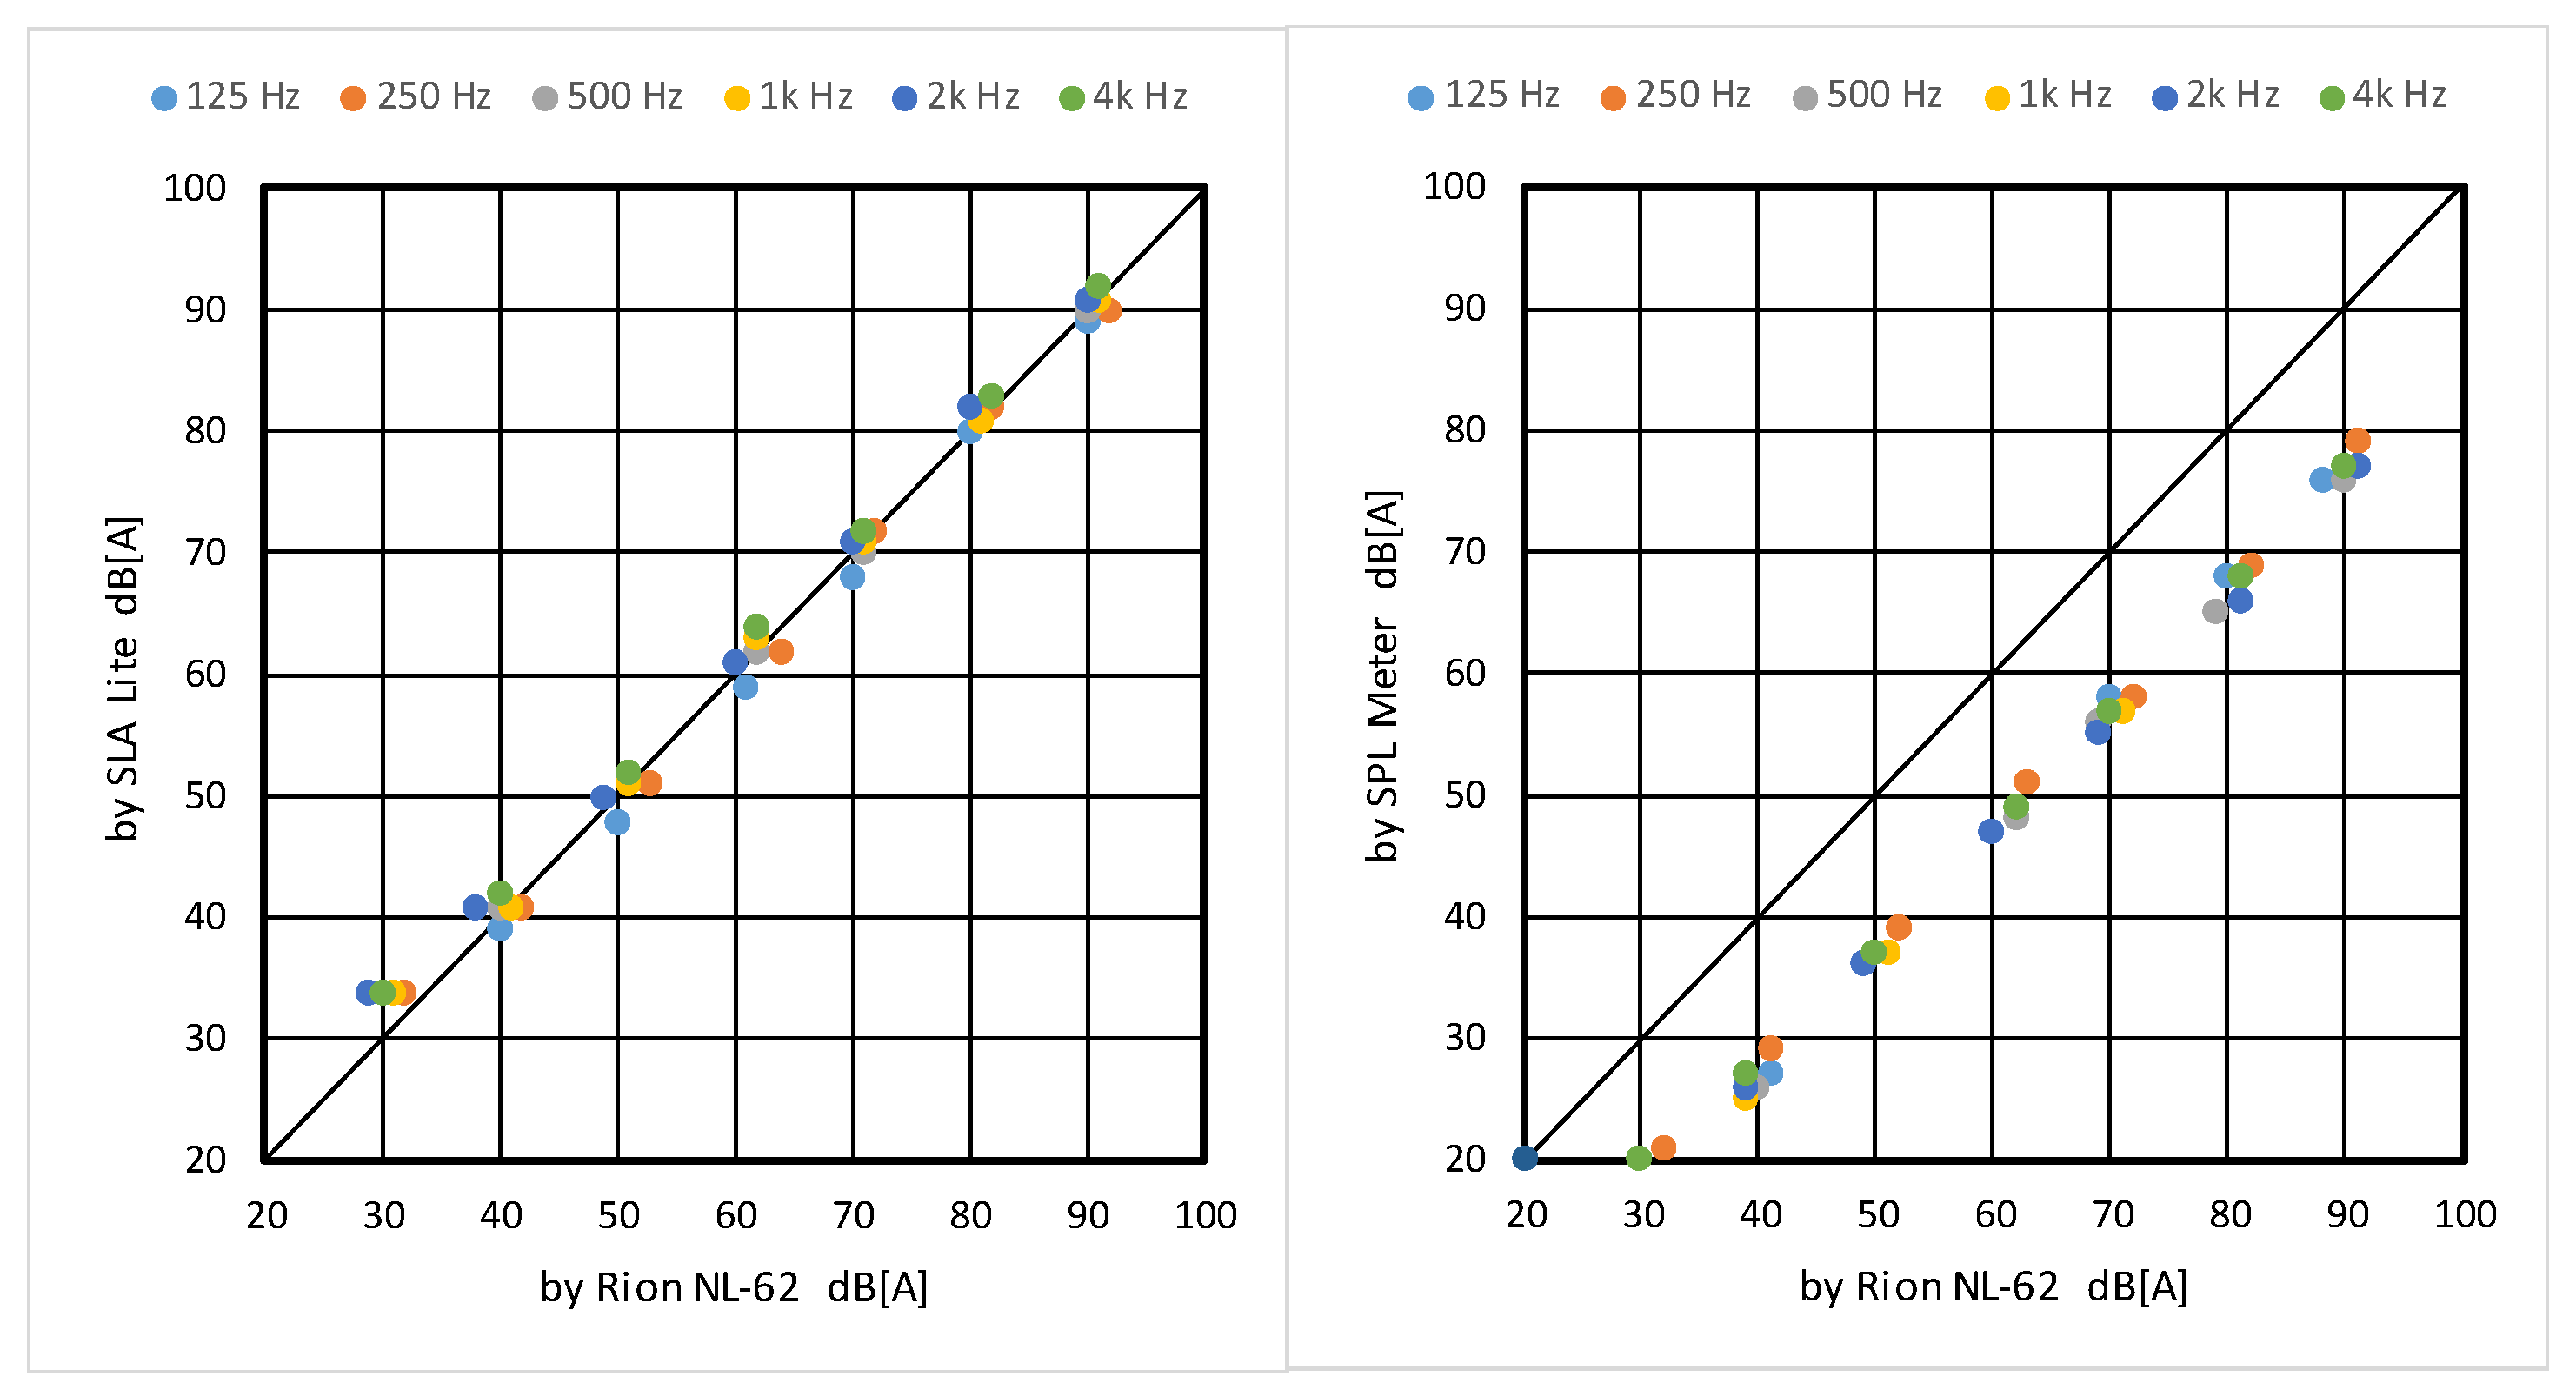
SPL Meter, especially with iPad Pro, is less accurate, but if it could be calibrated, it could be somewhat better in some cases. Note that iPad Mini 2015 showed much better accuracy. Accuracy problems are observed in the newer iPad Mini (in this test, the 2019 version showed a similar problem).
(3)
SPL Meter without calibration function on iPad family devices shows quite large measurement error, while on the iPhone the error is smaller. For the iPad family, the accuracy strongly depends on the model.
(4)
In any case, these applications and mobile devices should be used carefully when precision is required. It is recommended to use their measured values for comparison, or in the form of relative values to compare.

5. Concluding Remarks

In this paper, in order to update the acoustics education program for learning urban acoustic environments using mobile devices and supposing sound maps as output, which the authors proposed [11,12,13], first reviews of the main results of past studies were given as examples to outline and introduce the basic idea. Although the examples shown here are limited to small areas in cities, the method can be applied to larger-scale studies. Next, recent issues on the use of mobile devices for acoustical measurement were discussed, with the results of a preliminary study to check the accuracy. Finally, the results of a detailed examination of the accuracy of the measured results by iOS mobile devices were presented and discussed.
Considering the present results of accuracy tests of SPL measured by several mobile devices using two measurement applications, it was observed that the accuracy of measurement depends on the application used. Also, it can be dependent on the type of iOS device, i.e., iPhone or iPad. If the application has a calibration function and appropriate calibration can be made, both types can be used, at least to obtain relative values. Quantitative measurement may also be possible, but it is recommended to calibrate before taking measurements. In case calibration cannot be done beforehand, it is advisable to use relative values to compare the sound levels or adjust the results by calibrating after taking measurements. These remarks are based on tests of several models and thus are rather limited. In any case, it is better to know the behavior of the device before taking actual measurements.
These devices, as well as applications, are often updated and new versions appear frequently. Therefore, the authors plan to conduct more comprehensive tests to update the information about the measurement accuracy of other models in future studies.

Author Contributions

Project organization and planning, supervising sound map arrangements, draft writing and editing: K.S.; planning and performing detailed analyses of devices: F.S.; initial testing of Android devices and initial project design and planning: A.O.

Funding

The authors had no funding for this project.

Acknowledgments

The authors are indebted to all students who cooperated in this work. Also, many thanks to Miki Toyomasu, who provided invaluable comments on and assistance with the literature survey. The authors appreciate constructive comments from Francesco Aletta in the preparation of the manuscript.

Conflicts of Interest

The authors declare no conflict of interest.

Appendix A

The method of calibration is summarized in the Table A1 [12]. The method used in this project is detailed in the left column, and suggestions for nonacoustical professionals are summarized in the right column.
Note that a detailed accuracy test is the best way to understand not only the accuracy of overall sound levels, such as dB(A), etc., but also the behavior of the device or application, such as the frequency response of a device, the fidelity of an application, etc.
However, in the initial calibration, and in many cases where only the overall value of, e.g., dB(A) is required, the minimum required calibration, such as comparing the measured dB(A) level with one measured by a reliable standardized SLM, can be used. In any case, calibration done at different sound levels to check the linearity of the device and application is recommended even when using mobile devices to obtain relative values.
Table A1. Suggested method of calibration (summarized from previous work [12]).
Testing Method in This WorkNotes for Instructors Less Experienced in Acoustics
  • An anechoic chamber was used.
  • Receiving point was in front of the loudspeaker at enough distance from it.
  • The height of the measurement position was 1.5 m.
  • The noise used was 1/1-octave (1 kHz). Initial calibration was done with C-weighting.
  • The difference between measured values by the class 1 SLM and SPL Meter for the trim value of SPL Meter was used.
  • Use “dead” room.
  • Place loudspeaker (sound source) in the corner of the room.
  • Test sound should be larger than background noise by 10 dB.
  • Receiving point should be as far as possible from the sound source.
  • Use steady-state noise for test sound; white or pink noise is good.
  • If the loudspeaker is small, A-weighting can be used for better results.
  • If noise signal is not available, a shower sound, etc., can be used.
  • If a class 1 SLM is not available, class 2 can be used.

References

  1. Schafer, R.M. Tuning of the World; Knopf: New York, NY, USA, 1977. [Google Scholar]
  2. Schafer, R.M. A Sound Education; Arcana Editions: Douro-Dummer, ON, Canada, 1992. [Google Scholar]
  3. Research Committee on Education in Acoustics (Acoustical Society of Japan). Report of questionnaires on education in acoustics and survey in syllabus in Japanese universities. J. Acoust. Soc. Jpn. 2009, 65, 264–269. (In Japanese) [Google Scholar] [CrossRef]
  4. Ishii, A. Soundscape and environmental education. J. Acoust. Soc. Jpn. 1996, 52, 800–804. Available online: https://www.jstage.jst.go.jp/article/jasj/52/10/52_KJ00001451393/_pdf/-char/ja (accessed on 17 July 2019). (In Japanese).
  5. Minichilli, F.; Gorini, F.; Ascari, E.; Bianchi, F.; Coi, A.; Fredianelli, L.; Licitra, G.; Manzoli, F.; Mezzasalma, L.; Cori, L. Annoyance judgment and measurements of environmental noise; A focus on Italian secondary schools. Int. J. Environ. Res. Public Health 2018, 15, 208. [Google Scholar] [CrossRef] [PubMed]
  6. Chetoni, M.; Ascari, E.; Bianco, F.; Fredianelli, L.; Licitra, G.; Cori, L. Global noise score indicator for classroom evaluation of acoustic performance in LIFE GIOCONDA project. Noise Mapp. 2016, 3, 157–171. [Google Scholar] [CrossRef]
  7. Aletta, F.; Brambillia, G.; Maffei, L.; Masullo, M. Urban soundscapes: Characterization of a pedestrian tourist route in Sorrento (Italy). Urban Sci. 2017, 1, 4. [Google Scholar] [CrossRef]
  8. Aletta, F.; Kang, J. Soundscape approach integrating noise mapping techniques: A case study in Brighton, UK. Noise Mapp. 2015, 2, 1–12. [Google Scholar] [CrossRef]
  9. Xian, J.; Aletta, F. A soundscape approach to exploring design strategies for acoustic comfort in modern public libraries: A case study of the Library of Birmingham. Noise Mapp. 2016, 3, 264–273. [Google Scholar] [CrossRef]
  10. Maekawa, Z.; Rindel, J.H.; Lord, P. Environmental and Architectural Acoustics; Taylor and Francis: Oxford, UK, 2010. [Google Scholar]
  11. Sakagami, K.; Satoh, F.; Omoto, A. A case study of introductory teaching method for architectural/environmental acoustics using a smartphone. Acoust. Sci. Technol. 2013, 34, 209–211. [Google Scholar] [CrossRef] [Green Version]
  12. Satoh, F.; Sakagami, K.; Omoto, A. Application of a smartphone for introductory teaching of sound environment: Validation of the precision of the devices and examples of students’ work. Acoust. Sci. Technol. 2016, 37, 165–172. [Google Scholar] [CrossRef]
  13. Sakagami, K.; Satoh, F.; Omoto, A. Use of smartphones for introductory acoustics education. Available online: http://acousticalsociety.org/ (accessed on 17 July 2019).
  14. Toyomasu, M.; Suzuki, S.; Hirano, K. Changes in description of sound in the guidelines for the course of study and in junior high school home economics textbooks. J. Acoust. Soc. Jpn. 2014, 70, 292–295. [Google Scholar]
  15. Ministry of Education, Culture, Science and Sports. Guidelines for the Course of Study for Primary School Home Economics; Ministry of Education, Culture, Science and Sports: Tokyo, Japan, 2017. Available online: http://www.mext.go.jp/a_menu/01_c.htm (accessed on 10 June 2019). (In Japanese)
  16. Ministry of Education, Culture, Science and Sports. Commentary on the Guidelines for the Course of Study for Primary School Home Economics; Ministry of Education, Culture, Science and Sports: Tokyo, Japan, 2017. Available online: http://www.mext.go.jp/component/a_menu/education/micro_detail/__icsFiles/afieldfile/2019/03/18/1387017_009.pdf (accessed on 10 June 2019). (In Japanese)
  17. Otake, M.; Suzuki, M.; Watabiki, T. Teaching Method for Home Economics in Primary Schools; Kenpakusha: Tokyo, Japan, 2018; Chapter 3. (In Japanese) [Google Scholar]
  18. Kawahara, K.; Suzuki, S.; Toyomasu, M.; Toyota, S. Development of a teaching material on “Life and Sounds” for primary school home economics; an activity program on making sound quizzes using tablet devices. In Memoirs of University of Teacher Education Fukuoka; University of Teacher Education Fukuoka: Fukuoka, Japan, 2019; Volume 68, Pt 6, pp. 1–6. Available online: http://hdl.handle.net/10780/2161 (accessed on 17 July 2019). (In Japanese)
  19. Taninaka, S. Theory and practice in soundscape. In Ningenkagaku-kenkyu of Kanazawa Seiryo University; Kanazawa Seiryo University: Kanazawa, Japan, 2009; Volume 2, pp. 35–40. Available online: http://www.seiryo-u.ac.jp/u/education/gakkai/h_ronsyu_pdf/2_2/p35_taninaka.pdf (accessed on 17 July 2019). (In Japanese)
  20. Kanjo, E. NoiseSPY: A Real-Time Mobile Phone Platform for Urban Noise Monitoring and Mapping. Mob. Netw. Appl. 2010, 15, 562–574. [Google Scholar] [CrossRef]
  21. D’Hondt, E.; Stevens, M.; Jacobs, A. Participatory noise mapping works! An evaluation of participatory sensing as an alternative to standard techniques for environmental monitoring. Pervasive Mob. Comput. 2013, 9, 681–694. [Google Scholar] [CrossRef]
  22. Maisonneuve, N.; Stevens, M.; Ochab, B. Participatory noise pollution monitoring using mobile phones. Inf. Polity 2010, 15, 51–71. [Google Scholar] [CrossRef] [Green Version]
  23. Picaut, J.; Fortin, N.; Bocher, E.; Petit, G.; Aumond, P.; Guillaume, G. An open-science crowdsourcing approach for producing community noise maps using smartphones. Build. Environ. 2019, 148, 20–33. [Google Scholar] [CrossRef]
  24. Rana, R.; Chou, C.T.; Bulusu, N.; Kanhere, S.; Hu, W. Ear-Phone: A context-aware noise mapping using smart phones. Pervasive Mob. Comput. 2015, 17, 1–22. [Google Scholar] [CrossRef] [Green Version]
  25. Zuo, J.; Xia, H.; Liu, S.; Qiao, Y. Mapping Urban Environmental Noise Using Smartphones. Sensors 2016, 16, 1692. [Google Scholar] [CrossRef] [PubMed]
  26. Aumond, P.; Lavandier, C.; Ribeiro, C.; Boix, E.G.; Kambona, K.; D’Hondt, E.; Delaitre, P. A study of the accuracy of mobile technology for measuring urban noise pollution in large scale participatory sensing campaigns. Appl. Acoust. 2017, 117, 219–226. [Google Scholar] [CrossRef]
  27. Can, A.; Dekoninck, L.; Botteldooren, D. Measurement network for urban noise assessment: Comparison of mobile measurements and spatial interpolation approaches. Appl. Acoust. 2014, 83, 32–39. [Google Scholar] [CrossRef] [Green Version]
  28. Studio Six Digital: “Audio Tools” Page. Note that There is “SPL Modules” Item from Which One can Reached to “SPL Meter” Page. Available online: https://studiosixdigital.com/audiotools-modules-2/ (accessed on 10 June 2019).
  29. Andrew Smith’s Page: No Technical Information Given. Available online: https://searchman.com/ios/publisher/gb/291822462/en/andrew-smith/ (accessed on 10 June 2019).
  30. Bismark. Available online: https://www.bismark.jp/mobile-app (accessed on 12 June 2019).
  31. Kardous, C.A.; Shaw, P.B. Evaluation of smartphone sound measurement applications. J. Acoust. Soc. Am. 2014, 135. [Google Scholar] [CrossRef] [PubMed]
  32. Faber Acoustical: “Signal Scope Pro X” Page. Available online: https://www.faberacoustical.com/apps/ios/signalscope_x/ (accessed on 10 June 2019).
  33. Toon LLC: “SLA Pro” Page. Available online: http://www.toon-llc.com/support/slapro.html (accessed on 10 June 2019).
  34. Murphy, E.; King, E. Testing the accuracy of smartphones and sound level meter applications for measuring environmental noise. Appl. Acoust. 2015, 106, 16–22. [Google Scholar] [CrossRef]
Figure 1. Examples of accuracy of sound level measuring application (SPL Meter) for (a) iOS device (iOS 5.0) and (b) Android device (Android OS 4.2) [12].
Urbansci 03 00073 g001
Figure 2. Example of results of accuracy test of FFT frequency spectrum analysis application (bs-spectrum) for iOS devices measured by (a) iPod Touch 4 and (b) professional-use PC software [12].
Urbansci 03 00073 g002
Figure 3. Example of a sound map with sound pressure levels (SPLs) and sound spectra: Honmachi area, Toyonaka City, Osaka, Japan, a mid-sized, moderately urbanized city [12].
Urbansci 03 00073 g003
Figure 4. Example of accuracy result of equivalent sound level (LAeq) measuring application (Signal Scope Pro 7 on iPad) compared with a class 1 sound level meter (SLM) [13].
Urbansci 03 00073 g004
Figure 5. Example of sound map with Leq(A) (30 sec, Signal Scope Pro 7 on iPhone 5s), and sound spectrum (bs-spectrum on iPhone 5s): Ueno-higashi area, Toyonaka City, Osaka, Japan.
Urbansci 03 00073 g005
Figure 6. Results of accuracy test of SPL (A-weighted) by measuring applications on iPhone 8 (model MQ842J/A, released September 2017). SLA Lite (left) and SPL Meter (right) compared with a class 1 SLM.
Urbansci 03 00073 g006
Figure 7. Results of accuracy test of SPL (A-weighted) by measuring applications on iPad Pro (9.7” display, model MLQ421A, released March 2016). SLA Lite (left) and SPL Meter (right) compared with a class 1 SLM.
Urbansci 03 00073 g007

