
Deep-Learning-Based Real-Time Visual Pollution Detection in Urban and Textile Environments


Abstract
:1. Introduction
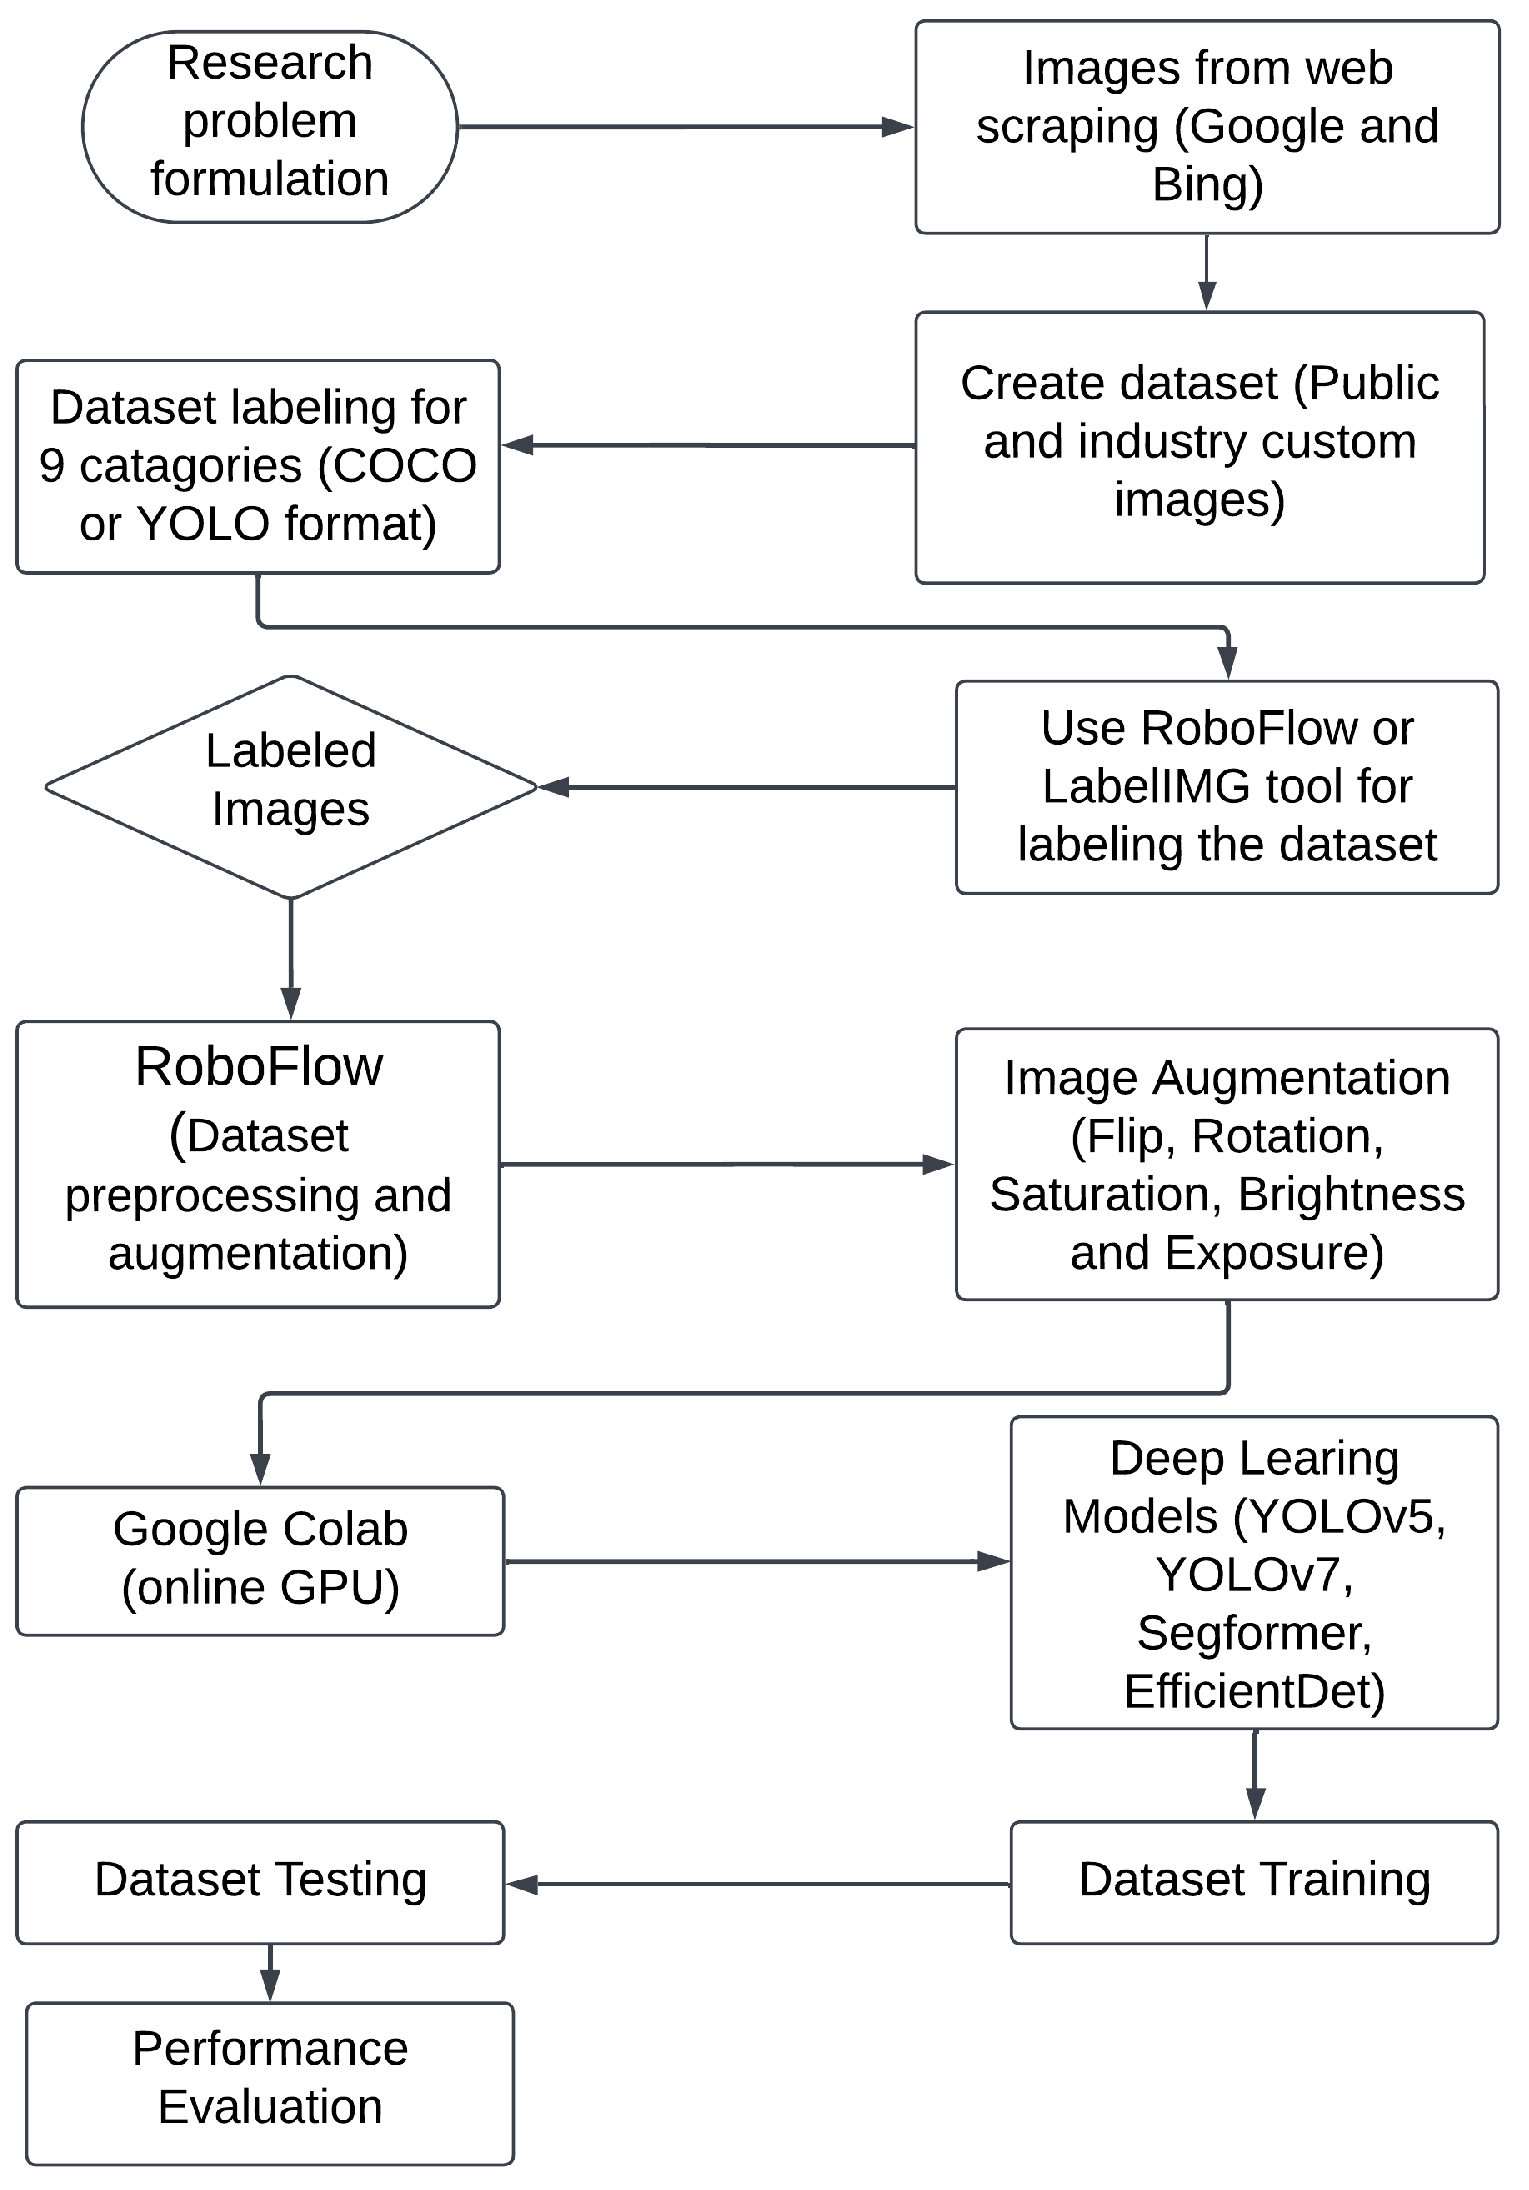
- Combining and developing a comprehensive dataset focused on textile-based and conventional urban visual wastes of nine categories is a significant contribution to this research. The process of labeling was executed with precision using the LabelImg and Roboflow API, which involved manual labeling, sorting, renaming, and meticulous categorization of each image. We employed data augmentation techniques to enhance the diversity and volume of the employed dataset.
- Subsequently, we implemented a range of neural network models, Faster SegFormer, YOLOv5, YOLOv7, and EfficientDet, to automatically detect and classify visual contaminants. The tuna swarm optimization (TSO) technique was employed to select the applied models’ final layers and corresponding hyperparameters. Various experiments were conducted, scrutinizing precision, recall, mean average precision (mAP), intersection over union (IoU), and loss metrics encompassing classification, localization, and regularization losses, as well as overall accuracy, to ensure the reliability and effectiveness of the applied models.
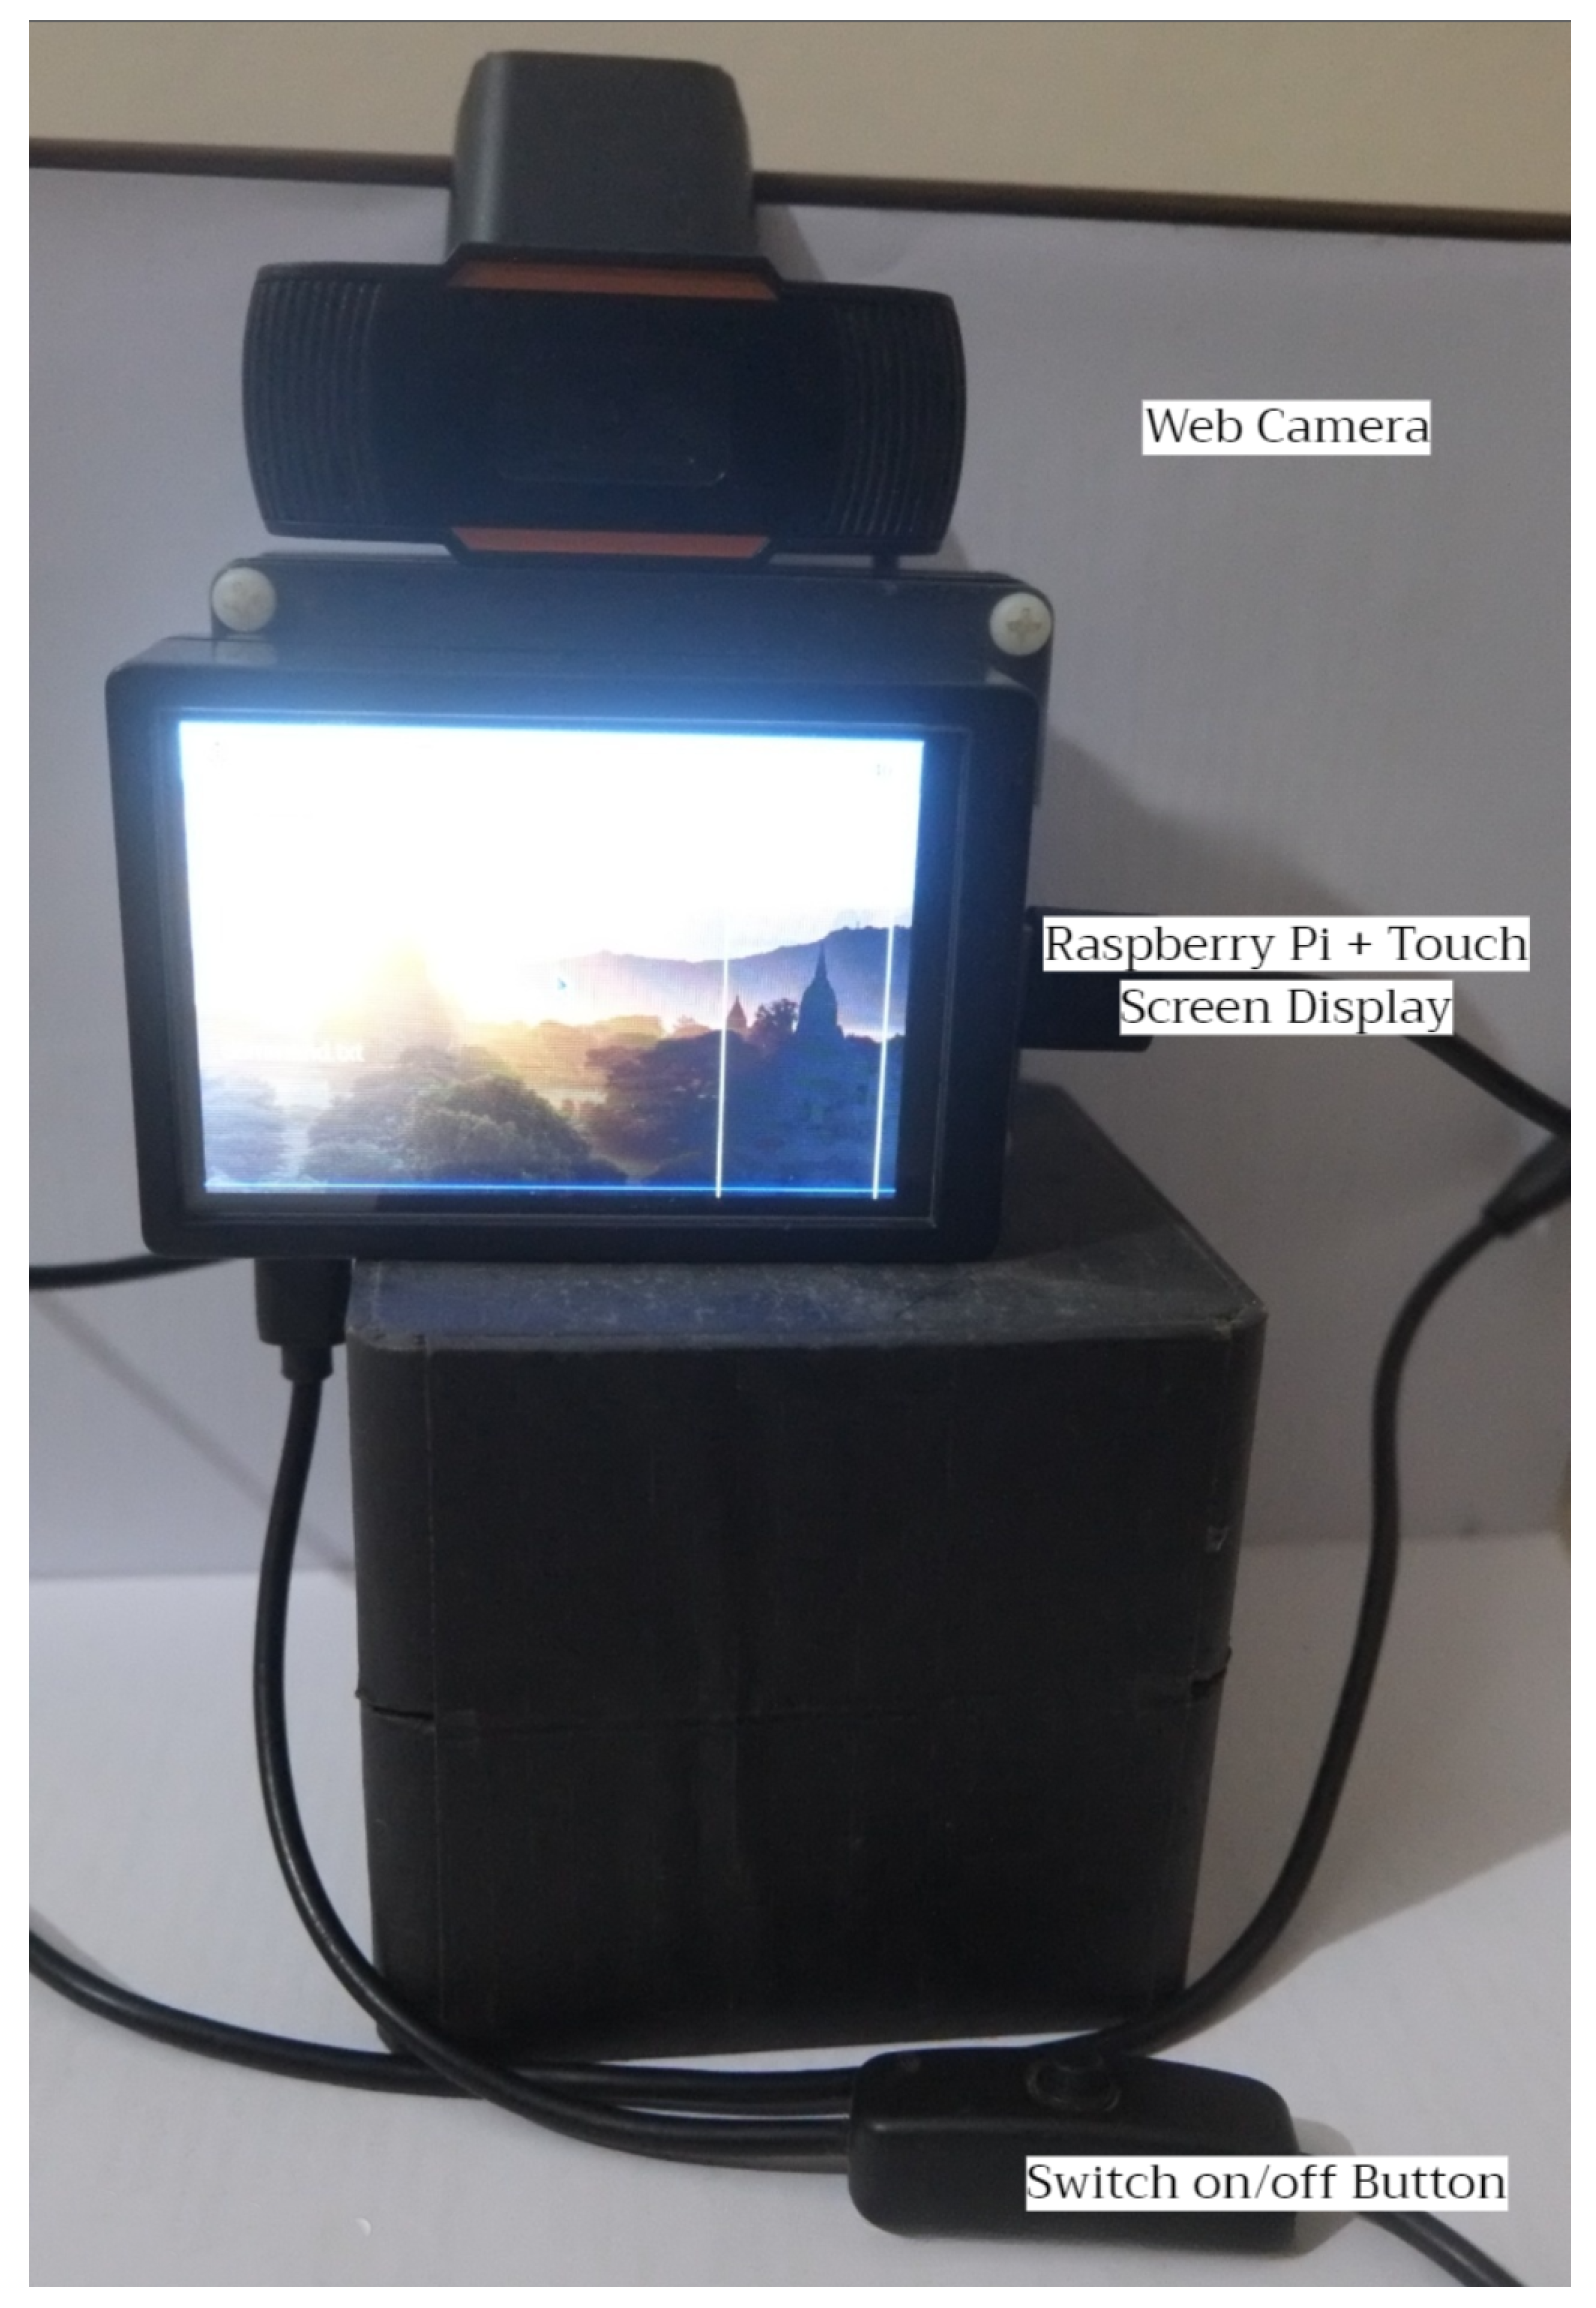
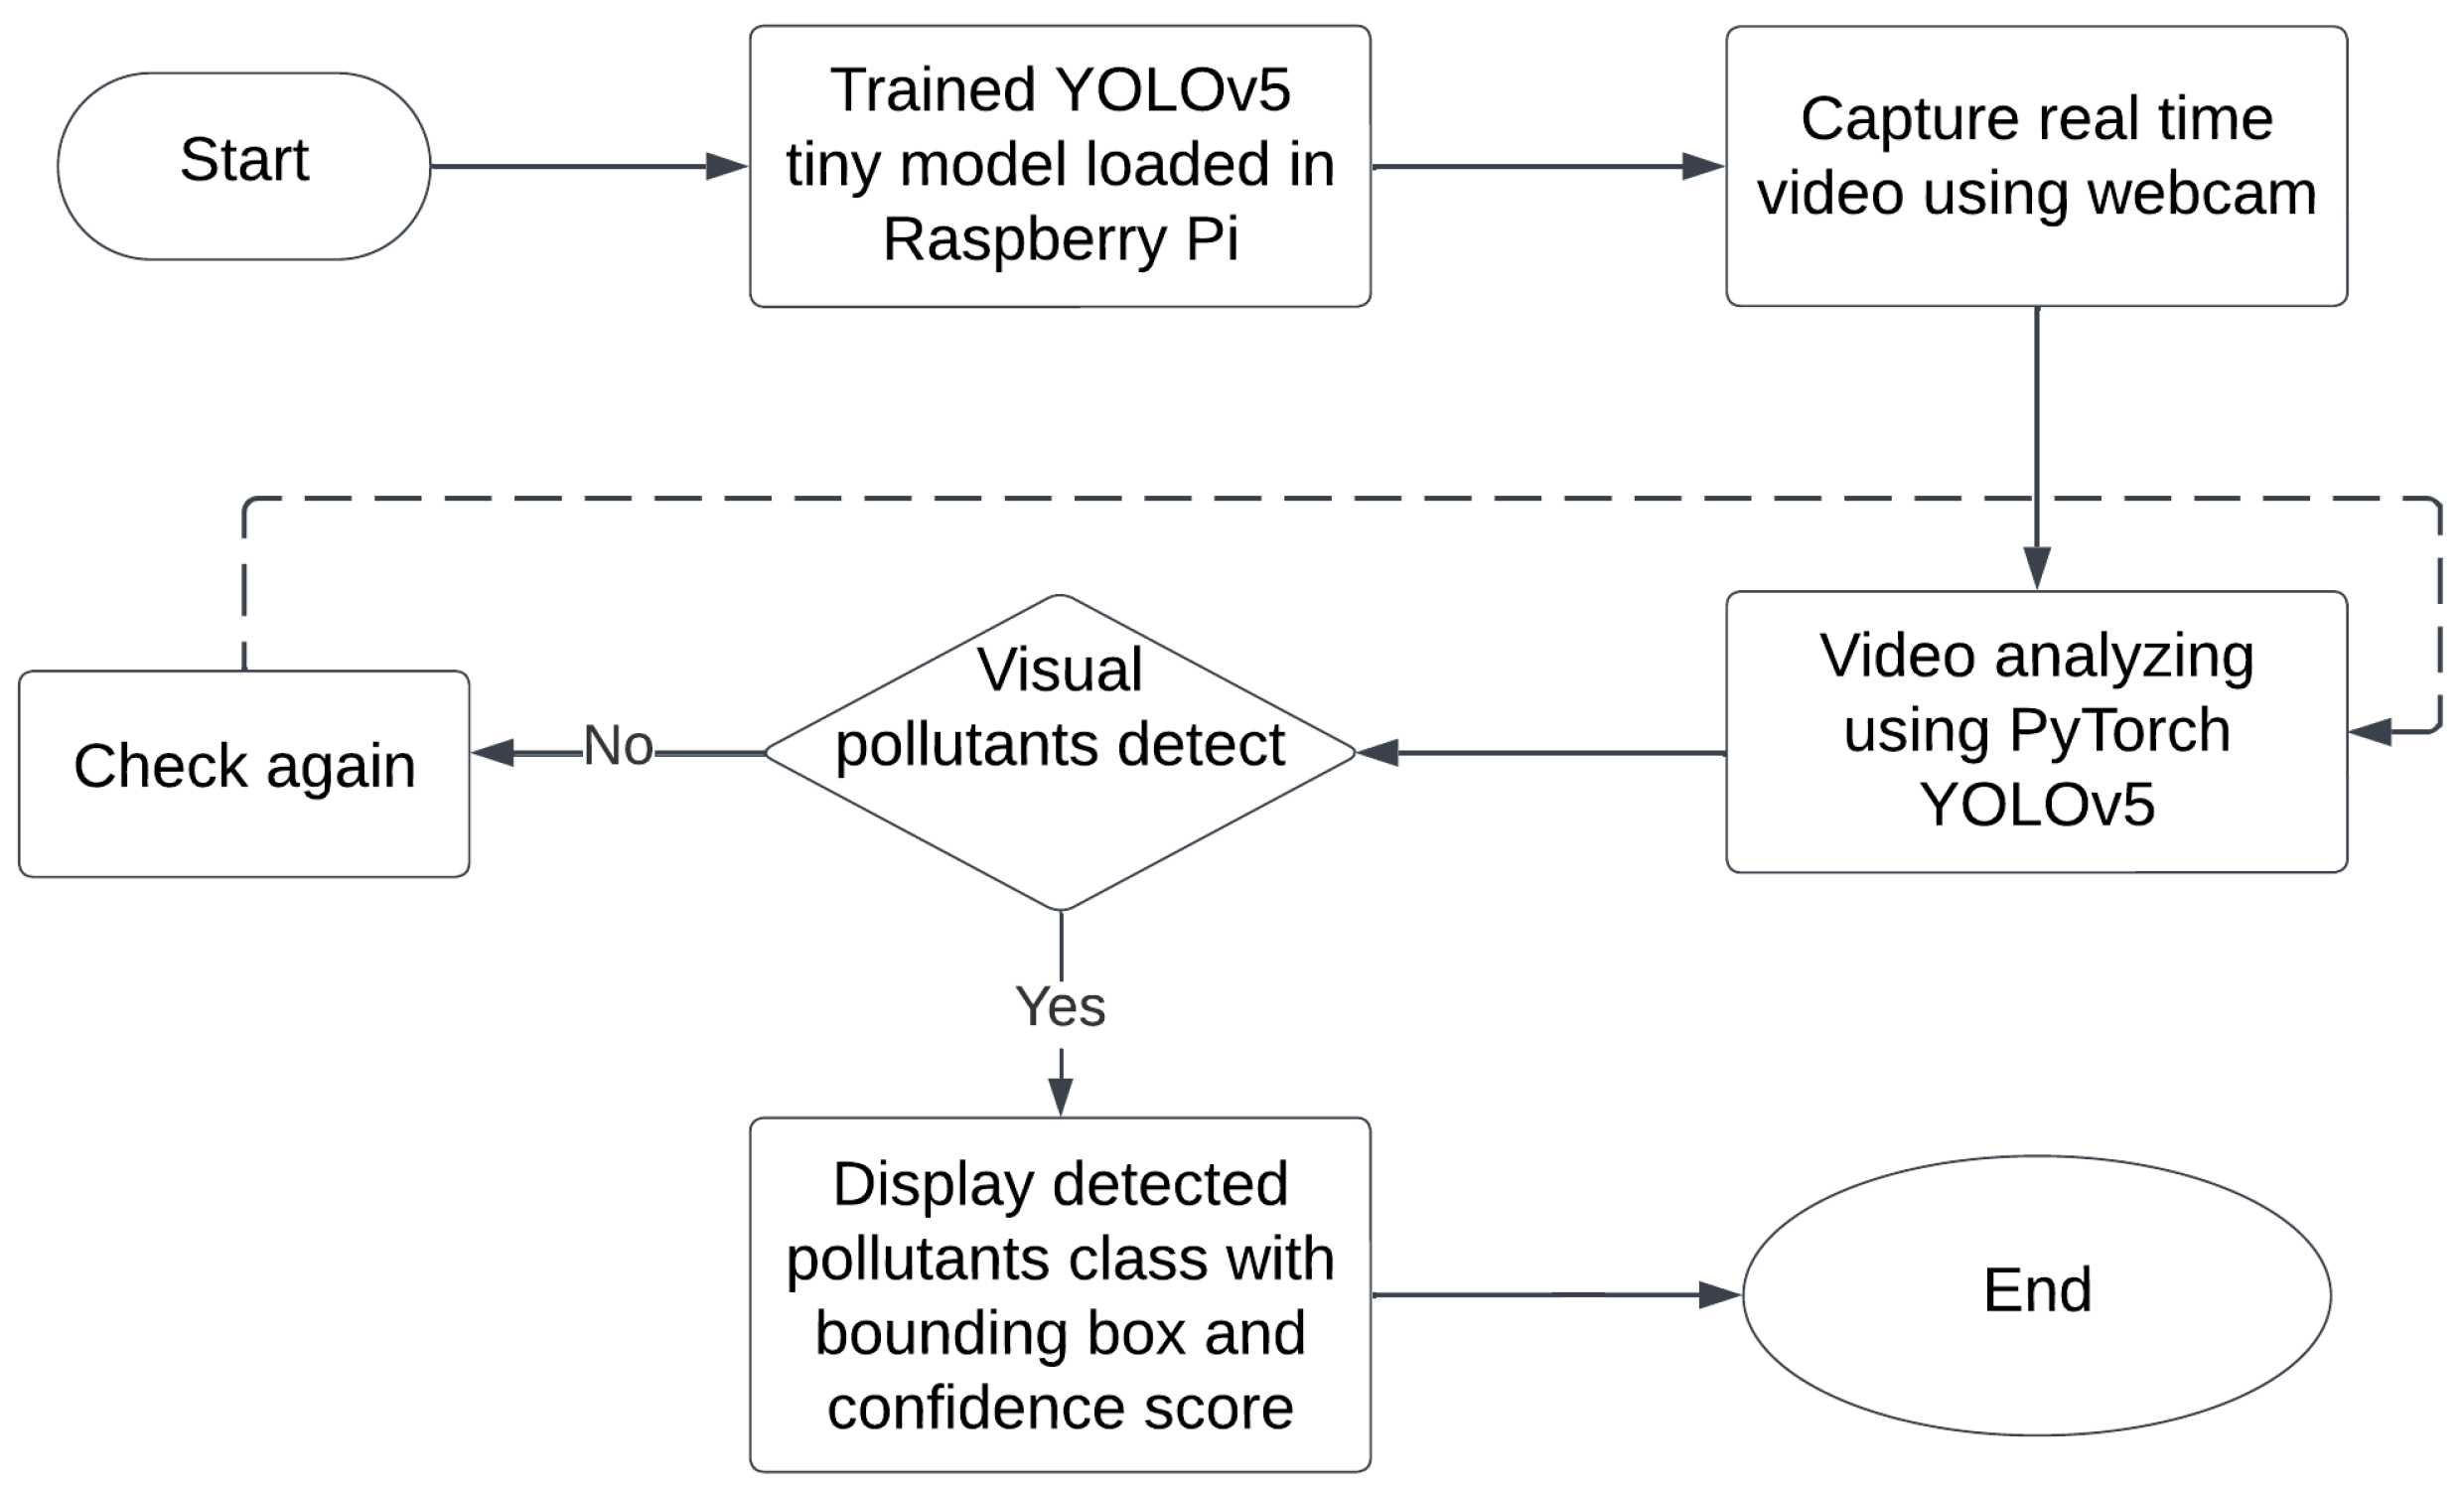
- Finally, the proposed automatic visual pollution detection system was assembled into a robust hardware setup, comprising a Raspberry Pi 4B microcontroller, a 3.5-inch touchscreen display, and a Xiaomi-CMSXJ22A web camera. The selected model, YOLOv5, was seamlessly integrated into the microcontroller.
- To the best of our knowledge, this is the first time a deep learning technique has been integrated with a Raspberry Pi 4-based edge device to instantly detect nine distinct categories of visual pollutants in real time.
2. Related Works
3. Proposed System
3.1. Dataset and Its Preprocessing
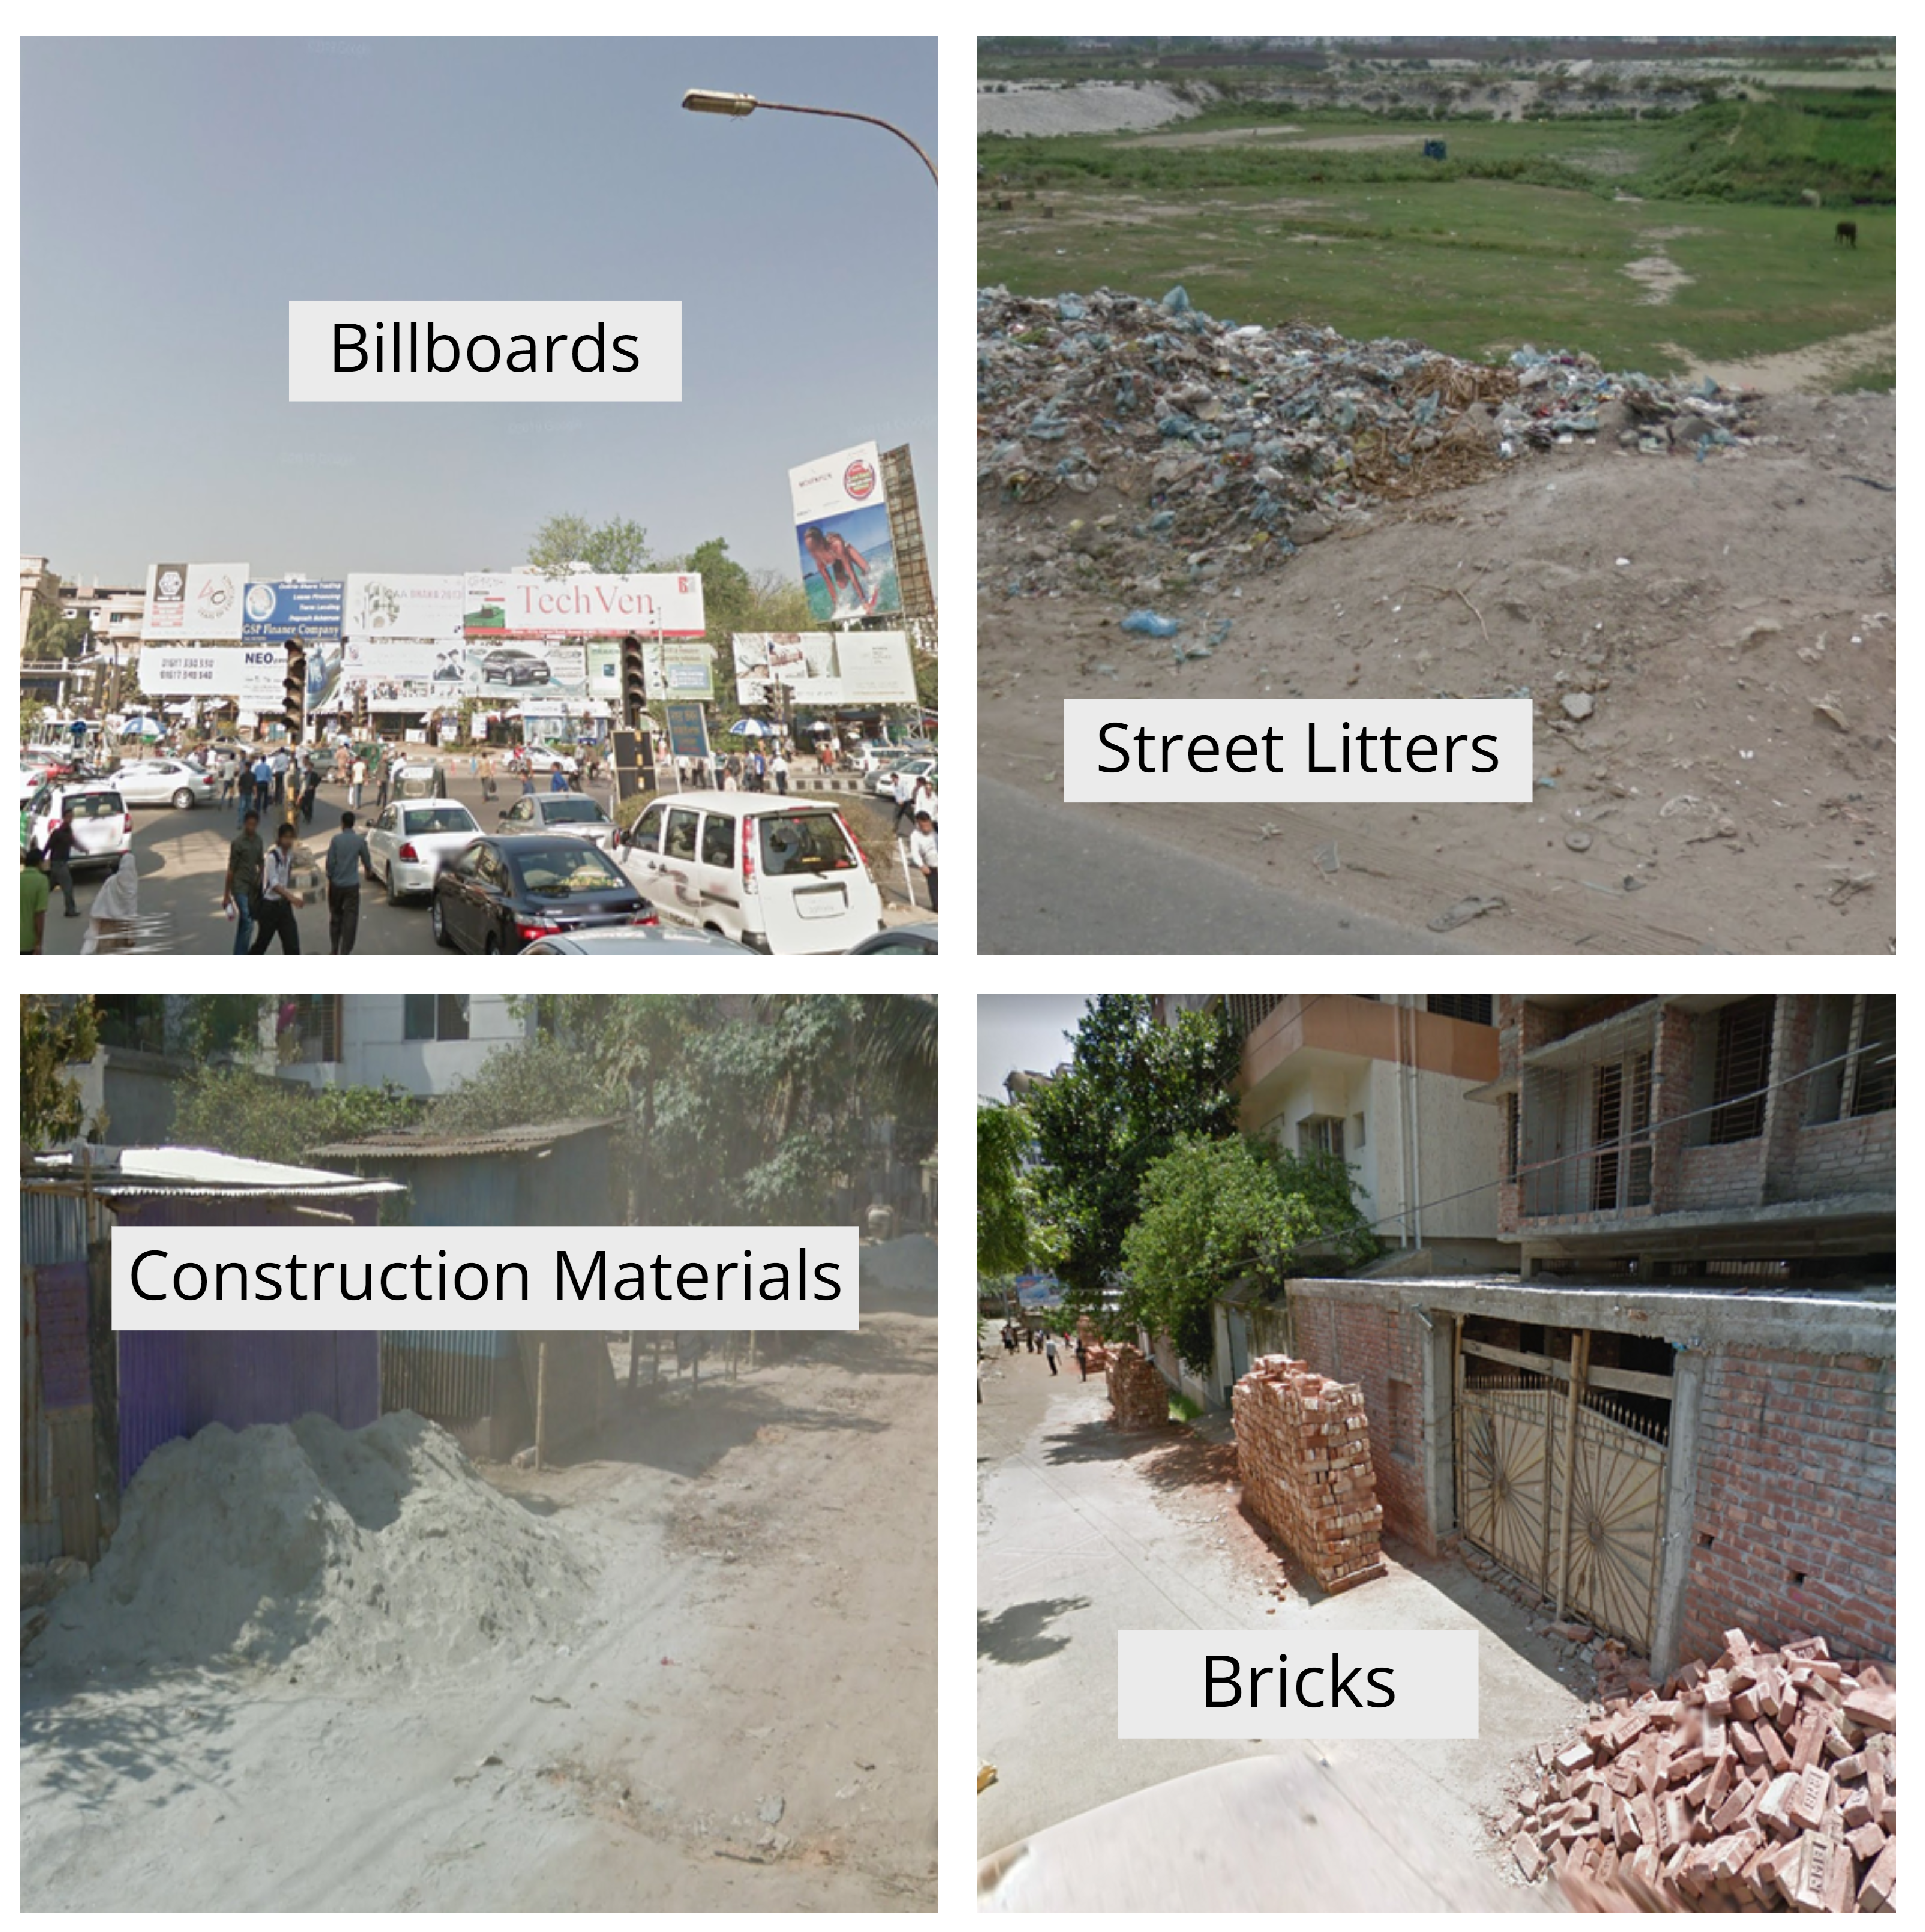
- Our dataset was compiled by gathering a selection of images from Google and Microsoft Bing search tools, along with images from two prominent knit garment industries in Bangladesh. Through web crawling, we accumulated more than 1400 photographs, consisting of 200 depicting textile billboards, 200 bricks, 300 construction equipment, 300 street trash, 200 towers, and 200 overhead cables. We removed several irrelevant photographs collected during the data crawling process to refine our dataset.
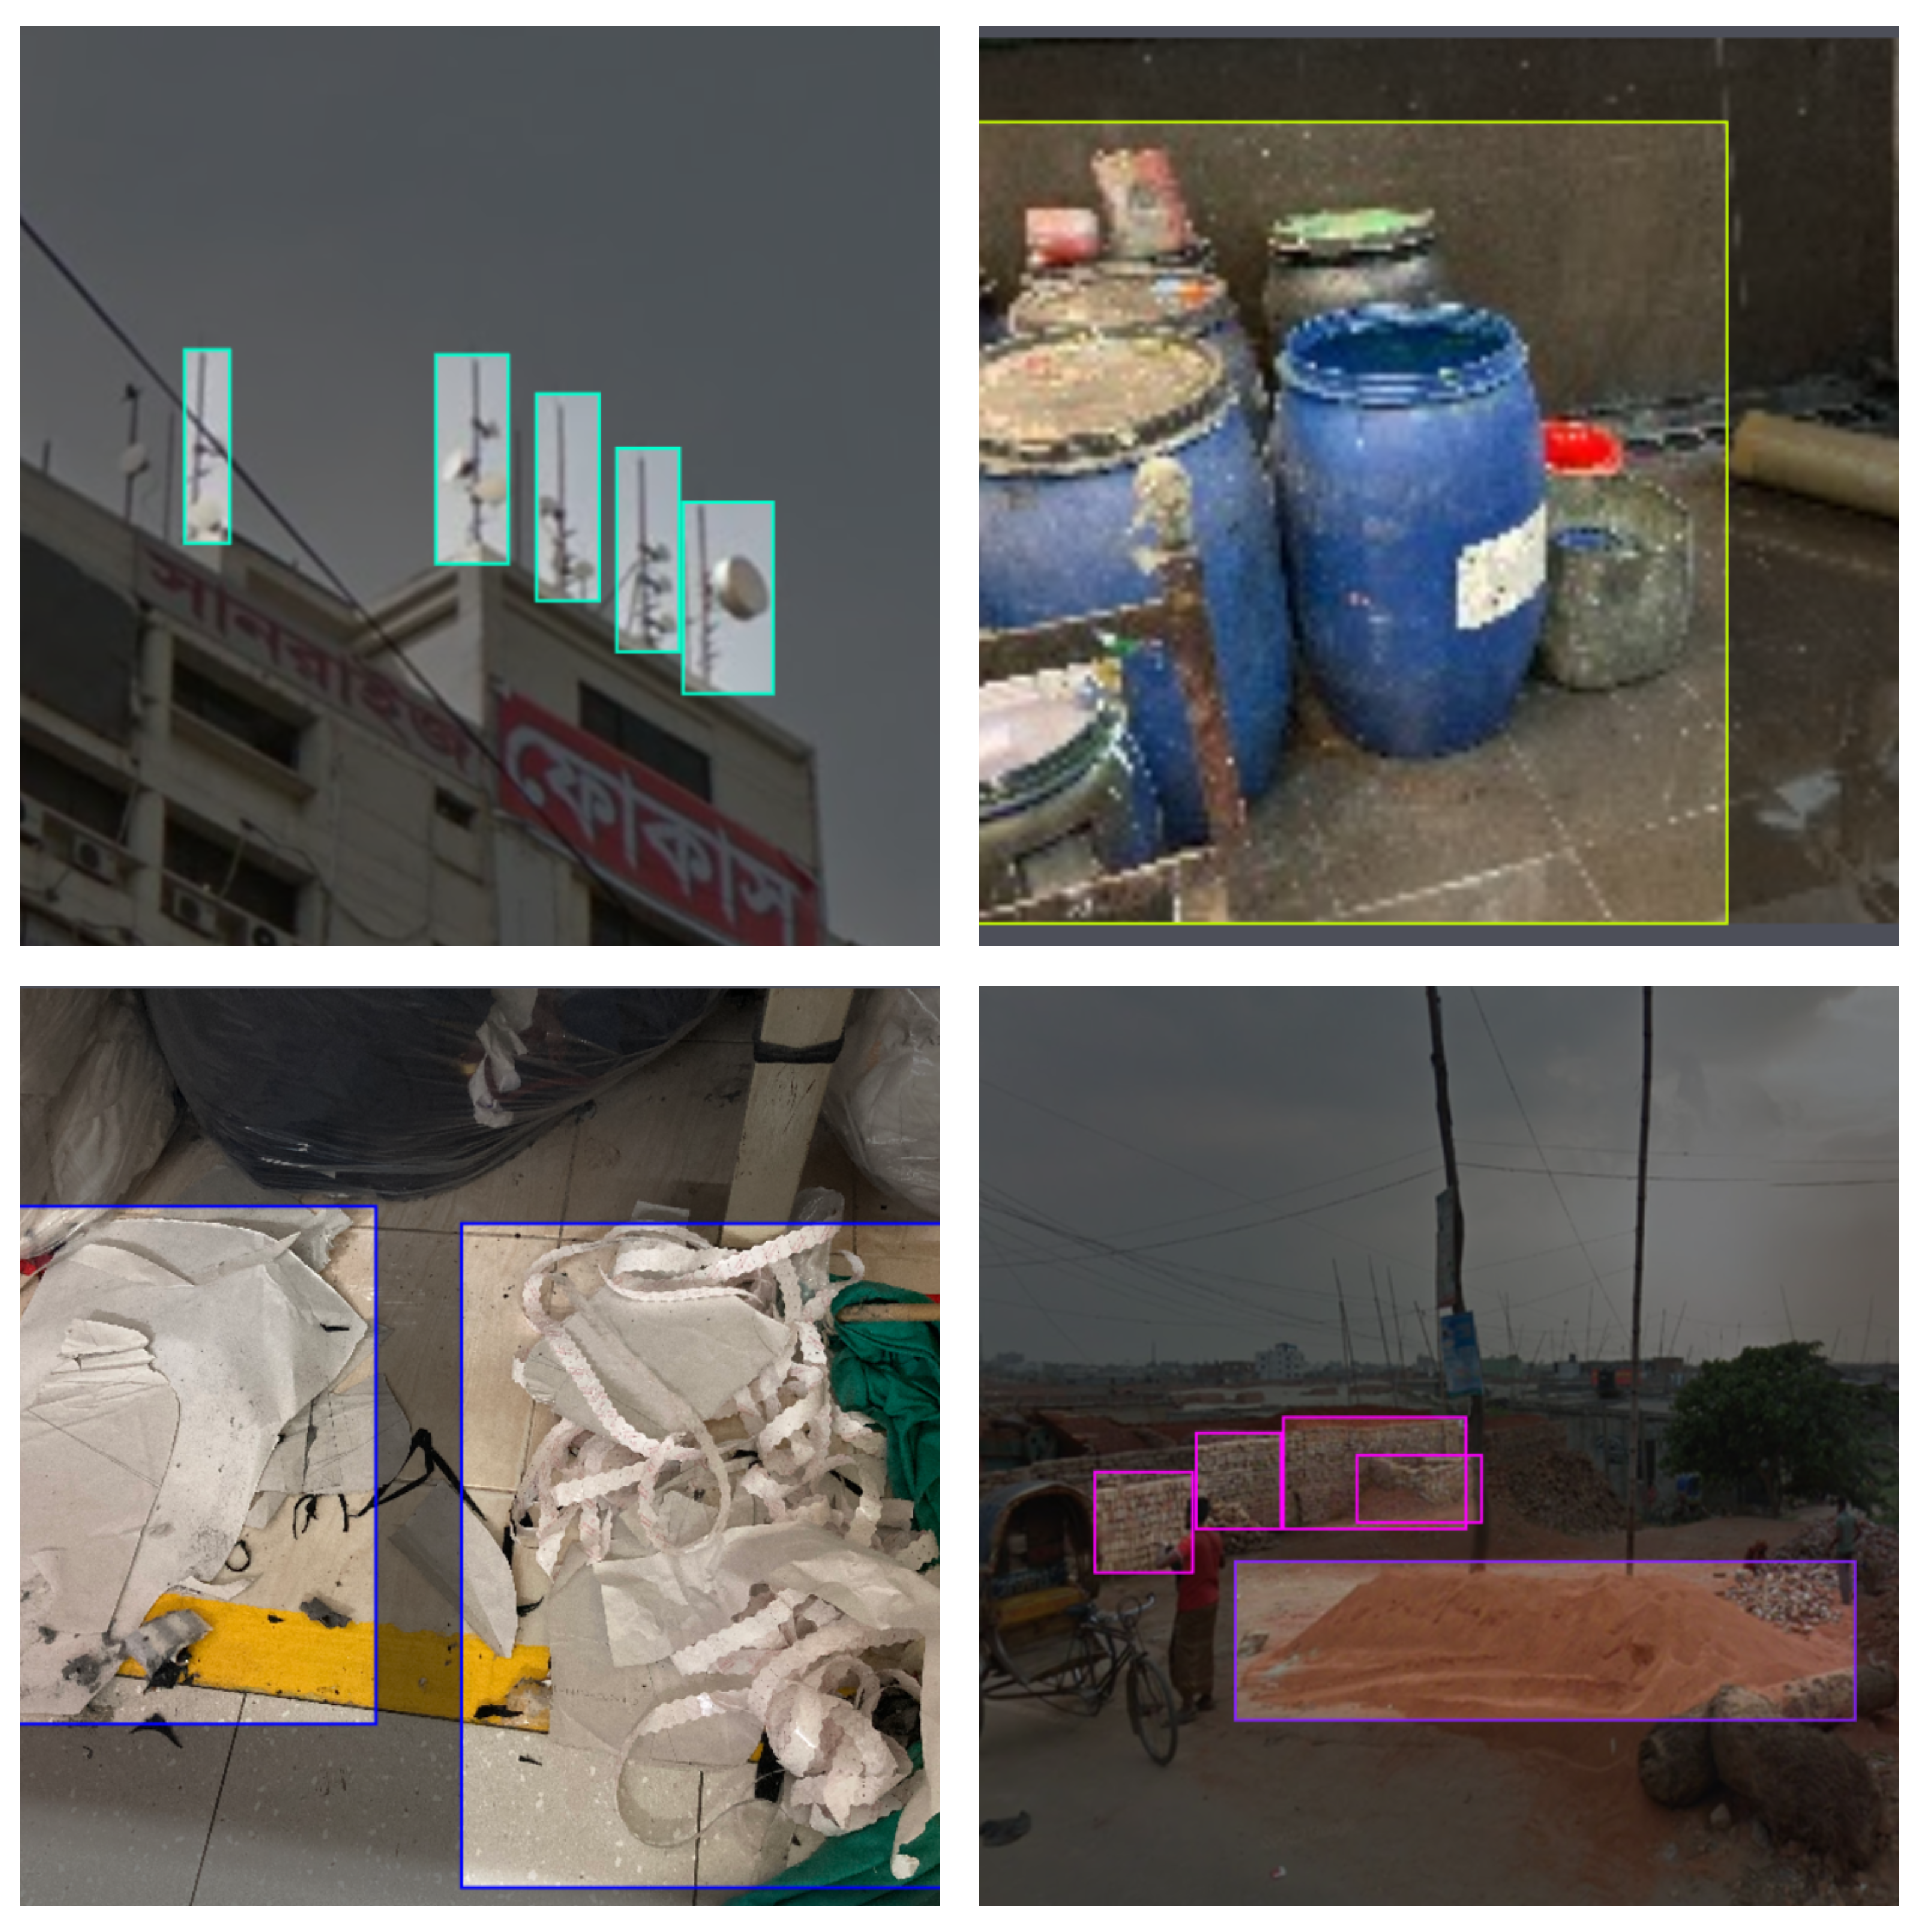
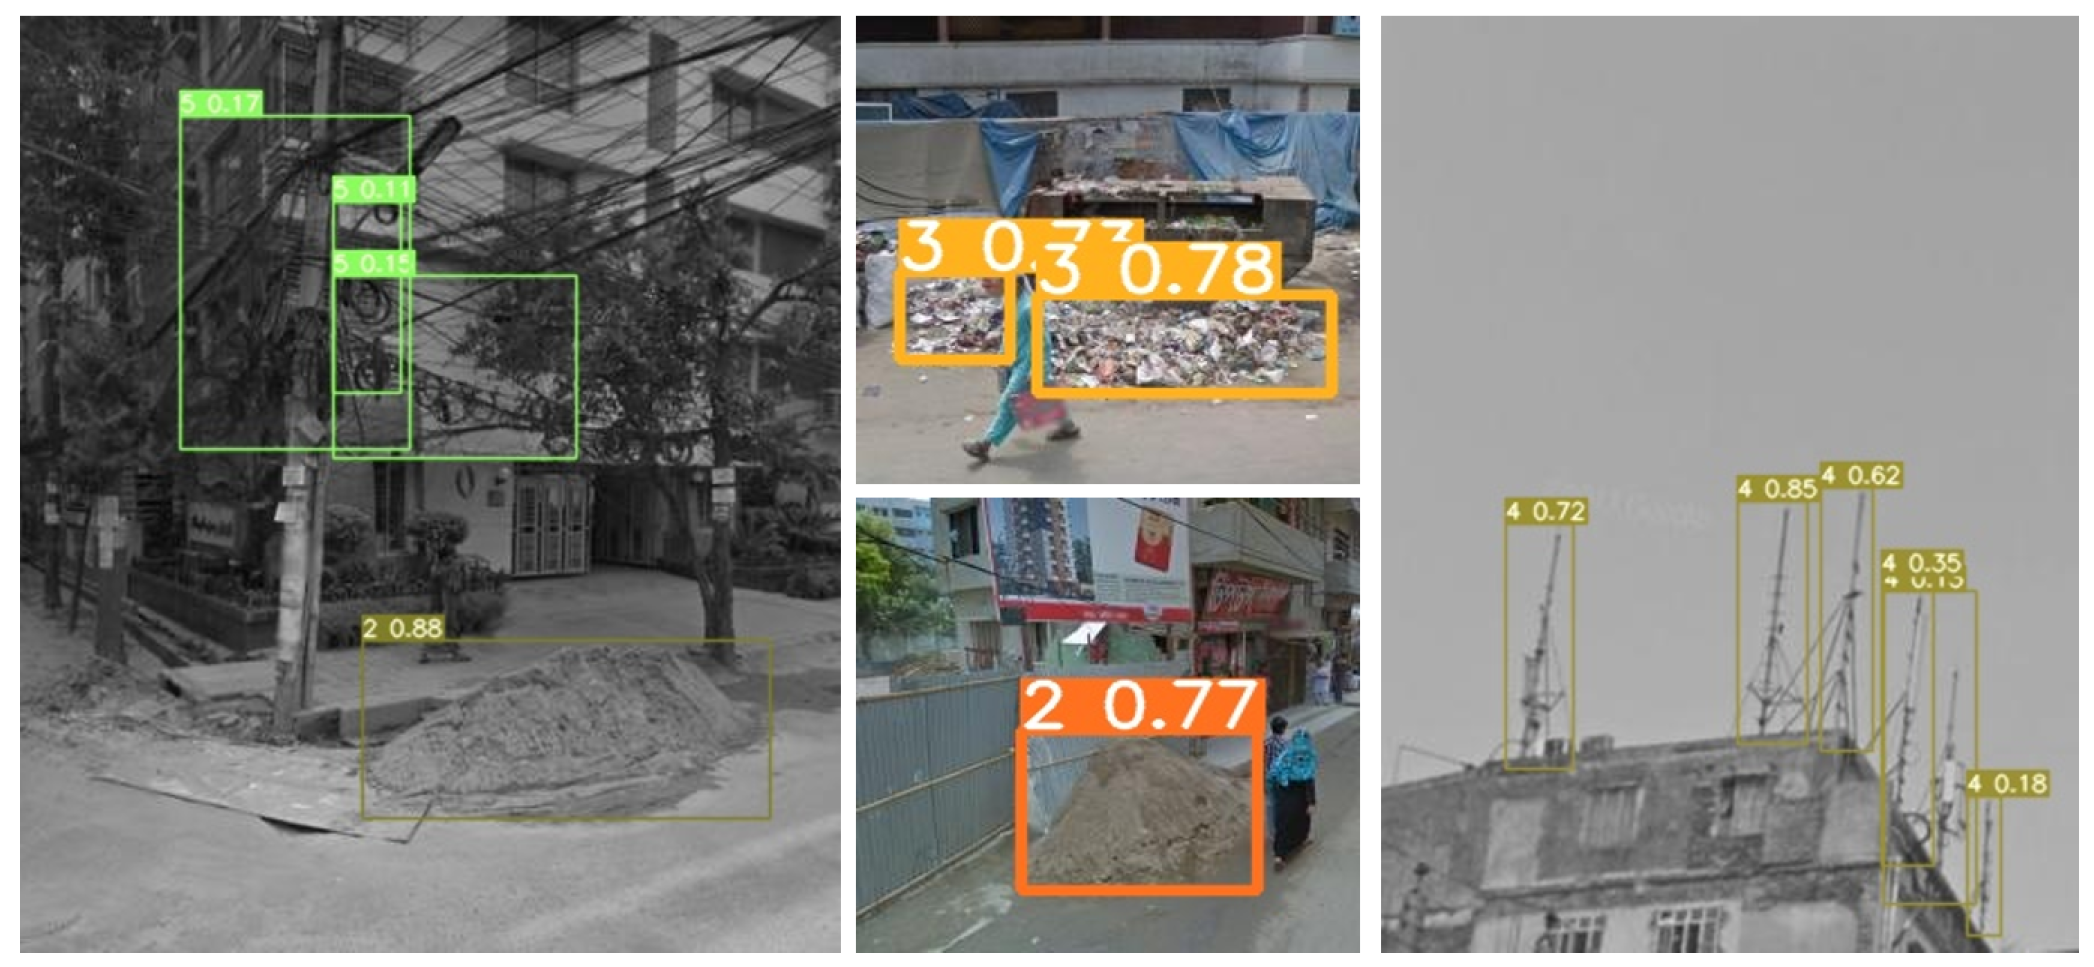
- Additionally, we collected 600 photographs of textile advertising billboards from Original Marines Ltd., a major apparel manufacturer in Gazipur, Bangladesh. Another 350 photos of building supplies were obtained from Beximco Industrial Park in Gazipur, a significant clothing supplier in Bangladesh. Finally, we gathered 200 pictures of bricks, towers, and wires from various locations throughout Dhaka, Bangladesh, including roadside scenes. The combined dataset, comprising both open-source and locally acquired images related to textile-based visual pollution, encompasses photos of various categories, as presented in Table 2. Figure 1 illustrates photographs representing different classes, including clothing trash, textile billboards, and textile dye, which were collected from Google and Microsoft Bing search engines.
3.2. Software Tools
3.3. Hardware Tools
3.4. Applied Deep Learning Models
3.4.1. SegFormer
3.4.2. EfficientDet
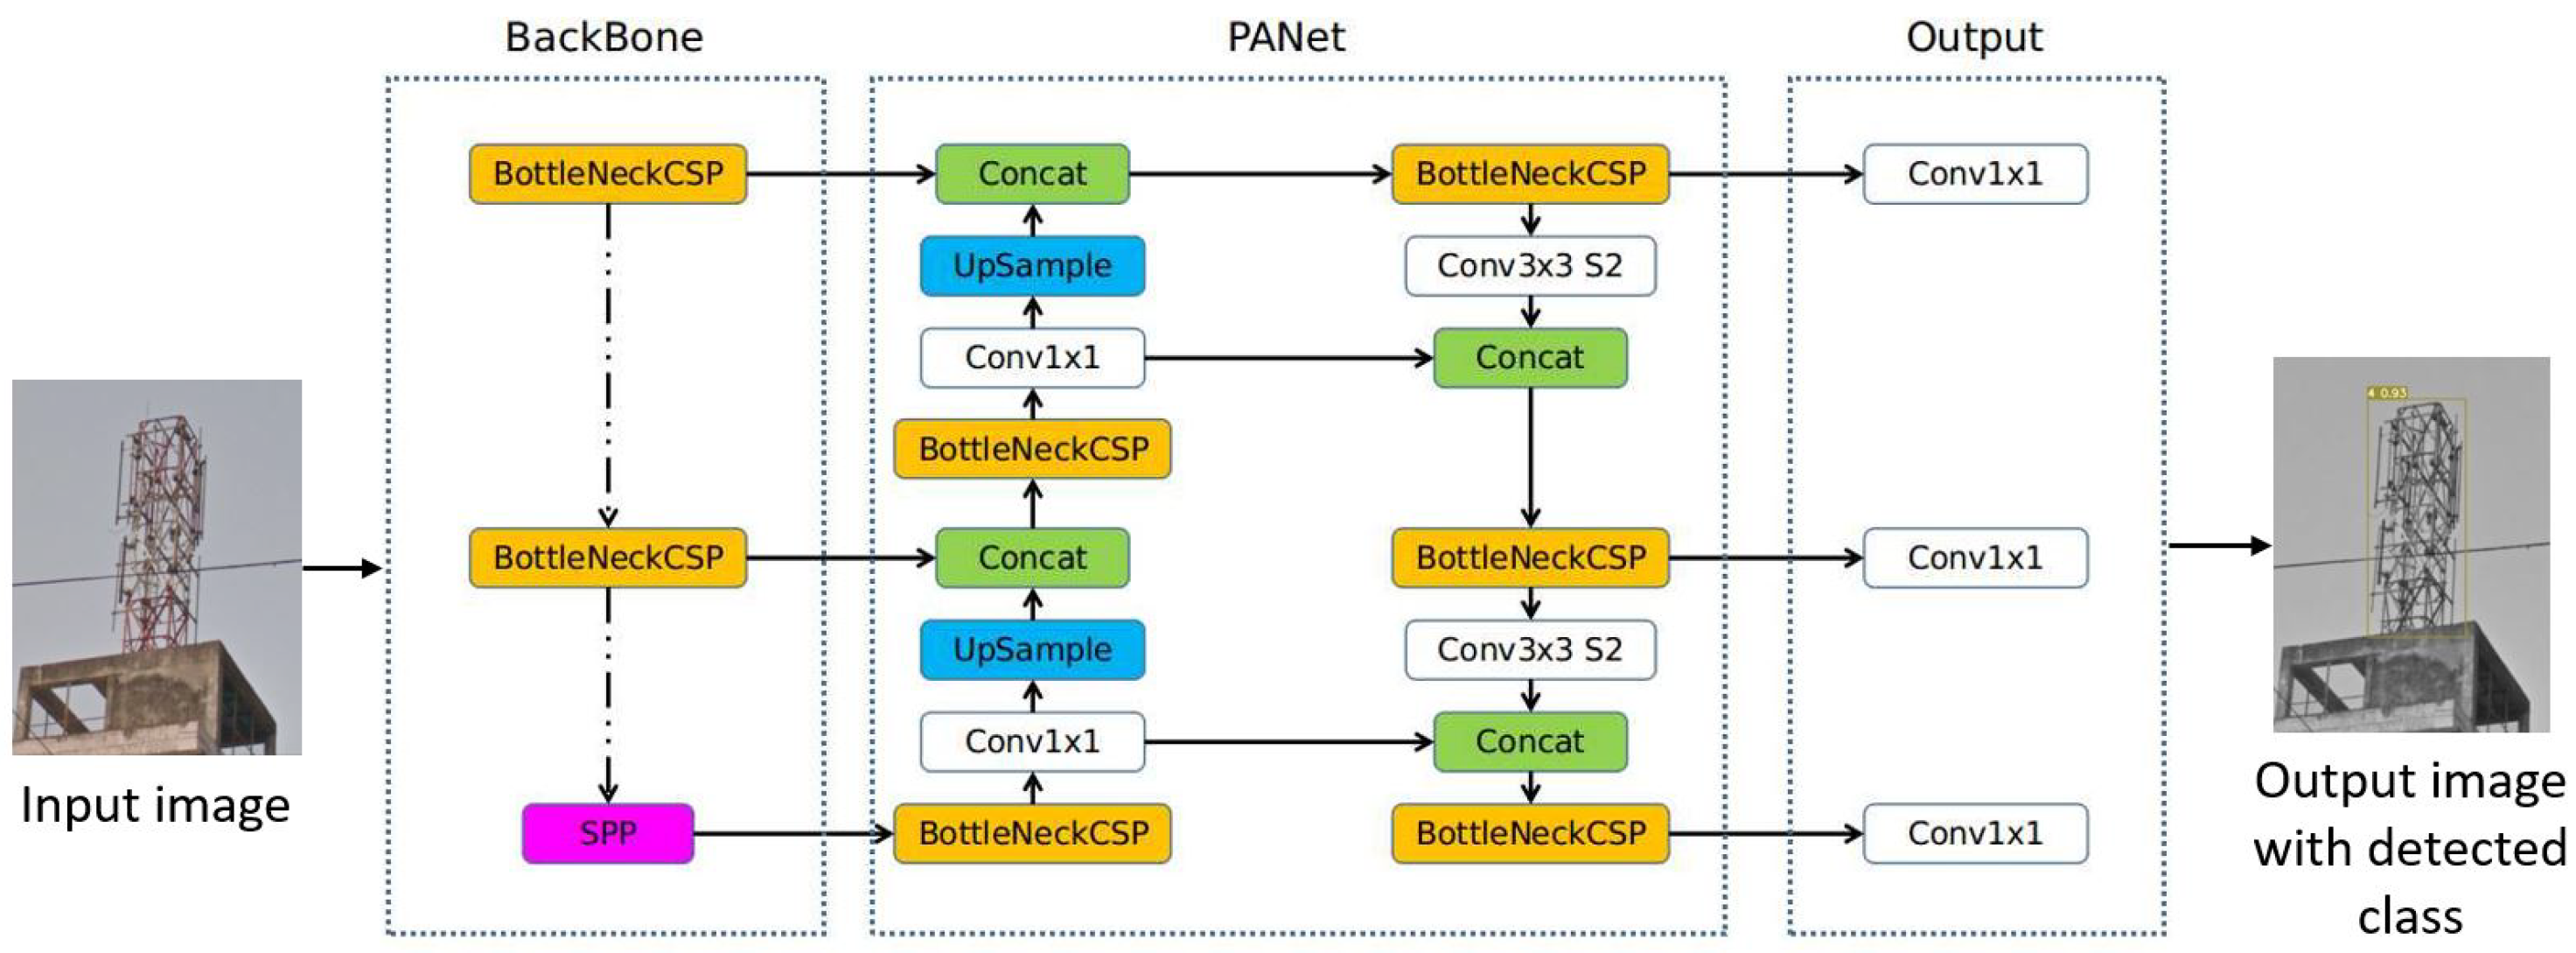
3.4.3. YOLOv5
3.4.4. YOLOv7
3.5. Software and Hardware System Design
3.5.1. Software System Workflow
3.5.2. Hardware System Workflow
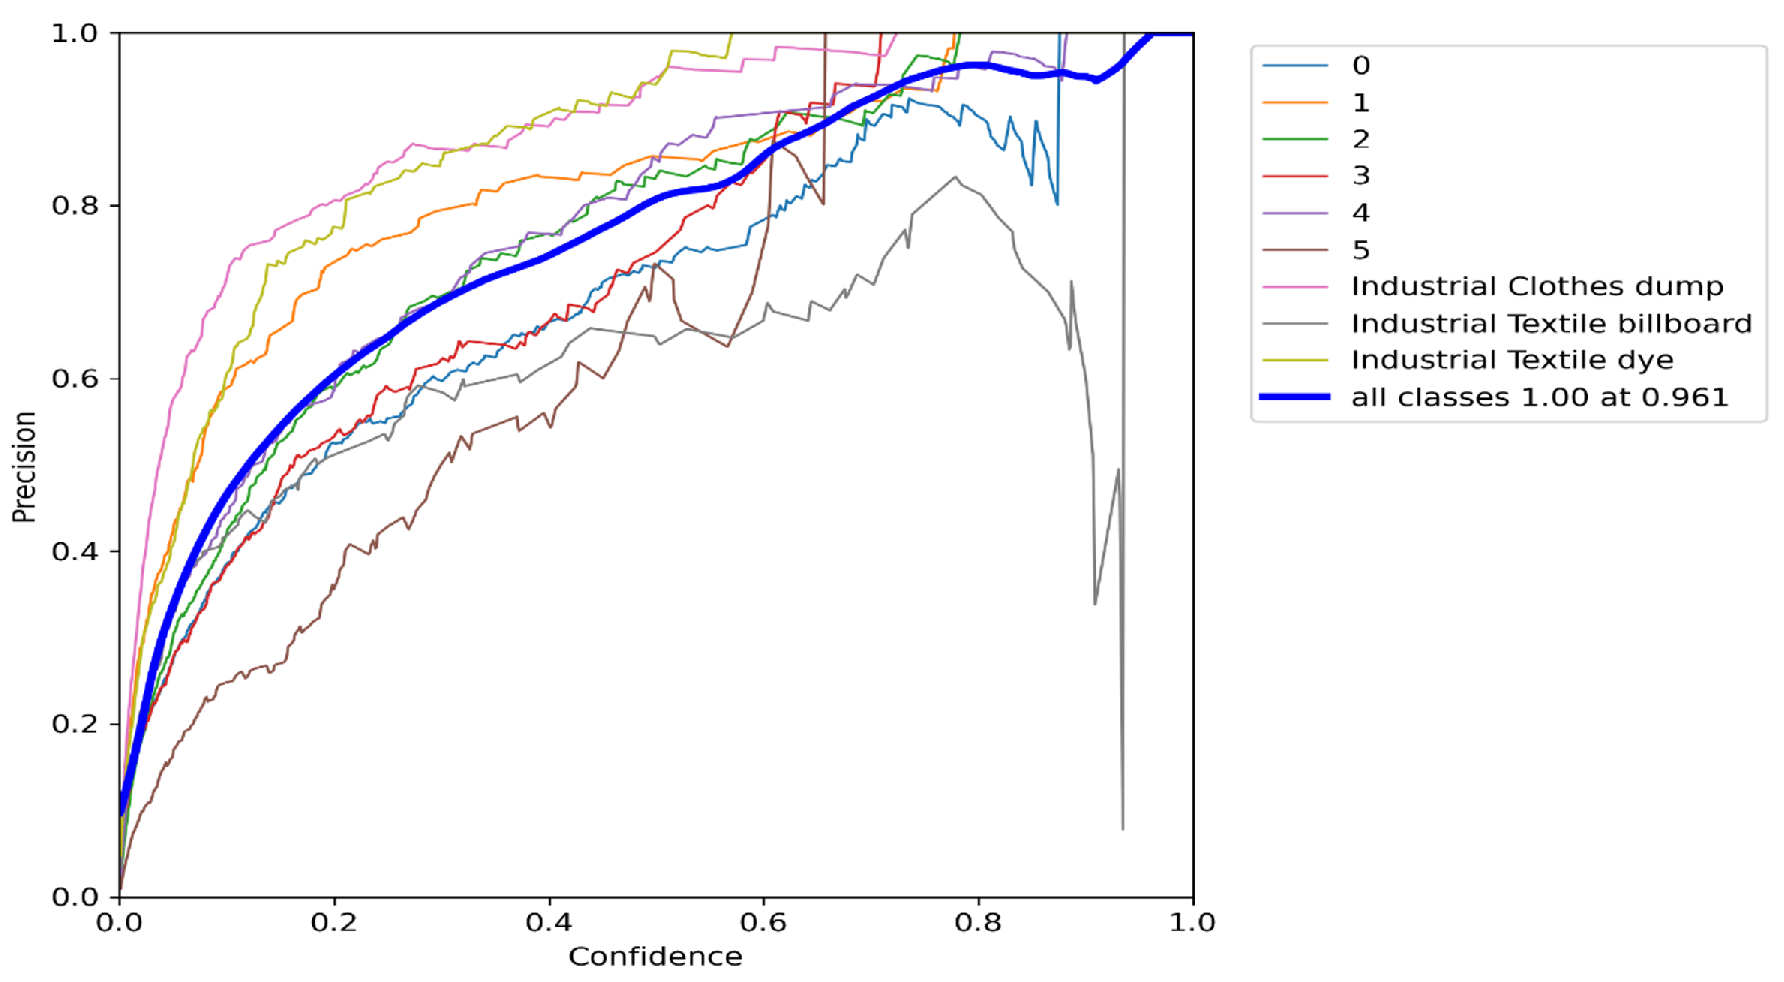
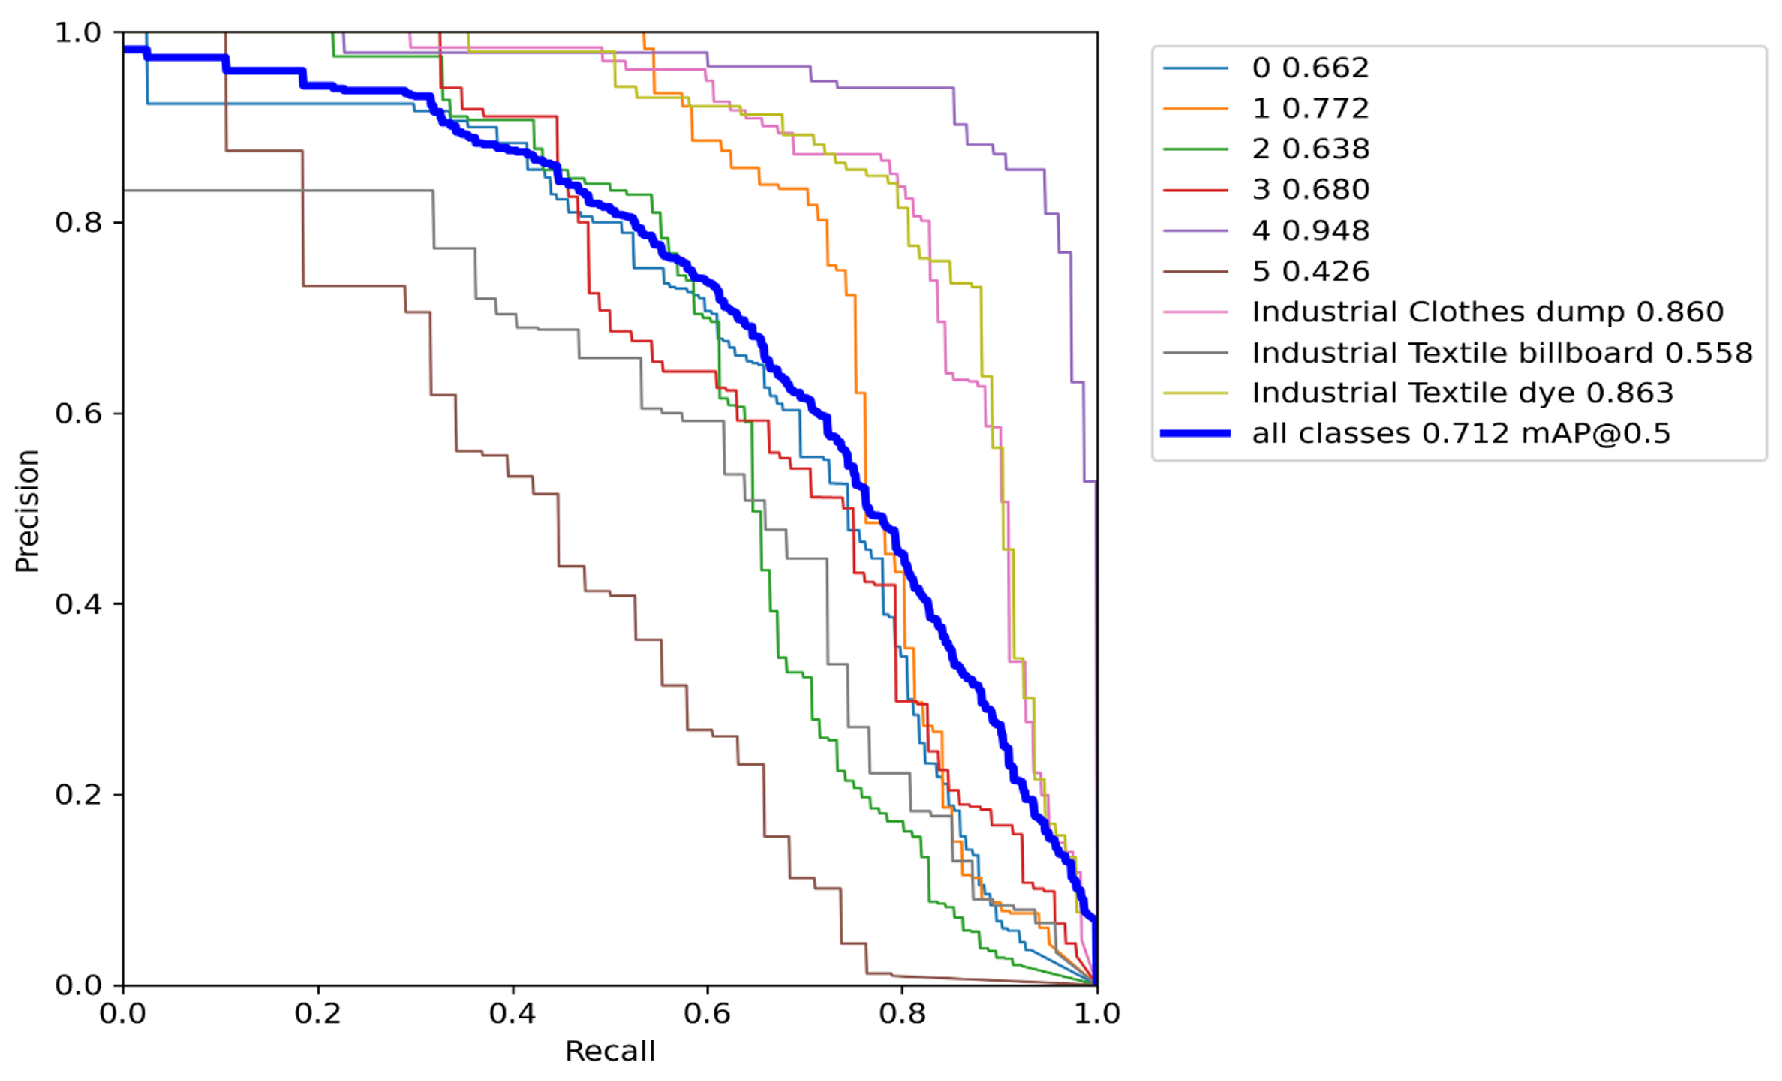
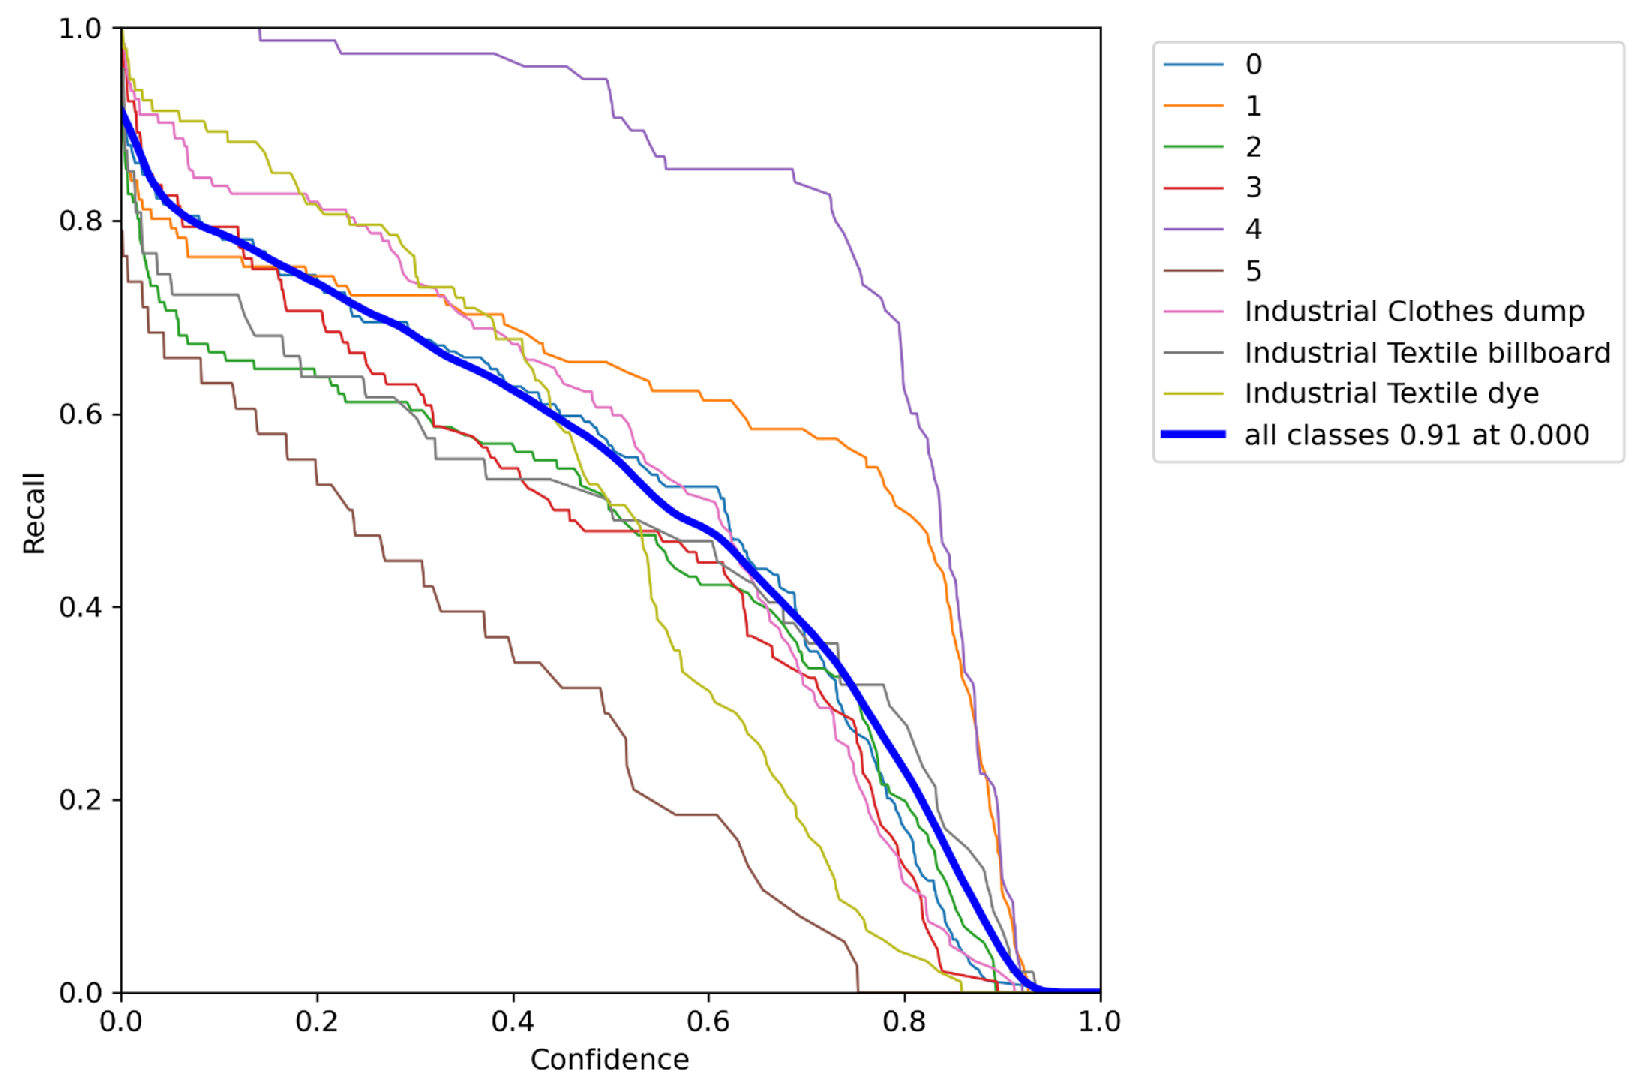
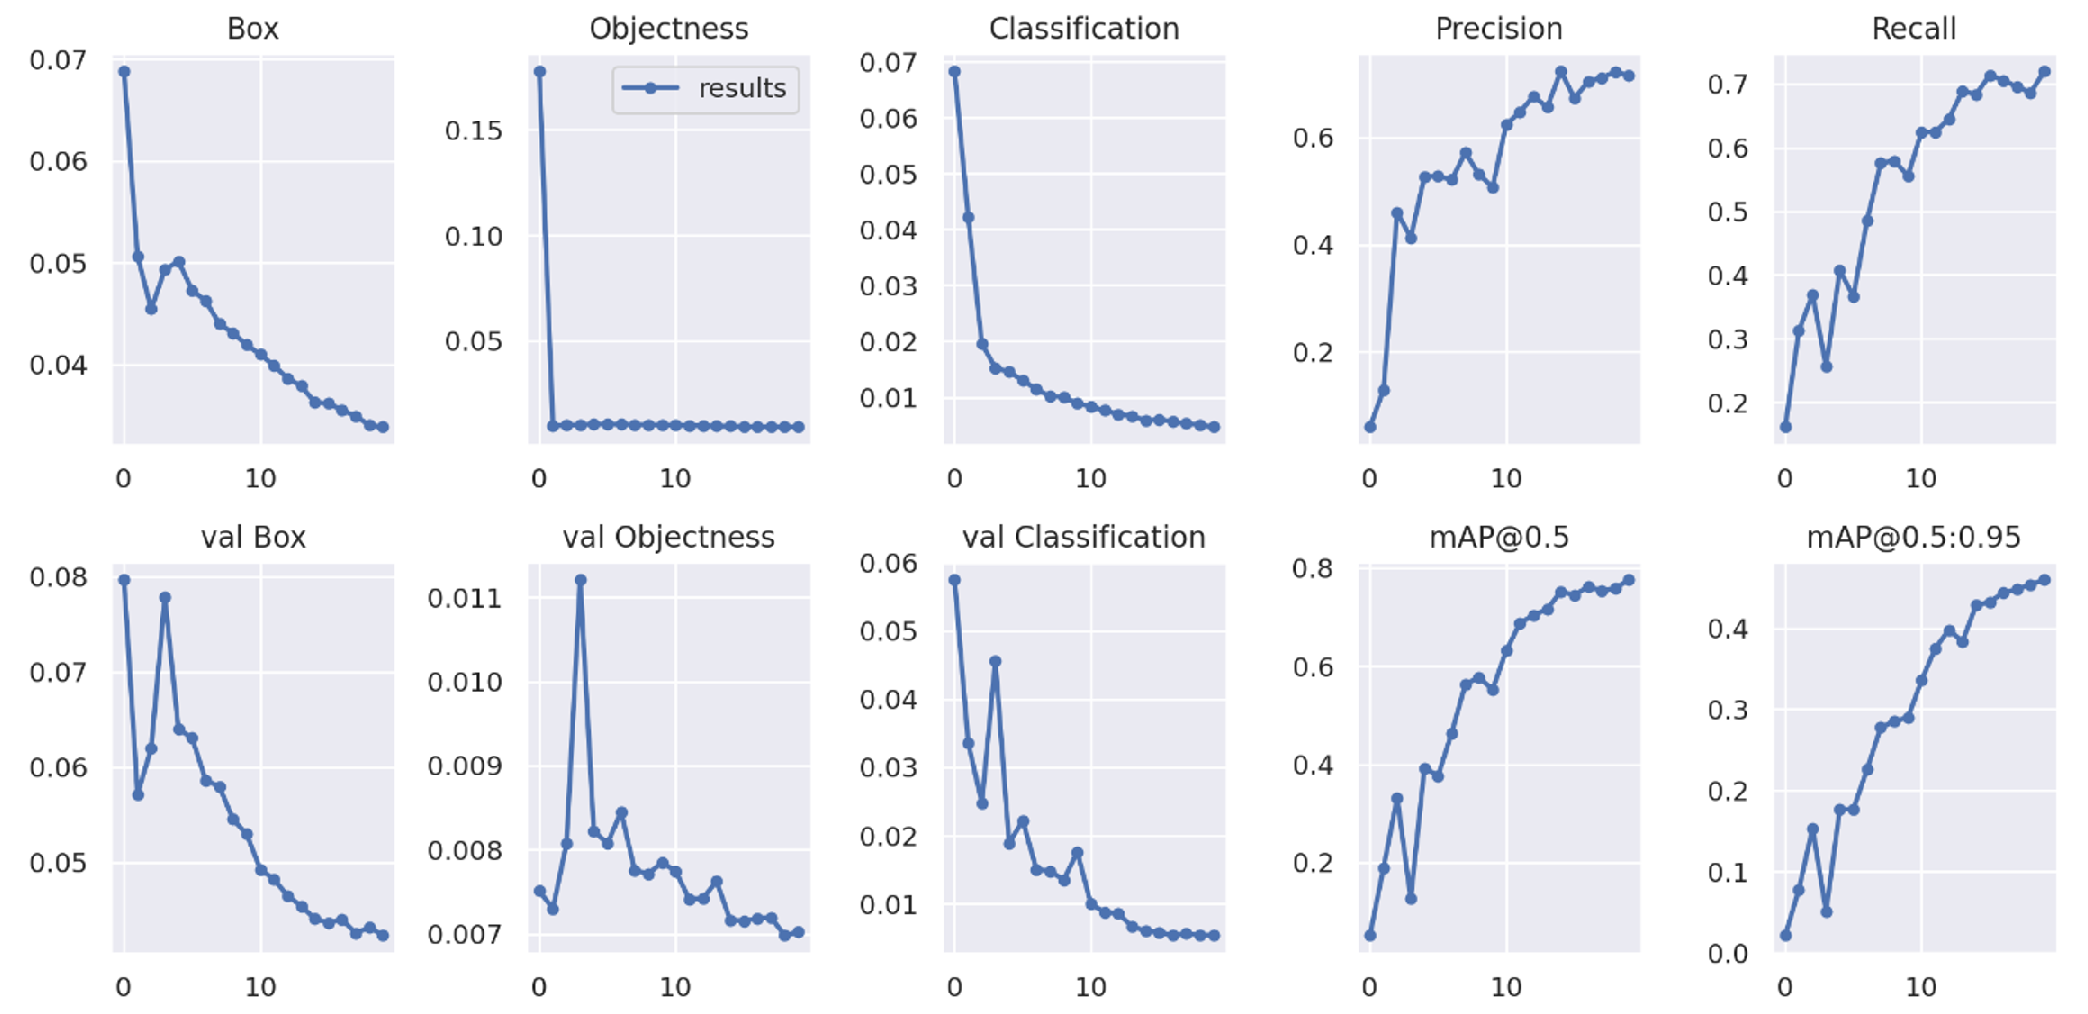
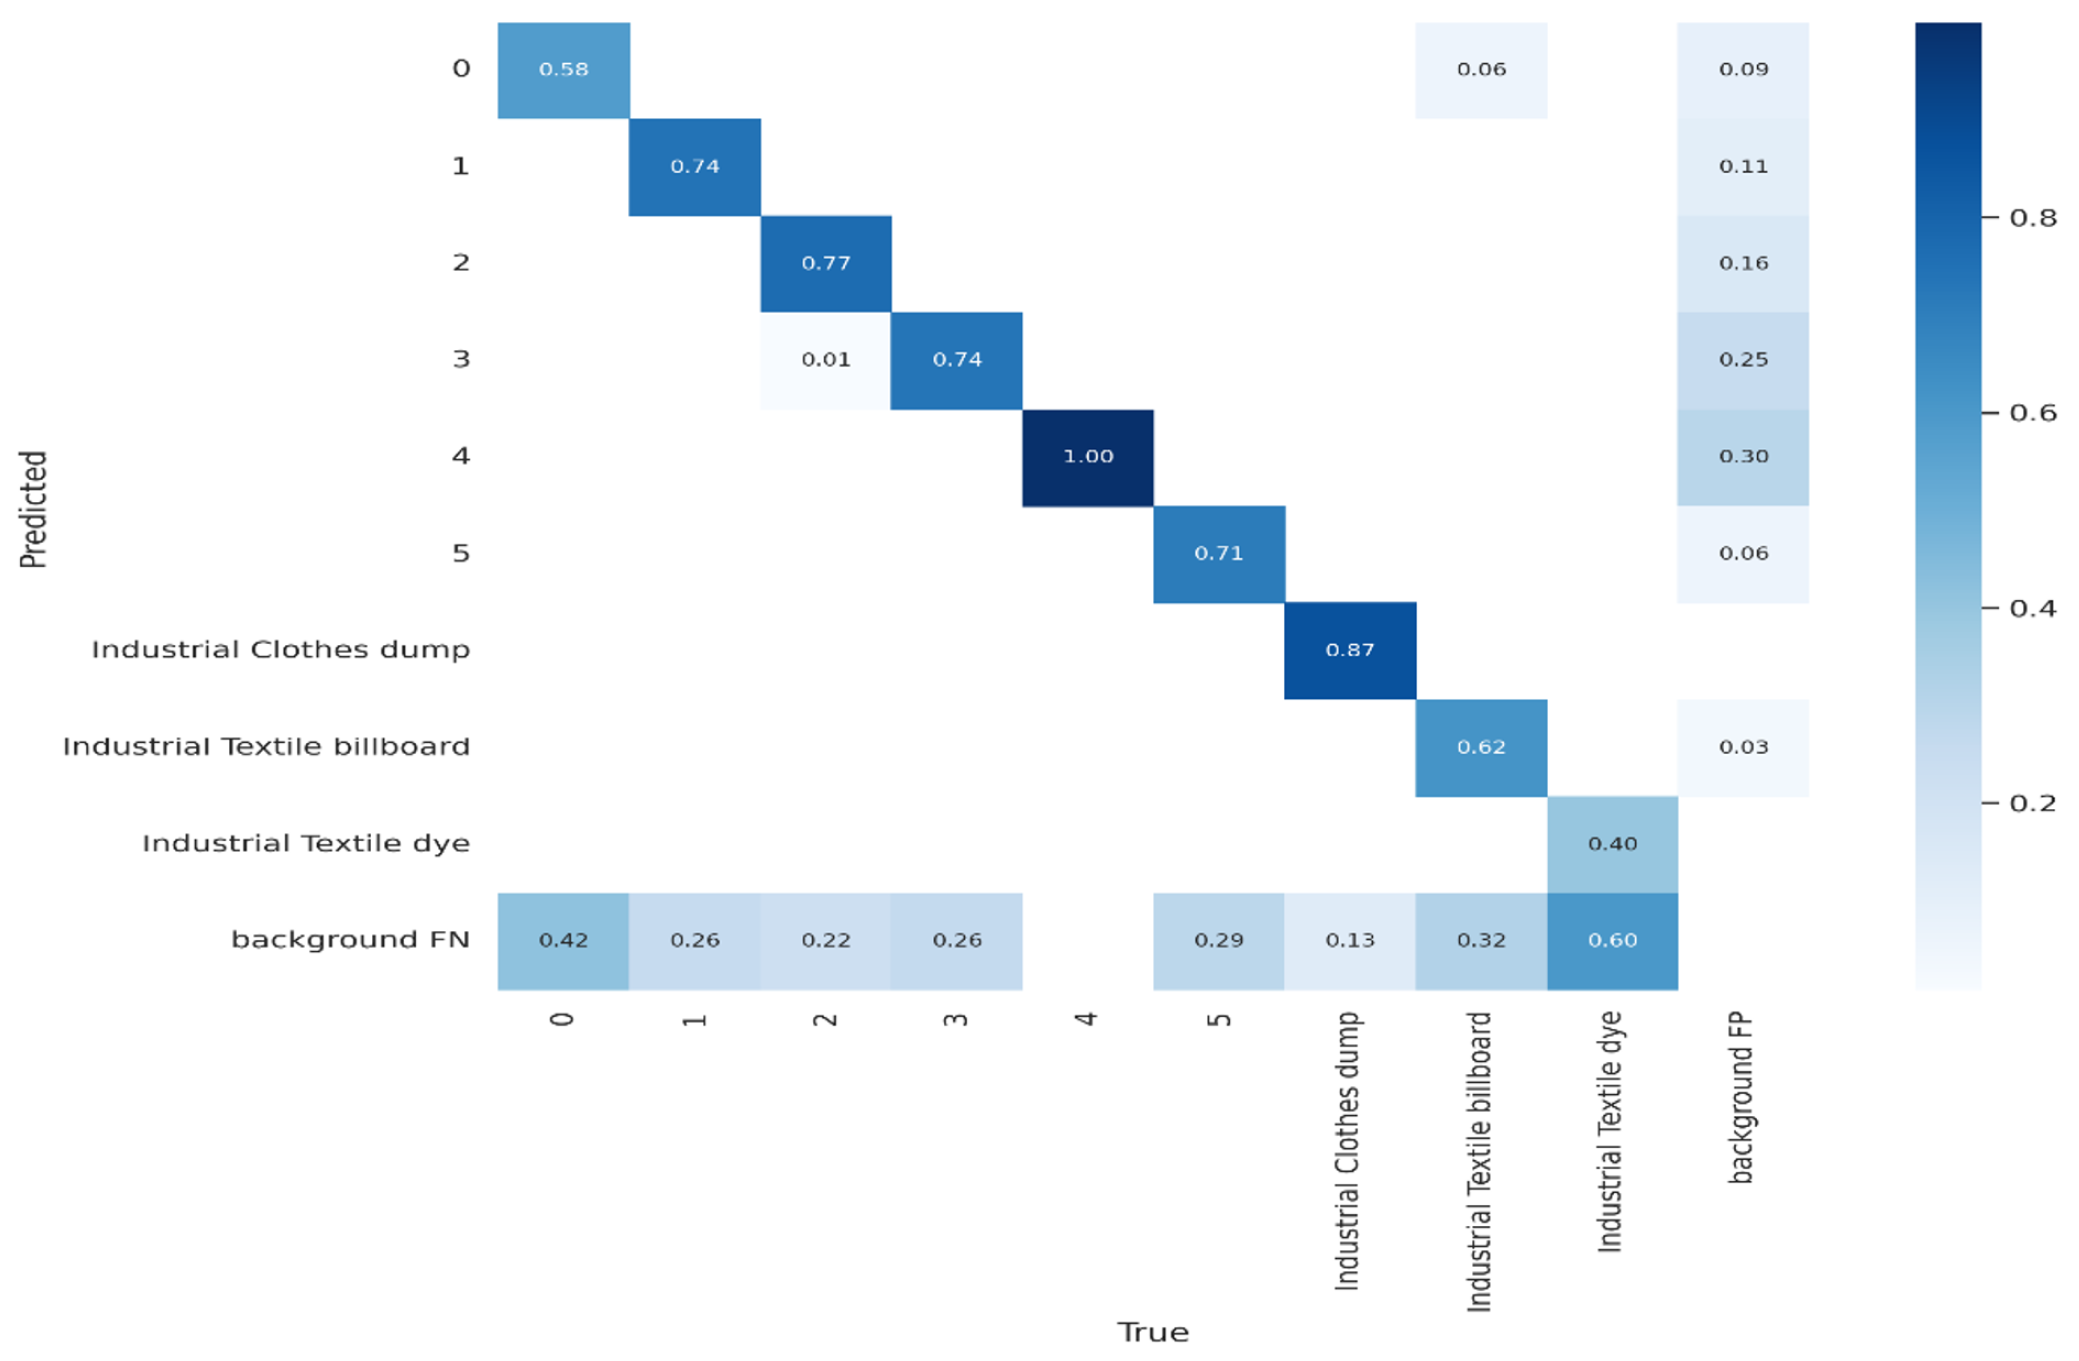
4. Result and Discussion
4.1. Result and Discussion of the Proposed Software System
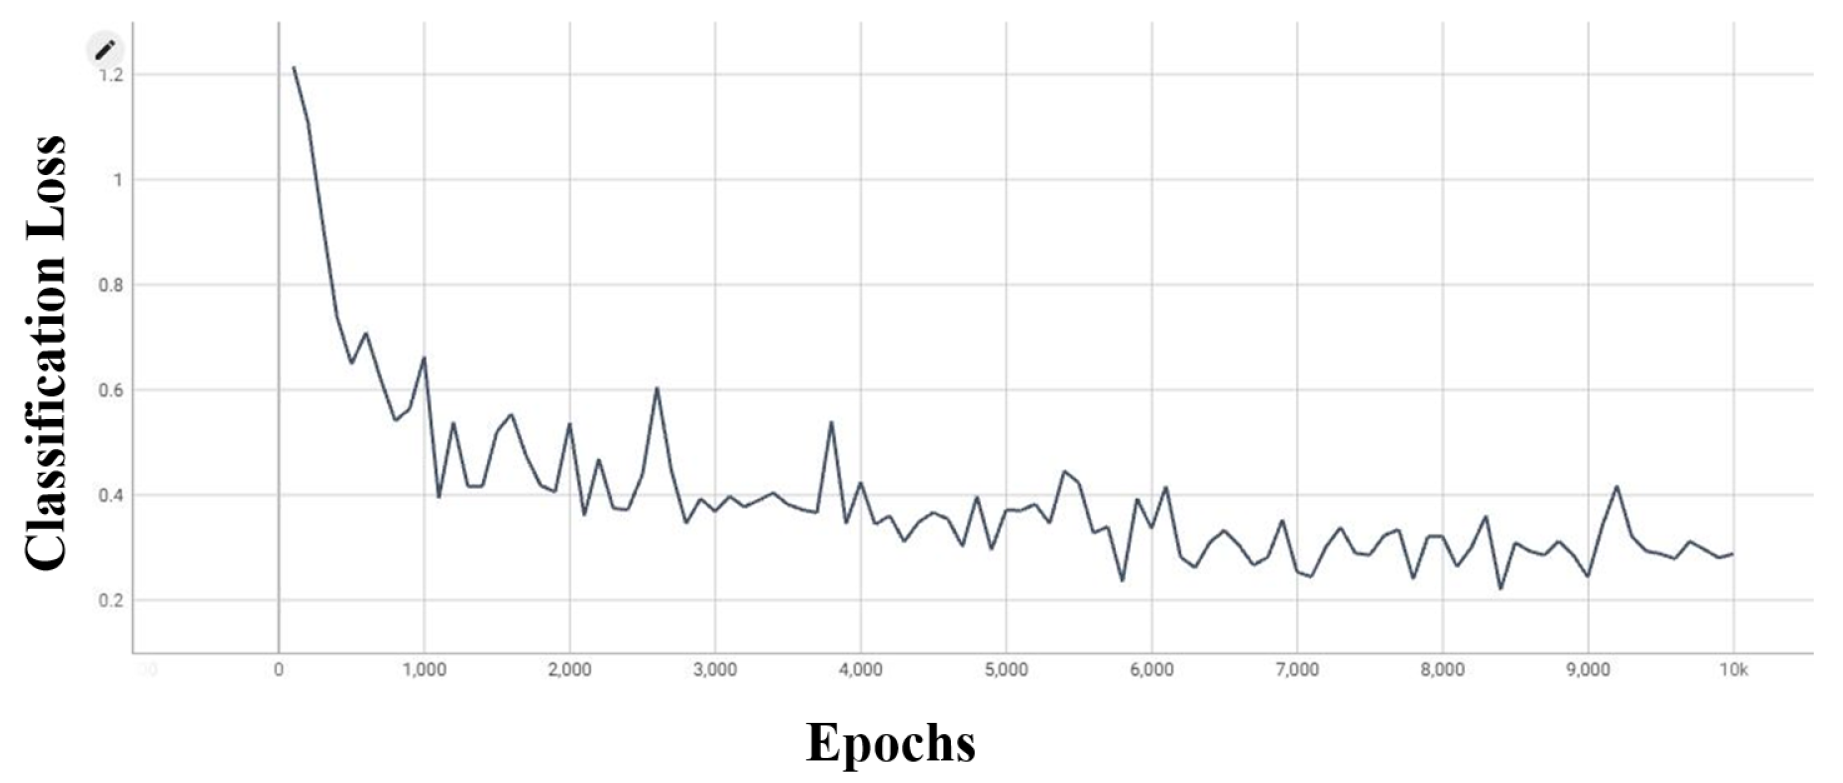
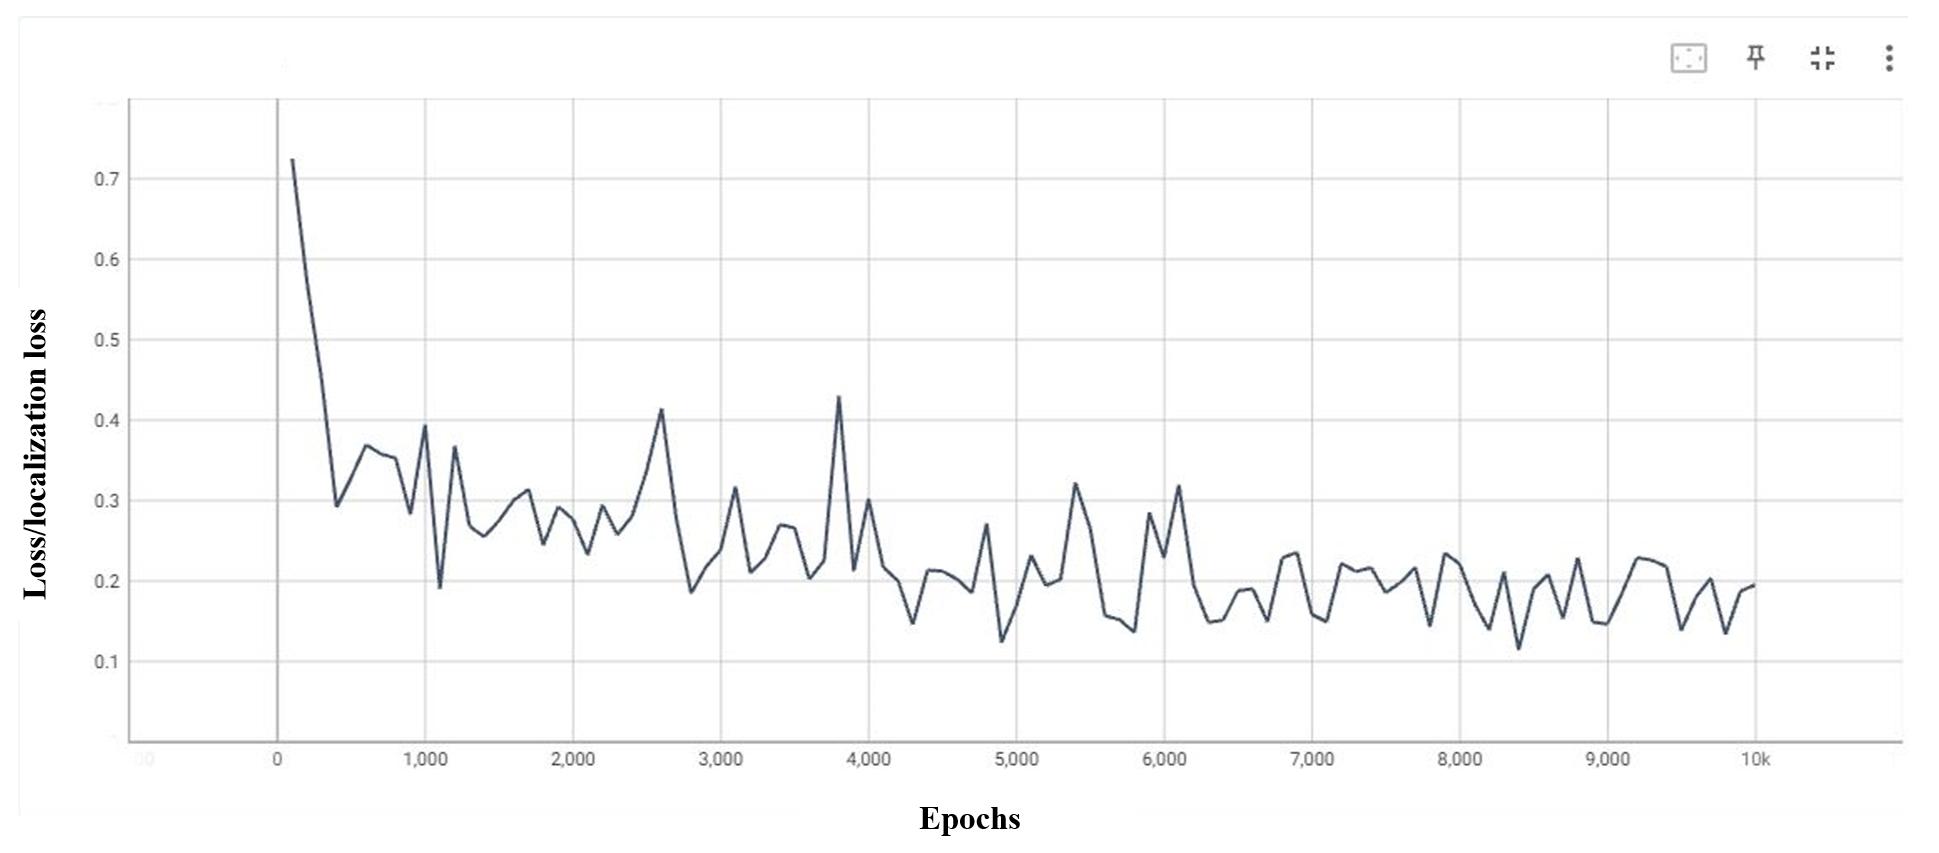
- Loss Function—Much like the cross-entropy loss, this function is applied to detect errors or discrepancies in the model’s learning process. The construction and classification of models employ sigmoid focal loss to estimate the probabilities for the YOLOv5, YOLOv7, EfficientDet, and SegFormer approaches. In multi-class classification problems, assigning greater weight to classes with the most pronounced imbalances is customary.
- Optimizer—In machine learning, optimization is a critical step that involves evaluating the prediction against the loss function to determine the optimal input weights. Stochastic gradient descent (SGD) has been employed for optimization instead of Adam to facilitate a more comprehensive comparison of the applied models. While the default setup options are effective in most scenarios, the configuration is straightforward.
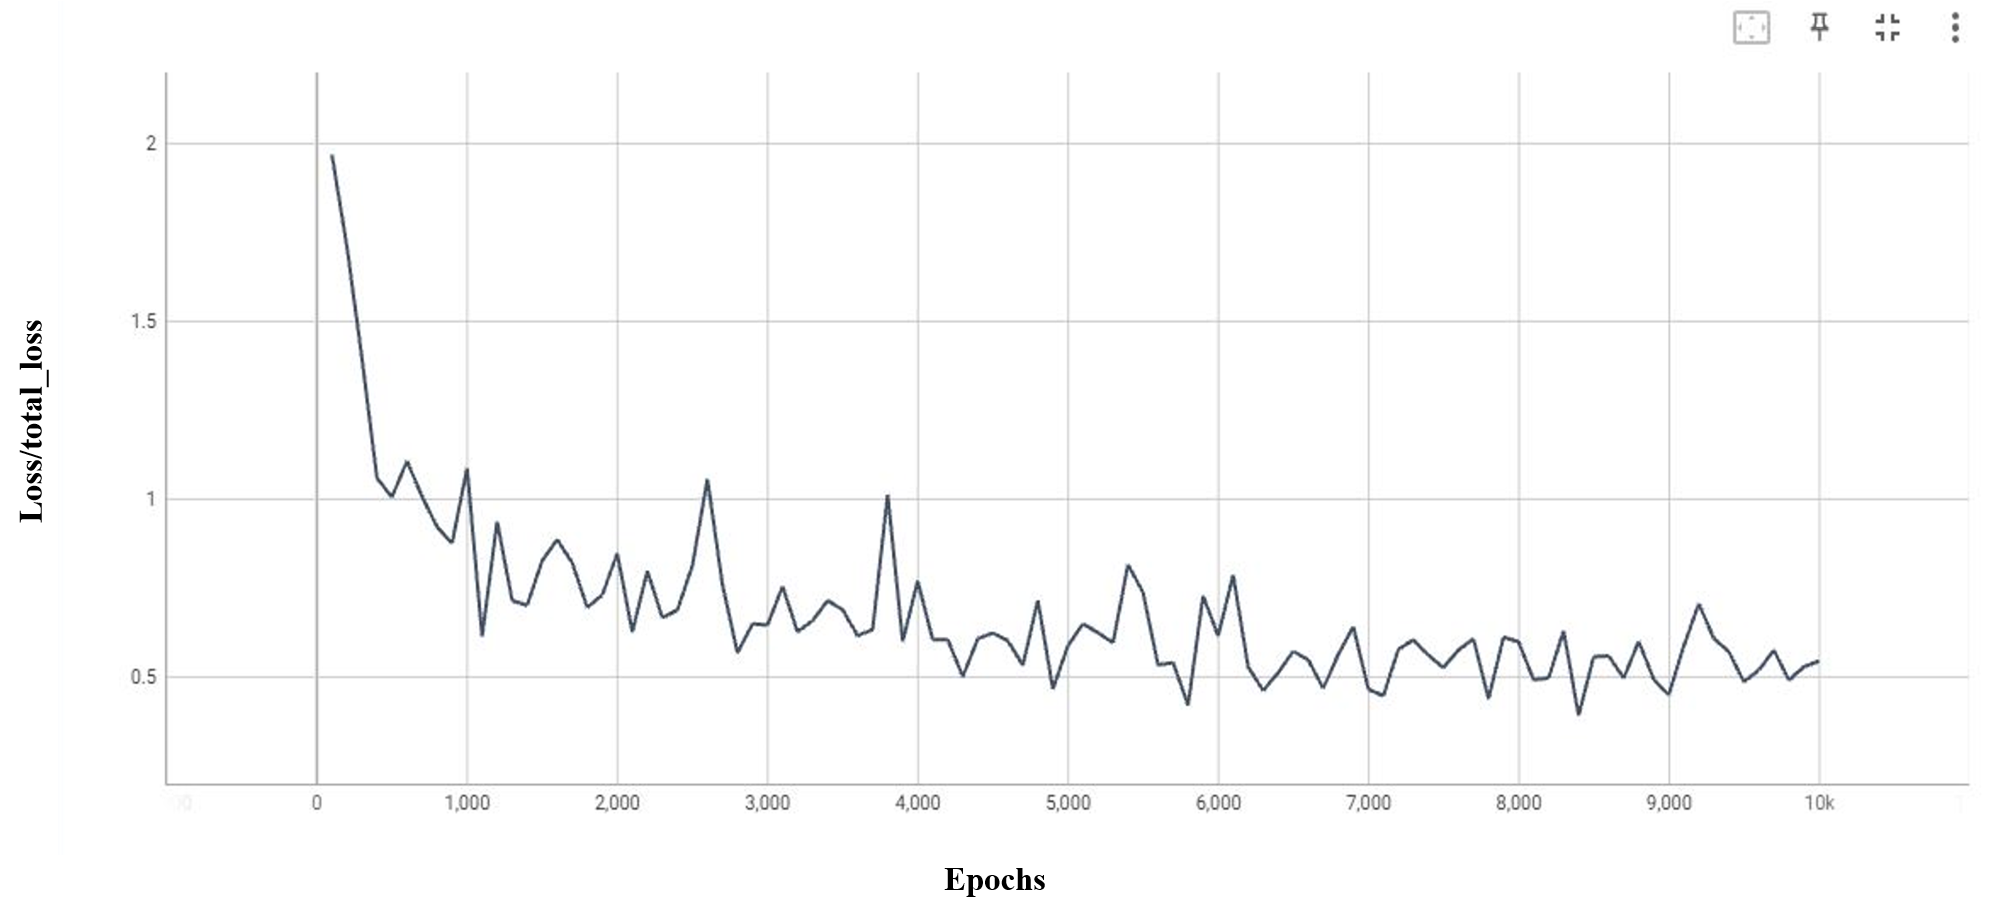
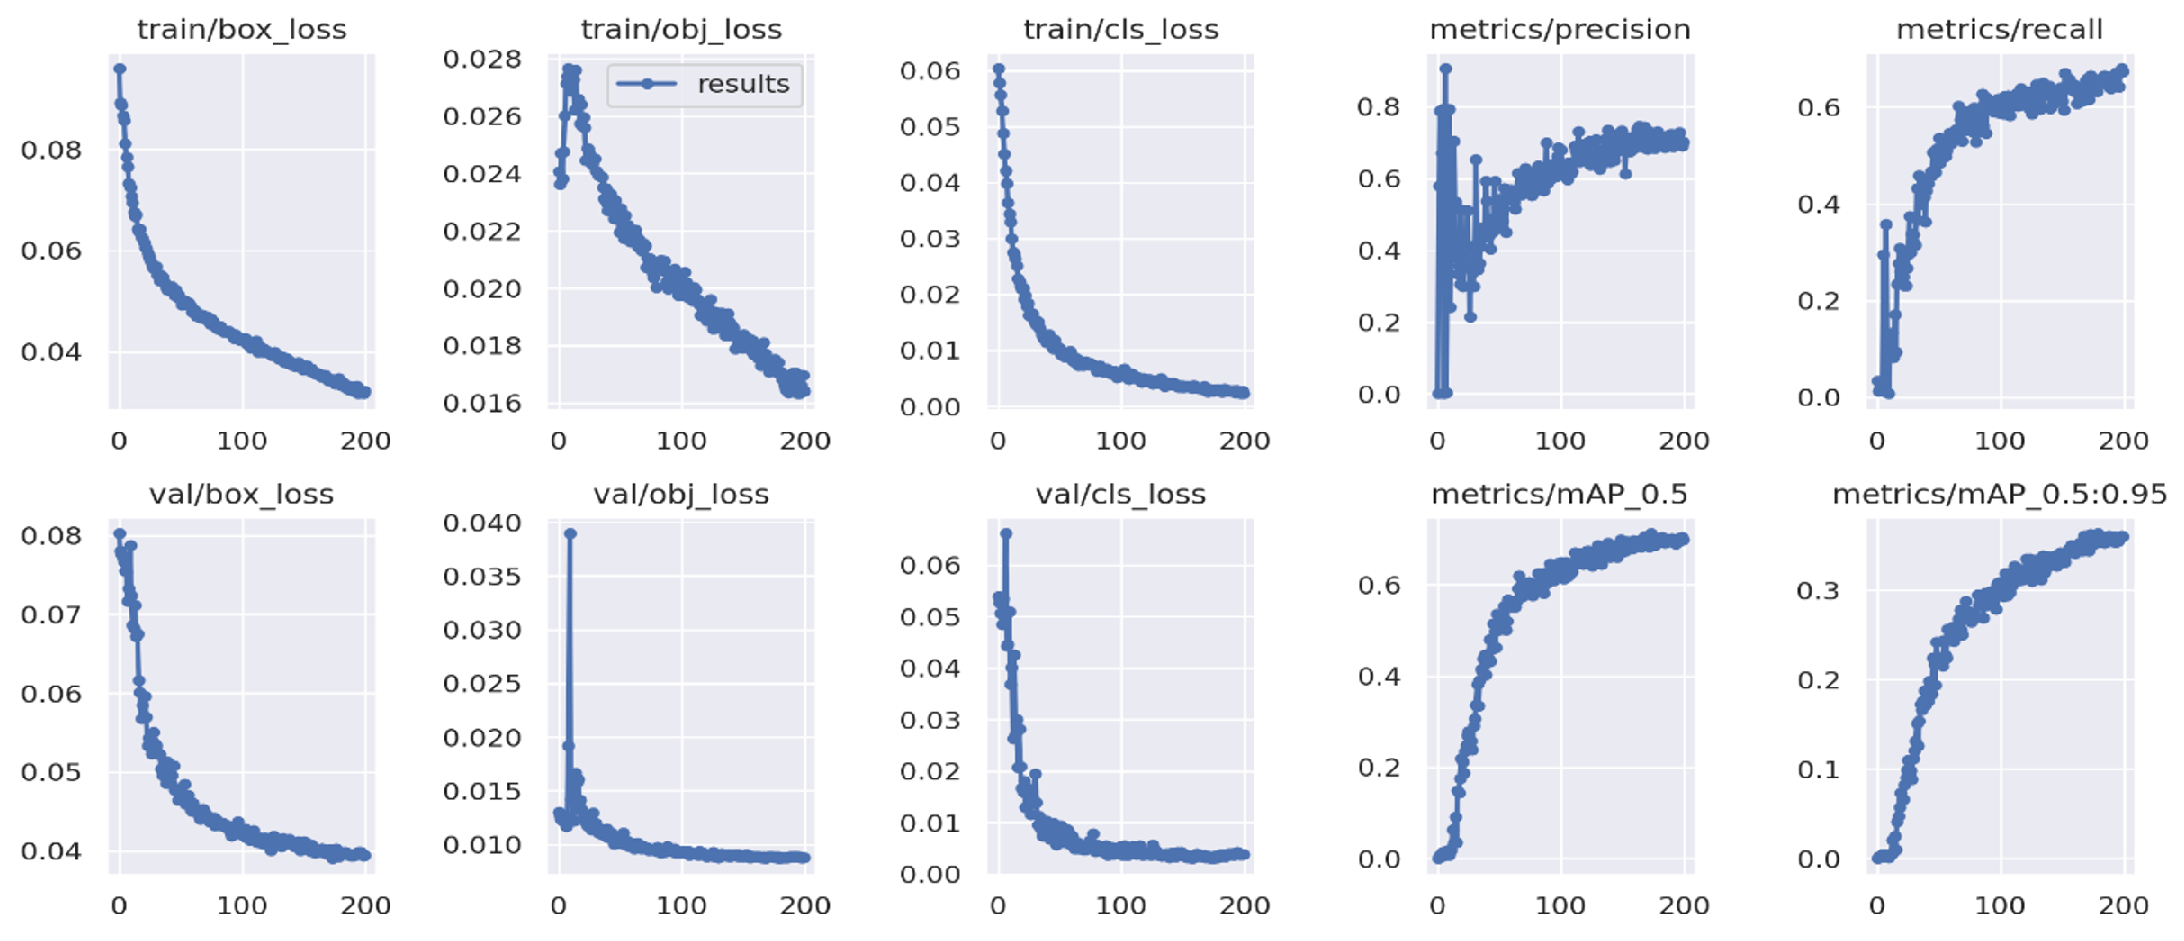
- Epochs—The number of times that the model must be evaluated during the training phase varies. The YOLOv5 model has been trained for 200 epochs, while the YOLOv7 and EfficientDet models have undergone up to 10,000 epochs.
- Batch size refers to the number of training samples used in a single iteration. Each of the models has been configured with a batch size of 16.
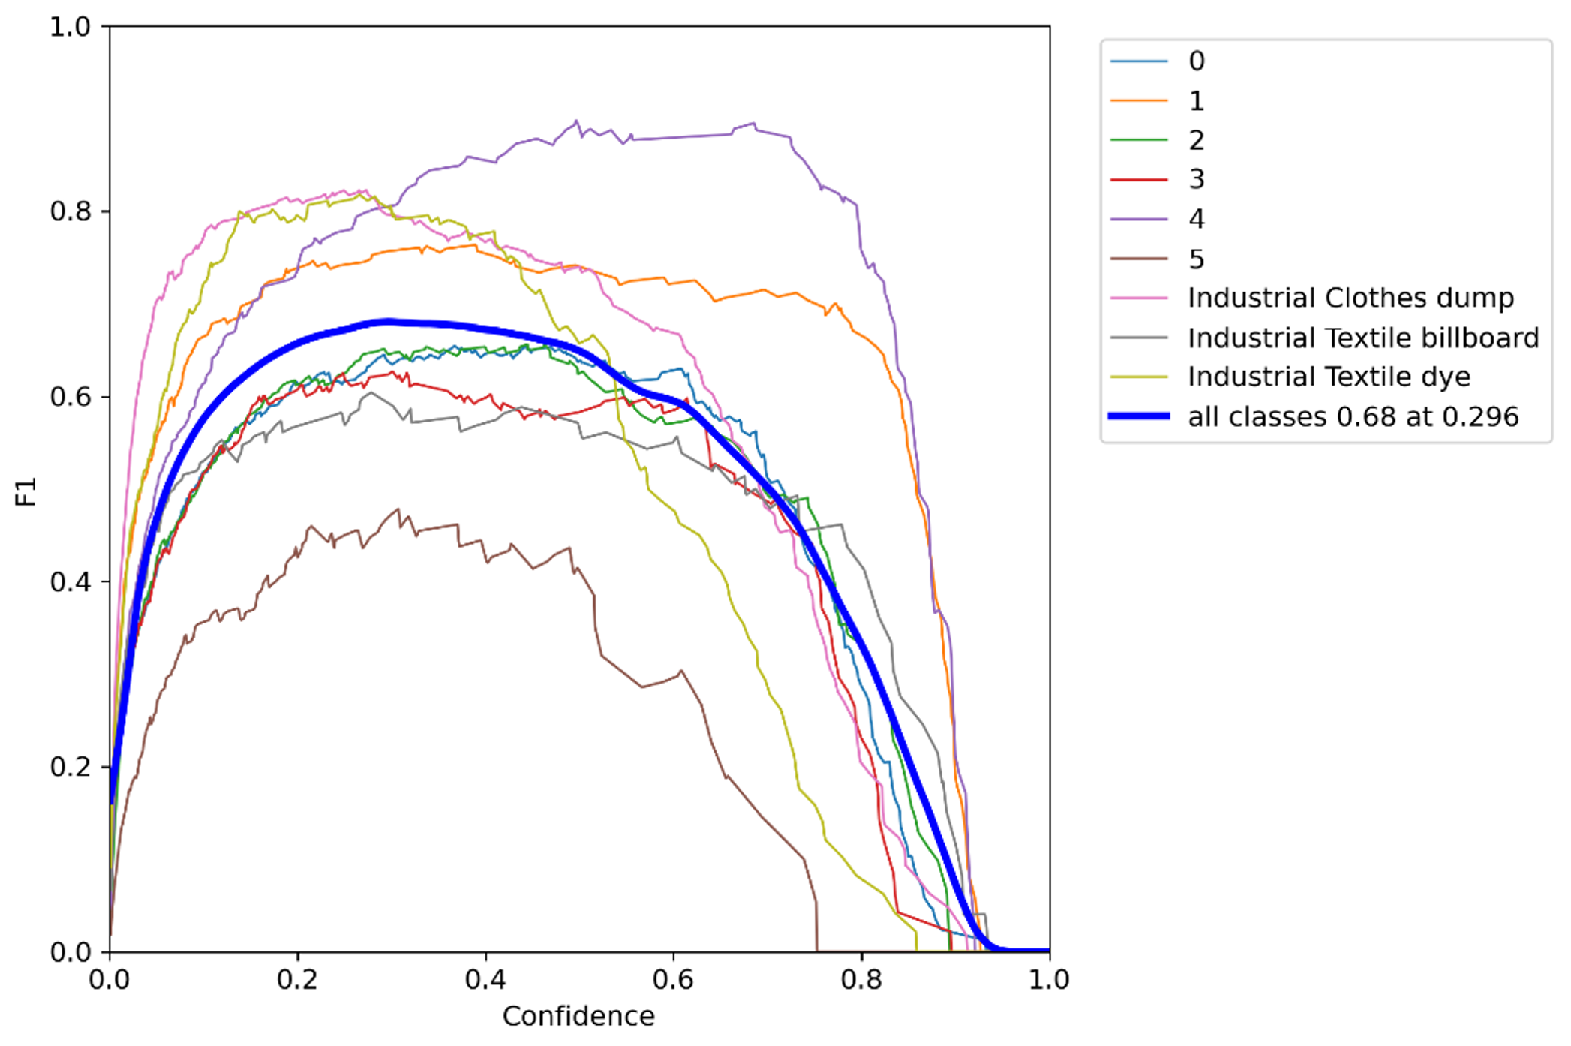
- Various evaluation metrics are employed to assess how well our model performs. We demonstrated consistent evaluation criteria, including precision, recall, mean average precision, and intersection over union, for classification accuracy in the case of EfficientDet, Segformer, YOLOv5, and YOLOv7.
- For the training of each model, we employed annotated images in both COCO JSON and TXT formats.
4.2. Hardware Proposed System
4.3. Complexity and Limitations of the Proposed System
5. Conclusions and Future Work
Author Contributions
Funding
Institutional Review Board Statement
Data Availability Statement
Conflicts of Interest
References
- Salem, A.A.; Lau, K.Y.; Rahiman, W.; Al-Gailani, S.A.; Abdul-Malek, Z.; Rahman, R.A.; Rahman, R.A.; Sheikh, U.U. Pollution Flashover Characteristics of Coated Insulators under Different Profiles of Coating Damage. Coatings 2021, 11, 1194. [Google Scholar] [CrossRef]
- Gu, K.; Liu, H.; Liu, J.; Yu, X.; Shi, T.; Qiao, J. Air Pollution Prediction in Mass Rallies With a New Temporally-Weighted Sample-Based Multitask Learner. IEEE Trans. Instrum. Meas. 2022, 71, 1–15. [Google Scholar] [CrossRef]
- Hulagu, S.; Celikoglu, H.B. Environment-Friendly School Bus Routing Problem With Heterogeneous Fleet: A Large-Scale Real Case. IEEE Trans. Intell. Transp. Syst. 2022, 23, 3461–3471. [Google Scholar] [CrossRef]
- Zhang, H.; Zhou, Z.; Ding, L.; Wu, C.; Qiu, M.; Huang, Y.; Jin, F.; Shen, T.; Yang, Y.; Hsu, L.; et al. Divergent and Convergent Imaging Markers Between Bipolar and Unipolar Depression Based on Machine Learning. IEEE J. Biomed. Health Inform. 2022, 26, 4100–4110. [Google Scholar] [CrossRef] [PubMed]
- Ren, K.; Wu, Y.; Zhang, H.; Fu, J.; Qu, D.; Lin, X. Visual Analytics of Air Pollution Propagation Through Dynamic Network Analysis. IEEE Access 2020, 8, 205289–205306. [Google Scholar] [CrossRef]
- Deng, Z.; Weng, D.; Chen, J.; Liu, R.; Wang, Z.; Bao, J.; Zheng, Y.; Wu, Y. AirVis: Visual Analytics of Air Pollution Propagation. IEEE Trans. Vis. Comput. Graph. 2020, 26, 800–810. [Google Scholar] [CrossRef] [PubMed]
- Lyu, C.; Chen, Y.; Alimasi, A.; Liu, Y.; Wang, X.; Jin, J. Seeing the Vibration: Visual-Based Detection of Low Frequency Vibration Environment Pollution. IEEE Sens. J. 2021, 21, 10073–10081. [Google Scholar] [CrossRef]
- Zhang, X.; Wang, D.; Jiang, F.; Lin, T.; Xiang, H. An Optimal Regulation Method for Parallel Water-Intake Pump Group of Drinking Water Treatment Process. IEEE Access 2020, 8, 82797–82803. [Google Scholar] [CrossRef]
- Ajayi, O.O.; Bagula, A.B.; Maluleke, H.C.; Gaffoor, Z.; Jovanovic, N.; Pietersen, K.C. WaterNet: A Network for Monitoring and Assessing Water Quality for Drinking and Irrigation Purposes. IEEE Access 2022, 10, 48318–48337. [Google Scholar] [CrossRef]
- Saad, A.; Benyamina, A.E.H.; Gamatié, A. Water Management in Agriculture: A Survey on Current Challenges and Technological Solutions. IEEE Access 2020, 8, 38082–38097. [Google Scholar] [CrossRef]
- Tiyasha, T.; Bhagat, S.K.; Fituma, F.; Tung, T.M.; Shahid, S.; Yaseen, Z.M. Dual Water Choices: The Assessment of the Influential Factors on Water Sources Choices Using Unsupervised Machine Learning Market Basket Analysis. IEEE Access 2021, 9, 150532–150544. [Google Scholar] [CrossRef]
- Wu, D.; Wang, H.; Mohammed, H.; Seidu, R. Quality Risk Analysis for Sustainable Smart Water Supply Using Data Perception. IEEE Trans. Sustain. Comput. 2020, 5, 377–388. [Google Scholar] [CrossRef]
- Chopade, S.; Gupta, H.P.; Mishra, R.; Kumari, P.; Dutta, T. An Energy-Efficient River Water Pollution Monitoring System in Internet of Things. IEEE Trans. Green Commun. Netw. 2021, 5, 693–702. [Google Scholar] [CrossRef]
- Wan, L.; Sun, Y.; Lee, I.; Zhao, W.; Xia, F. Industrial Pollution Areas Detection and Location via Satellite-Based IIoT. IEEE Trans. Ind. Inform. 2021, 17, 1785–1794. [Google Scholar] [CrossRef]
- Ahmed, N.; Islam, M.N.; Tuba, A.S.; Mahdy, M.; Sujauddin, M. Solving visual pollution with deep learning: A new nexus in environmental management. J. Environ. Manag. 2019, 248, 109253. [Google Scholar] [CrossRef] [PubMed]
- Andjarsari, S.; Subadyo, A.T.; Bonifacius, N. Safe Construction And Visual Pollution Of Billboards Along Main Street. IOP Conf. Ser. Earth Environ. Sci. 2022, 999, 012015. [Google Scholar] [CrossRef]
- Hossain, M.Y.; Nijhum, I.R.; Sadi, A.A.; Shad, M.T.M.; Rahman, R.M. Visual Pollution Detection Using Google Street View and YOLO. In Proceedings of the Annual Ubiquitous Computing, Electronics & Mobile Communication Conference, New York, NY, USA, 1–4 December 2021; pp. 433–440. [Google Scholar] [CrossRef]
- Yang, Z.; Li, D. WasNet: A Neural Network-Based Garbage Collection Management System. IEEE Access 2020, 8, 103984–103993. [Google Scholar] [CrossRef]
- Mittal, G.; Yagnik, K.B.; Garg, M.; Krishnan, N.C. SpotGarbage: Smartphone App to Detect Garbage Using Deep Learning. In Proceedings of the International Joint Conference on Pervasive and Ubiquitous Computing, Heidelberg, Germany, 12–16 September 2016; pp. 940–945. [Google Scholar]
- Marin, I.; Mladenović, S.; Gotovac, S.; Zaharija, G. Deep-Feature-Based Approach to Marine Debris Classification. Appl. Sci. 2021, 11, 5644. [Google Scholar] [CrossRef]
- Tasnim, N.H.; Afrin, S.; Biswas, B.; Anye, A.A.; Khan, R. Automatic classification of textile visual pollutants using deep learning networks. Alex. Eng. J. 2023, 62, 391–402. [Google Scholar] [CrossRef]
- Bakar, S.A.; al Sharaa, A.; Maulan, S.; Munther, R. Measuring Visual Pollution Threshold along Kuala Lumpur Historic Shopping District Streets Using Cumulative Area Analysis. In Proceedings of the Visual Resource Stewardship Conference, Lemont, IL, USA, 27–30 October 2019. [Google Scholar]
- Setiawan, W.; Wahyudin, A.; Widianto, G. The use of scale invariant feature transform (SIFT) algorithms to identification garbage images based on product label. In Proceedings of the International Conference on Science in Information Technology, Bandung, Indonesia, 25–26 October 2017; pp. 336–341. [Google Scholar]
- Ahmed, I.; Din, S.; Jeon, G.; Piccialli, F.; Fortino, G. Towards Collaborative Robotics in Top View Surveillance: A Framework for Multiple Object Tracking by Detection Using Deep Learning. IEEE/CAA J. Autom. Sin. 2021, 8, 1253–1270. [Google Scholar] [CrossRef]
- AlElaiwi, M.; Al-antari, M.A.; Ahmad, H.F.; Azhar, A.; Almarri, B.; Hussain, J. VPP: Visual Pollution Prediction Framework Based on a Deep Active Learning Approach Using Public Road Images. Mathematics 2023, 11, 186. [Google Scholar] [CrossRef]
- Sun, Y.; Loparo, K. Context Aware Image Annotation in Active Learning with Batch Mode. In Proceedings of the Annual Computer Software and Applications Conference, Milwaukee, WI, USA, 15–19 July 2019; Volume 1, pp. 952–953. [Google Scholar] [CrossRef]
- Wang, S.; Yang, Y.; Wu, Z.; Qian, Y.; Yu, K. Data Augmentation Using Deep Generative Models for Embedding Based Speaker Recognition. IEEE/ACM Trans. Audio Speech Lang. Process. 2020, 28, 2598–2609. [Google Scholar] [CrossRef]
- Qiu, C.; Li, H.; Guo, W.; Chen, X.; Yu, A.; Tong, X.; Schmitt, M. Transferring Transformer-Based Models for Cross-Area Building Extraction From Remote Sensing Images. IEEE J. Sel. Top. Appl. Earth Obs. Remote Sens. 2022, 15, 4104–4116. [Google Scholar] [CrossRef]
- Mekhalfi, M.L.; Nicolò, C.; Bazi, Y.; Rahhal, M.M.A.; Alsharif, N.A.; Maghayreh, E.A. Contrasting YOLOv5, Transformer, and EfficientDet Detectors for Crop Circle Detection in Desert. IEEE Geosci. Remote Sens. Lett. 2022, 19, 1–5. [Google Scholar] [CrossRef]
- Wang, C.; Bochkovskiy, A.; Liao, H. YOLOv7: Trainable Bag-of-Freebies Sets New State-of-the-Art for Real-Time Object Detectors. In Proceedings of the Conference on Computer Vision and Pattern Recognition (CVPR), Vancouver, BC, Canada, 17–24 June 2023; pp. 7464–7475. [Google Scholar] [CrossRef]


| Ref | Sample Size | Number of Classes | Limitations |
|---|---|---|---|
| [15] | 1200 | 4 | Low accuracy, limited classes of objects |
| [17] | 1400 | 6 | Low accuracy |
| [20] | 2395 | 6 | Detects underwater pollutants only |
| [21] | 2663 | 3 | Detects textile-based pollutants only, limited classes of objects |
| [25] | 34,460 | 3 | Detects road-based pollutants only, limited classes of objects |
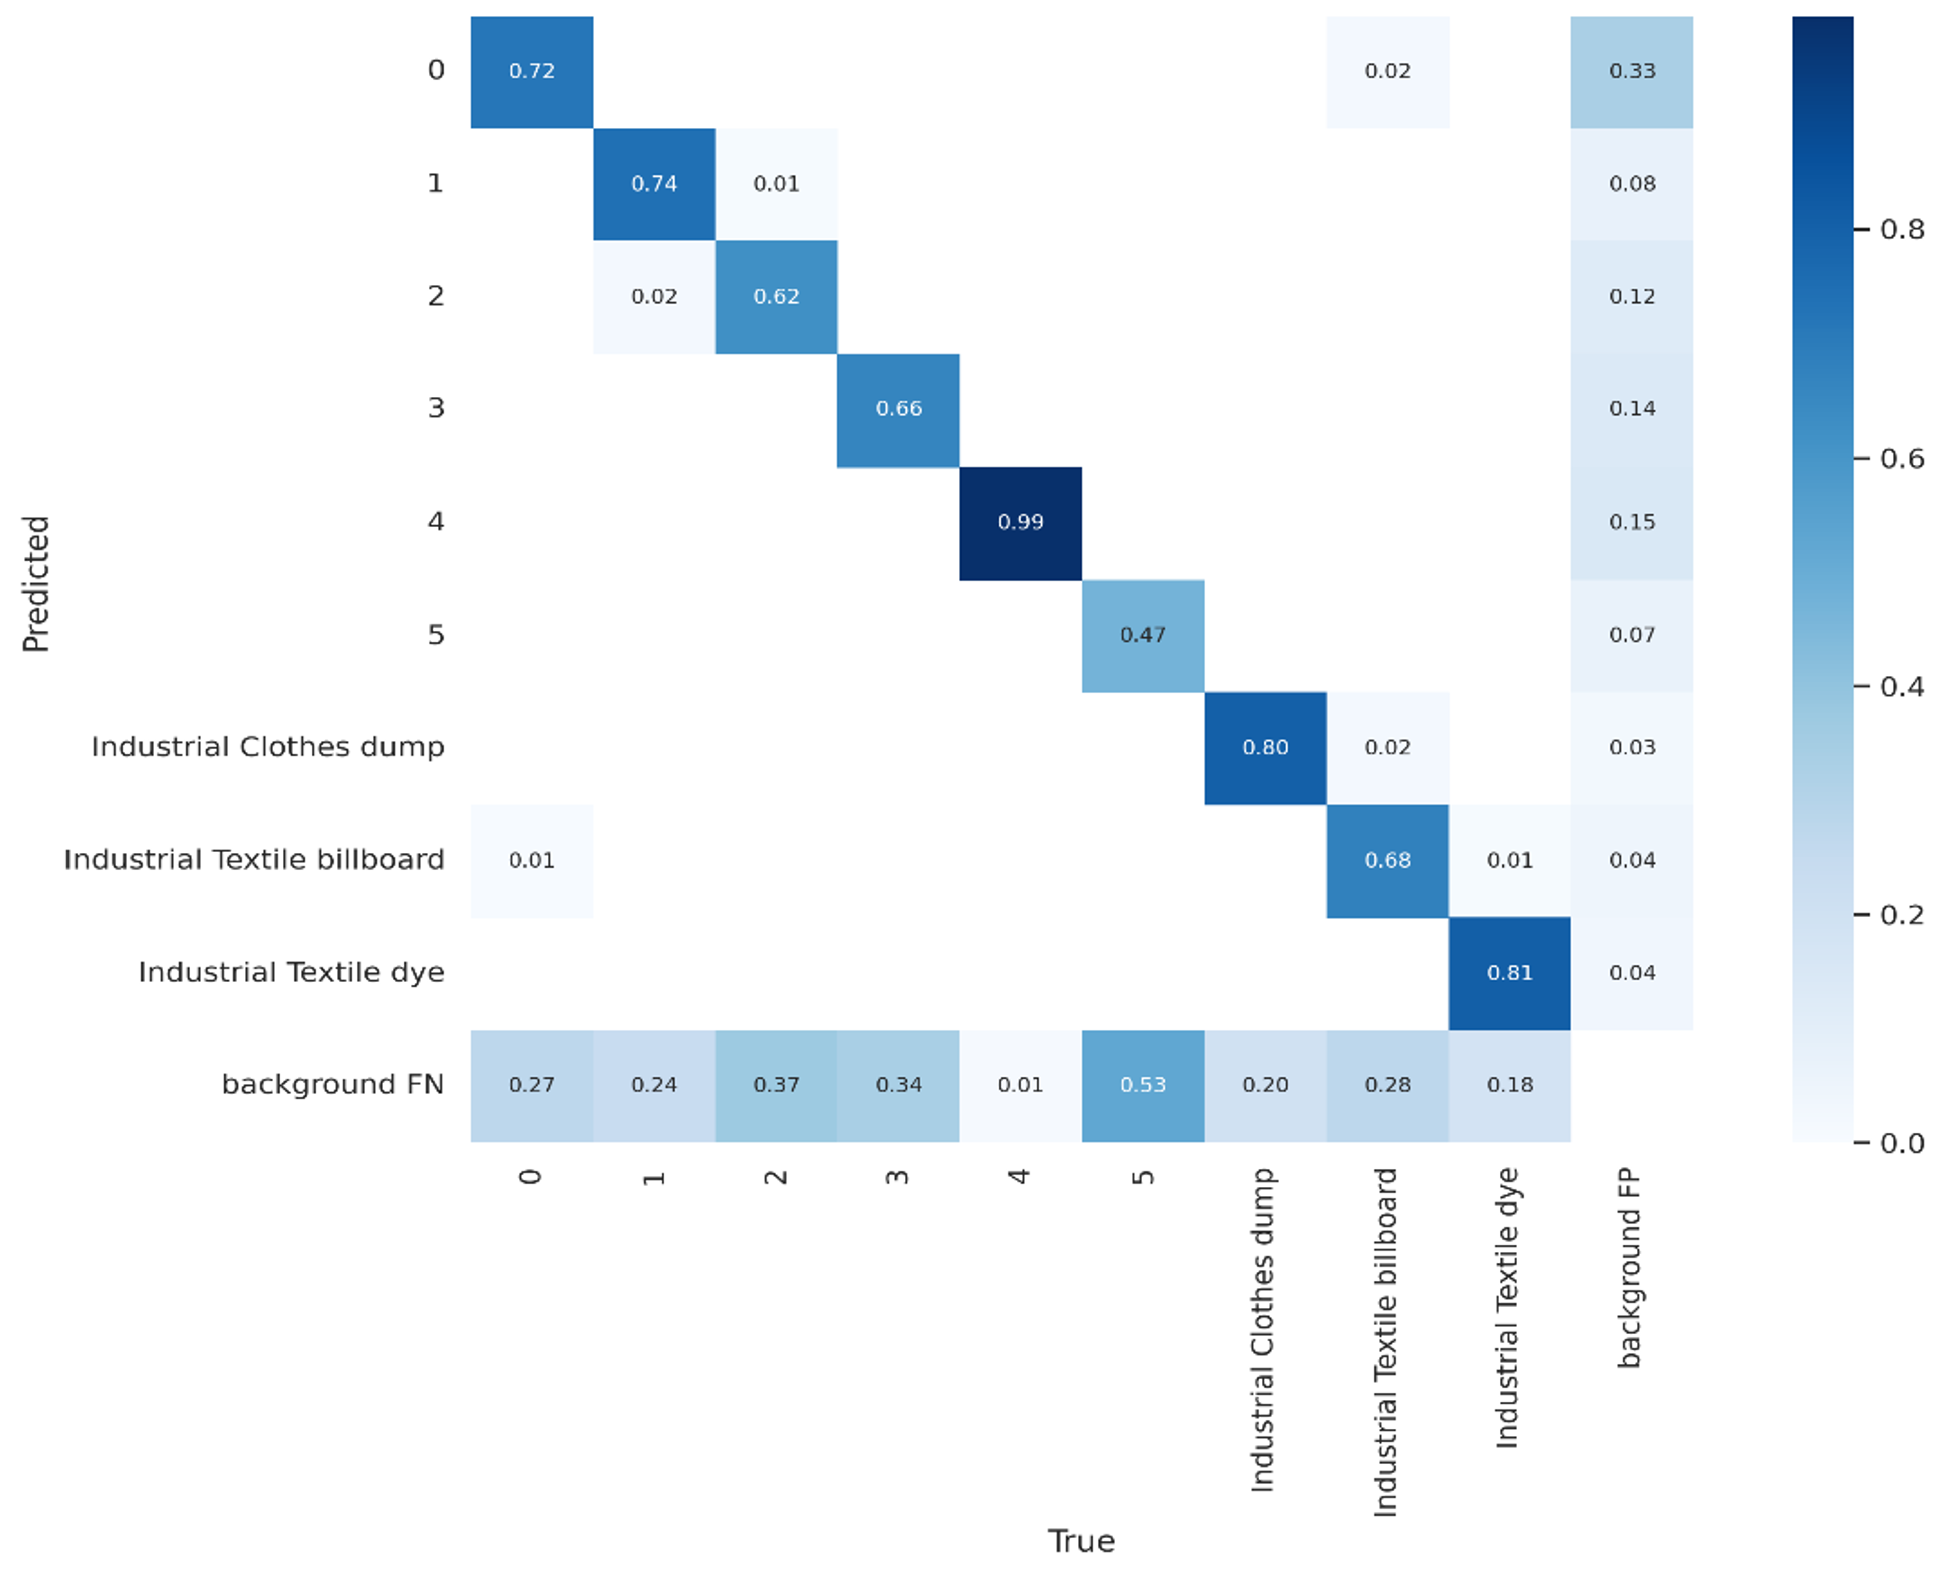
| Class | Google Street View | Collected | Augmented | Total |
|---|---|---|---|---|
| Billboards “0” | 205 | - | 318 | 523 |
| Bricks “1” | 212 | - | 350 | 562 |
| Construction Materials “2” | 342 | - | 350 | 692 |
| Street Litters “3” | 310 | - | 350 | 660 |
| Towers “4” | 214 | - | 350 | 564 |
| Wires “5” | 212 | - | 350 | 562 |
| Industrial Clothes Dump | 200 | 281 | 350 | 831 |
| Industrial Textile Billboard | 100 | 117 | 350 | 567 |
| Industrial Textile Dye | 145 | 200 | 350 | 692 |
| Total | 1940 | 598 | 3018 | 5653 |
| Augmentation Technique | Parameter |
|---|---|
| Flip | Horizontal and Vertical |
| Rotation | Clockwise, Counter-Clockwise, Upside Down by |
| Saturation | [ to ] |
| Brightness | [ to ] |
| Exposure | [ to ] |
| Parameter | Value | Parameter | Value |
|---|---|---|---|
| lr0 | 0.01 | warmup_epochs | 3.0 |
| lrf | 0.01 | warmup_momentum | 0.8 |
| momentum | 0.937 | box | 0.05 |
| weight_decay | 0.0005 | lou_t | 0.2 |
| hsv_s | 0.7 | anchor_t | 4.0 |
| Model | mAP | IoU | Precision | Recall |
|---|---|---|---|---|
| YOLOv7 | 0.667 | 0.50 | 0.636 | 0.657 |
| YOLOv5 | 0.712 | 0.50 | 0.703 | 0.666 |
| SegFormer | 0.597 | 0.698 | 0.782 | 0.546 |
| EfficientDet | 0.689 | 0.50 | 0.734 | 0.798 |
| Model | Detection Accuracy Rate |
|---|---|
| YOLOv7 | 92% |
| YOLOv5 | 98% |
| EfficientDet | 86% |
| SegFormer | 73% |
| Ref | Dataset (# of Images) | Model | Hardware Implementation | Accuracy |
|---|---|---|---|---|
| [15] | Public (1200) | CNN | No | 85.09% |
| [17] | Public (1400) | YOLOv5 | No | 83.17% |
| [18] | Public | Neural Network | No | 96.10% |
| [28] | Public | Customized CNN | No | 87.70% |
| [29] | Public | ResNetV2 | No | 91.40% |
| This work | Public and custom (3000) | YOLOv5 | Yes with Raspberry Pi 4 | 98.40% |
Disclaimer/Publisher’s Note: The statements, opinions and data contained in all publications are solely those of the individual author(s) and contributor(s) and not of MDPI and/or the editor(s). MDPI and/or the editor(s) disclaim responsibility for any injury to people or property resulting from any ideas, methods, instructions or products referred to in the content. |
© 2024 by the authors. Licensee MDPI, Basel, Switzerland. This article is an open access article distributed under the terms and conditions of the Creative Commons Attribution (CC BY) license (https://creativecommons.org/licenses/by/4.0/).
Share and Cite
Titu, M.F.S.; Chowdhury, A.A.; Haque, S.M.R.; Khan, R. Deep-Learning-Based Real-Time Visual Pollution Detection in Urban and Textile Environments. Sci 2024, 6, 5. https://doi.org/10.3390/sci6010005
Titu MFS, Chowdhury AA, Haque SMR, Khan R. Deep-Learning-Based Real-Time Visual Pollution Detection in Urban and Textile Environments. Sci. 2024; 6(1):5. https://doi.org/10.3390/sci6010005
Chicago/Turabian StyleTitu, Md Fahim Shahoriar, Abdul Aziz Chowdhury, S. M. Rezwanul Haque, and Riasat Khan. 2024. "Deep-Learning-Based Real-Time Visual Pollution Detection in Urban and Textile Environments" Sci 6, no. 1: 5. https://doi.org/10.3390/sci6010005