1. Introduction
In an era marked by remarkable advancements in maritime technology and a notable surge in global travel, the average size of cruise ships has seen a substantial increase of 30% [
1]. This trend, driven by shipping companies seeking economies of scale for profit maximization, has heightened the importance of ensuring passenger safety aboard ships. The evacuation procedures for passenger ships, particularly in the context of the notable increase in vessel size, emerge as a critical aspect of emergency preparedness and response in maritime safety. The safety of large passenger vessels demands immediate and focused attention [
2]. In
Figure 1 the accident list, provided by EMSA, records the total number of accidents according to their severity levels between 2014 and 2021. The statistics suggest that despite the slight decrease over the last two reported years in marine casualties, very serious accidents may still occur [
3]. Ratzan et.al. underline that between 2005 and 2023, 15 cruise vessels have sunk with 16 persons lost while 448 major cruise ship accidents have taken place [
4].
Furthermore, accidents similar to Costa Concordia’s that required around 6 h to be evacuated, Norman Atlantic with a total evacuation time of around one day, and Viking Sky with an evacuation time of approximately 5 h, depart greatly from the SOLAS prescribed maximum 60/80 min (depending on the total number of main fire vertical zones (MFVZs)).
Recognizing this critical issue, the authors examine the use of innovative technological evacuation aids in severe weather conditions and discuss their impact on reducing evacuation time. Additionally, the overlooked by regulations port evacuation scenario is assessed following an alternative evacuation approach. The aforementioned analyses have been also developed within the SafePASS project.
2. Background
2.1. Regulatory Framework
The regulatory landscape governing passenger ship evacuation is shaped by international standards, with organizations such as the International Maritime Organization (IMO) taking a leading role.
In the realm of maritime safety regulations, the IMO has undergone a series of updates to enhance evacuation analyses for passenger vessels. In recent years, several key regulations have been superseded and summarised by [
5,
6]. In a landmark development for maritime safety, MSC.1/Circ.1533, issued on 6 June 2016, marked a significant evolution in the guidelines concerning evacuation analyses for both new and existing passenger ships [
7]. This circular superseded all prior regulations on the matter, consolidating and advancing the framework for assessing evacuation procedures. The directive underscores the importance of optimizing evacuation procedures for passenger ships. Furthermore, insights and recommendations stemming from the 4th session of the IMO Sub-Committee on Ship System and Equipment (SSE 4) have contributed significantly to the ongoing evolution of safety measures within the maritime sector [
2].
The recent circular introduces several key features in the realm of evacuation analysis regulations. Firstly, it extends the mandate beyond ro-ro passenger ships to encompass all passenger vessels constructed on or after 1 January 2020, marking a significant expansion in its applicability. A critical aspect of this regulation is the mandatory determination of evacuation time, underscoring a proactive approach to enhancing passenger safety. While obligatory for newer vessels, the regulation encourages the voluntary performance of evacuation analyses for existing passenger ships. This proactive stance assists in identifying congestion points and critical areas, facilitating the adoption of operational measures to ensure evacuation times remain within permissible limits. In terms of methodology, MSC.1/Circ.1533 ensures flexibility for operators by allowing the evaluation of evacuation time using either the simplified or advanced method, consistent with earlier regulations. The simplified method adopts a “fluid-dynamic similarity” approach, conceptualizing corridors and stairs as tubes through which passengers flow. The circular provides specific procedural guidelines for the application of this method. On the other hand, the advanced method involves representing passengers individually with distinct characteristics. Evacuation time calculation is facilitated by virtual reality-based software, offering a more nuanced understanding of evacuation dynamics. However, it’s important to note that this analysis is conducted under simplified day and night scenarios, without explicitly considering the influence of flooding (and fire) hazards [
7,
8]. For thorough evacuation analysis, it’s advised to compute the complete evacuation time of each passenger using the method outlined in
Figure 2. It’s recommended to repeat this process at least 50 times to accommodate the random factors inherent in the analysis.
2.2. Evacuation Procedure
The evacuation procedure on passenger ships involves a muster list that outlines various protocols for coordination. In an actual onboard emergency, the ship’s master has the authority to decide whether to follow the evacuation plan specified in the muster list or make modifications based on specific emergency circumstances. Factors influencing this decision may include the presence of smoke, the ship’s listing, the need to disembark if the ship is berthed, and other pertinent considerations. Specifically, during the evacuation process on large cruise vessels, passengers are instructed to go to their cabins to retrieve and don their life jackets before proceeding to designated confined areas known as muster stations. Similarly, for large ferries, the procedure is akin, with the distinction that those without reserved cabins are directed to seat lounges to collect their life jackets before moving to the muster station (see
Figure 3).
2.3. Evacuability
The ship–sea evacuation problem is a multifaceted challenge. Distinct from evacuations in airplanes and buildings, ship evacuations face complexities due to the ship’s unique geometries, the need for preparation for survival in harsh maritime environments, and the uncertainties arising from the unpredictability of human behaviour. The RoPax Norman Atlantic evacuation serves as a tangible example of the difficulties encountered. More precisely, evacuation process was one the most challenging ones that had to be dealt with over the last years due to the stormy weather. As a result, it was not clear whether abandoning the flame engulfed vessel was supposed to be a safer choice rather than embarking on the lifeboats of the vessel during such dangerous conditions. The procedure for all passengers and crew members to follow either on board or at sea during an evacuation is summarised in
Figure 4.
The concept of “evacuability” encapsulates passenger evacuation performance, considering factors like evacuation time, vessel general arrangements, life-saving appliances, passenger familiarization, crew training, effective procedures, intelligent decision support systems, and design modifications for ease of evacuation. All these aspects are regulated by various rules and regulations.
However, evacuability problems persist, including mass evacuations from complex environments, unknown inaccessibility issues, progressive flooding, fire/smoke, and the inherent uncertainties tied to human behaviour, all constrained by limitations in time. Addressing these challenges requires a comprehensive approach to enhance the effectiveness and safety of ship–sea evacuations [
11]. The definition of the time required for a systematic evacuation and abandonment, as approved by the IMO MSC, is clarified as follows: “The duration, starting from the moment the casualty threshold is surpassed until all individuals have successfully abandoned the ship, during which the ship remains viable for this purpose [
9].
2.4. Time-Domain Simulation Tools
Following the introduction of the advanced method for evacuation, there have been several projects focusing on developing evacuation models for passenger ships and striving for a full-scale simulation of a damaged ship [
12]. For instance, the Maritime-EXODUS project at the University of Greenwich, led by Gwynne in 2003, aimed to create a comprehensive simulation for evacuating a damaged ship under the propagation of fire. The EXODUS platform incorporates five major components, including a velocity-based pedestrian model, population distribution, human behaviour model, fire and smoke spread model, and environmental hazard subprogram [
13].
Following the IMEX project, ref. [
14] focused on developing a model capable of simulating various evacuation procedures from public transportation systems, including buildings, ships, and aircraft. Utilizing a discrete-cells spatial representation, this model can simulate the movements and behaviour of each individual in a crowd. Another notable solution is the BY-PASS model, introduced by Meyer-König in 2002, which offers an intelligent approach to ship evacuation. This model is characterized by the general features of evacuation models, a dynamic model, and an intelligent human behaviour model [
15].
Similar to IMEX, ANEAS was developed by Meyer-König in 2007 to address challenges arising from the inclusion of ship motions in evacuation modelling, implementing velocity reduction coefficients specific to various deck inclinations [
16].
VELOS introduced virtual reality to evacuation simulation to establish a platform facilitating design feedback in the initial phases by immersing multiple users in dynamic operational scenarios [
17].
Over the past decades, scientists have explored diverse approaches to designing frameworks for human evacuation. The EVAC simulation program, presented by Drager [
18], employed a microscopic method to simulate the evacuation process through interactions between passengers with individual characteristics. However, this model did not incorporate dynamic effects and ship motion characteristics.
Concurrently, the passenger evacuation simulation system Evi, as introduced by Jasionowski et al. [
19] utilizes a real-time, multi-agent, and mesoscopic approach. A distinctive feature of Evi is the application of a virtual environment to enhance the efficiency of evacuation performance, making it the most appropriate model for passenger evacuation simulation on a multi-level planning structure. A typical representation of the Evi environment is depicted in
Figure 5.
Another issue is that considering the velocity of a human as the sole determining factor in their movement, is not entirely accurate. Human movements are influenced by both natural (physical) and social forces [
12].
Importantly, the influence of flooding and fire-related hazards can be integrated into EVI both temporally and spatially. The software possesses the capability to assimilate time histories of ship motions and flooding in ship compartmentation from time-domain flooding simulation tools like PROTEUS-3.1 [
20].
Figure 5.
EVI software environment [
21].
Figure 5.
EVI software environment [
21].
These approaches solely consider the kinematics of ship movements, introducing reduction coefficients for the velocity of passengers. The velocity values of each person in the crowd are calculated for various static values of angles of roll or pitch. The effects of ship motions and floodwater on individuals are simulated by applying walking speed reduction coefficients as correction factors based on the MEPDesign project results [
18]. These coefficients are determined by functions representing the inclination of escape routes due to the ship’s heel and/or trim resulting from damage [
7,
22]. The software also models the impact on the environment by treating regions directly affected by floodwater as inaccessible [
23]. As a result, flooding data are used to influence the awareness and walking speed of agents [
24].
3. Areas of Improvement
Traditional evacuation methods which rely on manual procedures, static life-saving appliances, and human coordination, while generally effective, encounter challenges when faced with severe weather conditions such as storms or hurricanes. These challenges include the difficulty of deploying life-saving equipment in turbulent seas, reduced visibility, and the potential for panic among passengers and crew [
25]. Communication becomes hindered by increased noise and disturbance, potentially causing confusion. The stability and seaworthiness of the vessel are compromised due to flooding or firefighting efforts, leading to significant rolling, pitching, heaving, and listing, slowing down the evacuation process and increasing the risk of injuries, such as on slippery surfaces. Severe weather conditions may also delay the arrival of external rescue resources, impacting the overall effectiveness of evacuation efforts. In such cases meeting regulatory time limits becomes challenging, and the psychological impact on passengers, including heightened anxiety and panic, further complicates the orderly execution of evacuation procedures. Addressing these limitations necessitates exploring alternative evacuation methods, improving technology, and enhancing training to ensure the safety and efficiency of evacuation in adverse weather scenarios [
26].
Therefore, there is a need for alternative evacuation procedures that can effectively address the challenges posed by severe weather conditions and improve the safety and efficiency of evacuations on board passenger vessels.
Similarly, the advent of devices and technological advancements can have a crucial effect on how evacuation procedures are implemented. With real-time monitoring systems and advanced communication tools, technology provides solutions that improve the effectiveness and flexibility of evacuation procedures, and enhance command and control and coordination.
3.1. SafePASS
Given the challenges identified in traditional evacuation procedures amid severe weather conditions, it is clear that innovative approaches are indispensable for enhancing the safety and efficiency of evacuations on large passenger vessels. Recognizing this imperative, the European Union has proactively responded by supporting initiatives like the SafePASS project. The project is dedicated to achieving safer, smarter, and swifter evacuations through the integration of advanced technologies and methodologies. By specifically addressing the challenges posed by severe weather conditions, such as storms or hurricanes, SafePASS aligns with the crucial need for alternative evacuation procedures. The strategic funding underscores a commitment to enhancing the overall resilience and effectiveness of evacuation processes, ultimately prioritizing the well-being of passengers and crew in challenging maritime scenarios.
3.1.1. Technological Solutions
Having an insight on the SafePASS project achievements, some innovative solutions were developed which leverage smart devices and augmented reality (AR) to revolutionize marine emergency response and large passenger vessel evacuation [
27]. Through real-time risk metrics and a common operational picture (COP), these solutions enhance crew training, provide personalized evacuation instructions, and improve decision-makers’ situational awareness. The comprehensive approach covers all evacuation stages, from alarm to rescue, promising tangible improvements in safety and efficiency, irrespective of hazards, weather conditions, or passenger demographics. The components developed are in brief the following: core engine, common operation picture, next-gen life-saving appliances (LSAs) [
28], ship layout alterations, indoor localization sensors [
29], and the integration of smart components (see
Figure 6) such as the dynamic exit signs (see
Figure 7), the smart wristband [
30], passenger chatbot, passenger mobile application (see
Figure 8) and smart lifejacket [
31]. Some other important solutions are the crowd dynamic simulator and the risk modelling tool created [
32]. Full details on their functionalities and on how evacuation can be benefited from each of them can be found in [
33]. On the same approach, by integrating some of the cutting-edge technological solutions underlined herein, the optimization of evacuation procedures can be greatly enhanced, ensuring swifter, smarter, and more secure evacuations in various scenarios.
3.1.2. Alternative Evacuation Procedures
One of the most challenging and ambiguous evacuation procedure is when the vessel is moored in port. To be more precise, it is believed, among the consortium members of the SafePASS project, including world leading classification societies and cruise vessel operators, that the evacuation procedures followed per vessel/shipping company according to the International Security Management (ISM) code are not obvious. In practice, there are concerns that the conventional procedures are not appropriate and evacuation time can be significantly reduced if the conventional procedures are overridden. The same approach has been examined in the MONALISA EU funded project [
10].
The modified procedure on board passenger vessels is depicted in
Figure 9.
4. Methodology
To assess the impact of the proposed evacuation aids but also of some alternative evacuation procedures, numerical simulations have been used. More precisely, evacuation simulations are conducted using an industry-approved software known as EVI considering some flooding data from Proteus software, which were provided by the Flare project [
34]. The simulation parameters were established by referencing relevant literature and, when applicable, adhering to corresponding regulations. In this section, a detailed description of the simulation parameters, including flooding data, is provided along with the attained time for evacuation per the different scenarios. Lastly, the authors investigate the effectiveness of the proposed solutions and alternative evacuation procedures.
More precisely, the following
Figure 10 provides an overview of the methodology followed by the authors. During Step 1, the authors come up with the observation that evacuation on board large passenger vessels is in need of immediate attention. This is a result of recent accidents from the past years according to the assessed literature review.
In Step 2, some risk control options have been selected either using some alternative evacuation procedures or by using technological advancements. All evacuation aids in Step 2 reflect the study made in the Literature review process regarding the areas of improvement concerning evacuation on board.
In Step 3 the modelling of the evacuation scenarios using numerical simulations in EVI software takes place. To assess the effectiveness of the alternative solutions a comparative analysis has been made between cases with no extra solutions and with cases after the implementation of the RCOs.
In the final step, a discussion of the results highlights the importance of the implemented solutions.
4.1. EVI Software
Evacuation simulations utilized the IMO-compliant EVI software 4.3.3, aligning with the latest IMO regulations on passenger ship evacuation outlined in the ‘Revised Guidelines on evacuation analysis for new and existing passenger ships’ [
7].
All baseline scenarios and related subcases were executed following the specified IMO day and night, passenger, and crew demographics. In instances where evacuation simulation scenarios extended beyond the current regulatory framework, details on assumptions regarding changes in agents’ reaction time and evacuation procedures will be provided in this section. The existing iteration of the EVI software originated in 2001 [
21] with the initial presentation of the simulation tool’s concept occurring in the same year [
35]. Subsequent advancements in the code have primarily been motivated by commercial applications. The fundamental design principles and assumptions are delineated below. Distinguished as the sole evacuation simulation crafted explicitly for the marine environment, EVI stands out as one of the limited tools utilizing continuous space modelling, allowing for the representation of any ship accommodation layout. The simulation is presented in a 3D virtual reality environment, enabling a comprehensive understanding of the evacuation’s progress. Identification of congestion or bottleneck locations becomes straightforward. It has the capability to manage diverse passenger, crew, and sea scenarios.
Evacuability is captured as follows:
Thus, evacuability is determined by a plethora of initial conditions, encompassing the ship environment (
env) including the geometry, topology scenario and semantics, passenger distribution within the ship (
d) (spatial location of people), initial and in situ responses of passengers (
r(
t)), and evacuation dynamics (s(ni)). Evacuation dynamics involve aspects such as the evacuation plan, crew functionality, and passenger mobility characteristics (mii) related to gender (
g), age (
y), and various handicaps affecting mobility (hci). This relationship is illustrated in the following
Figure 11.
4.2. Attributes and Assumptions
The simulation tests focused on several attributes in accordance with the MSC1533 regulation of the International Maritime Organization (IMO) [
7]. These attributes included capacity, population composition, distribution of passengers/crew, walking speed, and awareness time. The capacity of the ship was consistently set at the maximum (100%) in all scenarios, representing a critical situation with many passengers. The values for other attributes adhered to default specifications outlined in the MSC1533 regulation. Population composition was detailed by gender and age group for passengers and crew, while walking speed is defined separately for flat terrain and stairs, considering minimum and maximum speeds for each gender and age group among passengers and crew. The following two tables (
Table 1 and
Table 2) depict the population groups set in the software according to their age and gender for both passengers and crew members.
After having specified the agents’ population, the next crucial aspect to set is the agents’ distribution alongside the entire length of the vessel. In other words, the location of each agent, including any passengers or crew members, should be defined to the software. However, this differs from time to time especially when dealing with large passenger vessels accompanied by a plethora of amenities for the passengers. As a result, two different lists for agents’ distribution have been created, one for day and another for night cases as per the following tables (
Table 3 and
Table 4).
The maximum number of agents that this particular vessel has the capacity to carry is 2790 passengers and 910 crew members. More details regarding the ship’s characteristics, geometry and other relevant information follow within this chapter.
With regard to the walking speed of passengers and crew in flat terrain and on stairs (down/up), the minimum and maximum values per population group are presented in
Table 5 and
Table 6.
The awareness time (
y) for day (1) and night (2) cases is calculated based on the response time (
x) using the following formulas:
To account for the impact of the novel solutions’ implementation on board and its influence on human behaviour and evacuation procedures, certain assumptions have been considered. The primary factor identified as having a significant effect on existing attributes is the passenger mobile application. More precisely, it is assumed that passengers with the application installed on their mobile phones could receive direct information about the commencement of the evacuation process through a dedicated alert, even in cases where the general alarm might not be immediately understood.
Consequently, the response time limits for passengers with the mobile application are adjusted to [0, 60] for daytime scenarios and [120, 180] for night-time scenarios according to some tests/drills developed during the duration of the SafePASS project. The proposed new limits for the awareness times were also in consensus with the consortium members of the project being experts within the maritime industry.
However, these improved numbers cannot be applied to all passengers given the obvious gap/difficulties that some elderly passengers may deal with while using smartphones. Except for those, there might also exist some other passengers, independently of their age, who are not keen on appropriately and efficiently using their mobile phones. For this reason, a comprehensive literature review regarding mobile phone usage and applications for navigation purposes across different age groups was undertaken. It is assumed that the percentages for mobile usage would be 80% for the age group 10–30 [
37], 90% for the age group 30–50, and 60% for the age group 50+ [
38]. The following
Figure 12 depicts the proper mobile usage percentages across the different age groups.
By combining these assumptions about mobile usage with the corresponding reduction in response time, new demographics have been calculated. It is important to note that only the passenger response time is influenced by the introduction of innovative solutions, particularly the passenger mobile application, while the crew response time remains unchanged. The subsequent tables present the passenger demographics of the International Maritime Organization (IMO) and those after the solutions’ implementation, utilized for both day (see
Table 7 and
Table 8 for IMO and novel solutions accordingly) and night scenarios (see
Table 9 and
Table 10 for IMO and novel solutions respectively).
Except for the improved situational awareness characteristics, after using the mobile application, another significant differentiation introduced by is the crowd simulator which accounts for congested or blocked routes and provides alternative routes to passengers and crew towards the muster stations, avoiding unnecessary or contraflow movements (see
Figure 13). This is facilitated by dynamic exit signs. Based on the above, it is assumed that in case of an evacuation, passengers would directly use the available route calculated by the crowd simulator and provided to them through the afore-mentioned resolutions (passenger mobile app, dynamic exit signs, smart lifejacket, etc.).
On the other hand, in the case of an evacuation without those solutions, the passengers would not be aware of the blocked routes, so they would have to move initially towards the blocked area. Subsequently it is expected that the crew would redirect them to a muster station via an alternative route.
With regard to the localization of the disoriented passengers; in a typical evacuation process, after the completion of mustering and the counting of the assigned passengers, the missing ones are identified and then the crew is sent to check the area. However, in the “novel” case, it is assumed that the passengers who have not reached the muster station themselves, can request assistance through the mobile app or automatically send an alert in case of increased stress levels. The crew is then immediately aware of their dynamic location and can move directly to help, without wasting time searching for them.
4.3. The Vessel’s Main Characteristics
For the simulations, the geometry of a large cruise ship is used to come up with useful observations (see
Figure 14 and
Figure 15). This geometry is retrieved on behalf of the SafePASS project from its sister project Flare. The main dimensions can be found in
Table 11.
4.4. Wave Specifications
A key objective of this study is to consider harsh weather conditions and their impact on the evacuation process. As a result, in the upcoming scenarios’ presentation, the presence of extreme weather conditions is dominant.
Table 12 summarizes the seaway’s main characteristics with the significant wave height being at 7 m and the wave encounter heading to be at 90 degrees or abeam of the vessel. Obviously, the weather conditions are quite extreme with significant healing angles expected that can affect the walking speed, complicating the evacuation time. The following flooding characteristics are imported into the evacuation software from the flooding software PROTEUS.
As already discussed, many evacuation software programs fail to account for the listing of the vessel when calculating the speed of the agents involved. In general, there are three different speed reduction functions for the agents provided by the EVI software (See
Figure 16) which assume different speed changes for the agents depending on the heeling angle. Speed Reduction Function 2 was preferred as the most appropriate function based on the wave characteristics, but also according to relevant studies based on the literature review (See
Figure 16). The findings from certain studies employing motion platforms suggest that a ship’s inclination within the range of 15–20 degrees minimally affects pedestrian walking speeds. Conversely, it can be inferred that walking comes to a halt when the heel angles reach 30–35 degrees [
16,
19] Therefore no reduction takes place up to an angle of 20 degrees, followed by a consistent reduction in relation to the angle until reaching 35 degrees, at which point it is assumed that walking becomes impractical.
It is important to note that the EVI tool supports the simulation of the evacuation process until the completion of mustering, excluding the embarkation phase, which is assumed to last 30 min per IMO regulations (SOLAS regulation III/21.1.3).
4.5. Software and Geometry Compliance with SOLAS Regulations Tested to the Geometry Used
Testing the components of the software entails verifying that each element functions as intended. This process includes subjecting the software to a series of basic test scenarios to confirm that the key sub-components of the model operate as expected. The provided list is not exhaustive but offers suggested component tests that are integral to the verification process. The following
Table 13 summarizes the results of the tests with all of them being successfully conducted.
Except for the software, the geometry was also tested before conducting any scenarios in terms of the prescribed arrangement. For instance, the proper spacing of corridors, staircases, primary exits provided and many other regulatory SOLAS-related aspects which are of major importance were evaluated in EVI 4.3.3. A typical representation of the model is depicted in
Figure 17.
5. Case Studies
5.1. Simulator Setup and Scenario Modelling
Due to the stochastic nature of the simulations in EVI each scenario will be run 50 times to provide statistically significant results. A summary of the results for each scenario is provided in the Results, with the outputs being presented in terms of the maximum, minimum, average and 95th percentile of each scenario set of 50 runs. Due to the stochastic nature of the simulations, comparing times ‘row-wise’ alone cannot lead to any derivations. Due to outliers in the data, minimum and maximum values are also best not used. Instead, a more appropriate metric for case comparison is the 95th percentile value.
Incident locations are adjusted to different decks or spaces to better represent the scenario based on the ship’s geometry. To assess the performance of the “novel” system, normally two cases are executed for each scenario under identical conditions in terms of incidents, weather conditions, and time of day. The first case serves as a benchmark without any solutions, following the typical evacuation process as per IMO regulations. The second case implements novel solutions, affecting various aspects of human behaviour and the evacuation procedure. This approach allows for a comparison of the smart environment’s performance with conventional evacuation processes, quantifying the total evacuation time with and without any aids under the same parameters.
Moving into the selected scenarios, these are categorised into groups, the first one (Scenarios 1–4) assessing the impact of the evacuation aids’ (passenger mobile application, dynamic exit signs, smart lifejacket, crowd dynamic simulator, etc.) implementation and the second one (Scenario 5) evaluating the effectiveness of the novel evacuation procedures introduced when the vessel is in port.
5.1.1. Scenario 1
Scenario 1 represents a straightforward mustering situation, with no fire or flooding incidents and the ship remains intact. This scenario serves as the benchmark, allowing for the assessment of the impact of improved awareness time facilitated by the “novel” system. Two cases are established to validate evacuation performance with and without the proposed solutions, respectively. In the case without any advancements, the same demographics of the agents and, more specifically, their awareness time, adhere to the IMO guidelines. Conversely, the case with the alternative options incorporates awareness time characteristics that are influenced and enhanced by the implementation of the solutions. Both cases are conducted under night conditions and severe weather, featuring a significant wave height of 7 m (Hs = 7 m).
5.1.2. Scenario 2
Scenario 2 involves a night-time fire incident with ship motions corresponding to a significant wave height of 7 m (Hs = 7). The fire originates in a coffee shop on Deck 7 of the fourth MVFZ. To restrict agents’ movement and prevent further fire propagation, all doors connecting MVFZ 3 to 4 and MVFZ 4 to 5 from Deck 7 to Deck 9 are deliberately blocked. Although the open deck spaces of MVFZ 4 are considered unaffected, direct access from Deck 7 to Deck 9 through connecting doors is restricted to avoid supplying excessive oxygen to the fire. This scenario includes the disorientation of 20 agents during the evacuation process, randomly placing them in predefined public spaces.
Two cases are executed for Scenario 2; a benchmarking case without any solutions and one with solutions implemented onboard. In the benchmarking case, a standard mustering procedure is followed, where the 20 missing agents are not considered to be within the muster stations. Crew members are dispatched to search the area near the lost agents without knowledge of their specific locations. Once located, they collectively move to the muster station. Awareness time aligns with IMO guidelines, and congested routes, due to blocked doors in the event of fire, are present as agents are unaware of any alternative routes.
In the second case with all solutions onboard, the location of the missing agents is known through the added components (smart lifejacket, passenger mobile application). As the mustering process nears completion, crew members are assigned to directly reach the location of the lost agents, and from there, they move collectively to the muster station. Awareness time is based on the one used for the “novel” solutions, and agents are guided to muster stations through the available routes, avoiding any blocked doors/paths. Notably, crew members from Muster Station A are directed to assist passengers in both cases.
Figure 18 gives an overview of the process followed during the simulation with the crew members, wearing white shirts, inspecting the areas for any disoriented passengers.
5.1.3. Scenario 3
Scenario 3 depicts a flooding incident during the day in the lower parts of the vessel, specifically in Deck 3, with ship motions corresponding to a significant wave height of Hs = 7 m. The flooding is identified in Deck 3, within two watertight compartments between Frame 195 and Frame 235. Due to the flooding, certain routes are assumed to be obstructed.
Figure 19 provides an overview of the flooding location in relation to the ship’s layout. In this simulation, the procedure followed is that the surrounding watertight doors of the damaged compartments are blocked, preventing agents in neighbouring compartments from accessing the flooded area, although important for halting further propagation of water along the vessel. Additionally, agents in the flooded compartment will use the staircase within that compartment to safely exit.
Similar to previous scenarios, Scenario 3 is divided into two cases. In the first case, passengers are not informed beforehand about the blocked routes and watertight doors. Consequently, congested areas appear leading to an increased mustering time. In this initial scenario, passengers’ awareness time aligns with IMO demographics. In the second case, passengers and crew are guided through the available routes, avoiding blocked routes and watertight doors, resulting in a more efficient evacuation process. Furthermore, the awareness time for the second case takes into account the time savings attributed after the solutions’ integration.
5.1.4. Scenario 4
Scenario 4 presents a complex situation involving both fire and flooding incidents at night, with ship motions corresponding to a significant wave height of 7 m (Hs = 7). This scenario accounts for the loss of 20 agents during the evacuation process, randomly placed in predefined public spaces. Initially, flooding is detected in two compartments on Deck 3, precisely between Frames 195 and 235. Similar to scenario 3, the procedure involves blocking the surrounding watertight doors to prevent agents in neighbouring compartments from accessing the flooded areas, following the escape plan. Agents in the flooded compartment use the internal staircase for safe evacuation. After mustering is completed, a fire ignites in the crew galley of MFVZ 5 on Deck 4 due to damage to electrical equipment. In this case, doors connecting MVFZ 4 to 5 and MVFZ 5 to 6 from Deck 4 to Deck 6 are blocked, directing agents to move vertically and avoid the spread of the fire. Access to the open deck spaces of MVFZ 5 is restricted to prevent excessive oxygen supply to the fire. Agents from Muster Station G, located within the same MFVZ as the crew galley, are redirected to the nearest muster stations (see
Figure 20). As in previous scenarios, Scenario 4 is divided into two cases: the benchmarking case and the “novel” case. In the benchmarking case, passengers’ awareness time follows IMO guidelines, and congestion is expected in blocked areas during flooding and fire events. Tracking lost agents is time-consuming as the crew members must search the entire vessel. In the “novel” case, passengers’ awareness time is improved due to the implementation of smart technologies. Agents are guided through the available routes, avoiding congested areas or blocked routes during flooding or fire events. Tracking lost agents is simplified compared to the benchmarking case, as the crew is aware of their exact locations. Additionally, crew members from Muster Station A are directed to assist passengers in both cases.
5.1.5. Scenario 5
Scenario 5 investigates the evacuation process while the vessel is in port, focusing on a night-time fire incident. The fire originates in the AC room within the second MVFZ of Deck 5. In practice, all doors connecting MVFZ 1 to 2 and MVFZ 2 to 3 from Deck 5 to Deck 7 are blocked to compel agents to move vertically along the affected area and prevent further spreading of the fire. Access to the open deck spaces of MVFZ 5 is restricted to avoid excessive oxygen provision to the fire. Additionally, it is assumed that an agent with mobility restrictions becomes disoriented before completing the evacuation, while demographic details and location have been configured accordingly. Similarly with the other scenarios, two cases are considered. The first is the benchmarking case without any additions, where agents’ awareness time aligns with IMO guidelines. The evacuation involves mustering all agents at muster stations and then guiding them to port facilities through gangways. Crew members must search for the lost agent alongside the vessel without knowledge of the exact location. Most importantly, in the benchmarking case, all agents are expected to congest near blocked routes/areas due to the fire incident.
In the second case, agents’ awareness time during simulations is based on the one with the novel solutions, and crew members can identify the location of the lost agent through the provided tools, significantly reducing search time. This case is further divided into two subcases, examining two evacuation protocols. The first subcase mirrors the benchmarking case with passengers mustering and then moving to the port facilities via indicated gangways (see
Figure 21).
In the second subcase of the “novel” case, passengers can move directly to the port terminal using the vessel’s gangways on Decks 5 and 6. In contrast to the benchmarking case, agents in the “novel” case are guided through the available routes, avoiding blocked areas and associated congestion, significantly minimizing evacuation time due to the smart technologies’ implementation.
6. Results
The conducted simulations allowed for a comparison between scenarios with and without smart technologies, but also regarding the alternative procedure tested for the port evacuation. The total times are presented below within
Table 14,
Table 15,
Table 16,
Table 17 and
Table 18. These durations specifically pertain to the mustering phase, except for the fifth scenario, which involves total evacuation time. For each case, the measurements included the minimum, mean, and maximum values of duration, along with the duration for the 95th percentile, forming the basis for the comparison. Apart from the tables,
Figure 22,
Figure 23,
Figure 24,
Figure 25,
Figure 26,
Figure 27,
Figure 28,
Figure 29 and
Figure 30 depict the evacuability index versus time. The ‘0.95’ on the vertical axis corresponds to the 95th percentile while 1 denotes the maximum values. Similarly, the remaining values can be interpreted. Next, the horizontal axis showcases the time needed either for the maximum, minimum, mean, or 95th percentile values to be completed.
As previously stated, the following figures represent the cumulative distribution of muster times across the different scenario sets.
Except for the previous tables and figures which involved the mustering/evacuation time needed, further details are provided below for each scenario. The details per scenario differ, given the nature of the scenarios. This is reflected in the variation of the results.
Starting with the first scenario, two heatmaps identifying the congested areas are provided to realise the impact of the implementation of the smart environment. In practice, the orange/yellow areas in
Figure 31 represent some medium to heavy congestion areas that have turned into yellow/green areas in
Figure 32, confirming the efficacy of the suggested solutions.
Moving into the second scenario (see
Figure 33), cumulative travel distances per case have been provided to demonstrate the improved pathways created during an emergency through the anticipated advancements. More precisely, the ability to inform a priori agents for any blocked routes or to identify in advance the location of any missing agents is crucial to reduce travel distance and as a result time spent for the mustering completion.
As far as the third scenario is concerned, the reduction is not expected to be very high considering the location of the impaired areas and the affected types of agents. Specifically, the flooded compartments are on the 3
rd deck of the vessel (see white area in
Figure 34) where only crew members have the authority to access. Apart from that, the total number of crew members located in such low-level decks is comparatively small compared to passenger decks. As a result, the reduction will be small since the only affected agents will be crew members who already have enough experience and are familiarised with the vessel’s arrangement.
Since the two cases of the fourth scenario have been divided into two subcases/phases, one for the mustering of the initial case and a second for the re-mustering of the impaired muster station G, two different graphs for the cumulative congestion times are provided. In both subcases, the congestion time is greater within the cases with IMO awareness time. (
Figure 35 and
Figure 36).
Finally, as far as the fifth scenario is concerned,
Figure 37 captures the moment where the passengers have been gathered to the muster stations and are expected to move into the port facilities through the gangways of the vessel. The time variations presented herein and retrieved from the EVI graphs are sufficient to realise the benefits during port evacuation which can be considered by looking into the different tested scenarios/solutions.
In
Table 19, the effectiveness of the implemented alternative options is obvious. Although, at this point, Scenario 5 needs to be further elaborated. Given the fact that the second case from Scenario 5 has been split into two different subcases, those have both been assessed. As for the first subcase, following the conventional evacuation procedure when the vessel is moored in port but having implied new attributes with regard to the agents’ response time, the reduction percentage is at around 13% comparing with the first scenario. As for the second subcase, there is a reduction of around 50% in comparison with the first subcase. This tremendous amelioration in evacuation time has been observed after the new proposed procedures, ignoring the muster stations, and letting the agents move directly to the port terminal. The latter alternative approach can be further interpreted as a huge innovation in passengers’ safety, especially when comparing this subcase with the first scenario. Then, the difference peaks at a percentage of around 70.
7. Discussion
When comparing the evacuation outcomes with and without any extra solutions, it is evident that the total mustering time is consistently reduced in scenarios where the innovative systems are implemented on board. The extent of the reduction varies across the scenarios, with some experiencing significant decreases, while others show minor improvements. Specifically, Scenarios 1 and 2 exhibit reductions of up to 17%, while in Scenario 3, the reduction is around 1%. This variation can be rationalized by considering the impact of incident details, such as incident type, location, and time of day on the number of affected individuals and, consequently, the total mustering time. Specifically, in Scenario 3, where the incident occurs on a low deck with only crew cabins, few passengers are affected by blocked routes. Conversely, in Scenario 2, where the incident takes place in a public space on Deck 7, more passengers contend with blocked routes. Moreover, Scenario 4 provides a reduction of around 9% after taking advantage of the technological advancements developed which is paramount in such a complex scenario.
The added value of the smart environment is demonstrated across these scenarios following the current evacuation procedures. However, considering the alternative evacuation approaches proposed, the time reduction could be even more substantial. For example, in Scenario 5, specifically in the second subcase of the smart environment, the use of technologies is coupled with a different evacuation approach where mustering is skipped, and passengers are directed straight to the port quay via gangways. In this case, the benefits can be significant, with a time reduction of up to 50%. This is particularly crucial in situations where the available time for vessel evacuation is limited due to the rapid propagation of incidents like fire or flooding.
Upon scrutinizing the detailed results across all executed scenarios, key findings emerge. The foremost discovery is that the “novel” system effectively supports the evacuation process under diverse incidents and conditions, performing at least as well as a typical evacuation process dictated by the IMO regulations. Another significant finding is that this particular study or any other similar actions can enhance the evacuation process in instances where incidents impact the availability of routes, spaces, or muster stations not currently considered by IMO regulations. This is achieved by providing alternative routes that avoid blocked or congested areas and assigning passengers to the closest available muster station.
Finally, the adoption of redefined evacuation protocols, such as dynamic allocation of muster stations or avoiding mustering in port evacuation is beneficial, especially in situations where the time available for evacuation is limited. This not only reduces the required evacuation time but also allows more passengers to complete the evacuation within the stipulated time frame, minimizing potential fatalities.
8. Conclusions
The proposed risk control options show promising results. The demonstrated improvement in evacuation times attests to the tangible benefits derived from innovative approaches, affirming the efficacy of such interventions in enhancing passenger safety during critical scenarios. This resonates with the overarching goals of the SafePASS initiative and reinforces the value of technological integration in maritime safety frameworks. Comparing these findings with insights from previous studies reveals a consistent trend toward the positive impact of technological advancements on evacuation efficiency.
The proposed technological solutions have been implemented in both the virtual simulation space and in physical form. On the one hand, their efficacy is showcased in the simulations while the SafePASS consortium has also evaluated their practicality, cost-effectiveness, and human interaction. This work in general suggests that slight to medium improvements to evacuability are possible in existing ship geometries, following existing operational procedures, training, and protocols.
Similarly, the alternative port evacuation demonstrates that in general, the subject of alternative procedures should be further explored and perhaps introduced in formal rules and regulations. Not only is the time required to evacuate reduced, but also the passengers can more easily understand the process of leaving the vessel in an expedited way.
While the scenarios are not exhaustive, they capture a sizeable amount of expected serious incidents at very adverse conditions. The impact of those conditions as well as a comprehensive analysis of hazardous scenarios is a work in progress and should perhaps be paid closer attention to. The frequency of these events might be higher than anticipated, especially considering that many evacuation scenarios are predicated on events that are more likely to happen during adverse weather or as a result of a failure or communication and, in general, human error. Examining the performance while the vessel is under such degraded conditions is perhaps overlooked.
The next steps in research should target areas that have been insufficiently explored. These include investigating dynamic factors like ship motion and crowd behaviour during evacuations, integrating advanced technologies such as AI and IoT into evacuation protocols, deepening the understanding of human behaviour in emergencies, exploring alternative evacuation methods, developing real-time decision support systems, assessing crisis communication strategies, collaborating with emergency services, and proposing enhancements to existing regulatory frameworks. By addressing these aspects, future research can significantly contribute to the advancement of maritime safety and the refinement of evacuation procedures.
As we navigate the future of maritime safety, this study underscores the imperative to embrace a holistic and adaptive approach. By doing so, the industry can fortify its resilience and responsiveness to emerging safety challenges, ensuring that passengers and crew alike benefit from the continuous evolution of safety measures and protocols.
Author Contributions
Conceptualization, E.S.; methodology, E.S.; software/simulations, E.S. and F.S.; formal analysis, E.S.; resources, E.B.; data curation, E.S., F.S. and P.L.; writing—original draft preparation, E.S., P.L. and E.B.; writing—review and editing, E.B., P.L. and F.S.; visualization, E.S., F.S. and P.L.; supervision, E.B.; project administration, E.B.; funding acquisition, E.B. All authors have read and agreed to the published version of the manuscript.
Funding
The research outlined in this paper received partial funding from the SafePASS project, which, in turn, was supported by the European Union’s Horizon 2020 Research and Innovation program under Grant Agreement No. 815146.
Institutional Review Board Statement
Not applicable.
Informed Consent Statement
Not applicable.
Data Availability Statement
Data available on request.
Acknowledgments
The authors wish to express their gratitude to project FLARE (EU grant agreement number 814753) and SafePASS (EU grant agreement number 815146) for supplying the vessel geometry utilized in model training. Those associated with MSRC extend their appreciation for the support from DNV and Royal Caribbean Group in establishing and operating the MSRC. Finally, the authors would like also to express their profound appreciation to Dracos Vassalos, their mentor and instructor at the University of Strathclyde.
Conflicts of Interest
The authors state that they do not have any conflicts of interest. The funders did not participate in designing the study, collecting, analysing, or interpreting data, writing the manuscript, or deciding to publish the results. The expressed opinions are solely those of the authors and do not represent the perspectives of the European Commission, DNV, and Royal Caribbean Group.
References
- Stefanidis, F.; Boulougouris, E.; Vassalos, D. Modern Trends in Ship Evacuation. In Proceedings of the Sustainable and Safe Passenger Ships Conference, Piraeus, Greece, 4 March 2020. [Google Scholar]
- Ventikos, N.P.; Sotiralis, P.; Annetis, M.; Podimatas, V.C.; Boulougouris, E.; Stefanidis, F.; Chatzinikolaou, S.; Maccari, A. The Development and Demonstration of an Enhanced Risk Model for the Evacuation Process of Large Passenger Vessels. J. Mar. Sci. Eng. 2023, 11, 84. [Google Scholar] [CrossRef]
- European Maritime Safety Agency. Emsa Annual Overview of Marine Casualties And Incidents 2022; European Maritime Safety Agency: Lisbon, Portugal, 2022. [Google Scholar]
- Ratzan Weissman & Boldt Cruise Ship Accidents and Their Most Frequent Causes. Available online: https://www.rwblawyers.com/news/cruise-ship-accidents-and-their-most-frequent-causes#:~:text=According%20to%20the%20Maritime%20Injury,died%20in%20cruise%20ship%20accidents (accessed on 31 October 2023).
- Nasso, C.; Bertagna, S.; Mauro, F.; Marinò, A.; Bucci, V. Simplified and Advanced Approaches for Evacuation Analysis of Passenger Ships in the Early Stage of Design. Brodogradnja 2019, 70, 43–59. [Google Scholar] [CrossRef]
- Boulougouris, E.; Papanikolaou, A. Modeling and Simulation of the Evacuation Process of Passenger Ships. In Proceedings of the 10th International Congress of The International Maritime Association of the Mediterranean, Crete, Greece, 14–17 May 2002. [Google Scholar]
- Guarin, L.; Hifi, Y.; Vassalos, D. Passenger Ship Evacuation—Design and Verification. In Virtual, Augmented and Mixed Reality: Applications of Virtual and Augmented Reality, Proceedings of the 6th International Conference, VAMR 2014, Held as Part of HCI International 2014, Heraklion, Crete, Greece, 22–27 June 2014; Springer International Publishing: Berlin/Heidelberg, Germany, 2014; pp. 354–365. [Google Scholar]
- Vassalos, D.; Paterson, D.; Mauro, F.; Mujeeb-Ahmed, M.P.; Boulougouris, E. Process, Methods and Tools for Ship Damage Stability and Flooding Risk Assessment. Ocean. Eng. 2022, 266, 3062. [Google Scholar] [CrossRef]
- Monalisa Eu Project Monalisa 2.0-Mass Evacuation in Ports Pilot Exercise. 2016. Available online: https://stm-stmvalidation.s3.eu-west-1.amazonaws.com/uploads/20160420145624/ML2-D4.1.2-Mass-Evacuation-in-Ports-Pilot-Exercise.pdf (accessed on 7 December 2023).
- Chouliaras, M.S. Introduction to Evacuation. 2015. Available online: https://www.scribd.com/document/427057532/pot-evac-pdf (accessed on 7 December 2023).
- Balakhontceva, M.; Karbovskii, V.; Rybokonenko, D.; Boukhanovsky, A. Multi-Agent Simulation of Passenger Evacuation Considering Ship Motions. Procedia Comput. Sci. 2015, 66, 140–149. [Google Scholar] [CrossRef]
- Gwynne, S.; Galea, E.R.; Lyster, C.; Glen, I. Analysing the Evacuation Procedures Employed on a Thames Passenger Boat Using the MaritimeEXODUS Evacuation Model; Springer: Berlin/Heidelberg, Germany, 2003; Volume 39. [Google Scholar]
- Park, J.H.; Lee, D.; Kim, H.; Yang, Y.S. Development of Evacuation Model for Human Safety in Maritime Casualty. Ocean. Eng. 2004, 31, 1537–1547. [Google Scholar] [CrossRef]
- Klüpfel, H.; Schreckenberg, M.; Meyer-König, T.; Klüpfel, H.; Schreckenberg, M. Assessment and Analysis of Evacuation Processes on Passenger Ships by Microscopic Simulation. In Proceedings of the Pedestrian and Evacuation Dynamics, Berlin, Germany, 12 January 2002. [Google Scholar]
- Meyer-König, T.; Valanto, P.; Povel, D. Implementing Ship Motion in AENEAS—Model Development and First Results. In Pedestrian and Evacuation Dynamics 2005; Springer: Berlin/Heidelberg, Germany, 2005; pp. 429–441. [Google Scholar]
- Stefanidis, F.; Boulougouris, E.; Vassalos, D. Ship Evacuation and Emergency Response Trends. In Proceedings of the Design and Operation of Passenger Ships, London, UK, 30 April–1 May 2019. [Google Scholar]
- Drager, K.; Orset, S. Evac—The Mustering and Evacuation Computer Model Resulting from the Brite-Euram Project Mepdesign; Pedestrian and Evacuation Dynamics: Duisburg, Germany, 2001; pp. 355–368. [Google Scholar]
- Vassalos, D.; Guarin, L.; Vassalos, G.C.; Bole, M.; Kim, H.S.; Majumder, J. Advanced Evacuation Analysis—Testing the Ground on Ships. In Proceedings of the 2nd International Conference on Pedestrian and Evacuation Dynamics, Greenwich, UK, 20–22 August 2003. [Google Scholar]
- Jasionowski, A. An Integrated Approach to Damage Ship Survivability Assessment. Ph.D. Thesis, University of Strathclyde, Glasgow, UK, 2001. [Google Scholar]
- Evi, version 4.3.3. Software for Ship Evacuation. Safety At Sea: Glasgow, UK, 2017.
- EC SAFEGUARD, EC-FUNDED Project under FP 7. 2013. Available online: https://ca.practicallaw.thomsonreuters.com/9-381-1530?transitionType=Default&contextData=(sc.Default)&firstPage=true (accessed on 7 December 2023).
- Guarin, L.E.; Shigunov, V.; Vassalos, D.; Guarin, L.; Majumder, J.; Vassalos, G. Fire and Flooding Risk Assessment in Ship Design for Ease of Evacuation. In Proceedings of the 2nd International Conference on Design for Safety, Osaka, Japan, 27–30 October 2004. [Google Scholar] [CrossRef]
- Dogliani, M.; Vassalos, D.; Strang, T. A New Concept to Boost Passenger Evacuation Effectiveness in the Cruise Industry. In Proceedings of the 3rd International Euro-Conference on Computer Applications and Information Technology in the Marine Industries (COMPIT), Parador Siguenza, Spain, 9–12 May 2004. [Google Scholar]
- Tsychkova, E. Influence of Waves and Ship Motions on Safe Evacuation of Passenger Ships. Ph.D. Thesis, Kungliga Tekniska Högskolan (KTH), Stockholm, Sweden, 2000. [Google Scholar]
- Wang, X.; Xia, G.; Zhao, J.; Wang, J.; Yang, Z.; Loughney, S.; Fang, S.; Zhang, S.; Xing, Y.; Liu, Z. A Novel Method for the Risk Assessment of Human Evacuation from Cruise Ships in Maritime Transportation. Reliab. Eng. Syst. Saf. 2023, 230, 108887. [Google Scholar] [CrossRef]
- Nektarios Bolierakis, S.; Nousis, V.; Karagiannidis, L.; Karaseitanidis, G.; Amditis, A. Exploiting Augmented Reality for Improved Training and Safety Scenarios for Large Passenger Ships. In Proceedings of the EuroVR Conference, Valencia, Spain, 25–27 November 2020. [Google Scholar]
- Ventikos, N.P.; Pollalis, C.D. Reducing Ship Evacuation Time: The Role of a Rail Platform for Integrating Novel LSA Lifeboats on Ship Architectural Structures. In Proceedings of the 1st International Conference on the Stability and Safety of Ships and Ocean Vehicles, Glasgow, UK, 7–11 June 2021. [Google Scholar]
- Sampson, O.; Bolierakis, S.; Krommyda, M.; Karagianidis, L.; Amditis, A. AR Crew Rescue Assistant and AR Passenger Assistant Application for Emergency Scenarios on Large Passenger Ships. In Proceedings of the 2022 IEEE International Conference on Imaging Systems and Techniques (IST), Kaohsiung, Taiwan, 21 June 2022. [Google Scholar]
- Mitro, N.; Argyri, K.; Pavlopoulos, L.; Kosyvas, D.; Karagiannidis, L.; Kostovasili, M.; Misichroni, F.; Ouzounoglou, E.; Amditis, A. AI-Enabled Smart Wristband Providing Real-Time Vital Signs and Stress Monitoring. Sensors 2023, 23, 2821. [Google Scholar] [CrossRef] [PubMed]
- Liston, P. Acceptability & Usability of Location-Support Technologies for Cruise Ship Evacuations. In Proceedings of the 24th International Conference on Human-Computer Interaction, HCII 2022, Virtual Event, 26 June–1 July 2022. [Google Scholar]
- Evangelos, S.; Fotios, S.; Evangelos, B.; Panagiotis, L.; Alexandros, K.; Romain, M.; Myo, A.; Panagiotis, S.; Emmanouil, A. SafePASS Project: A Risk Modelling Tool for Passenger Ship Evacuation and Emergency Response Decision Support; Zenodo: Glasgow, UK, 2023. [Google Scholar]
- Stefanidis, F.; Stefanou, E.; Boulougouris, E.; Karagianndis, L.; Sotiralis, P.; Annetis, E.; Balet, O.; Veltsistas, P. Science Direct Safe PASS: A New Chapter for Passenger Ship Evacuation and Marine Emergency Response. Transp. Res. Procedia 2022, 72, 3885–3892. [Google Scholar] [CrossRef]
- Flare EU Project Flare Eu Funded Project. 2019. Available online: https://cordis.europa.eu/project/id/814753 (accessed on 7 December 2023).
- Vassalos, D.; Kim, H.S.; Christiansen, G.; Majumder, J.; Schreckenberg, M.; Sharma, S.D. A Mesoscopic Model for Passenger Evacuation in a Virtual Ship-Sea Environment and Performance-Based Evaluation. In Pedestrian and Evacuation Dynamics; Springer: Amsterdam, The Netherlands, 2002; pp. 369–391. [Google Scholar]
- Kim, H.S. Advanced Passenger Evacuation Simulation in A Virtual Ship-Sea Environment; University of Strathclyde: Glasgow, UK, 2005. [Google Scholar]
- Nielsen Norman Group. Usability for Seniors: Challenges and Changes. Available online: https://www.nngroup.com/articles/usability-for-senior-citizens/ (accessed on 13 October 2023).
- Espírito-Santo, M.; Moura, M.M.M.; Lapão, N.; Peixoto, S. Stefany Peixoto Assessment of Utilization and Willingness to Use It Devices to Support Heath Management. Eur. J. Public Health 2021, 2, 31. [Google Scholar]
- Pennycott, A.; Hifi, Y. Evacuability of a Flooded Passenger Ship. In Proceedings of the 4th International Maritime Conference on Design for Safety, Trieste, Italy, 18–20 October 2010. [Google Scholar]
Figure 1.
Marine casualties between 2014 and 2021 as per their severity level according to EMSA [
3].
Figure 1.
Marine casualties between 2014 and 2021 as per their severity level according to EMSA [
3].
Figure 2.
“Advanced” evacuation time [
7,
9].
Figure 2.
“Advanced” evacuation time [
7,
9].
Figure 3.
Procedure followed on board large passenger vessels during evacuation [
10].
Figure 3.
Procedure followed on board large passenger vessels during evacuation [
10].
Figure 4.
Evacuation process [
11].
Figure 4.
Evacuation process [
11].
Figure 6.
Screenshots from the mobile application during end the offline scanning phase & at the end of crew member navigation.
Figure 6.
Screenshots from the mobile application during end the offline scanning phase & at the end of crew member navigation.
Figure 7.
Dynamic exit signs.
Figure 7.
Dynamic exit signs.
Figure 8.
Passenger mobile application.
Figure 8.
Passenger mobile application.
Figure 9.
Adjusted evacuation procedure followed in port on board passenger vessels [
10].
Figure 9.
Adjusted evacuation procedure followed in port on board passenger vessels [
10].
Figure 10.
Flowchart describing the methodology followed.
Figure 10.
Flowchart describing the methodology followed.
Figure 11.
Evacuability variables [
9,
36].
Figure 11.
Evacuability variables [
9,
36].
Figure 12.
Smartphone usage percentages.
Figure 12.
Smartphone usage percentages.
Figure 13.
COP display of alerts.
Figure 13.
COP display of alerts.
Figure 14.
Vessel’s profile view.
Figure 14.
Vessel’s profile view.
Figure 15.
Identification of the vessel’s muster stations and Main Vertical Zones.
Figure 15.
Identification of the vessel’s muster stations and Main Vertical Zones.
Figure 16.
Speed reduction functions.
Figure 16.
Speed reduction functions.
Figure 17.
EVI model with flooding data.
Figure 17.
EVI model with flooding data.
Figure 18.
Scenario 2 showing crew members (avatars with white shirts) inspecting areas for disoriented passengers.
Figure 18.
Scenario 2 showing crew members (avatars with white shirts) inspecting areas for disoriented passengers.
Figure 19.
Flooded compartment in Deck 3.
Figure 19.
Flooded compartment in Deck 3.
Figure 20.
Passengers located (avatars with blue shirts) within Muster Station G, having to be redirected to another muster station due to sudden fire ignition.
Figure 20.
Passengers located (avatars with blue shirts) within Muster Station G, having to be redirected to another muster station due to sudden fire ignition.
Figure 21.
Representation of the port evacuation using gangways.
Figure 21.
Representation of the port evacuation using gangways.
Figure 22.
Modified evacuation procedure redirecting passengers directly to port terminals through the gangways of the vessel.
Figure 22.
Modified evacuation procedure redirecting passengers directly to port terminals through the gangways of the vessel.
Figure 23.
Scenario 1—Mustering time.
Figure 23.
Scenario 1—Mustering time.
Figure 24.
Scenario 2—Mustering time.
Figure 24.
Scenario 2—Mustering time.
Figure 25.
Scenario 3—Mustering time.
Figure 25.
Scenario 3—Mustering time.
Figure 26.
Scenario 4—Mustering time.
Figure 26.
Scenario 4—Mustering time.
Figure 27.
Scenario 4—Remustering time.
Figure 27.
Scenario 4—Remustering time.
Figure 28.
Scenario 5—Mustering time.
Figure 28.
Scenario 5—Mustering time.
Figure 29.
Scenario 5a—Muster stations to gangways.
Figure 29.
Scenario 5a—Muster stations to gangways.
Figure 30.
Scenario 5—Immediate redirection to port.
Figure 30.
Scenario 5—Immediate redirection to port.
Figure 31.
Scenario 1—First subcase’s heatmap.
Figure 31.
Scenario 1—First subcase’s heatmap.
Figure 32.
Scenario 1—Second subcase’s heatmap.
Figure 32.
Scenario 1—Second subcase’s heatmap.
Figure 33.
Scenario 2—Comparison of cumulative travel distance. (a) depicting a normal case, while (b) involves a case with the implementation of solutions.
Figure 33.
Scenario 2—Comparison of cumulative travel distance. (a) depicting a normal case, while (b) involves a case with the implementation of solutions.
Figure 34.
Scenario 3—Simulation environment.
Figure 34.
Scenario 3—Simulation environment.
Figure 35.
Scenario 4—Comparison of cumulative congestion times between the two cases during the first stage of this scenario. (a) depicting a normal case, while (b) involves a case with the implementation of solutions.
Figure 35.
Scenario 4—Comparison of cumulative congestion times between the two cases during the first stage of this scenario. (a) depicting a normal case, while (b) involves a case with the implementation of solutions.
Figure 36.
Scenario 4—Comparison of cumulative congestion times between the two cases during the final stage of this scenario (re-mustering process). (a) depicting a normal case, while (b) involves a case with the implementation of solutions.
Figure 36.
Scenario 4—Comparison of cumulative congestion times between the two cases during the final stage of this scenario (re-mustering process). (a) depicting a normal case, while (b) involves a case with the implementation of solutions.
Figure 37.
Scenario 5 with the subcase of passengers following the conventional evacuation procedures with/without any smart technologies implemented.
Figure 37.
Scenario 5 with the subcase of passengers following the conventional evacuation procedures with/without any smart technologies implemented.
Table 1.
Population groups for passengers.
Table 1.
Population groups for passengers.
| Population Groups | Percentage of Passengers (%) |
|---|
| Females younger than 30 years | 7 |
| Females 30–50 years old | 7 |
| Females older than 50 years | 16 |
| Females older than 50, mobility impaired (1) | 10 |
| Females older than 50, mobility impaired (2) | 10 |
| Males younger than 30 years | 7 |
| Males 30–50 years old | 7 |
| Males older than 50 years | 16 |
| Males older than 50, mobility impaired (1) | 10 |
| Males older than 50, mobility impaired (2) | 10 |
Table 2.
Population groups for crew members.
Table 2.
Population groups for crew members.
| Population Groups | Percentage of Passengers (%) |
|---|
| Crew females | 50 |
| Crew males | 50 |
Table 3.
Distributions of passengers and crew per space type during day.
Table 3.
Distributions of passengers and crew per space type during day.
| Space Type | Pax | Crew | Total | % Pax | % Crew |
|---|
| Public | 2788 | 413 | 3201 | 99.93% | 45.38% |
| Cabin | 0 | 0 | 0 | 0.00% | 0.00% |
| Open Deck | 0 | 0 | 0 | 0.00% | 0.00% |
| Crew Cabin | 0 | 278 | 278 | 0.00% | 30.55% |
| Crew Service | 0 | 167 | 167 | 0.00% | 18.35% |
| Crew Private | 0 | 52 | 52 | 0.00% | 5.71% |
| Stair | 0 | 0 | 0 | 0.00% | 0.00% |
| Corridor | 2 | 0 | 2 | 0.07% | 0.00% |
| Muster | 889 | 189 | 1078 | 31.86% | 20.77% |
| Totals | 2790 | 910 | 3700 | 100.00% | 100.00% |
Table 4.
Distributions of passengers and crew per space type at night.
Table 4.
Distributions of passengers and crew per space type at night.
| Space Type | Pax | Crew | Total | % Pax | % Crew |
|---|
| Public | 261 | 131 | 392 | 9.35% | 14.40% |
| Cabin | 2474 | 0 | 2474 | 88.67% | 0.00% |
| Open Deck | 55 | 54 | 109 | 1.97% | 5.93% |
| Crew Cabin | 0 | 559 | 559 | 0.00% | 61.43% |
| Crew Service | 0 | 119 | 119 | 0.00% | 13.08% |
| Crew Private | 0 | 47 | 47 | 0.00% | 5.16% |
| Stair | 0 | 0 | 0 | 0.00% | 0.00% |
| Corridor | 0 | 0 | 0 | 0.00% | 0.00% |
| Muster | 126 | 50 | 176 | 4.52% | 5.49% |
| Totals | 2790 | 910 | 3700 | 100.00% | 100.00% |
Table 5.
Passengers’ walking speed.
Table 5.
Passengers’ walking speed.
| Population Groups | Walking Speed on Flat Terrain (m/s) | Walking Speed on Stairs (m/s) |
|---|
| Stairs Up | Stairs Down |
|---|
| Min. | Max. | Min. | Min. | Max. | Max. |
|---|
| Females younger than 30 years | 0.93 | 1.55 | 0.47 | 0.79 | 0.56 | 0.94 |
| Females 30–50 years old | 0.71 | 1.19 | 0.44 | 0.74 | 0.49 | 0.81 |
| Females older than 50 years | 0.56 | 0.94 | 0.37 | 0.61 | 0.45 | 0.75 |
| Females older than 50, mobility impaired (1) | 0.43 | 0.71 | 0.28 | 0.46 | 0.34 | 0.56 |
| Females older than 50, mobility impaired (2) | 0.37 | 0.61 | 0.23 | 0.39 | 0.29 | 0.49 |
| Males younger than 30 years | 1.11 | 1.85 | 0.5 | 0.84 | 0.76 | 1.26 |
| Males 30–50 years old | 0.97 | 1.62 | 0.47 | 0.79 | 0.64 | 1.07 |
| Males older than 50 years | 0.84 | 1.4 | 0.38 | 0.64 | 0.5 | 0.84 |
| Males older than 50, mobility impaired (1) | 0.64 | 1.06 | 0.29 | 0.49 | 0.38 | 0.64 |
| Males older than 50, mobility impaired (2) | 0.55 | 0.91 | 0.25 | 0.41 | 0.33 | 0.55 |
Table 6.
Crew members’ walking speed.
Table 6.
Crew members’ walking speed.
| Population Groups | Walking Speed on Flat Terrain (m/s) | Walking Speed on Stairs (m/s) |
|---|
| Stairs Up | Stairs Down |
|---|
| Min. | Max. | Min. | Min. | Max. | Max. |
|---|
| Crew females | 0.93 | 1.55 | 0.47 | 0.79 | 0.56 | 0.94 |
| Crew males | 1.11 | 1.85 | 0.5 | 0.84 | 0.76 | 1.26 |
Table 7.
IMO Passengers’ demographics (day-scenario).
Table 7.
IMO Passengers’ demographics (day-scenario).
| Percentage | Age | Gender | Awareness |
|---|
| | Min | Max | | Mean | SD | Offset | Lower | Upper |
|---|
| 7% | 10 | 30 | Female | 3.44 | 0.94 | 0 | 0 | 300 |
| 7% | 30 | 50 | Female | 3.44 | 0.94 | 0 | 0 | 300 |
| 16% | 50 | 70 | Female | 3.44 | 0.94 | 0 | 0 | 300 |
| 10% | 50 | 70 | Female | 3.44 | 0.94 | 0 | 0 | 300 |
| 10% | 50 | 70 | Female | 3.44 | 0.94 | 0 | 0 | 300 |
| 7% | 10 | 30 | Male | 3.44 | 0.94 | 0 | 0 | 300 |
| 7% | 30 | 50 | Male | 3.44 | 0.94 | 0 | 0 | 300 |
| 16% | 50 | 70 | Male | 3.44 | 0.94 | 0 | 0 | 300 |
| 10% | 50 | 70 | Male | 3.44 | 0.94 | 0 | 0 | 300 |
| 10% | 50 | 70 | Male | 3.44 | 0.94 | 0 | 0 | 300 |
Table 8.
Passengers’ demographics with the novel solutions (day-scenario).
Table 8.
Passengers’ demographics with the novel solutions (day-scenario).
| Percentage | Age | Gender | Awareness |
|---|
| | Min | Max | | Mean | SD | Offset | Lower | Upper |
|---|
| 1.4% | 10 | 30 | Female | 3.44 | 0.94 | 0 | 0 | 300 |
| 5.6% | 10 | 30 | Female | 3.44 | 0.94 | 0 | 0 | 60 |
| 1.4% | 10 | 30 | Male | 3.44 | 0.94 | 0 | 0 | 300 |
| 5.6% | 10 | 30 | Male | 3.44 | 0.94 | 0 | 0 | 60 |
| 0.7% | 30 | 50 | Female | 3.44 | 0.94 | 0 | 0 | 300 |
| 6.3% | 30 | 50 | Female | 3.44 | 0.94 | 0 | 0 | 60 |
| 0.7% | 30 | 50 | Male | 3.44 | 0.94 | 0 | 0 | 300 |
| 6.3% | 30 | 50 | Male | 3.44 | 0.94 | 0 | 0 | 60 |
| 6.4% | 50 | 70 | Female | 3.44 | 0.94 | 0 | 0 | 300 |
| 9.6% | 50 | 70 | Female | 3.44 | 0.94 | 0 | 0 | 60 |
| 6.4% | 50 | 70 | Male | 3.44 | 0.94 | 0 | 0 | 300 |
| 9.6% | 50 | 70 | Male | 3.44 | 0.94 | 0 | 0 | 60 |
| 4.0% | 50 | 70 | Male | 3.44 | 0.94 | 0 | 0 | 300 |
| 6.0% | 50 | 70 | Male | 3.44 | 0.94 | 0 | 0 | 60 |
| 4.0% | 50 | 70 | Female | 3.44 | 0.94 | 0 | 0 | 300 |
| 6.0% | 50 | 70 | Female | 3.44 | 0.94 | 0 | 0 | 60 |
| 4.0% | 50 | 70 | Female | 3.44 | 0.94 | 0 | 0 | 300 |
| 6.0% | 50 | 70 | Female | 3.44 | 0.94 | 0 | 0 | 60 |
| 4.0% | 50 | 70 | Male | 3.44 | 0.94 | 0 | 0 | 300 |
| 6.0% | 50 | 70 | Male | 3.44 | 0.94 | 0 | 0 | 60 |
Table 9.
IMO Passengers’ demographics (night-scenario).
Table 9.
IMO Passengers’ demographics (night-scenario).
| Percentage | Age | Gender | Awareness |
|---|
| | Min | Max | | Mean | SD | Offset | Lower | Upper |
|---|
| 7% | 10 | 30 | Female | 3.95 | 0.84 | 400 | 400 | 700 |
| 7% | 30 | 50 | Female | 3.95 | 0.84 | 400 | 400 | 700 |
| 16% | 50 | 70 | Female | 3.95 | 0.84 | 400 | 400 | 700 |
| 10% | 50 | 70 | Female | 3.95 | 0.84 | 400 | 400 | 700 |
| 10% | 50 | 70 | Female | 3.95 | 0.84 | 400 | 400 | 700 |
| 7% | 10 | 30 | Male | 3.95 | 0.84 | 400 | 400 | 700 |
| 7% | 30 | 50 | Male | 3.95 | 0.84 | 400 | 400 | 700 |
| 16% | 50 | 70 | Male | 3.95 | 0.84 | 400 | 400 | 700 |
| 10% | 50 | 70 | Male | 3.95 | 0.84 | 400 | 400 | 700 |
| 10% | 50 | 70 | Male | 3.95 | 0.84 | 400 | 400 | 700 |
Table 10.
Passengers’ demographics with the novel solutions (night-scenario).
Table 10.
Passengers’ demographics with the novel solutions (night-scenario).
| Percentage | Age | Gender | Awareness |
|---|
| | Min | Max | | Mean | SD | Offset | Lower | Upper |
|---|
| 1.4% | 10 | 30 | Female | 3.95 | 0.84 | 400 | 400 | 700 |
| 5.6% | 10 | 30 | Female | 3.95 | 0.84 | 120 | 120 | 180 |
| 1.4% | 10 | 30 | Male | 3.95 | 0.84 | 400 | 400 | 700 |
| 5.6% | 10 | 30 | Male | 3.95 | 0.84 | 120 | 120 | 180 |
| 0.7% | 30 | 50 | Female | 3.95 | 0.84 | 400 | 400 | 700 |
| 6.3% | 30 | 50 | Female | 3.95 | 0.84 | 120 | 120 | 180 |
| 0.7% | 30 | 50 | Male | 3.95 | 0.84 | 400 | 400 | 700 |
| 6.3% | 30 | 50 | Male | 3.95 | 0.84 | 120 | 120 | 180 |
| 6.4% | 50 | 70 | Female | 3.95 | 0.84 | 400 | 400 | 700 |
| 9.6% | 50 | 70 | Female | 3.95 | 0.84 | 120 | 120 | 180 |
| 6.4% | 50 | 70 | Male | 3.95 | 0.84 | 400 | 400 | 700 |
| 9.6% | 50 | 70 | Male | 3.95 | 0.84 | 120 | 120 | 180 |
| 4.0% | 50 | 70 | Male | 3.95 | 0.84 | 400 | 400 | 700 |
| 6.0% | 50 | 70 | Male | 3.95 | 0.84 | 120 | 120 | 180 |
| 4.0% | 50 | 70 | Female | 3.95 | 0.84 | 400 | 400 | 700 |
| 6.0% | 50 | 70 | Female | 3.95 | 0.84 | 120 | 120 | 180 |
| 4.0% | 50 | 70 | Female | 3.95 | 0.84 | 400 | 400 | 700 |
| 6.0% | 50 | 70 | Female | 3.95 | 0.84 | 120 | 120 | 180 |
| 4.0% | 50 | 70 | Male | 3.95 | 0.84 | 400 | 400 | 700 |
| 6.0% | 50 | 70 | Male | 3.95 | 0.84 | 120 | 120 | 180 |
Table 11.
Vessel details.
Table 11.
Vessel details.
| Vessel Type | Cruise Vessel |
|---|
| Length Overall | 300 m |
Length Between Perpendiculars
(LBP) | 270 m |
| Breadth Moulded | 35 m |
| Design Draught | 8 m |
| Number of Passengers | 2790 |
| Crew members | 910 |
Table 12.
Wave characteristics.
Table 12.
Wave characteristics.
| SPECTRUM | JOHNSWAP |
|---|
| Significant wave height | 7 m |
| Wave encounter heading | 90 degrees |
| Wave encounter speed | 0 kts |
Table 13.
IMO benchmarking cases tested.
Table 13.
IMO benchmarking cases tested.
| Test No. | Description | Outcome |
|---|
| Test 1 | Maintaining set walking speed in corridor | PASS |
| Test 2 | Maintaining set walking speed up staircase | PASS |
| Test 3 | Maintaining set walking speed down staircase | PASS |
| Test 4 | Exit flow rate | PASS |
| Test 5 | Response duration | PASS |
| Test 6 | Rounding corners | PASS |
| Test 7 | Assignment of population demographics parameters | PASS |
| Test 8 | Counterflow—two rooms connected via a corridor | PASS |
| Test 9 | Exit flow: crowd dissipation from a large public room | PASS |
| Test 10 | Exit route allocation | PASS |
| Test 11 | Staircase | PASS |
| Test 12 | Flow density relation | PASS |
Table 14.
Scenario 1—Simulation results.
Table 14.
Scenario 1—Simulation results.
| Scenario 1 | Mustering Time without Any Smart Environment (s) | Mustering Time with Smart Environment (s) |
|---|
| 95%ile | 1420.25 | 1220.50 |
| Max | 1424.5 | 1320.0 |
| Mean | 1358.40 | 1115.81 |
| Min | 1281.5 | 1005.0 |
Table 15.
Scenario 2—Simulation results.
Table 15.
Scenario 2—Simulation results.
| Scenario 2 | Mustering Time without Any Smart Environment (s) | Mustering Time with Smart Environment (s) |
|---|
| 95%ile | 4492.75 | 3808.25 |
| Max | 6620.5 | 4458.00 |
| Mean | 2787.76 | 2564.76 |
| Min | 1326.5 | 1559.00 |
Table 16.
Scenario 3—Simulation results.
Table 16.
Scenario 3—Simulation results.
| Scenario 3 | Mustering Time without Any Smart Environment (s) | Mustering Time with Smart Environment (s) |
|---|
| 95%ile | 1410.50 | 1393.25 |
| Max | 1491.5 | 1595.5 |
| Mean | 1155.83 | 1125.74 |
| Min | 992.0 | 979.5 |
Table 17.
Scenario 4—Simulation results.
Table 17.
Scenario 4—Simulation results.
| Scenario 4 | Mustering Time without Any Smart Environment (s) | Mustering Time with Smart Environment (s) |
|---|
| | Mustering Time | Re-Mustering | Total Time | Mustering Time | Re-Mustering | Total Time |
|---|
| 95%ile | 5440.25 | 1186.25 | 6626.5 | 5037.00 | 1025.50 | 6062.5 |
| Max | 6342.5 | 1244.5 | 7587 | 5230.0 | 1093.5 | 6323.5 |
| Mean | 3088.14 | 1000.58 | 4088.72 | 2815.07 | 937.93 | 3753 |
| Min | 1417.0 | 860.0 | 2277 | 1581.0 | 868.0 | 2449 |
Table 18.
Scenario 5—Simulation results.
Table 18.
Scenario 5—Simulation results.
| Scenario 5 | Mustering Time without Any Smart Environment (s) | Mustering Time with Smart Environment (s) | |
|---|
| | Mustering Time | Muster Stations to Gangways | Total Time | Mustering Time | Muster Stations to Gangways | Total Time | Directly to Port |
|---|
| 95%ile | 2273 | 3354.75 | 5627.75 | 1637.25 | 3343.75 | 4981 | 3308.5 |
| Max | 2532.5 | 3365 | 5897.5 | 1706 | 3398 | 5104 | 3611.5 |
| Mean | 1908.96 | 3295.96 | 5204.92 | 1431.16 | 3299.61 | 4730.77 | 2990.56 |
| Min | 1678.5 | 3214.5 | 4893 | 1233 | 3239.5 | 4472.5 | 2754.5 |
Table 19.
Improvements after the implementation of the suggested solutions.
Table 19.
Improvements after the implementation of the suggested solutions.
| Evacuation Time Reduction per the Different Scenarios |
|---|
| | Scen1 | Scen2 | Scen3 | Scen4 | Scen5b_1 | Scen5b_2 |
|---|
| “Novel” case (s) | 1220.5 | 3808.25 | 1393.25 | 6062.5 | 4981 | 3308.5 |
| Conventional case (s) | 1420.25 | 4492.75 | 1410.5 | 6626.5 | 5627.75 | 4981 |
| Reduction percentage (%) | −16.36 | −17.97 | −1.23 | −9.30 | −12.98 | −50.55 |
| Disclaimer/Publisher’s Note: The statements, opinions and data contained in all publications are solely those of the individual author(s) and contributor(s) and not of MDPI and/or the editor(s). MDPI and/or the editor(s) disclaim responsibility for any injury to people or property resulting from any ideas, methods, instructions or products referred to in the content. |
© 2024 by the authors. Licensee MDPI, Basel, Switzerland. This article is an open access article distributed under the terms and conditions of the Creative Commons Attribution (CC BY) license (https://creativecommons.org/licenses/by/4.0/).


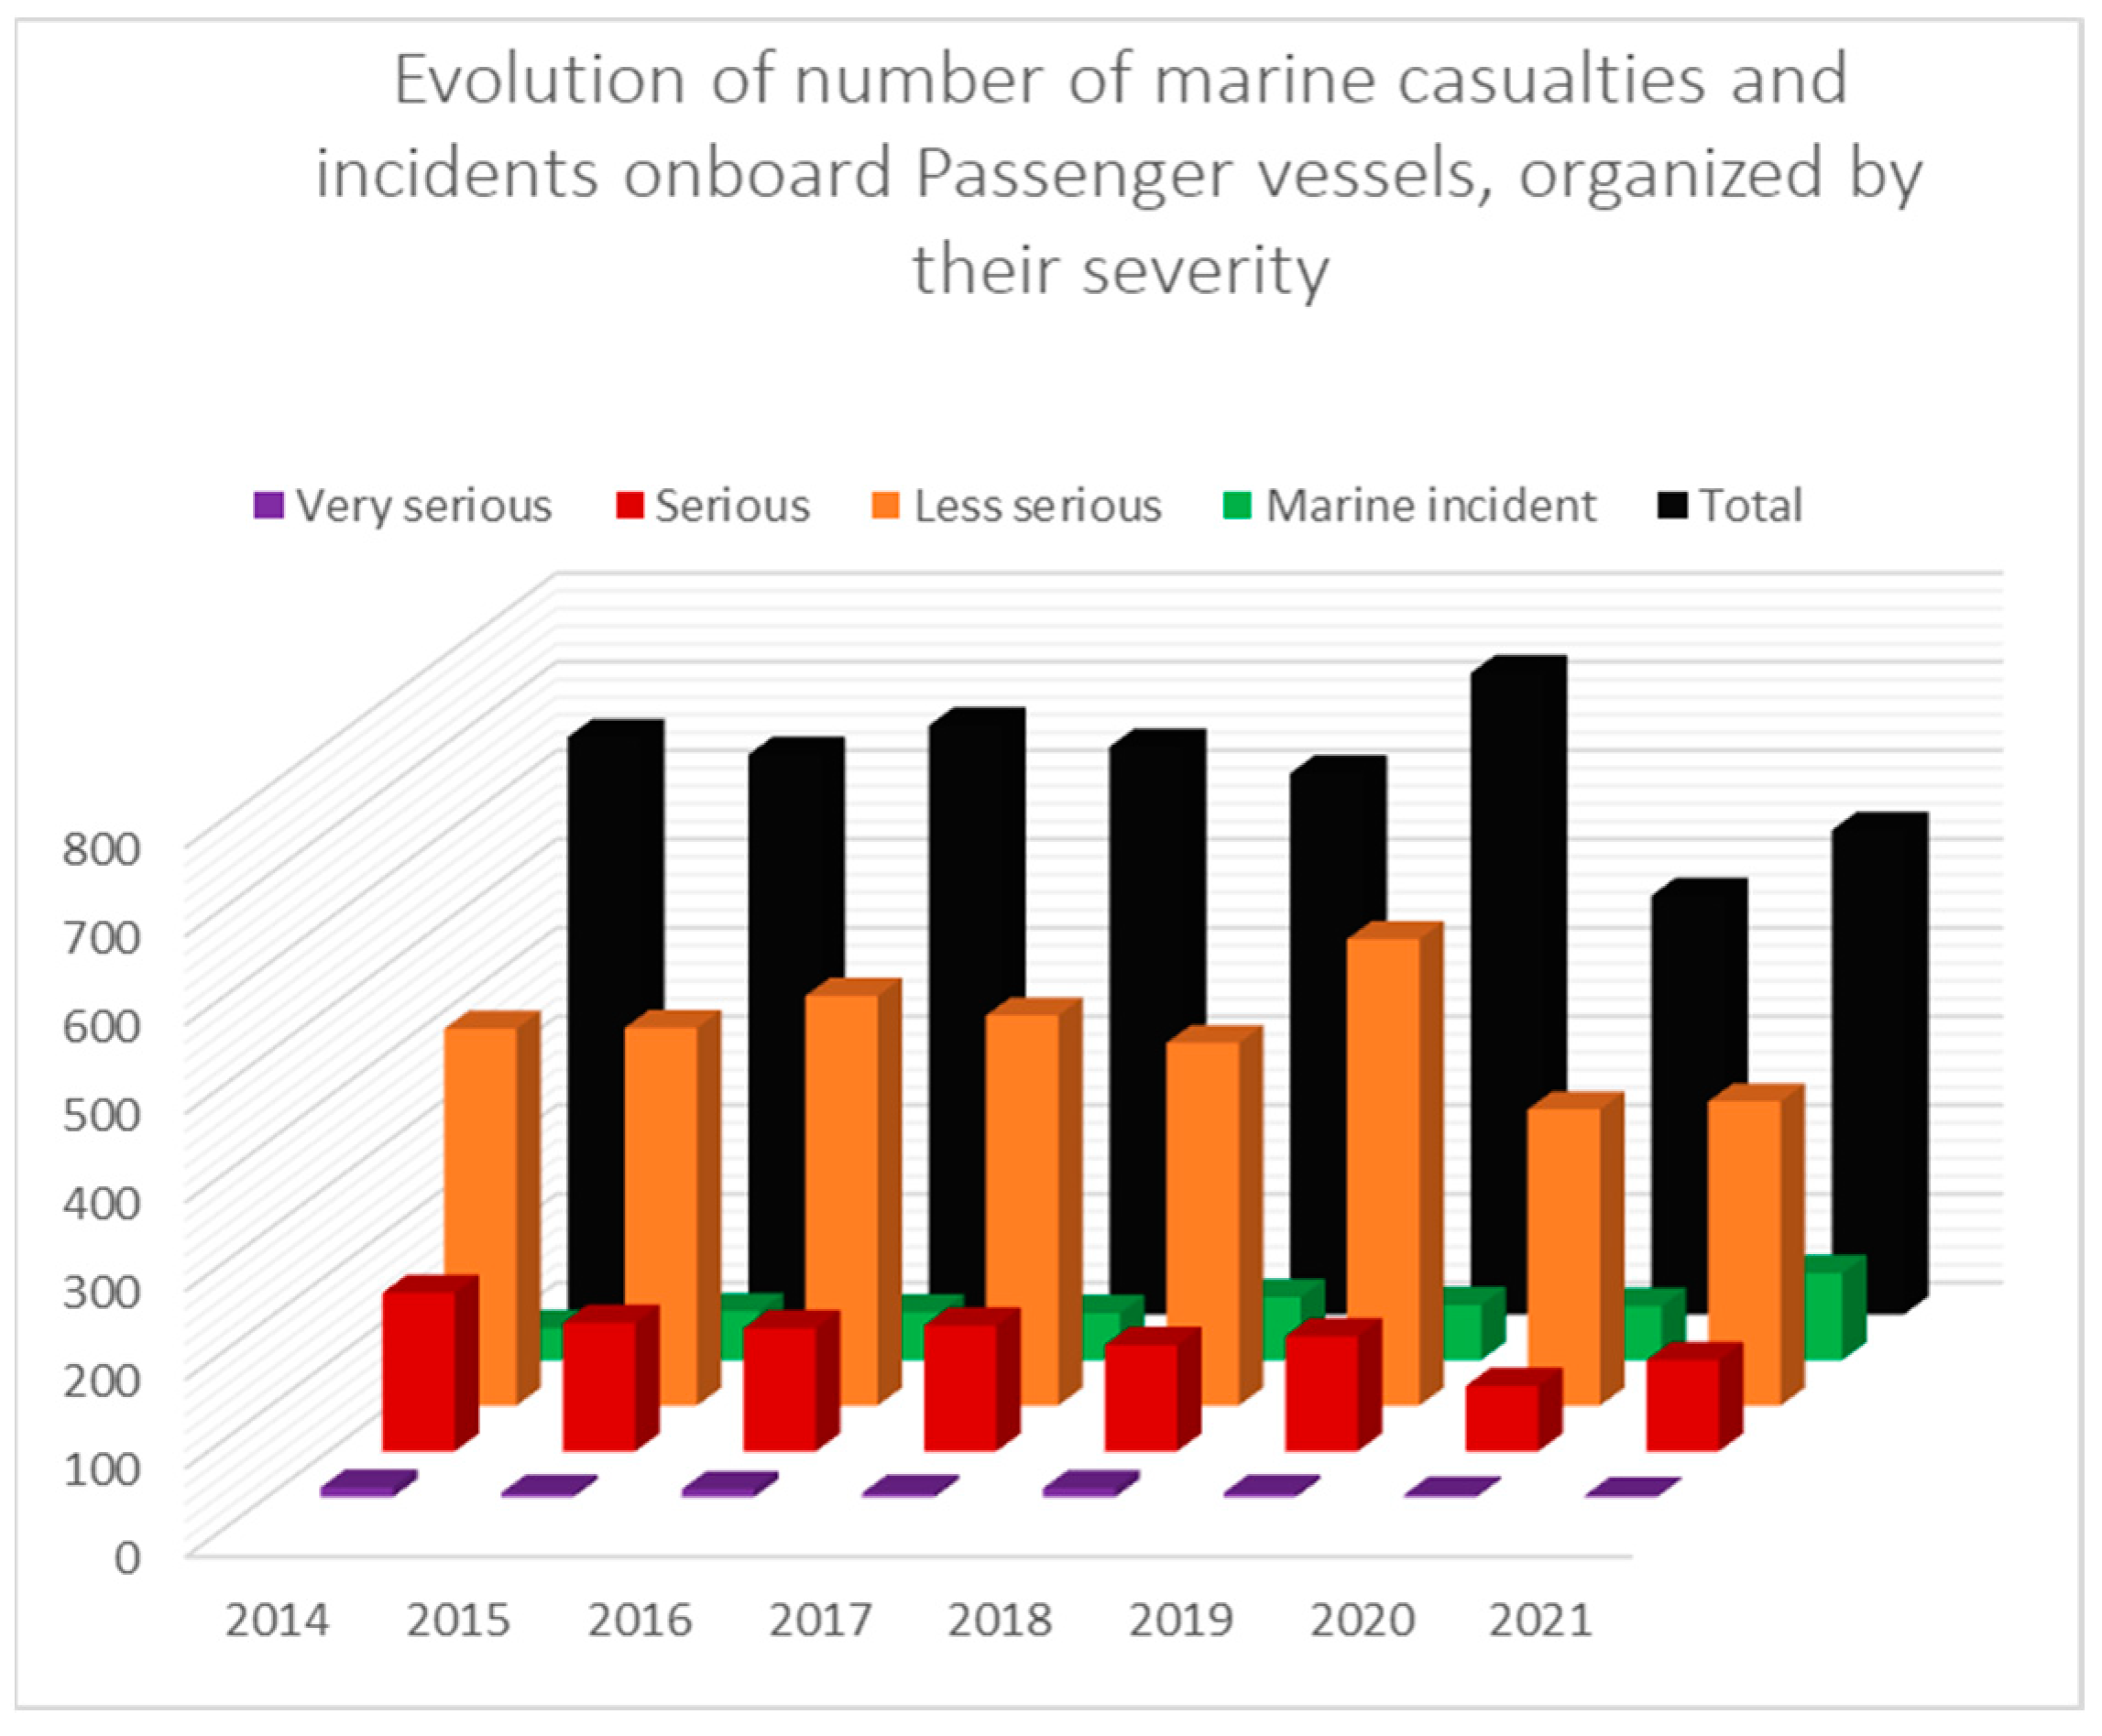
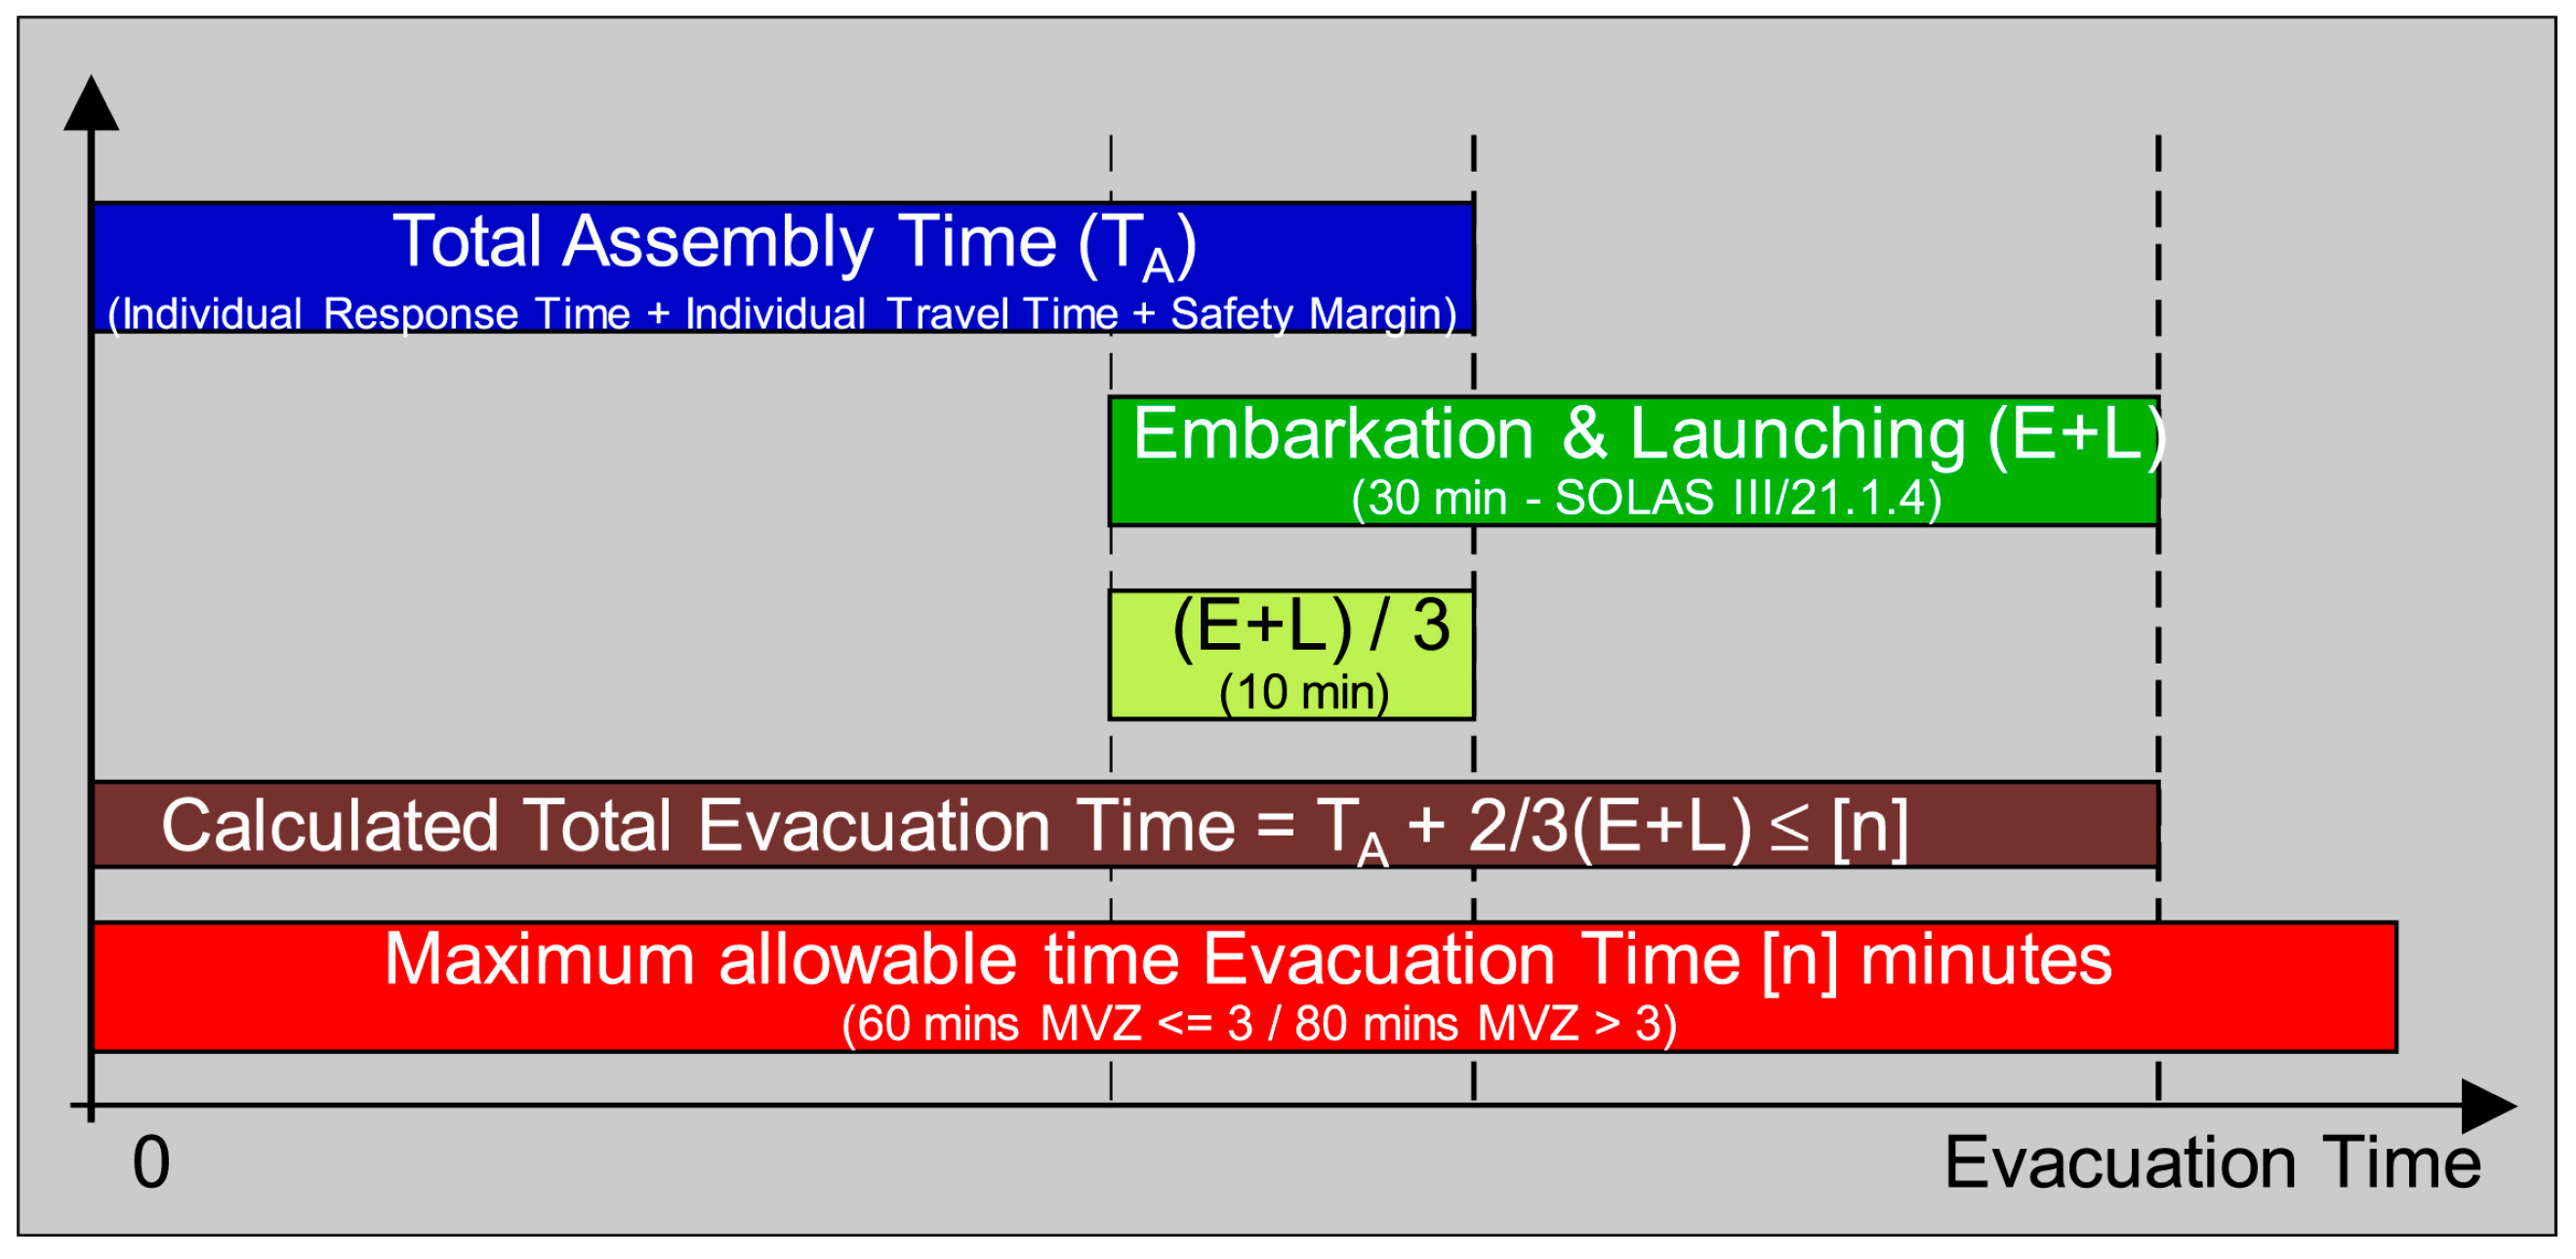
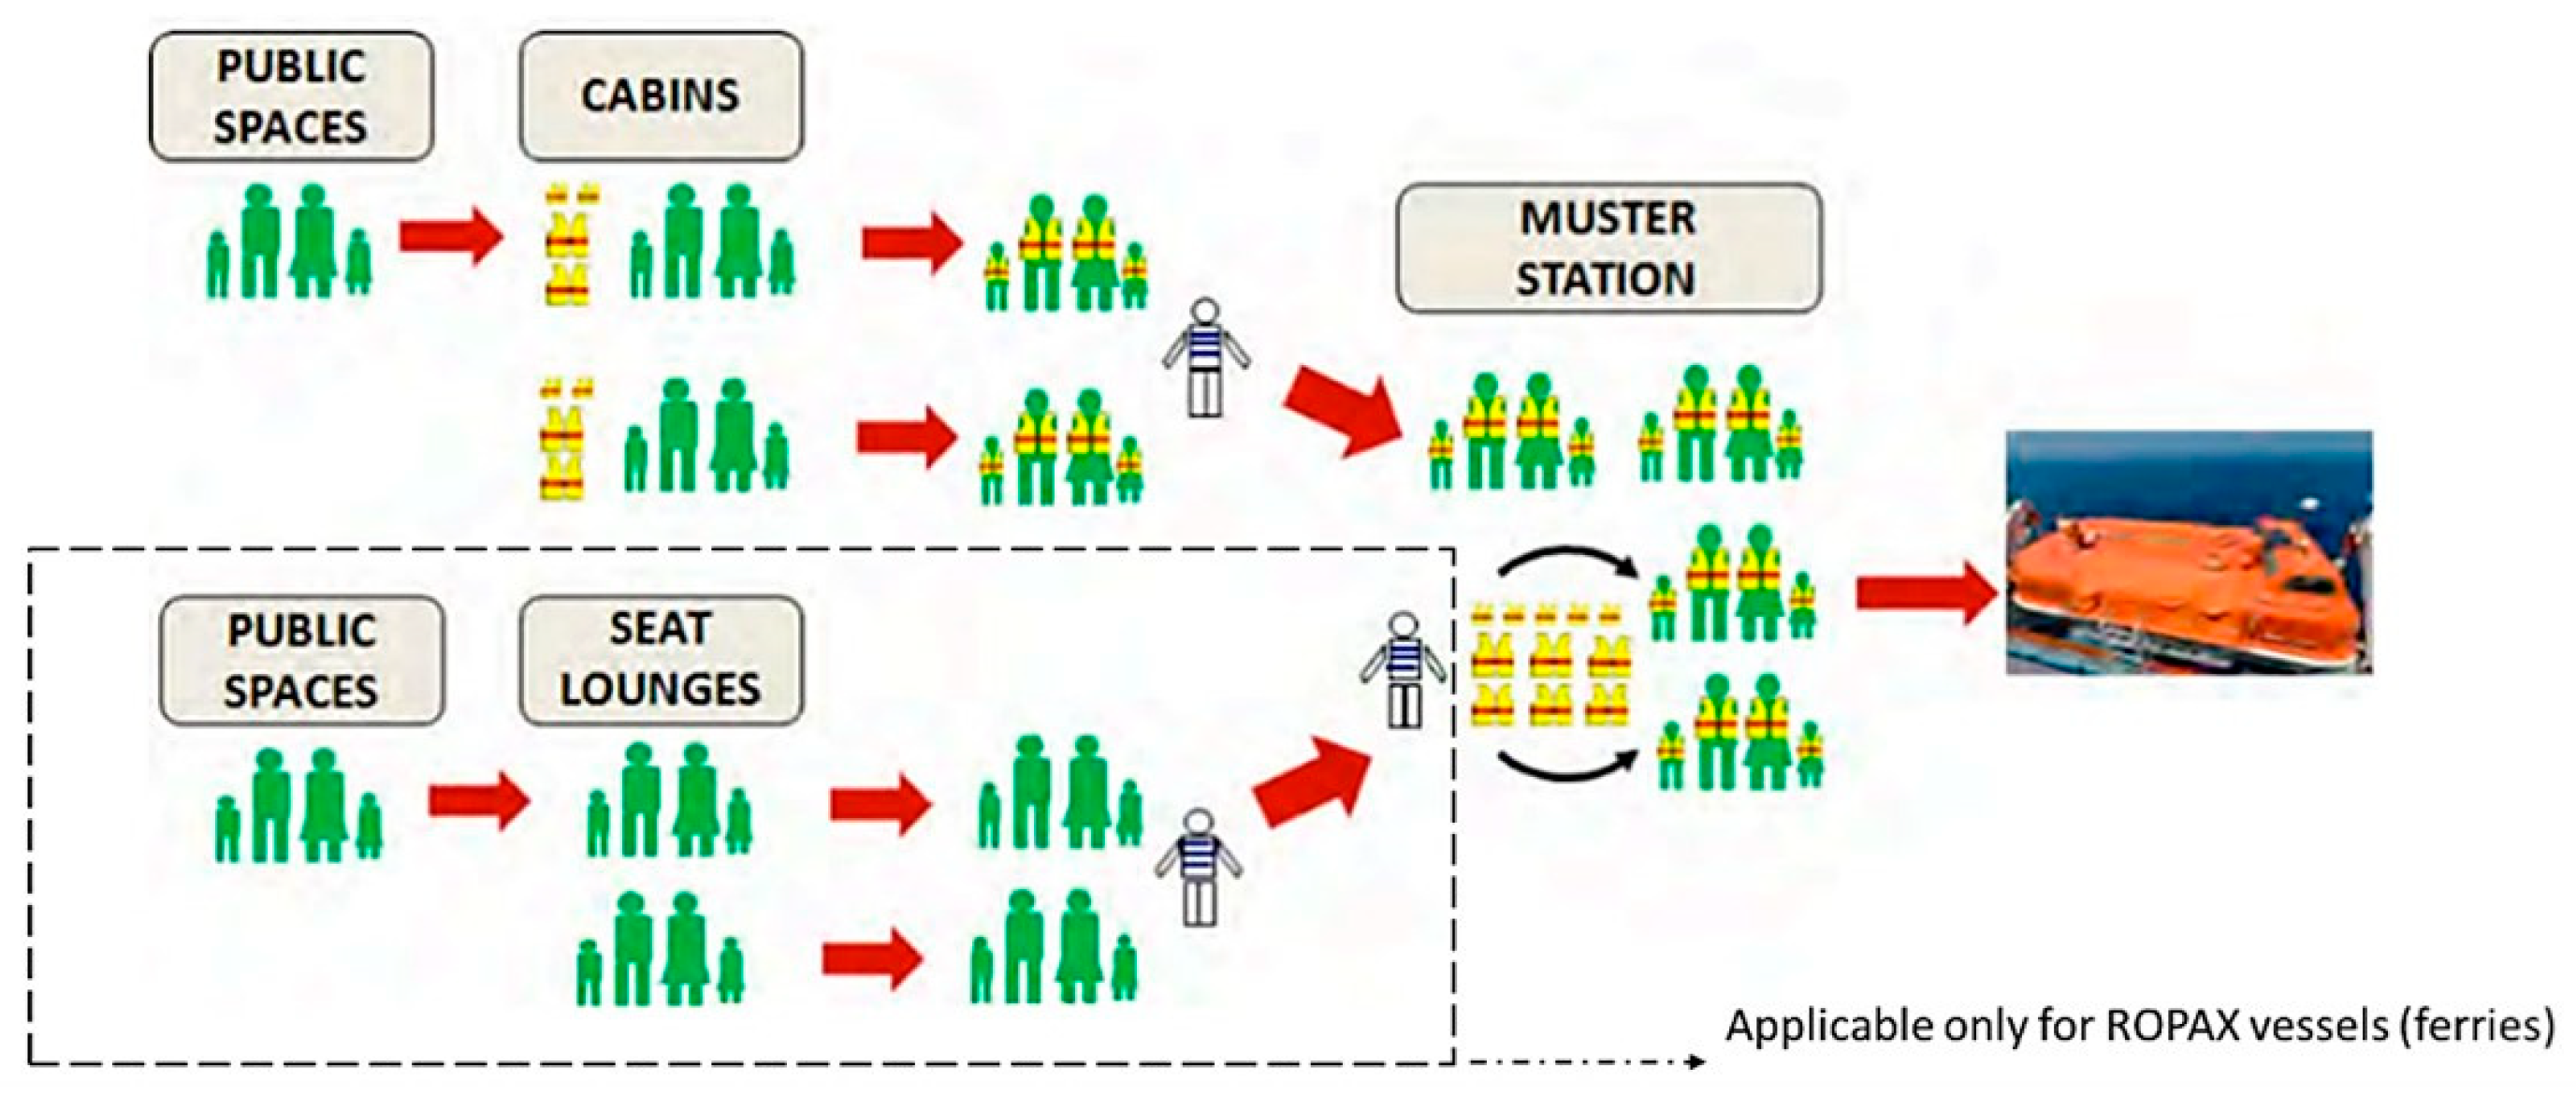
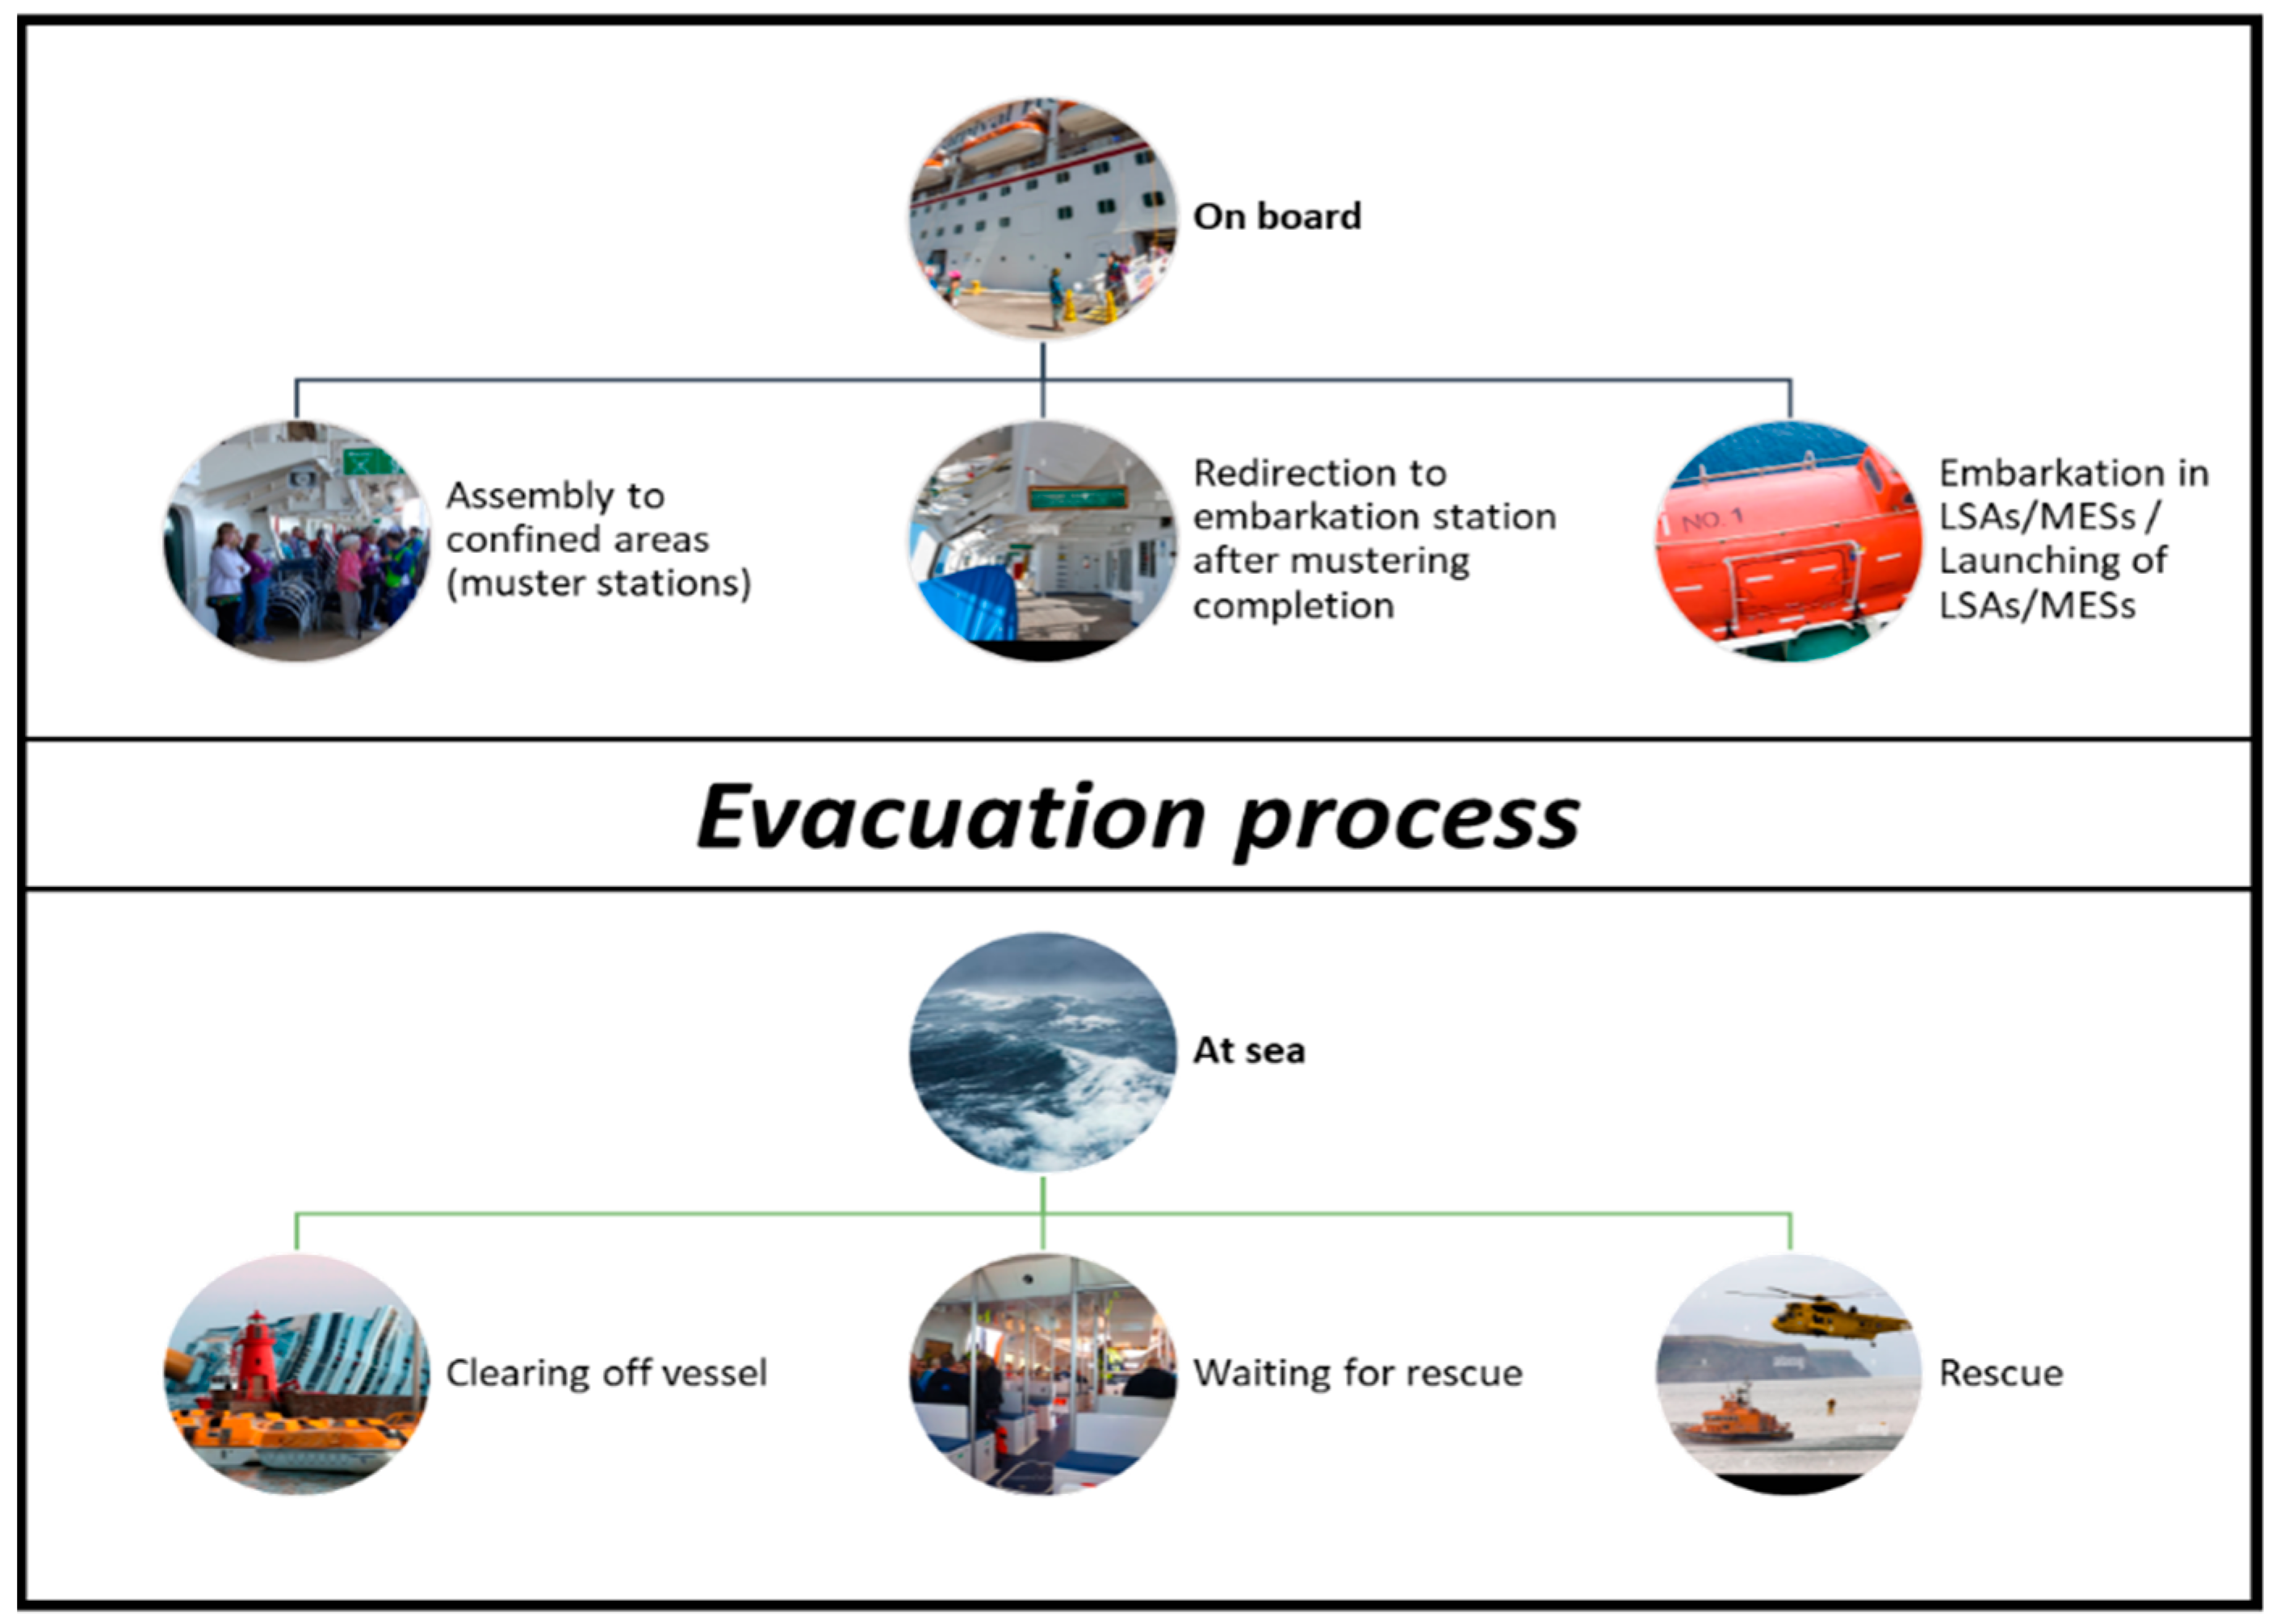
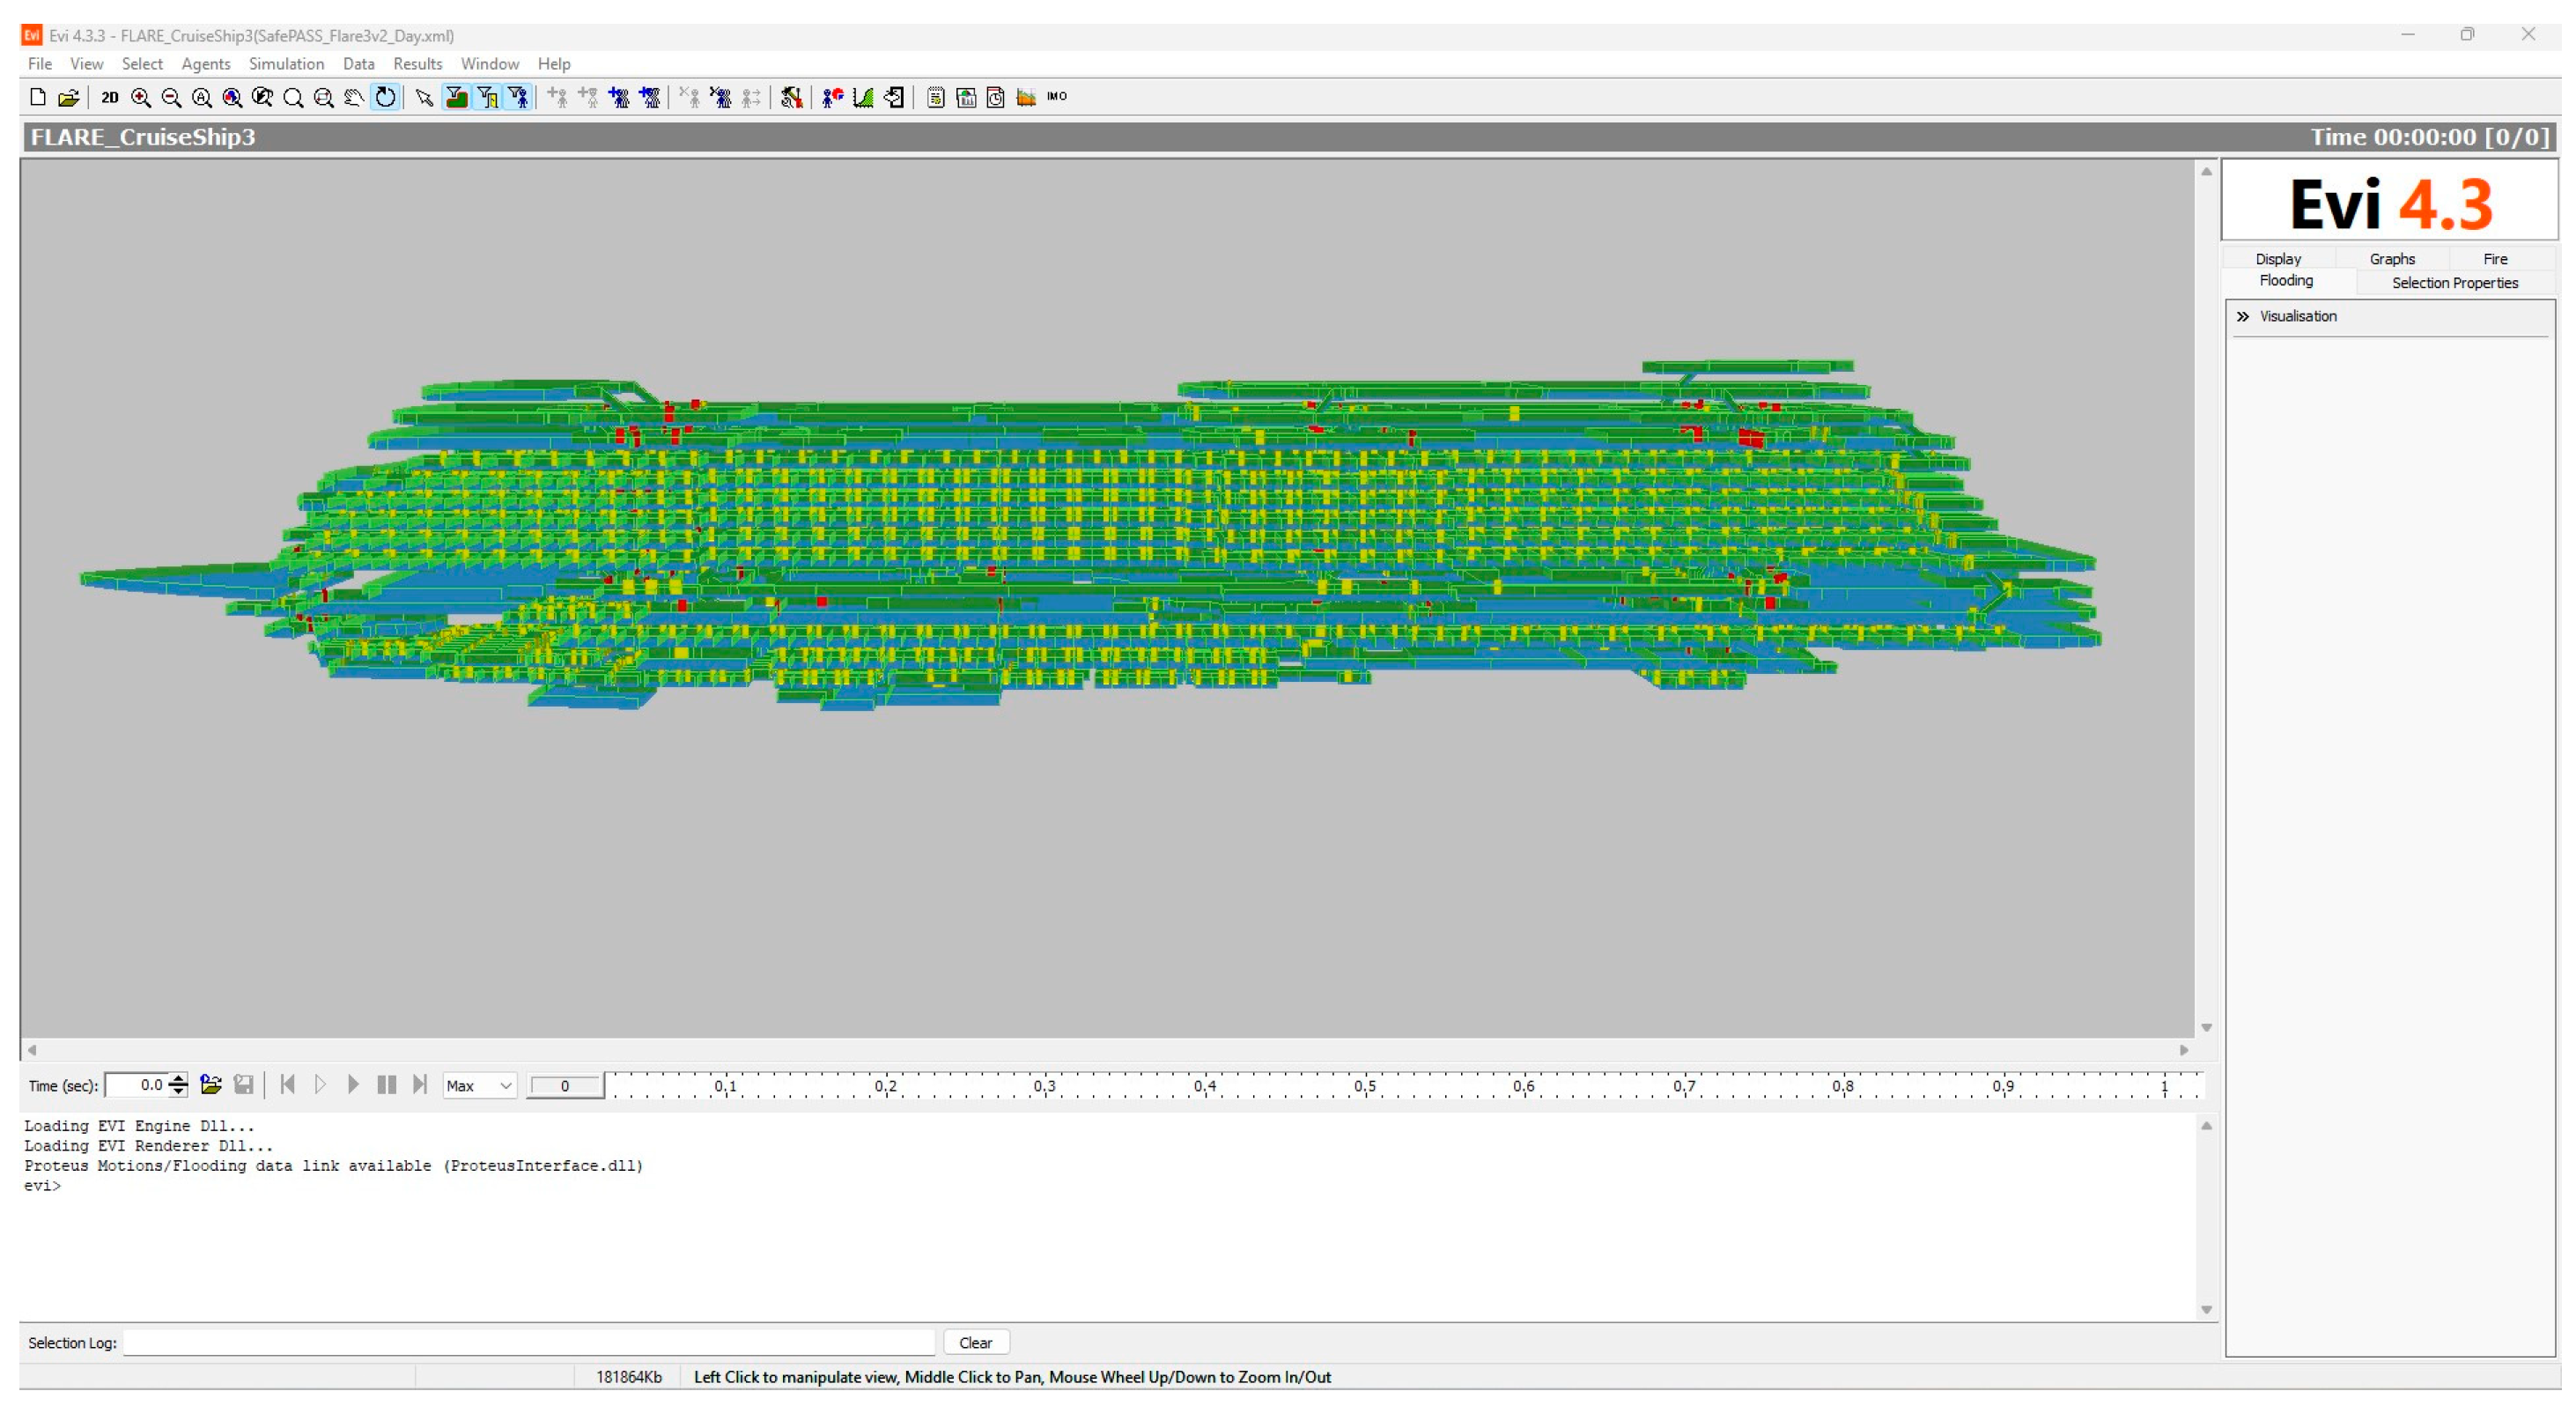
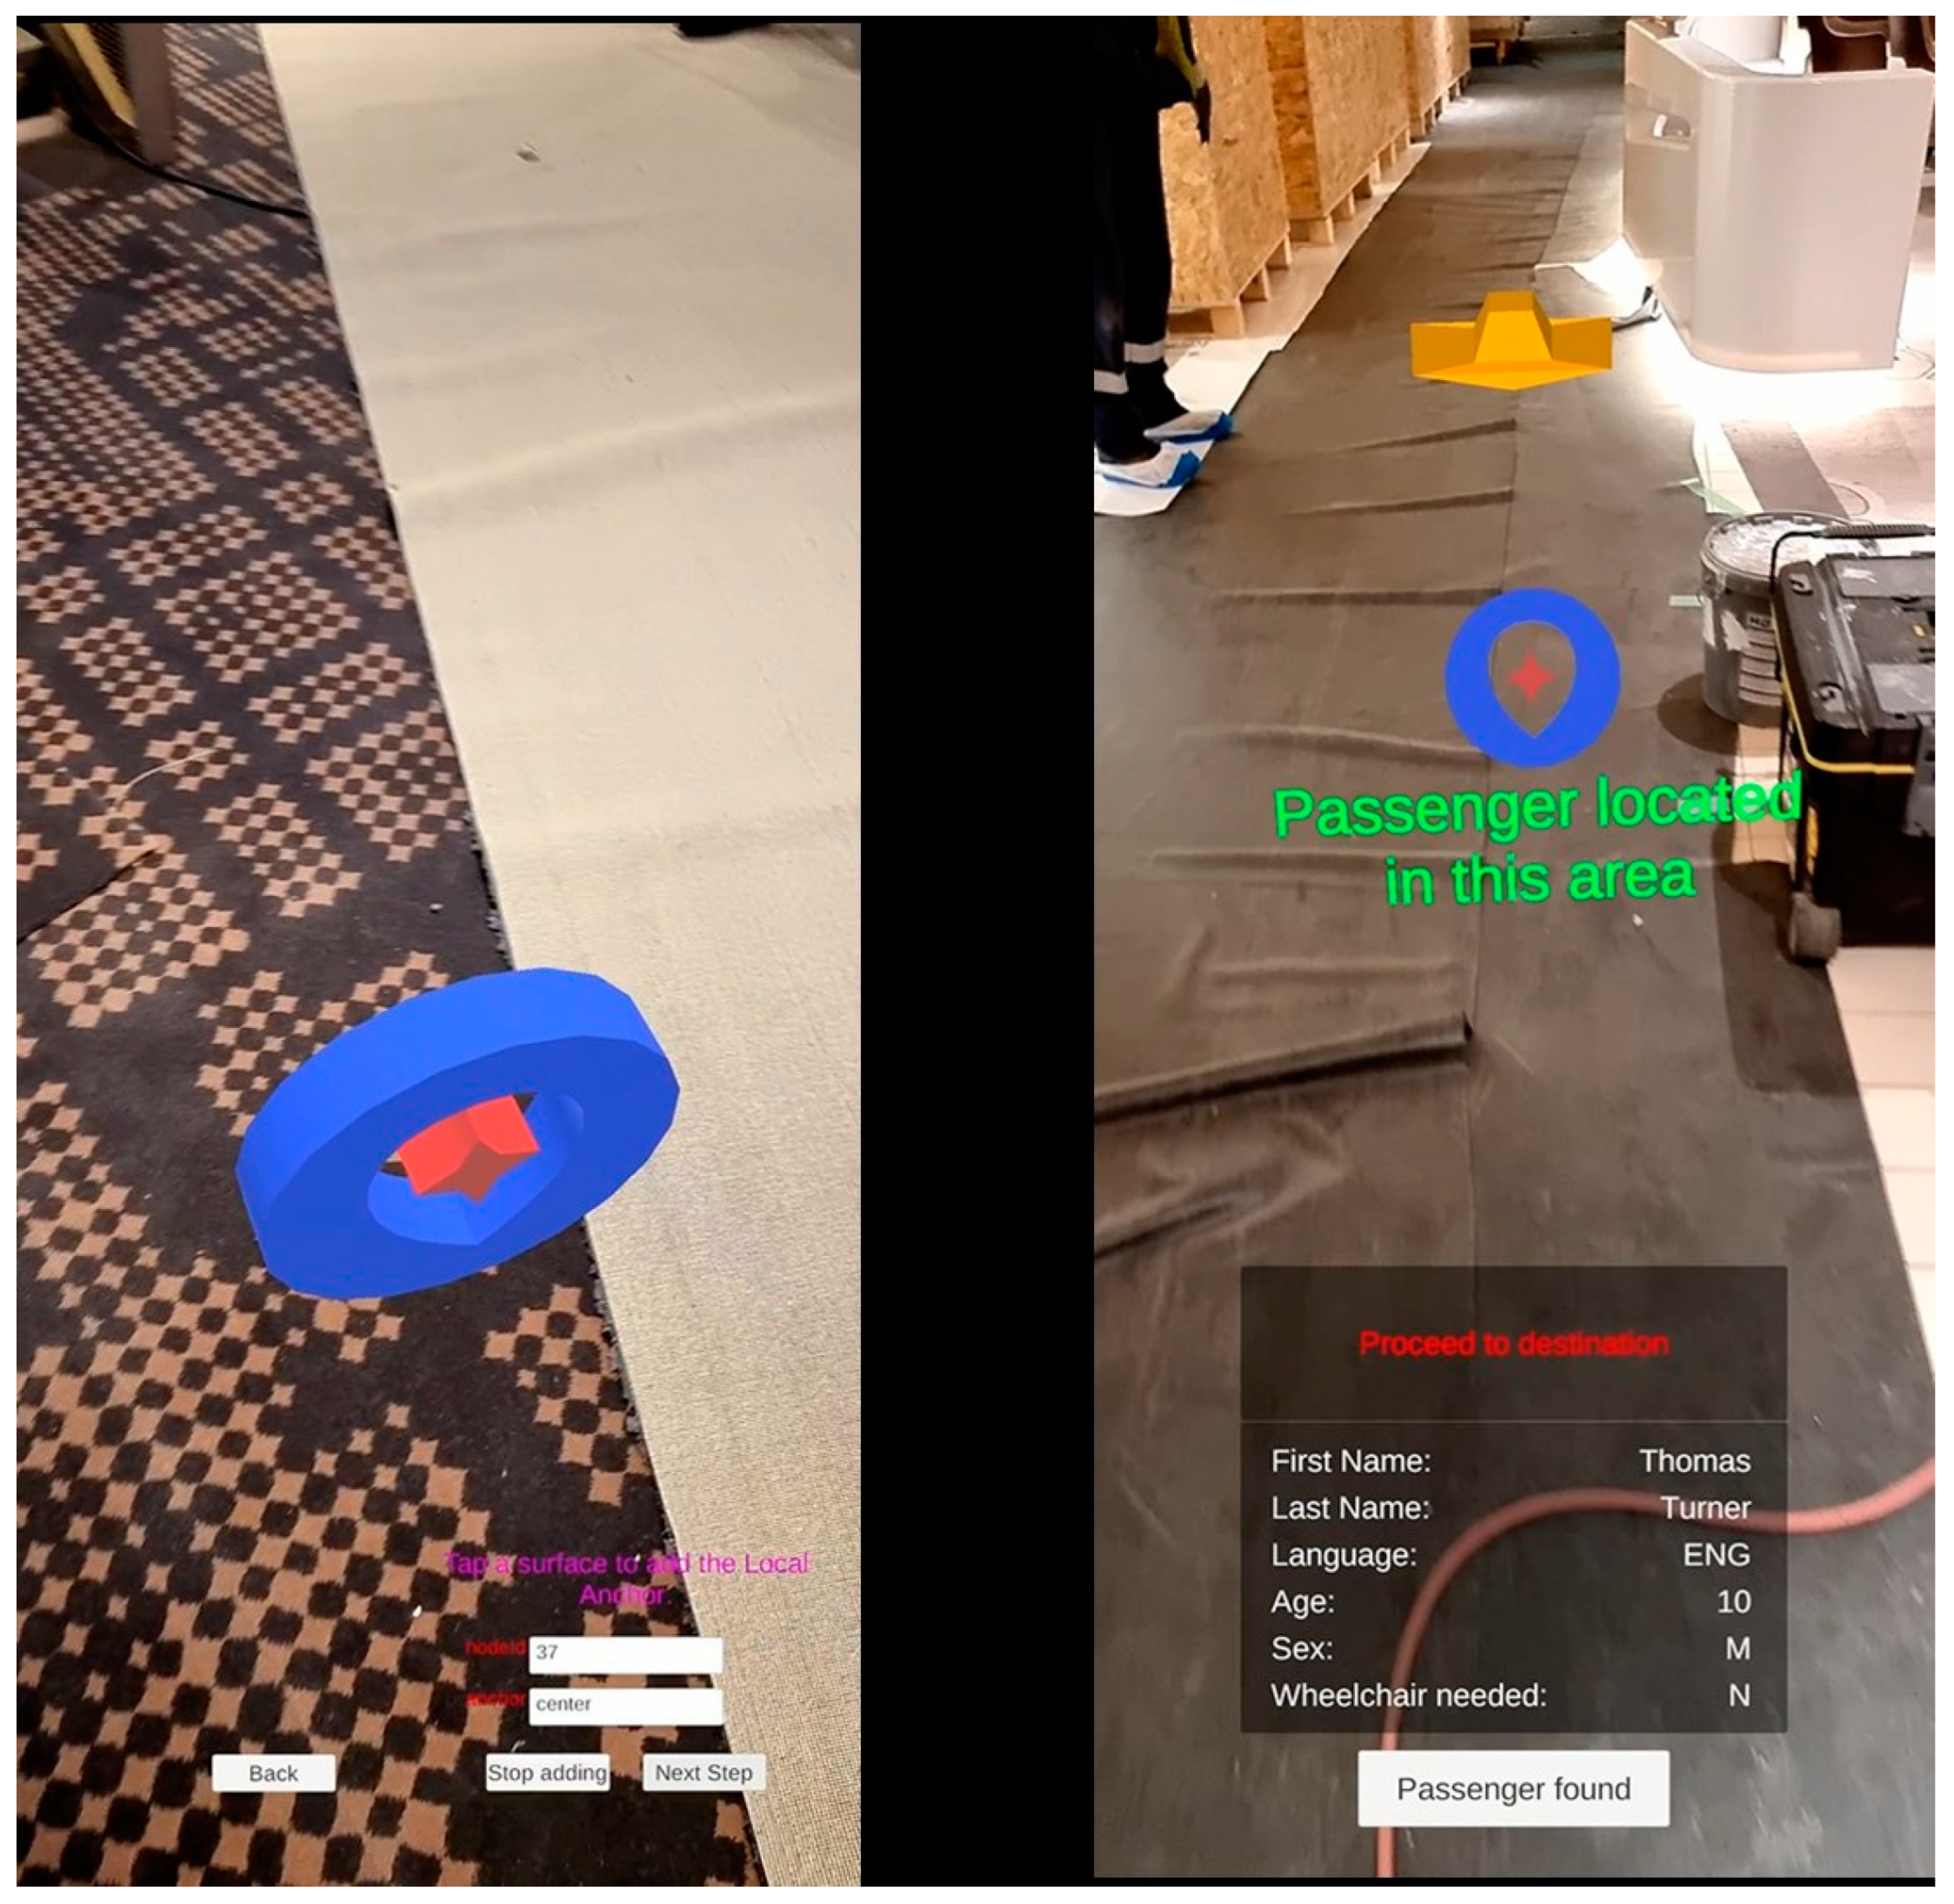
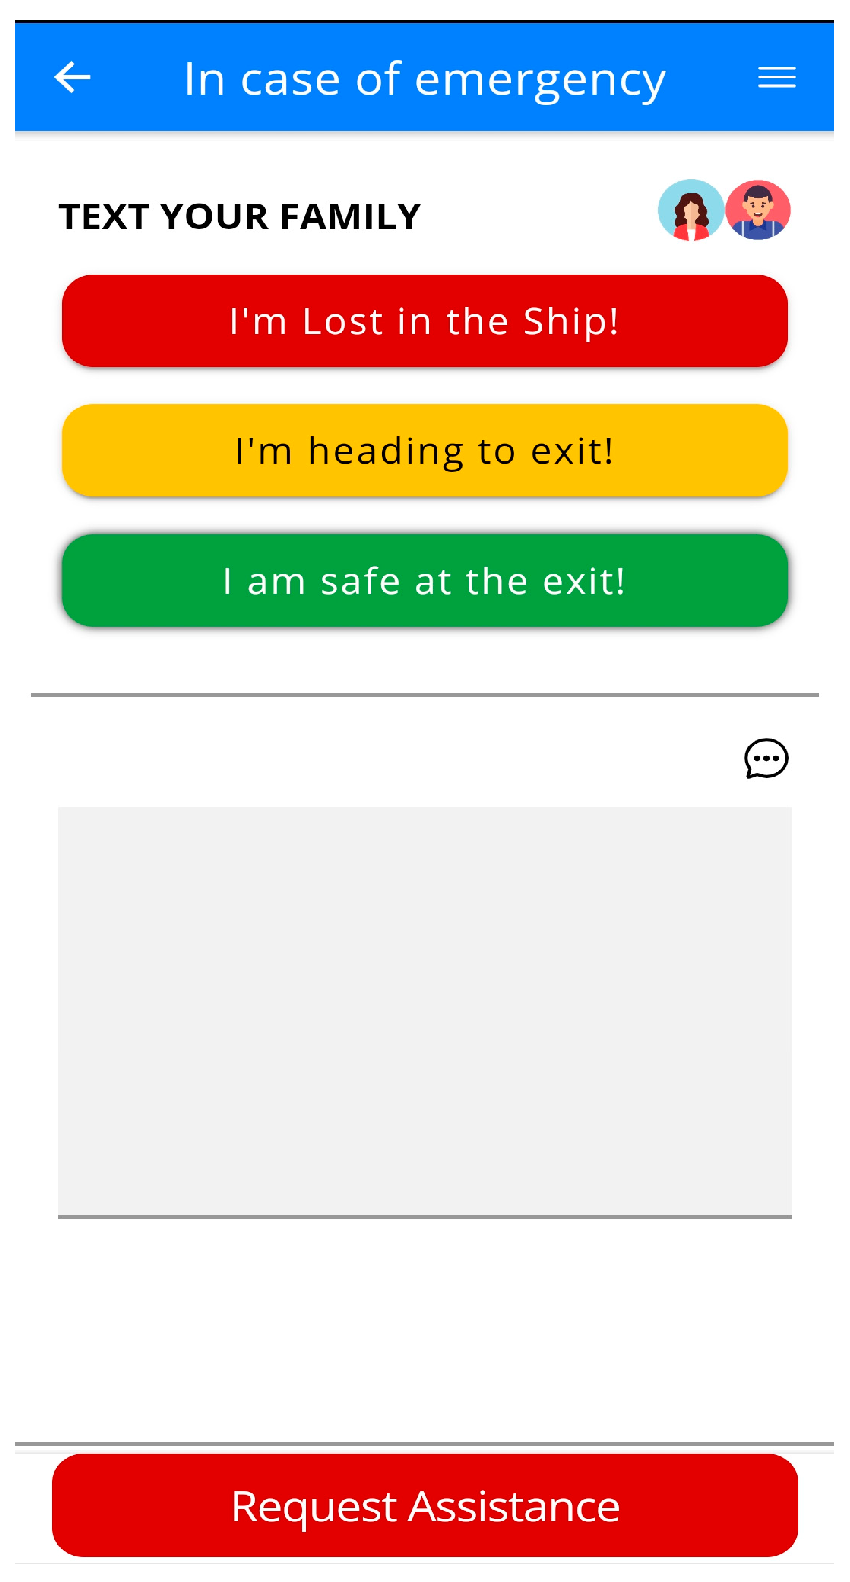
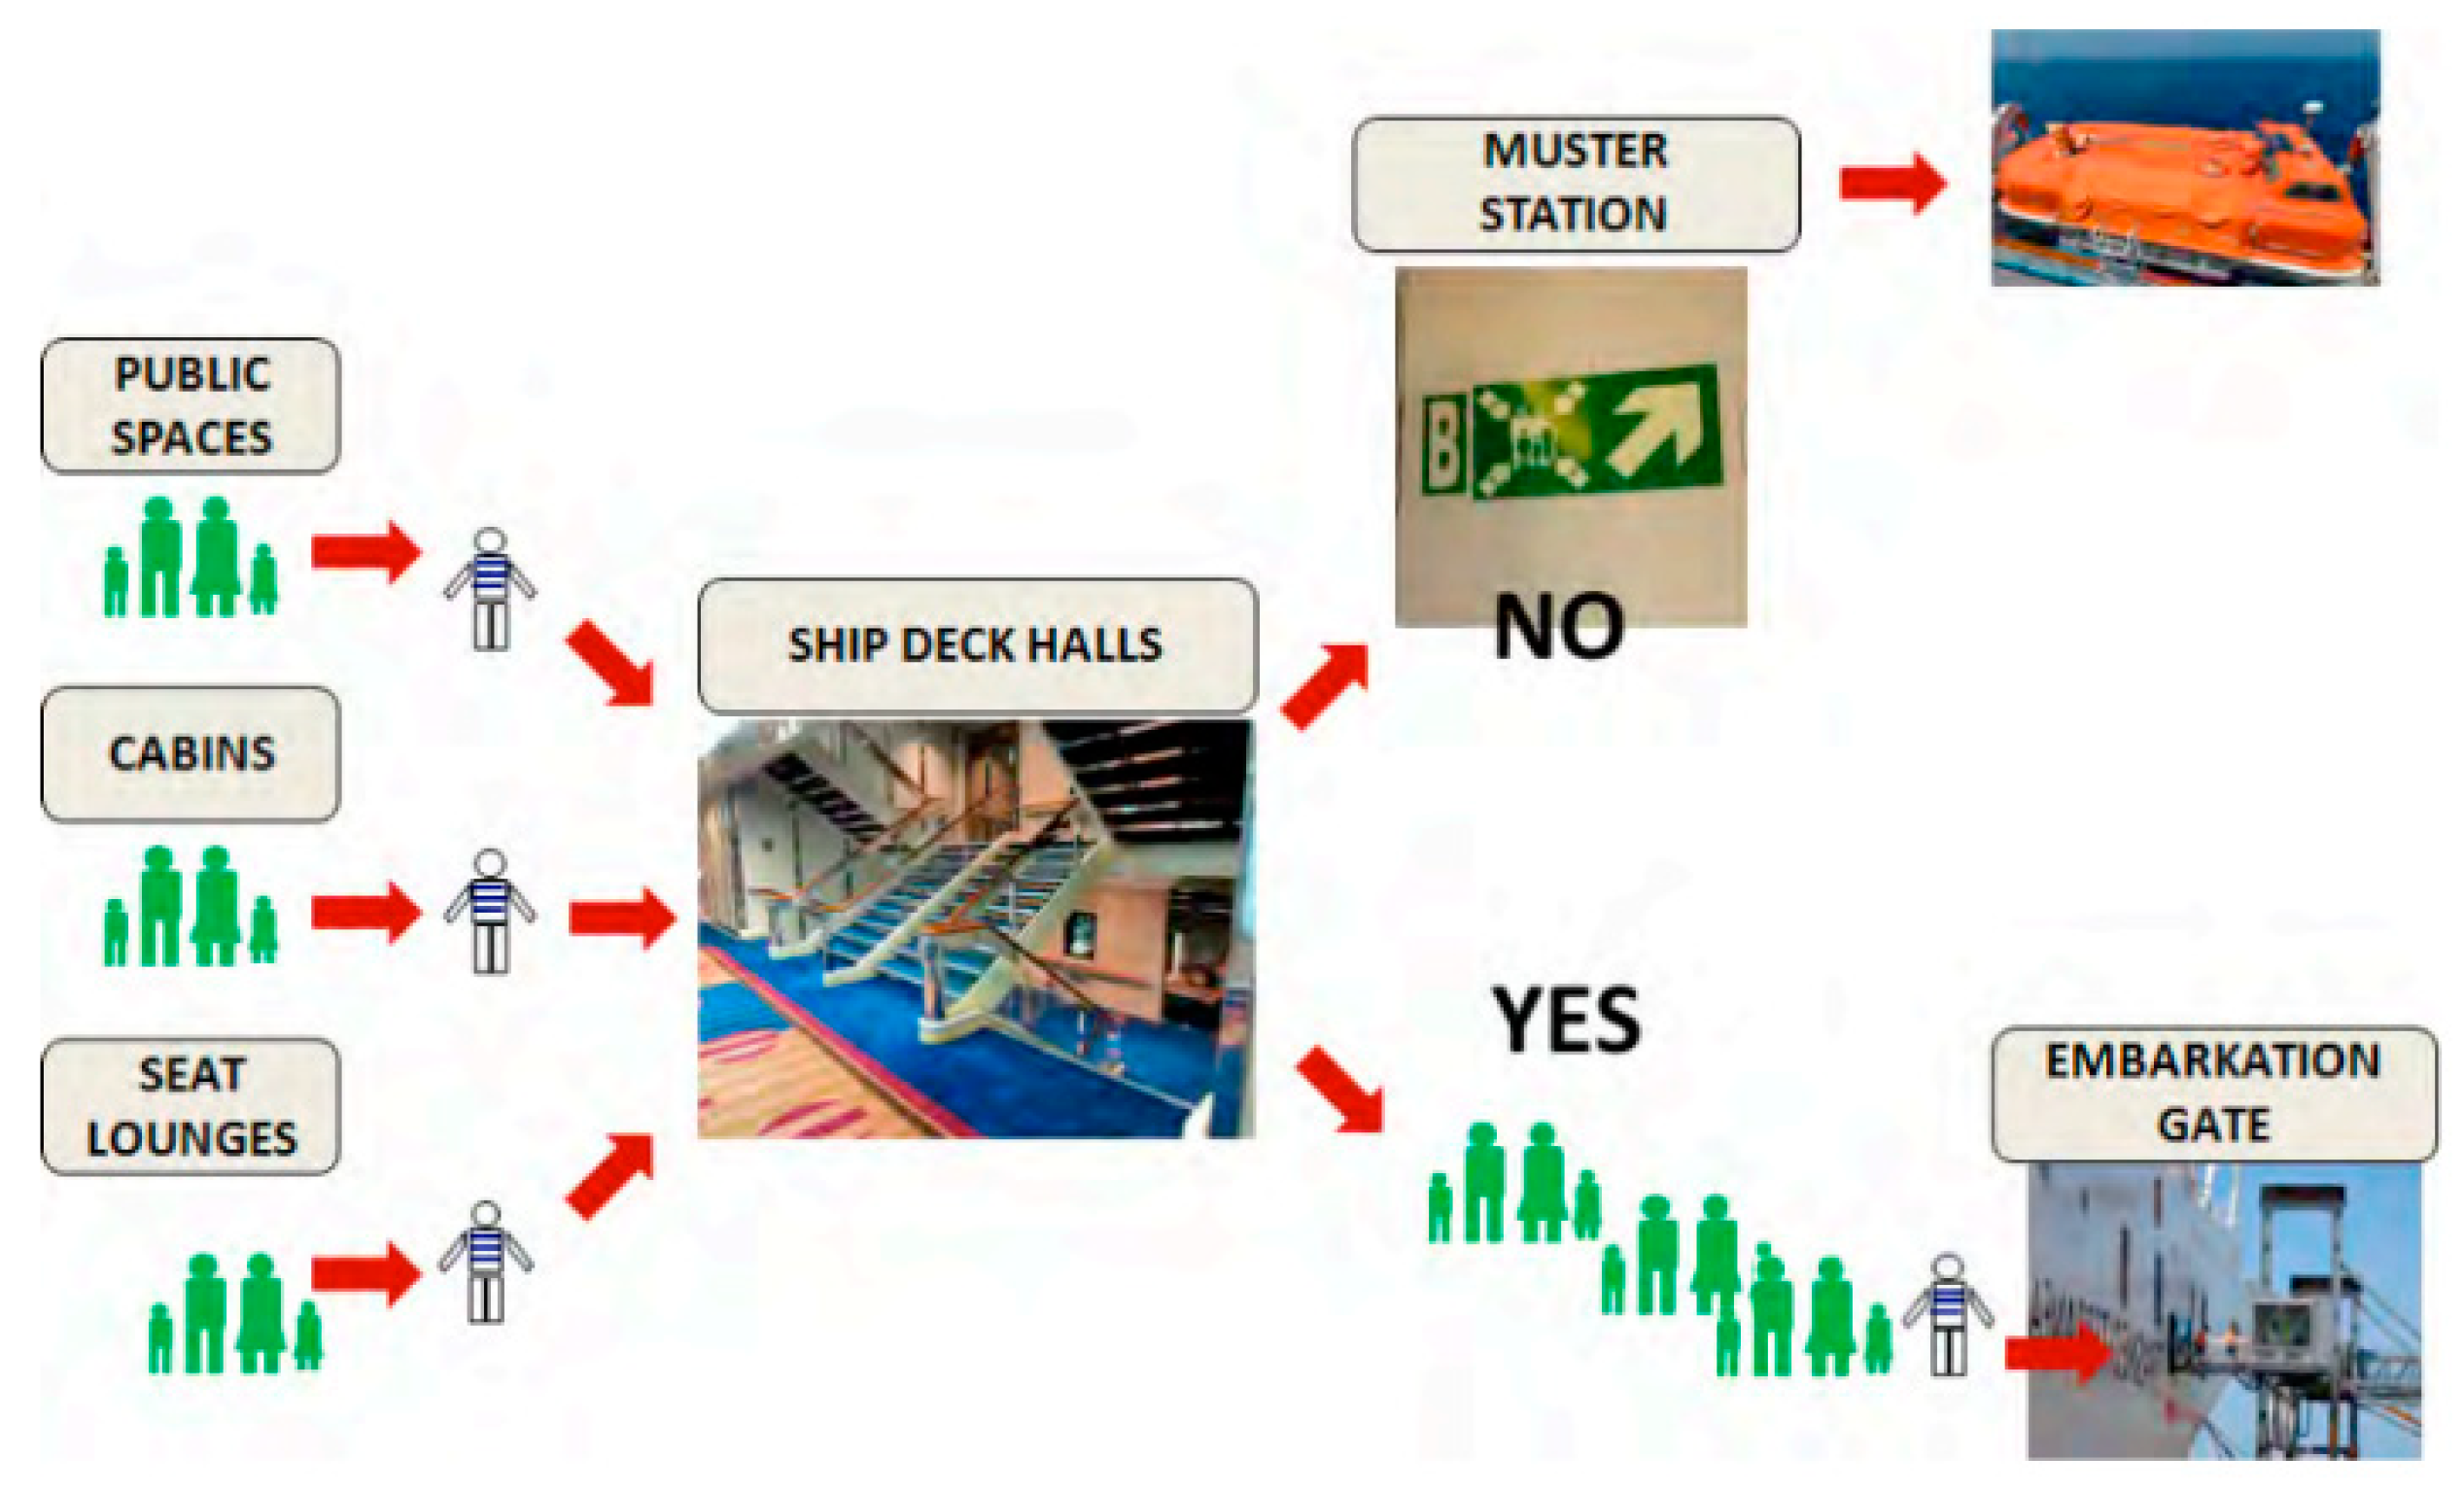
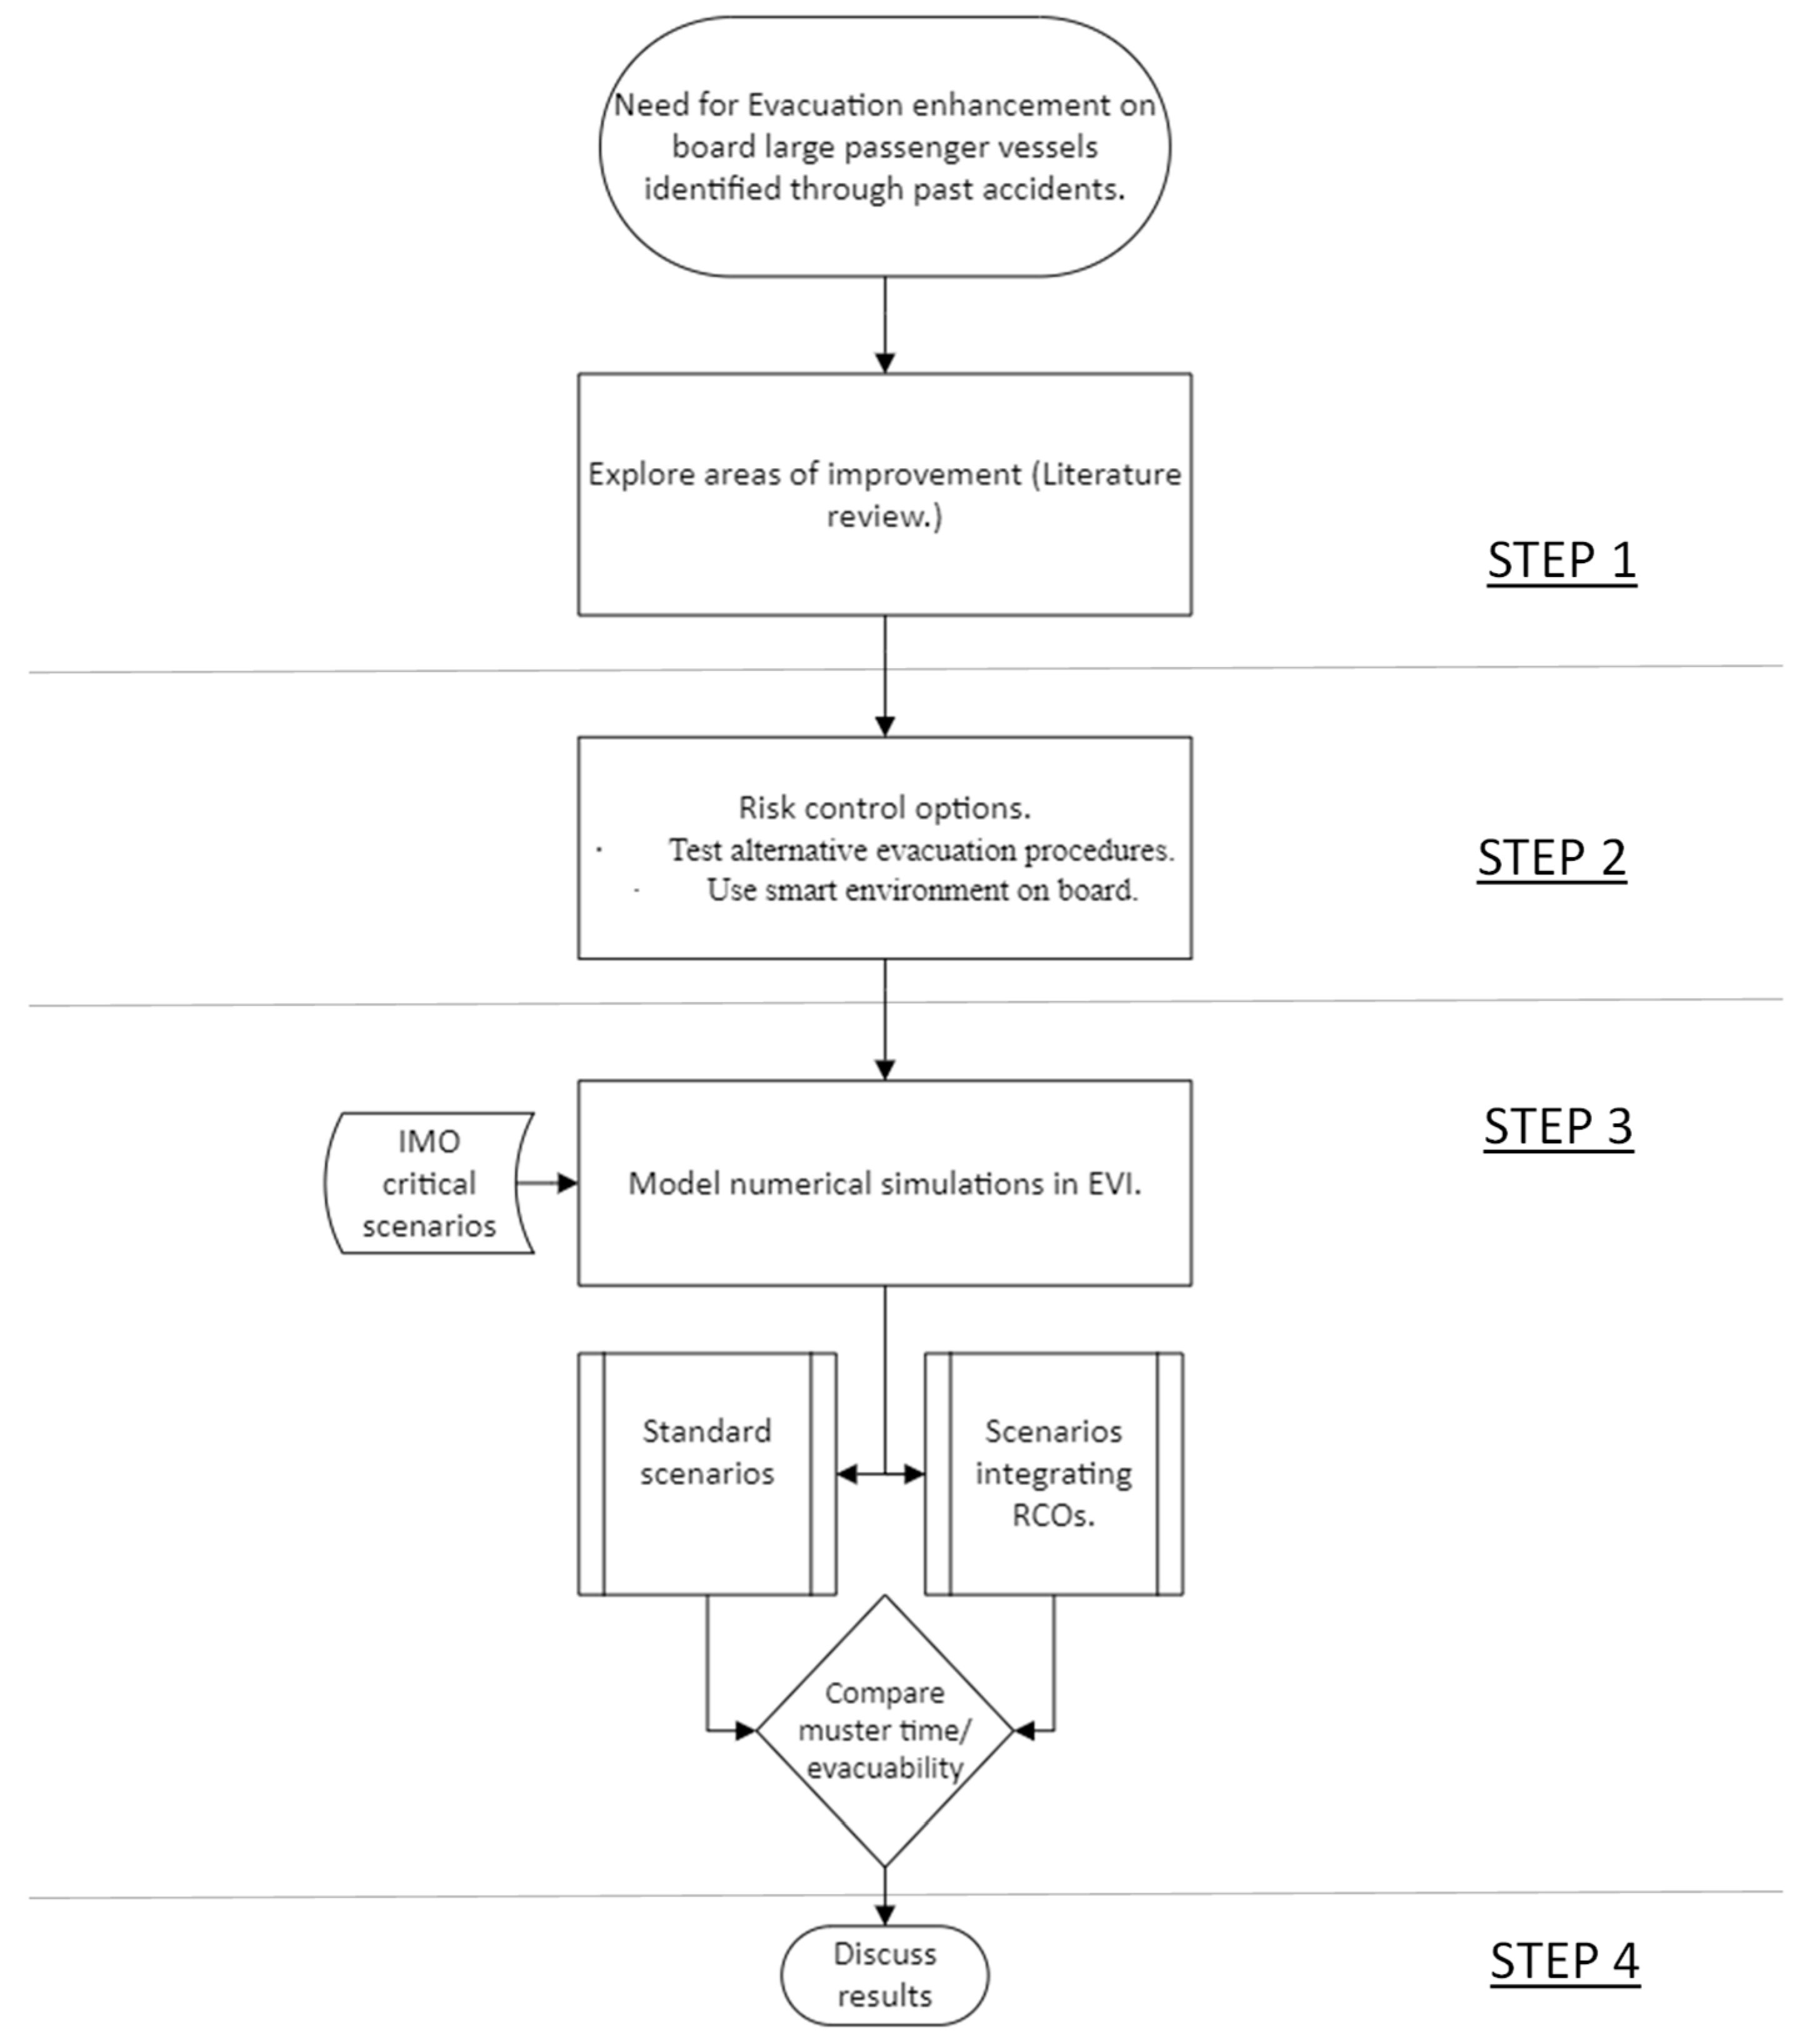
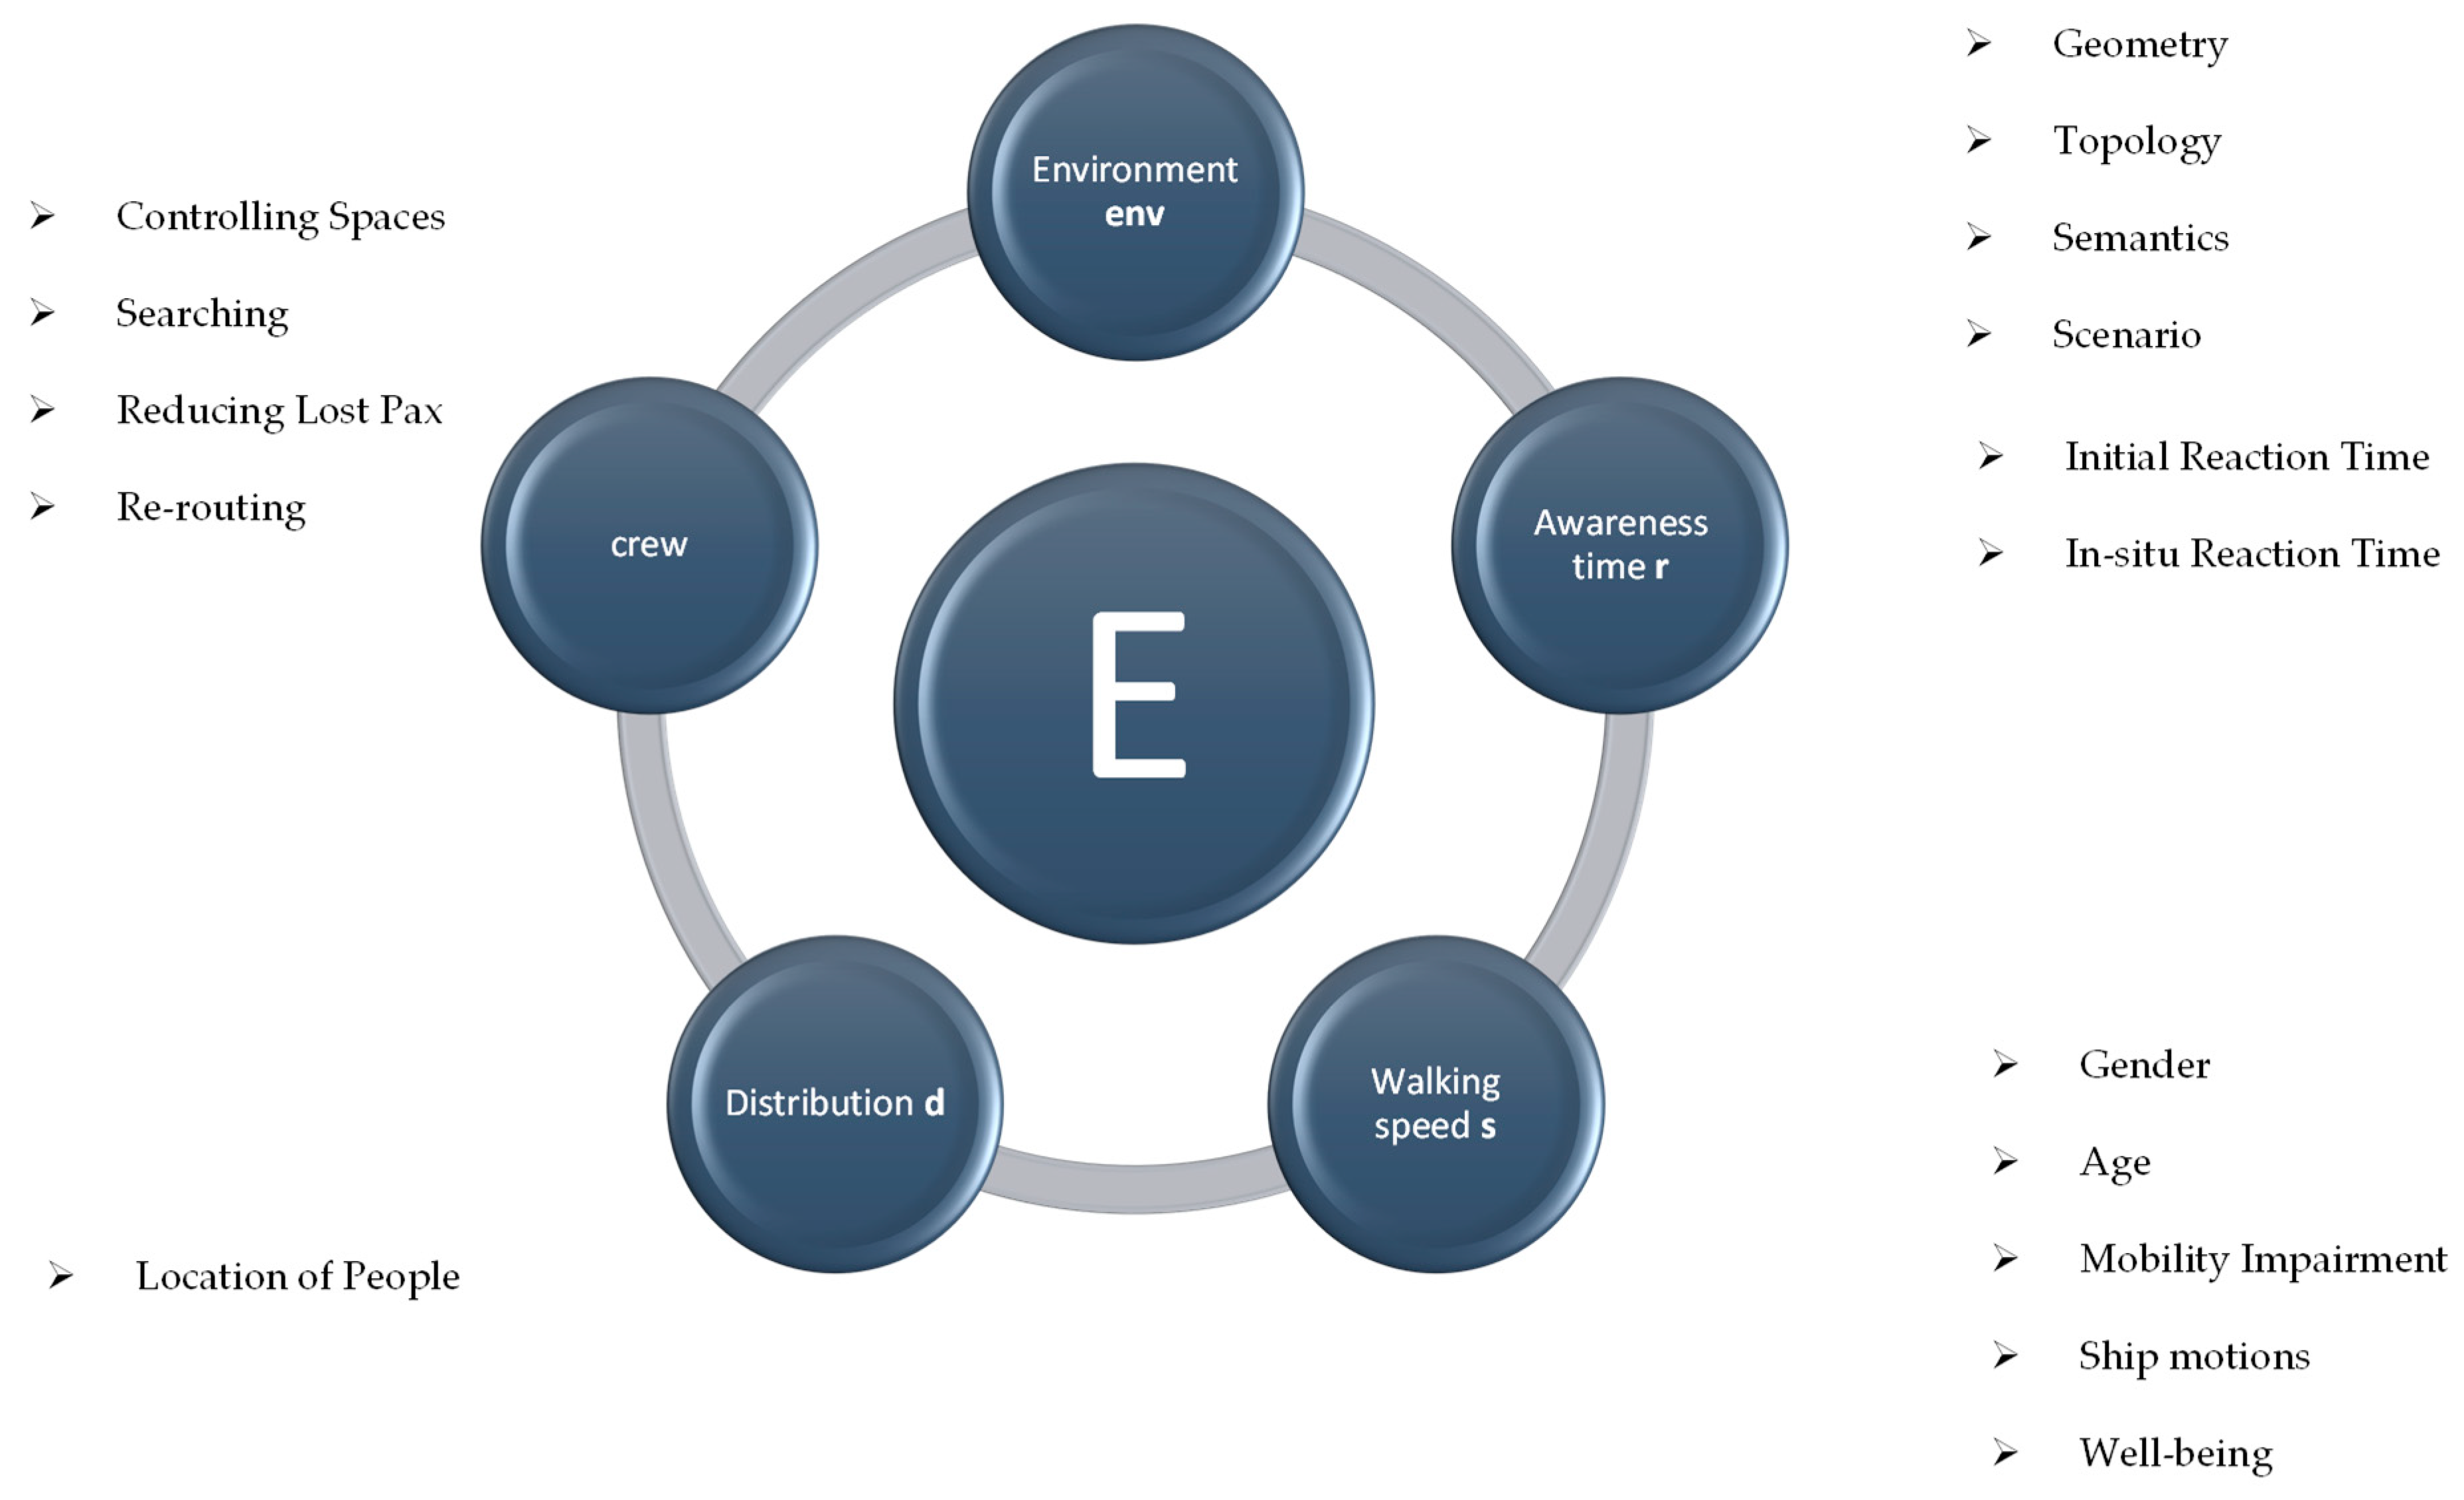
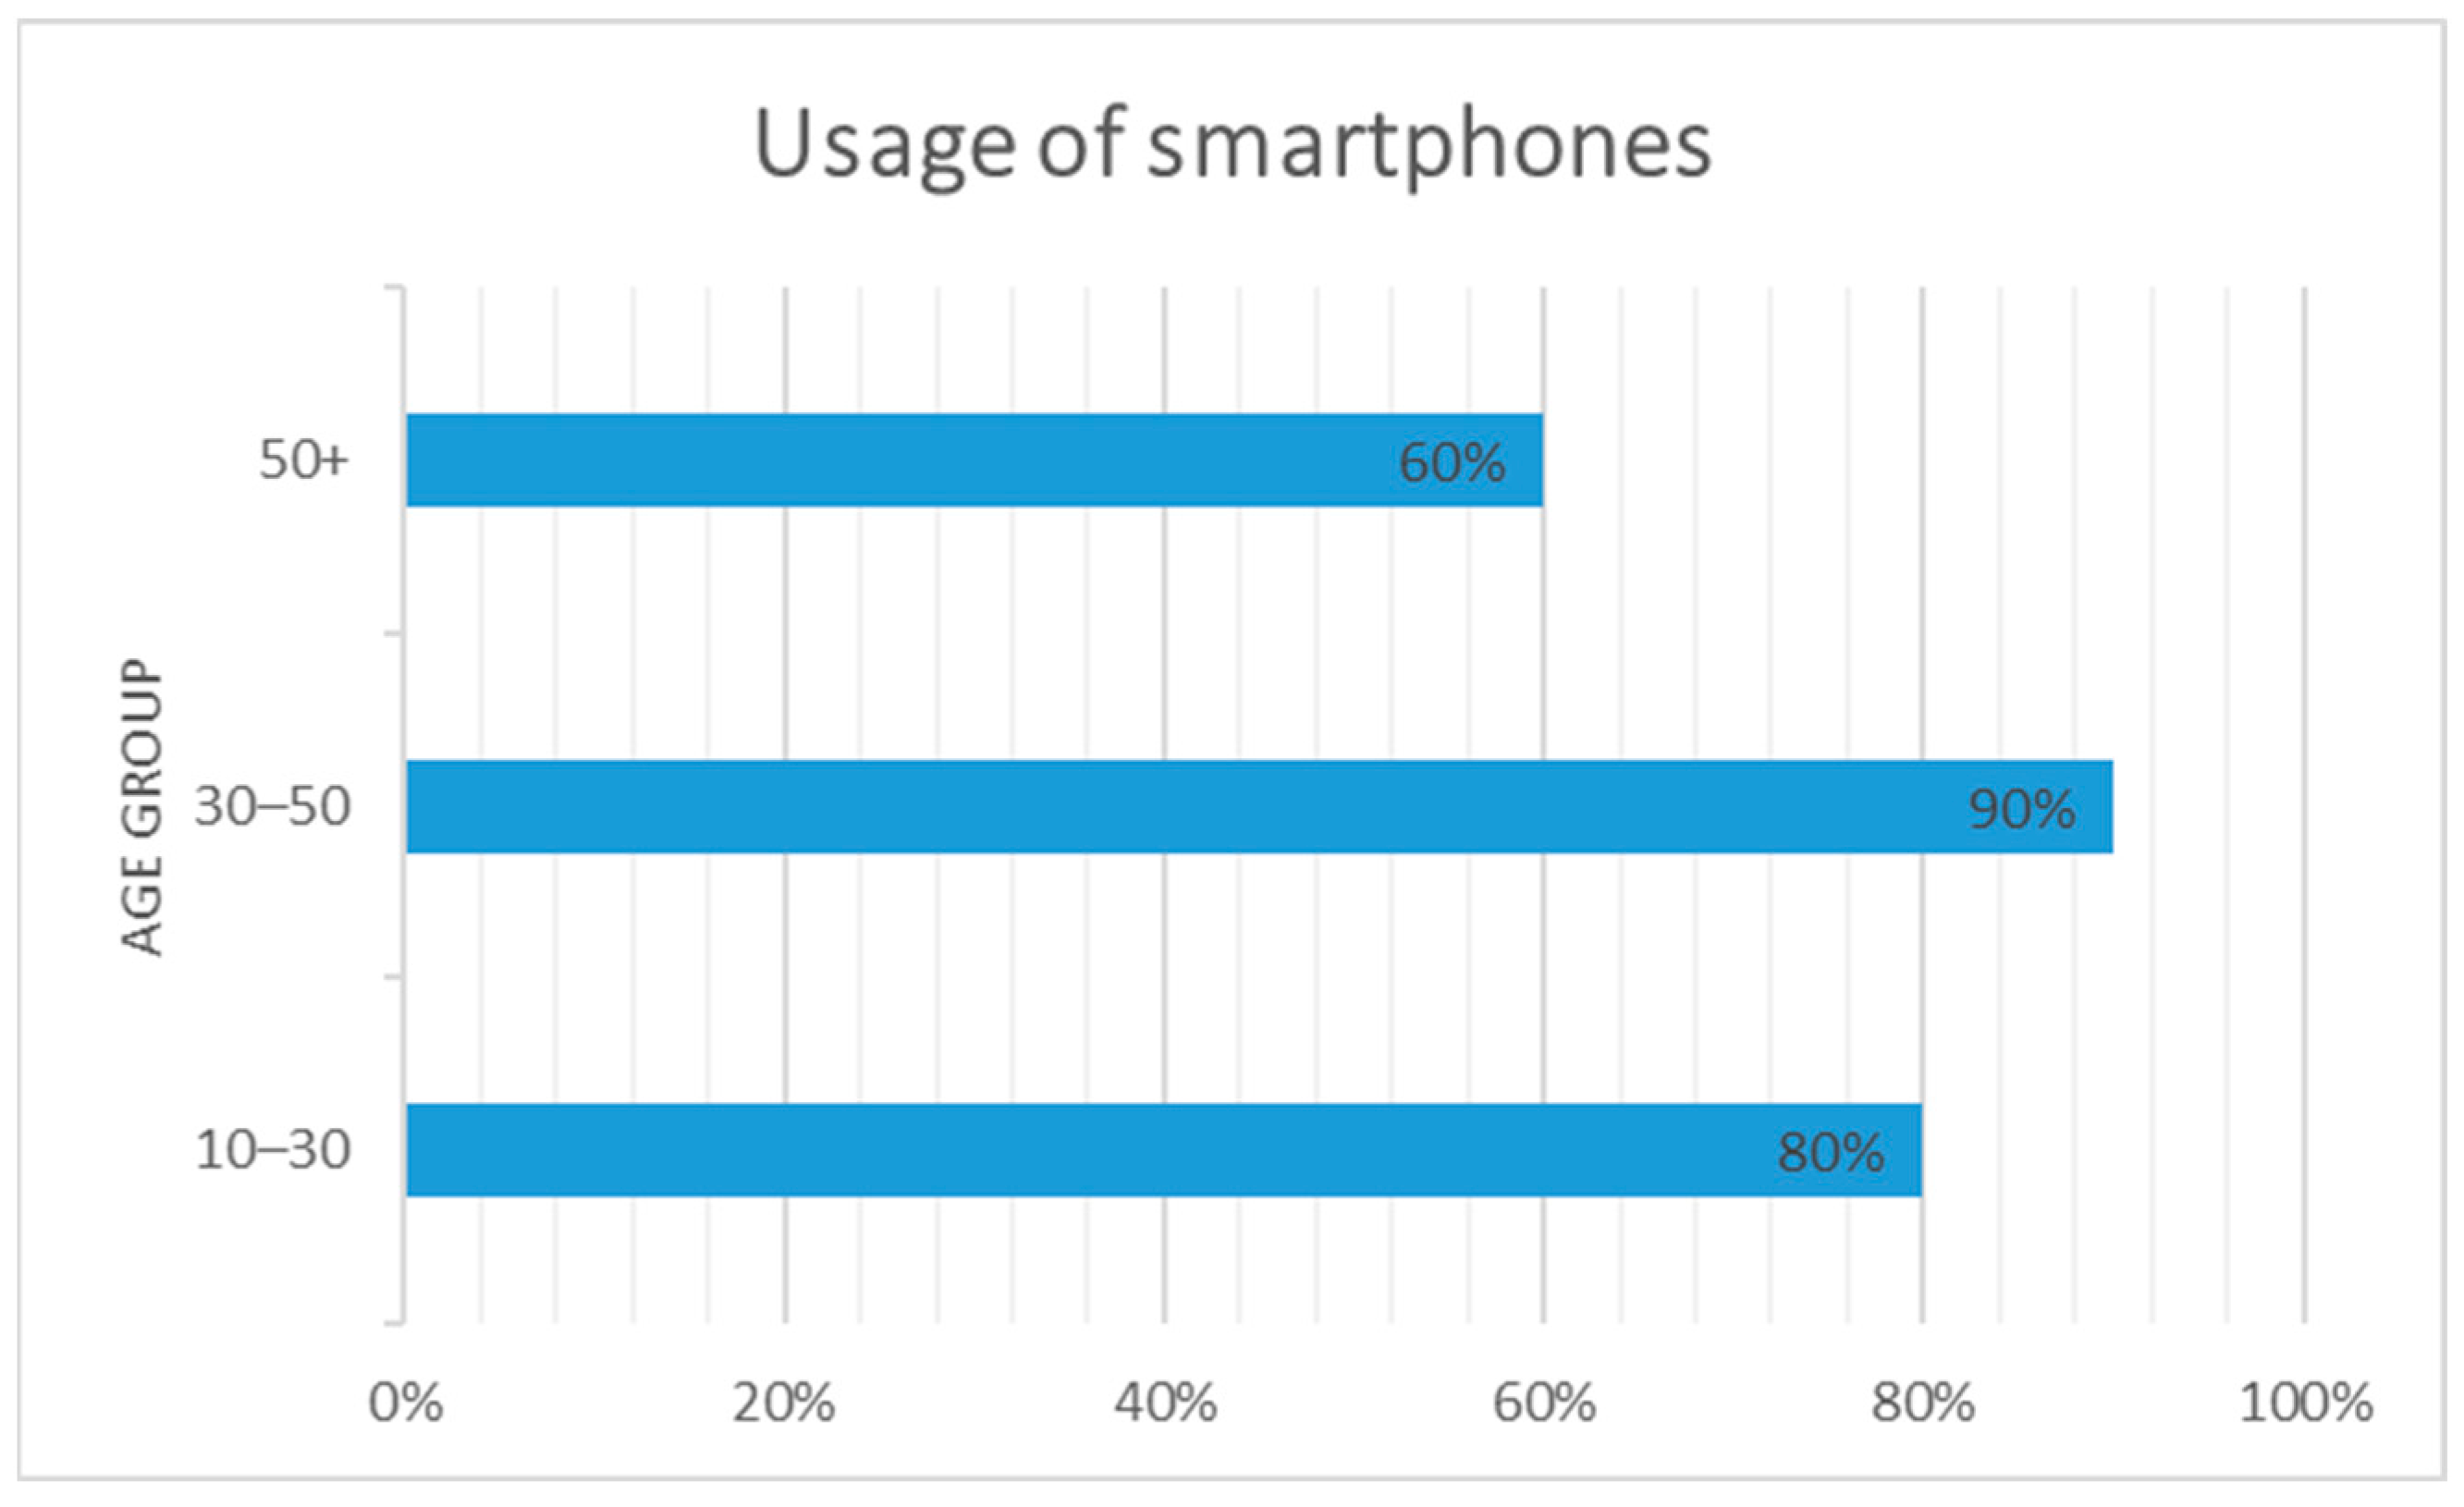
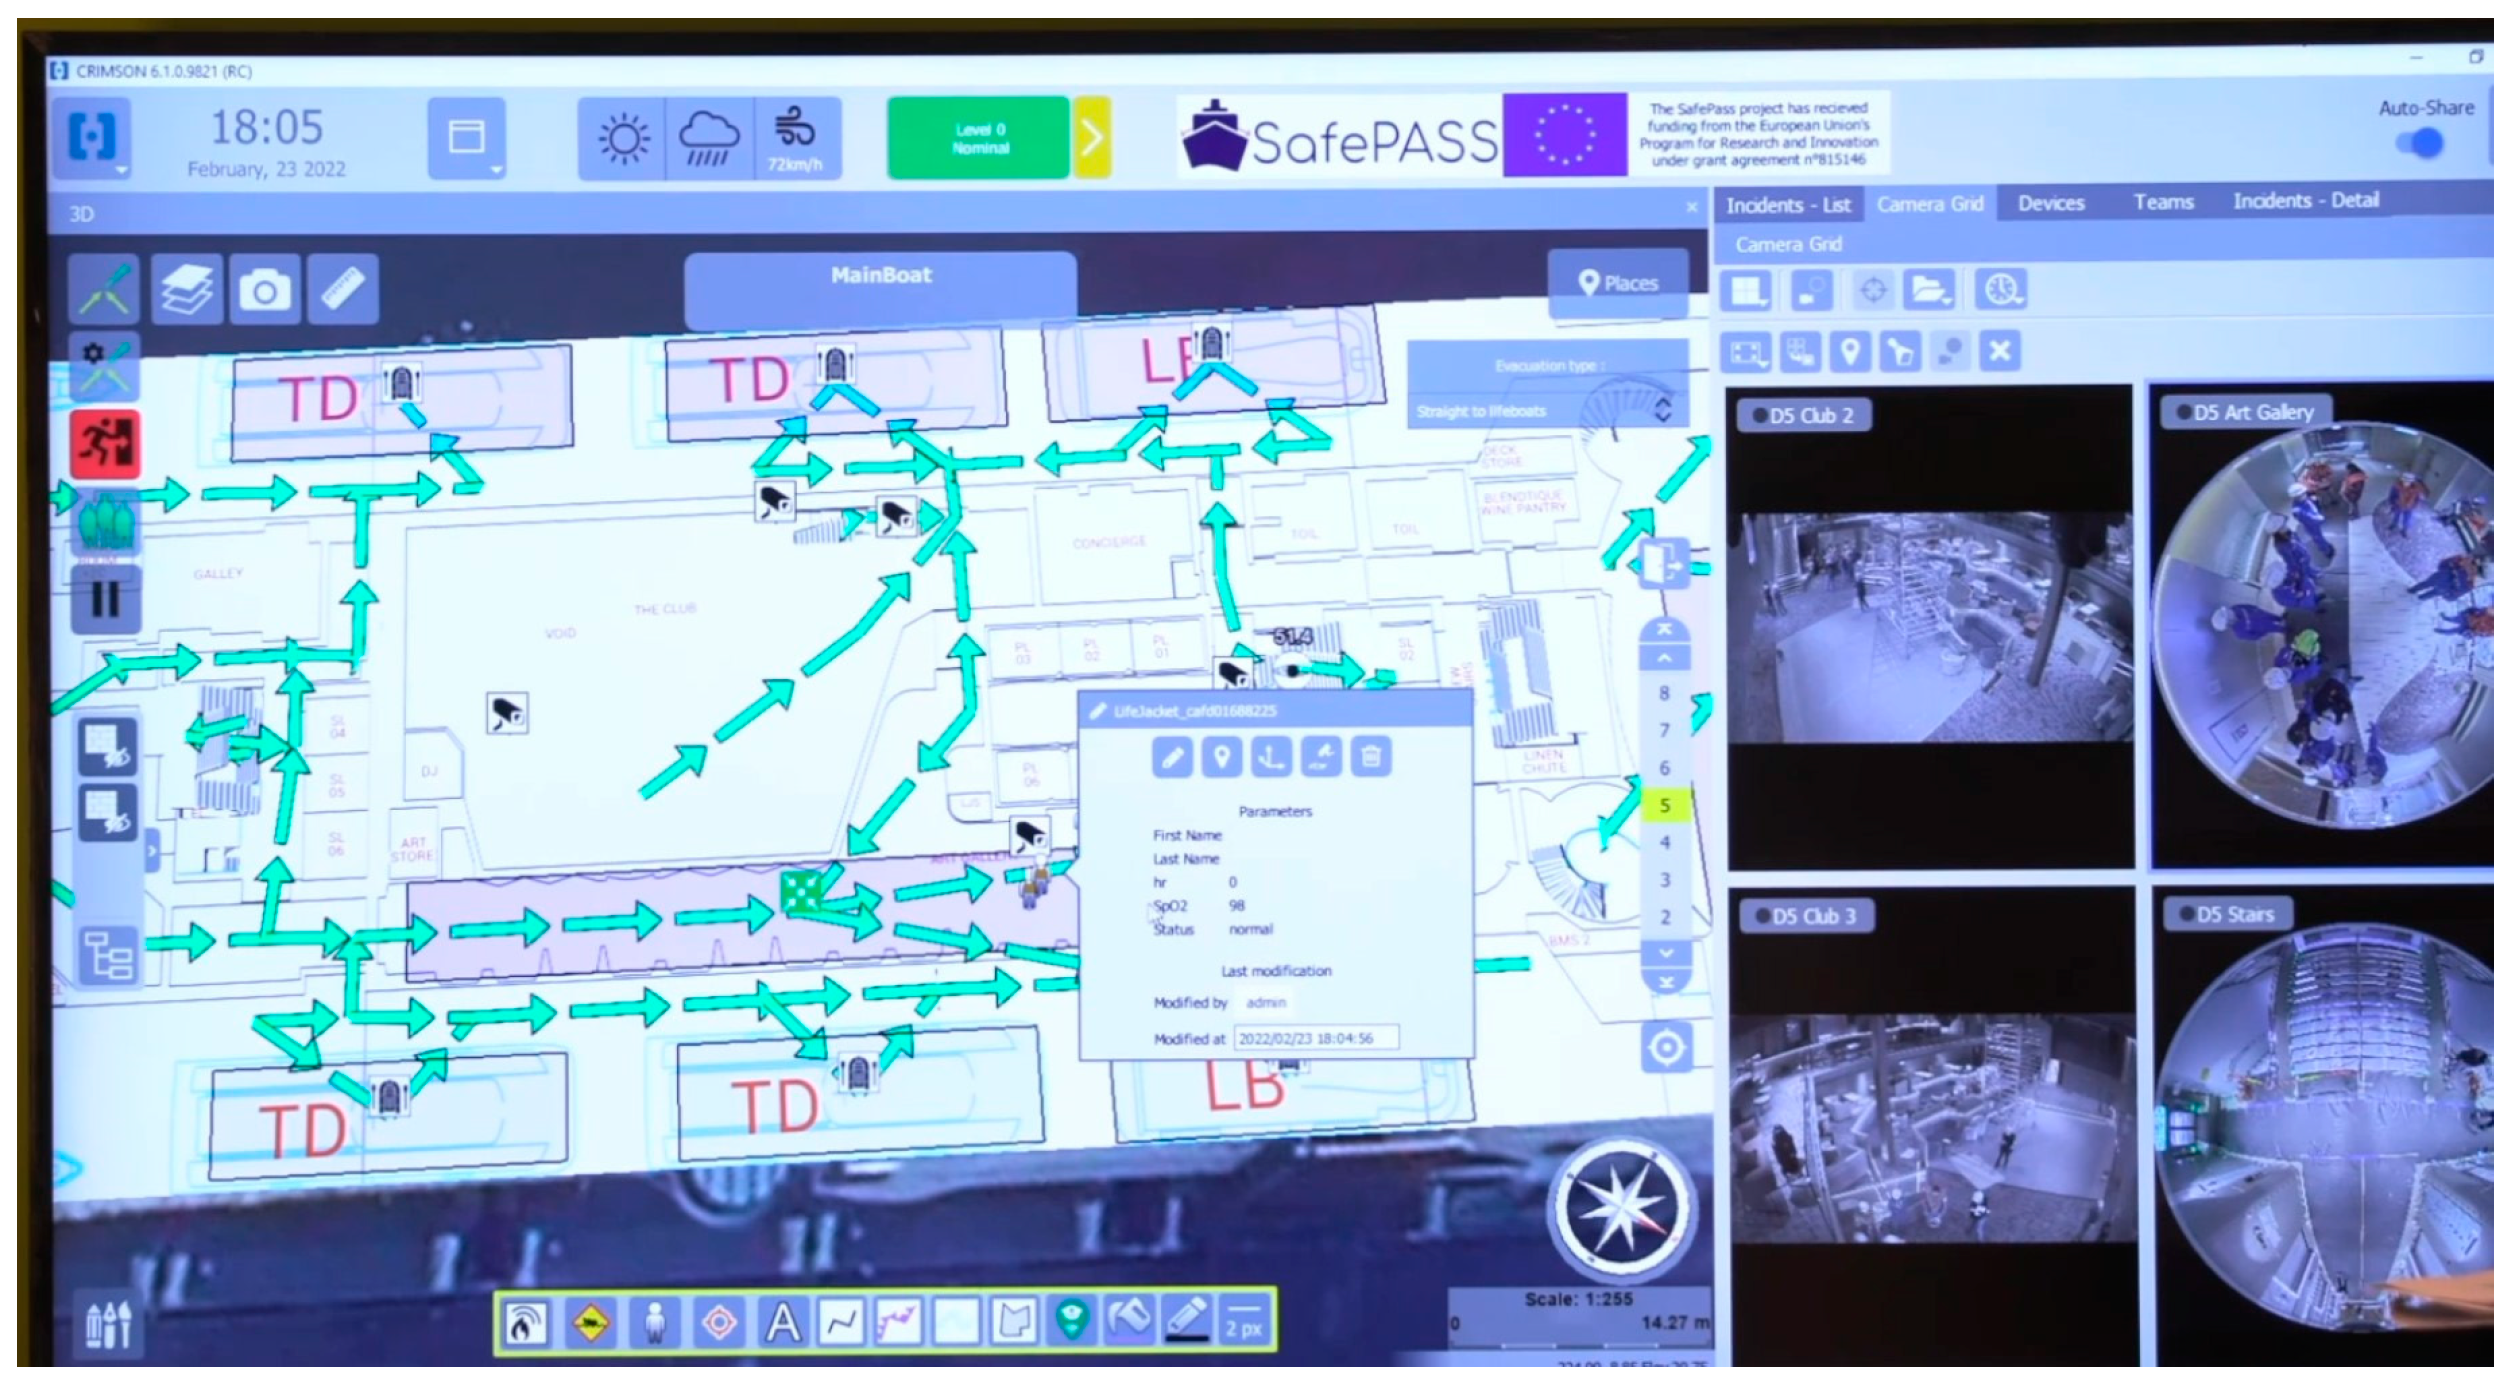
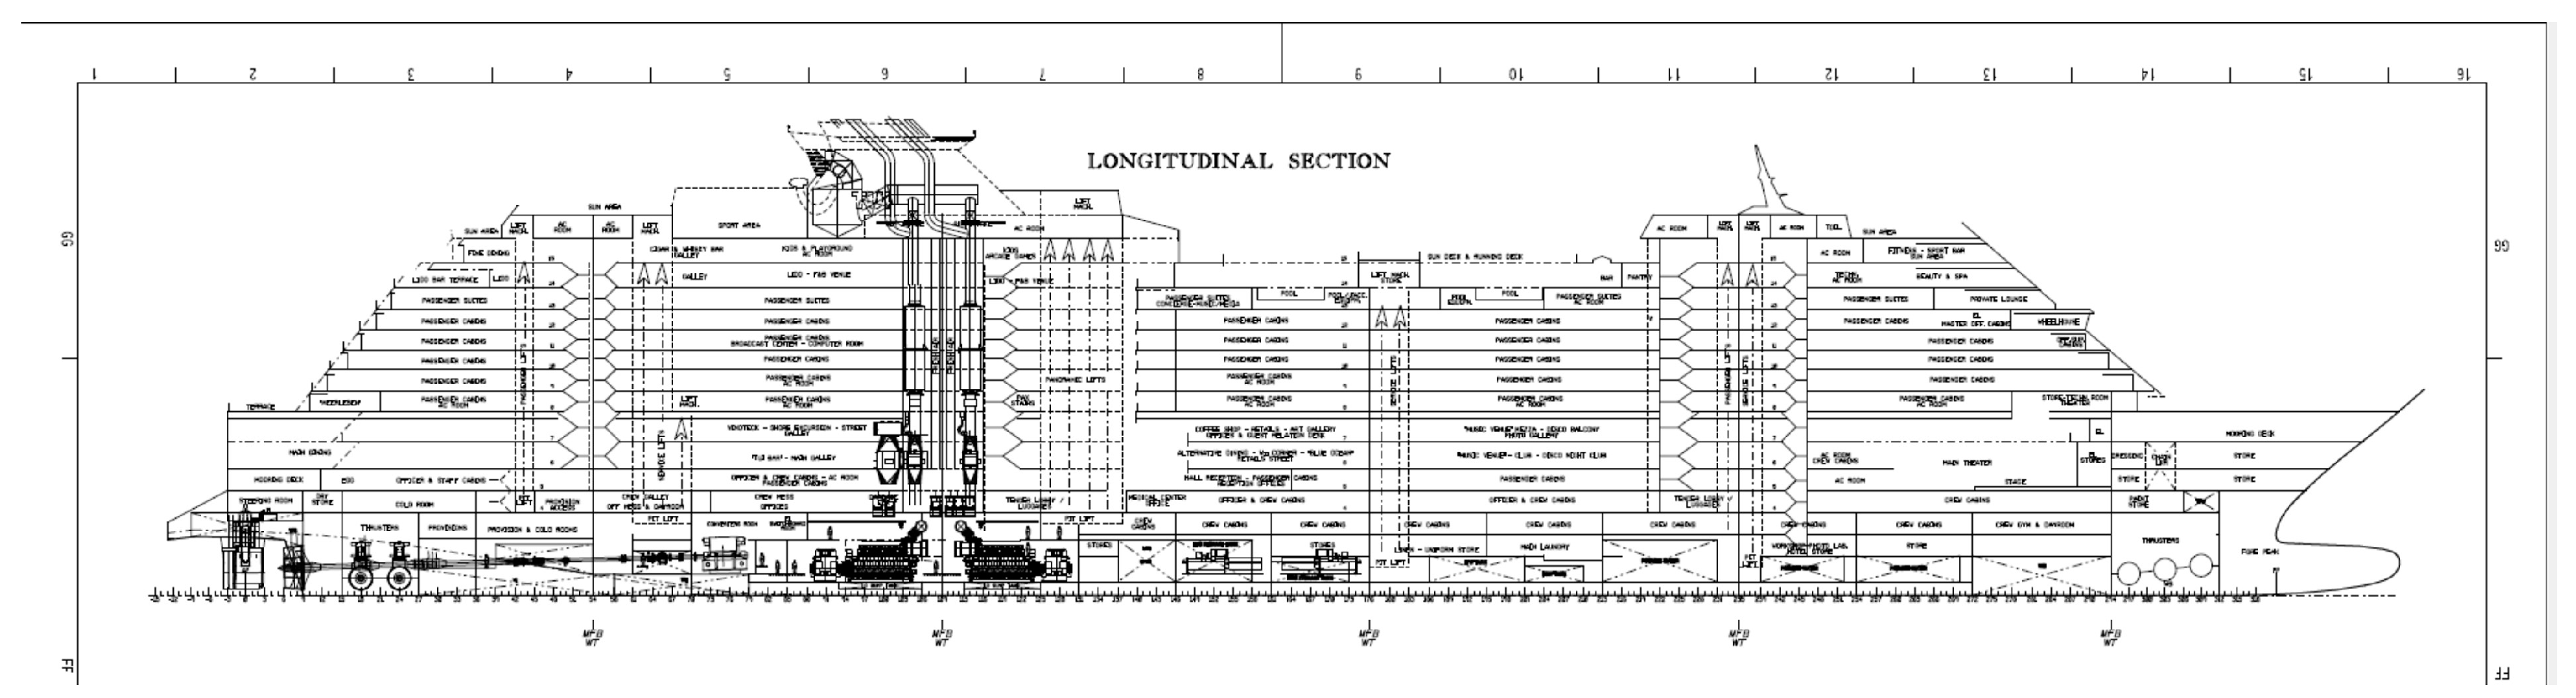
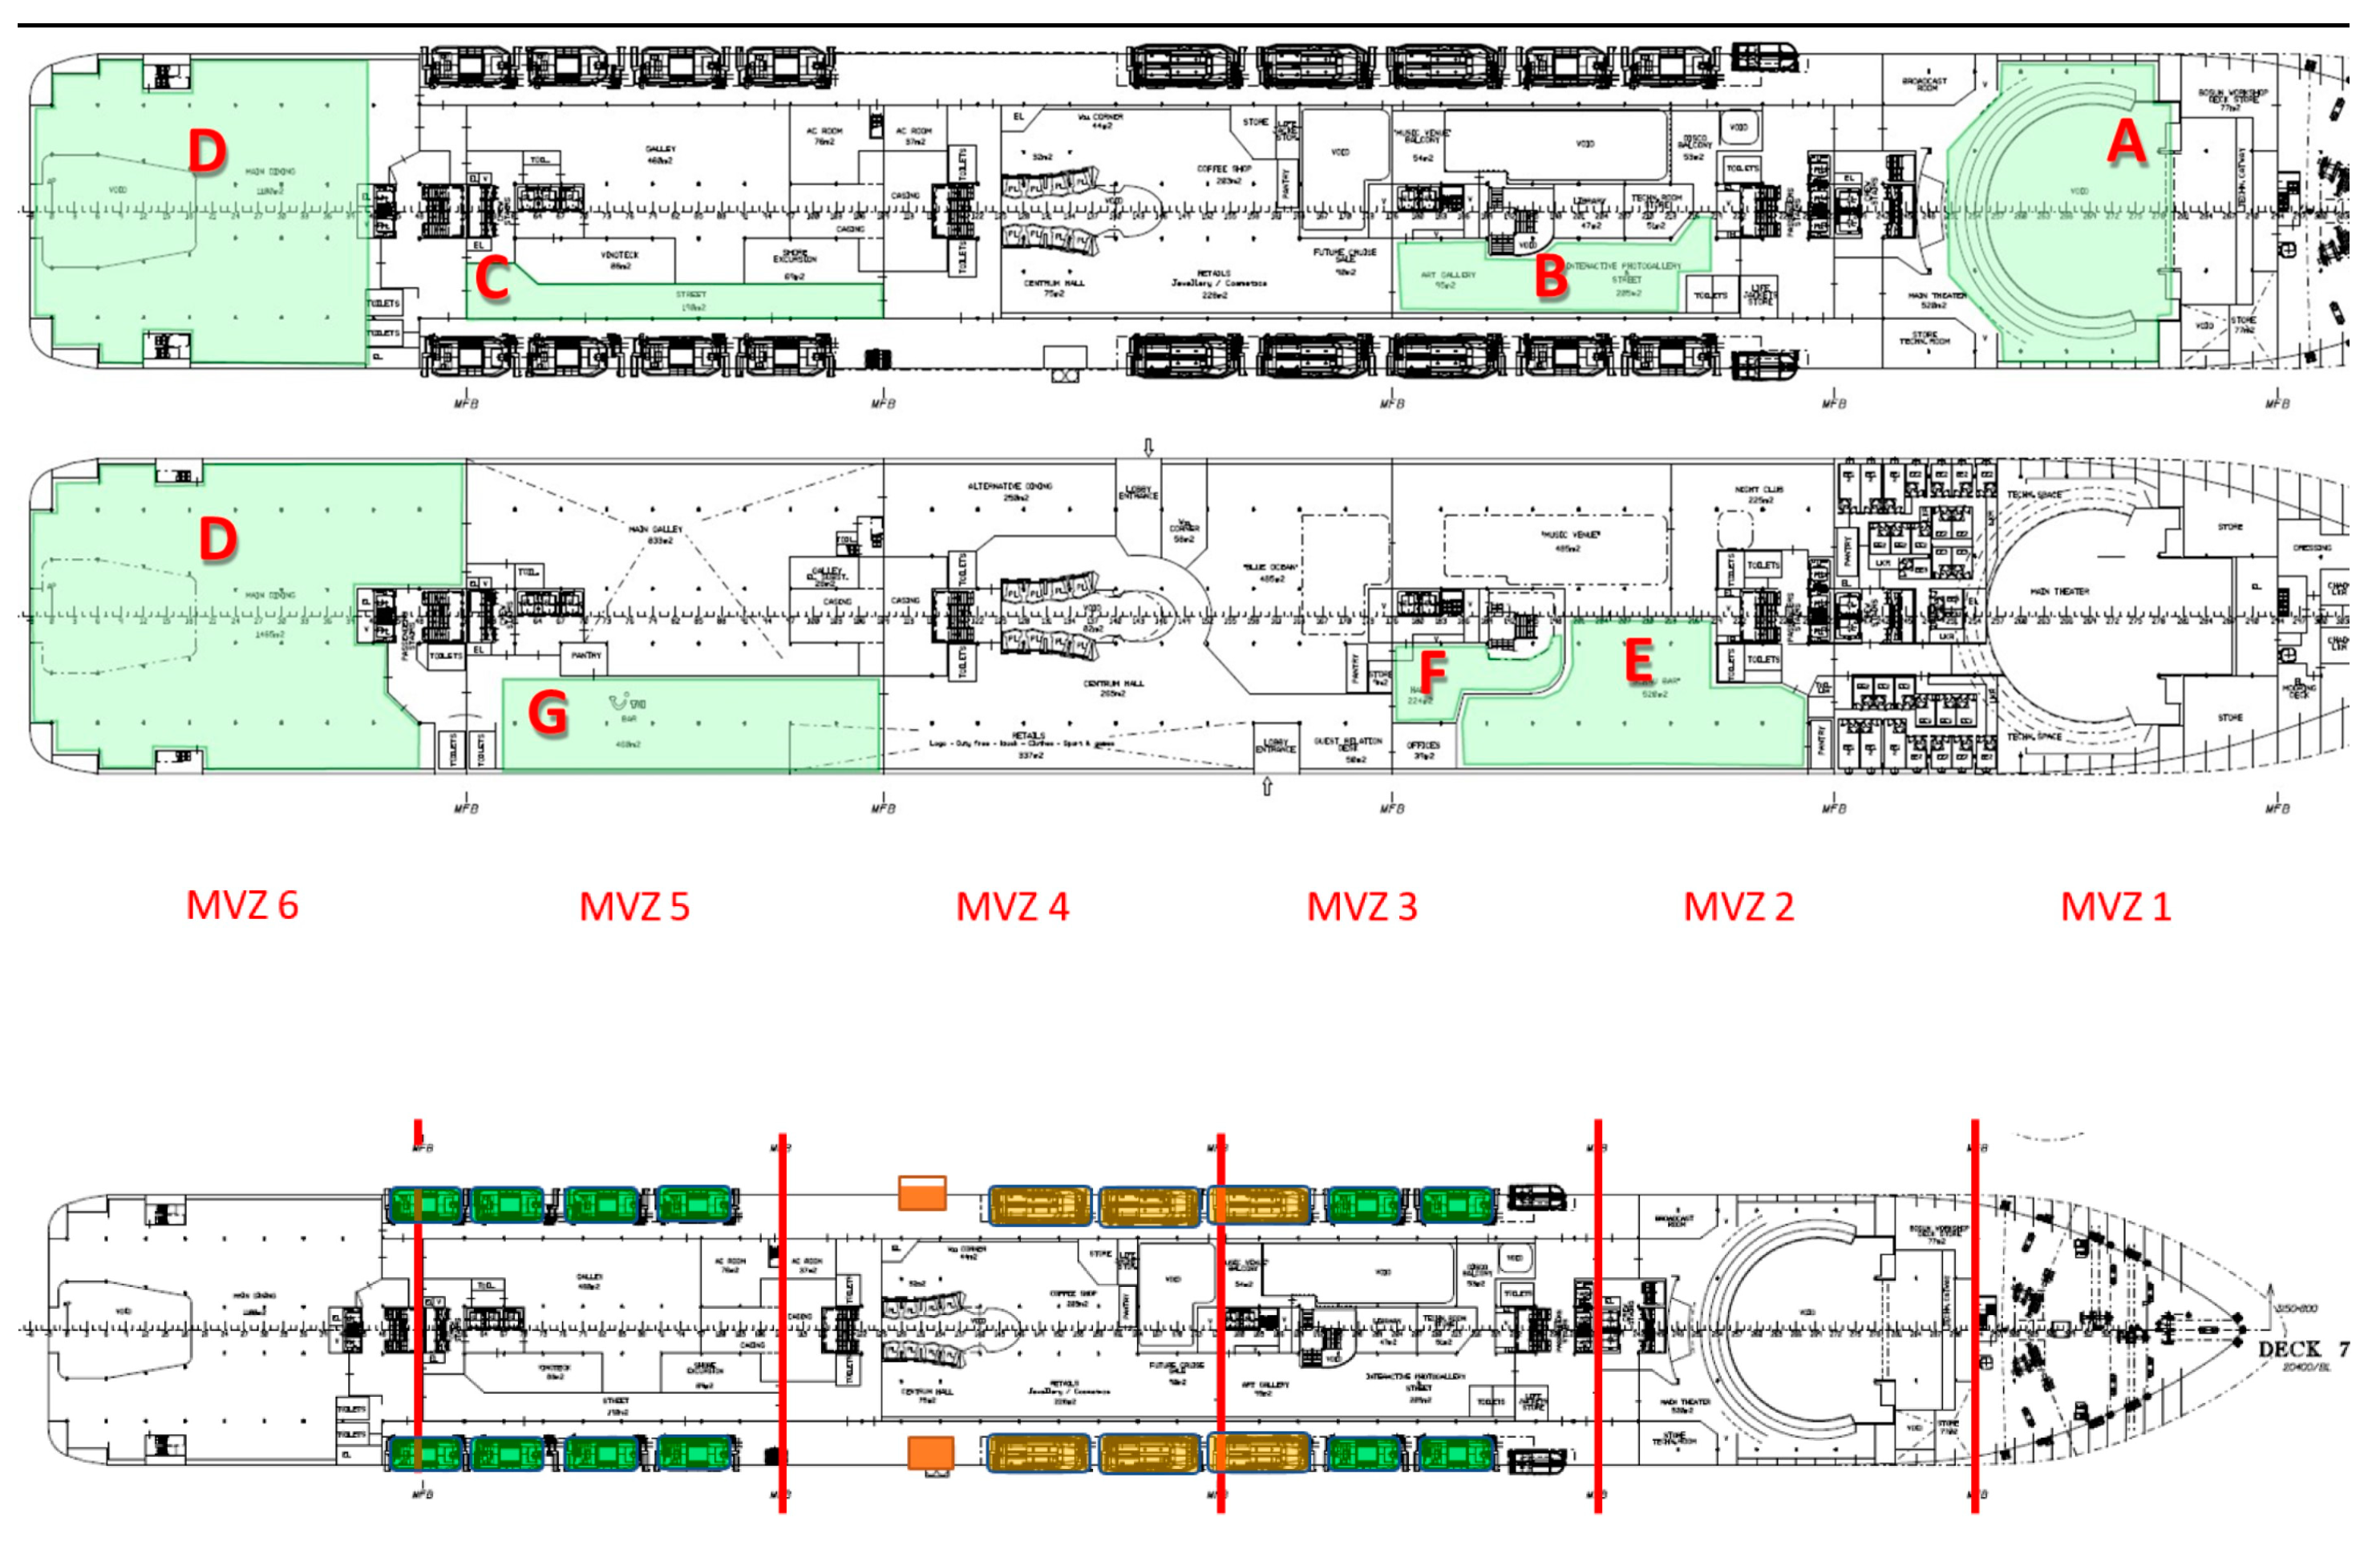
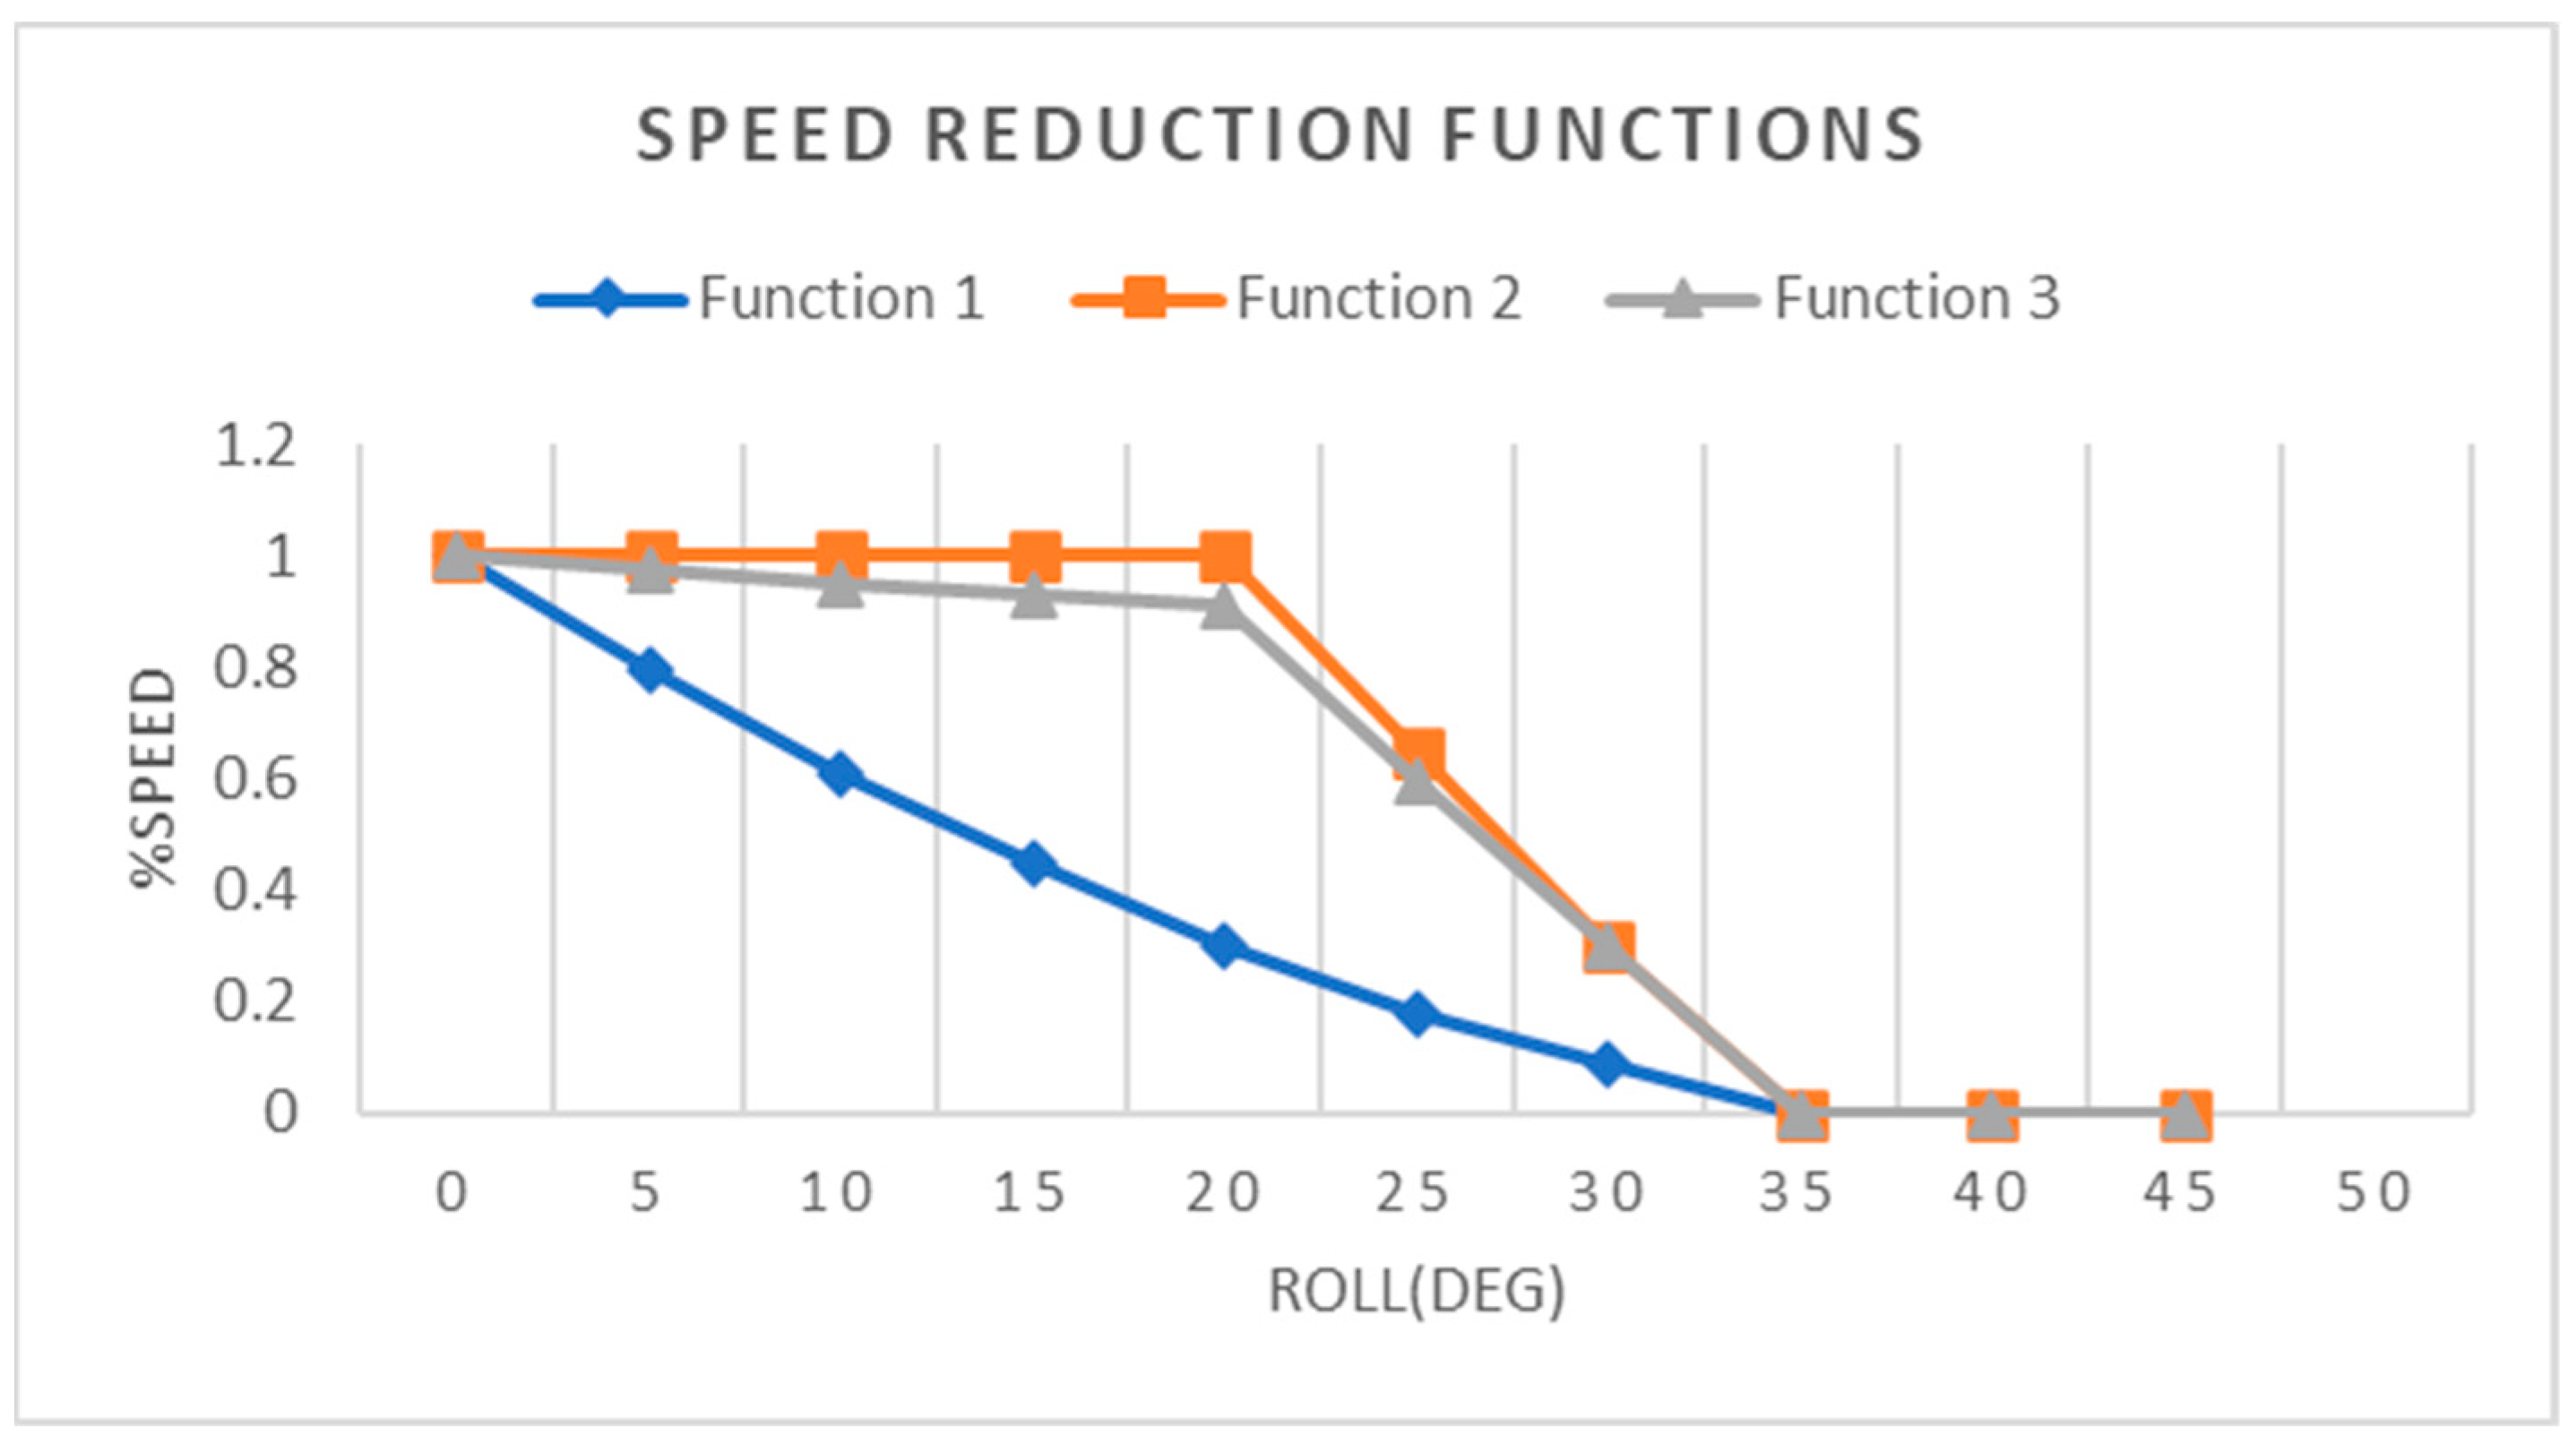
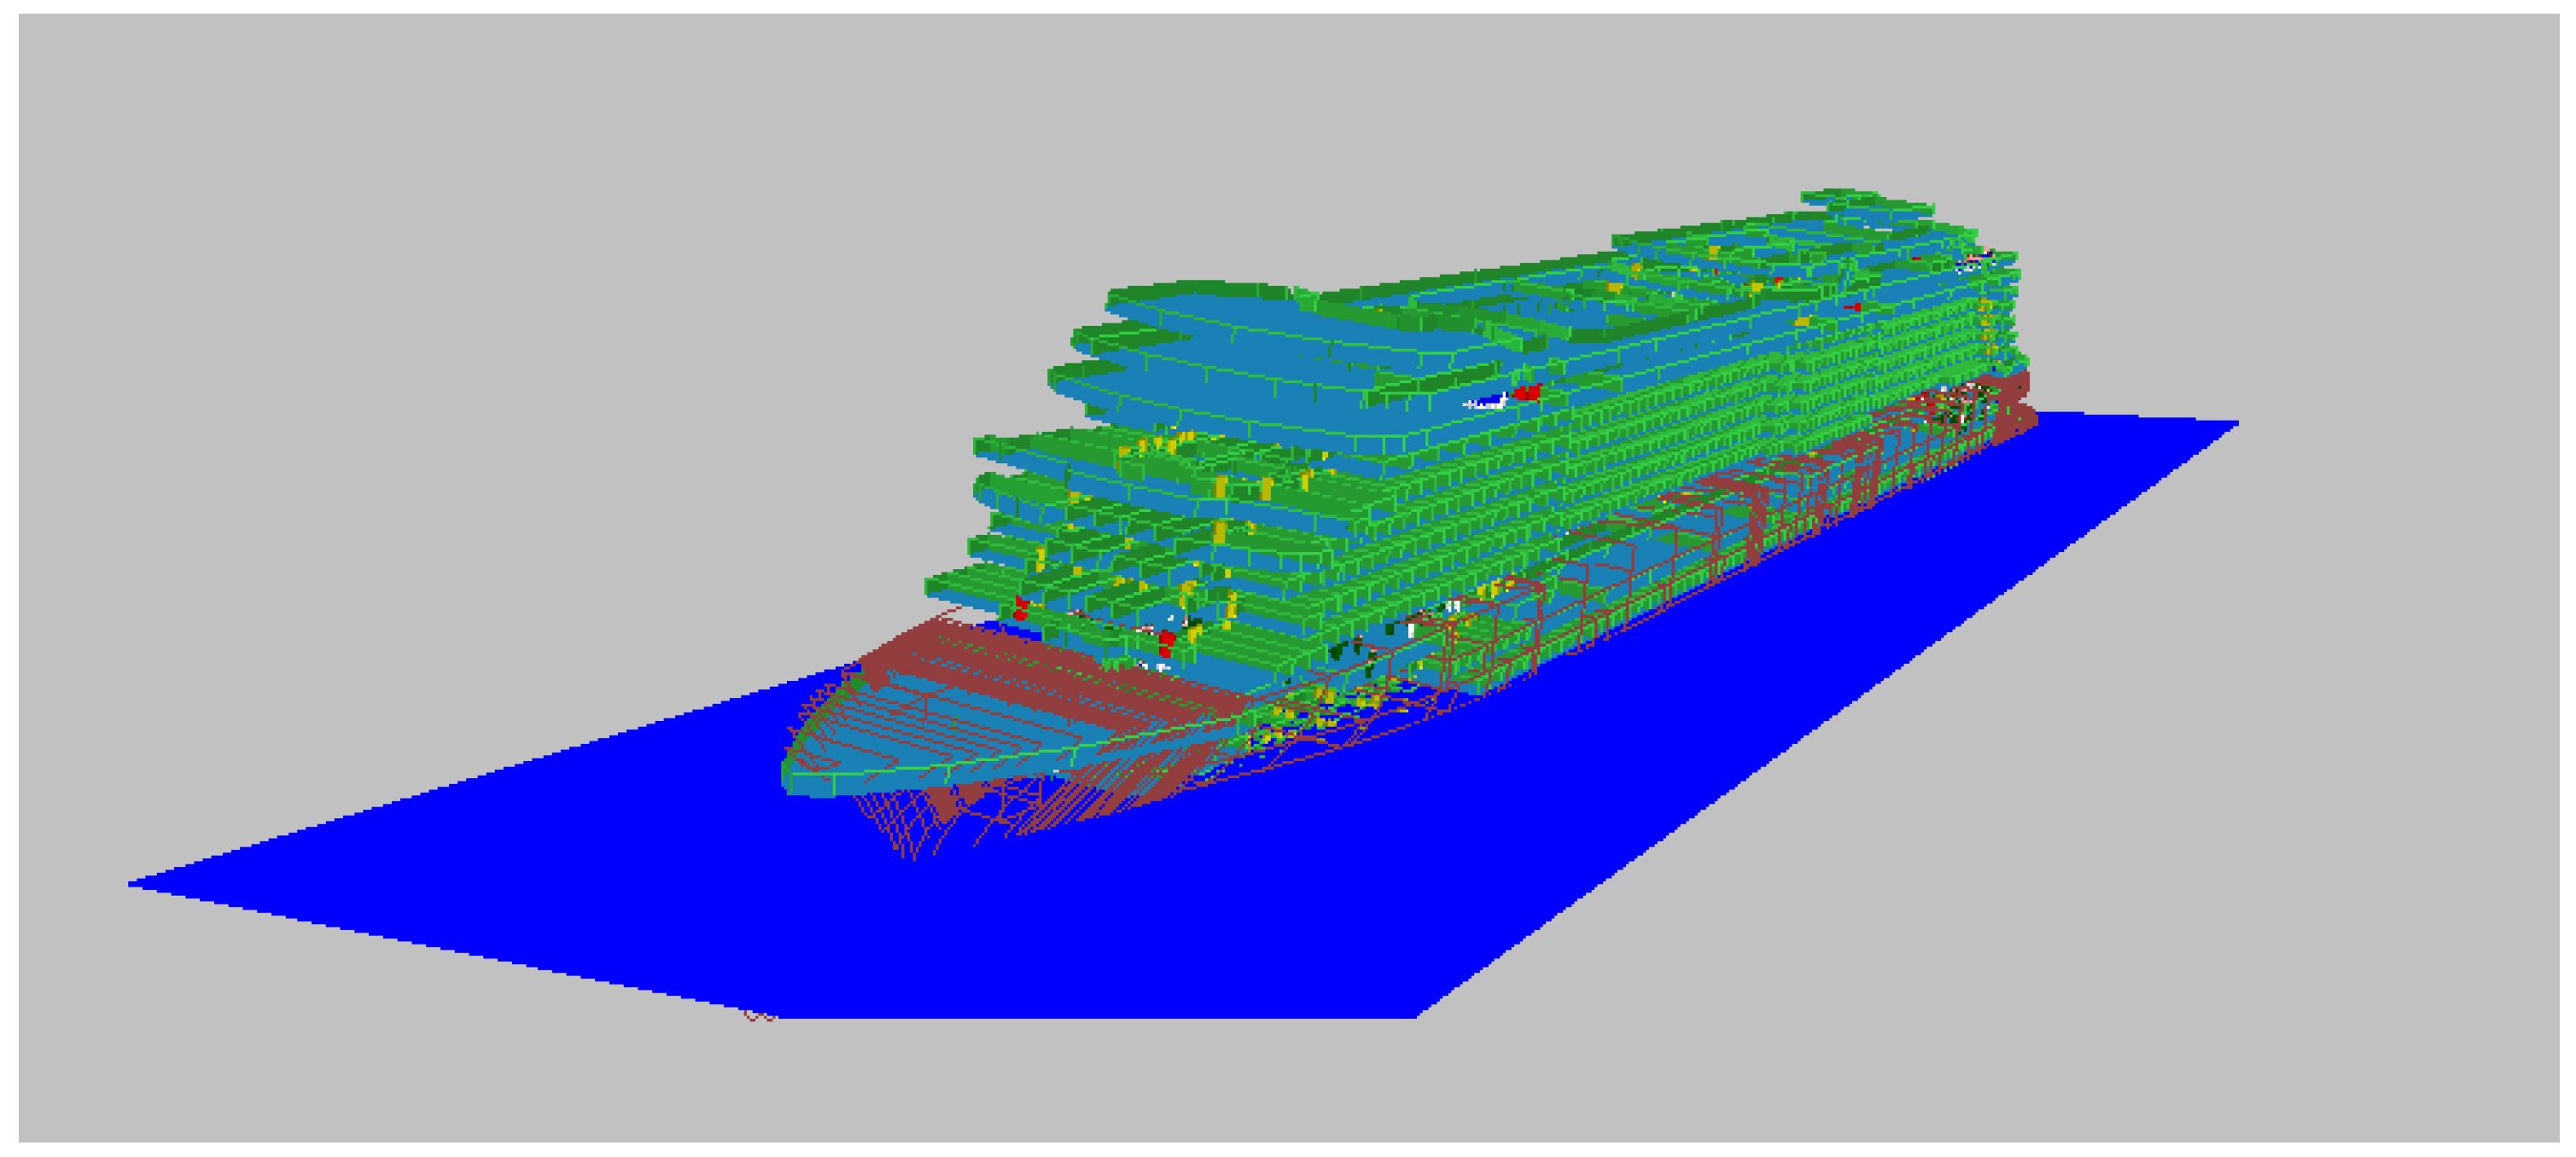
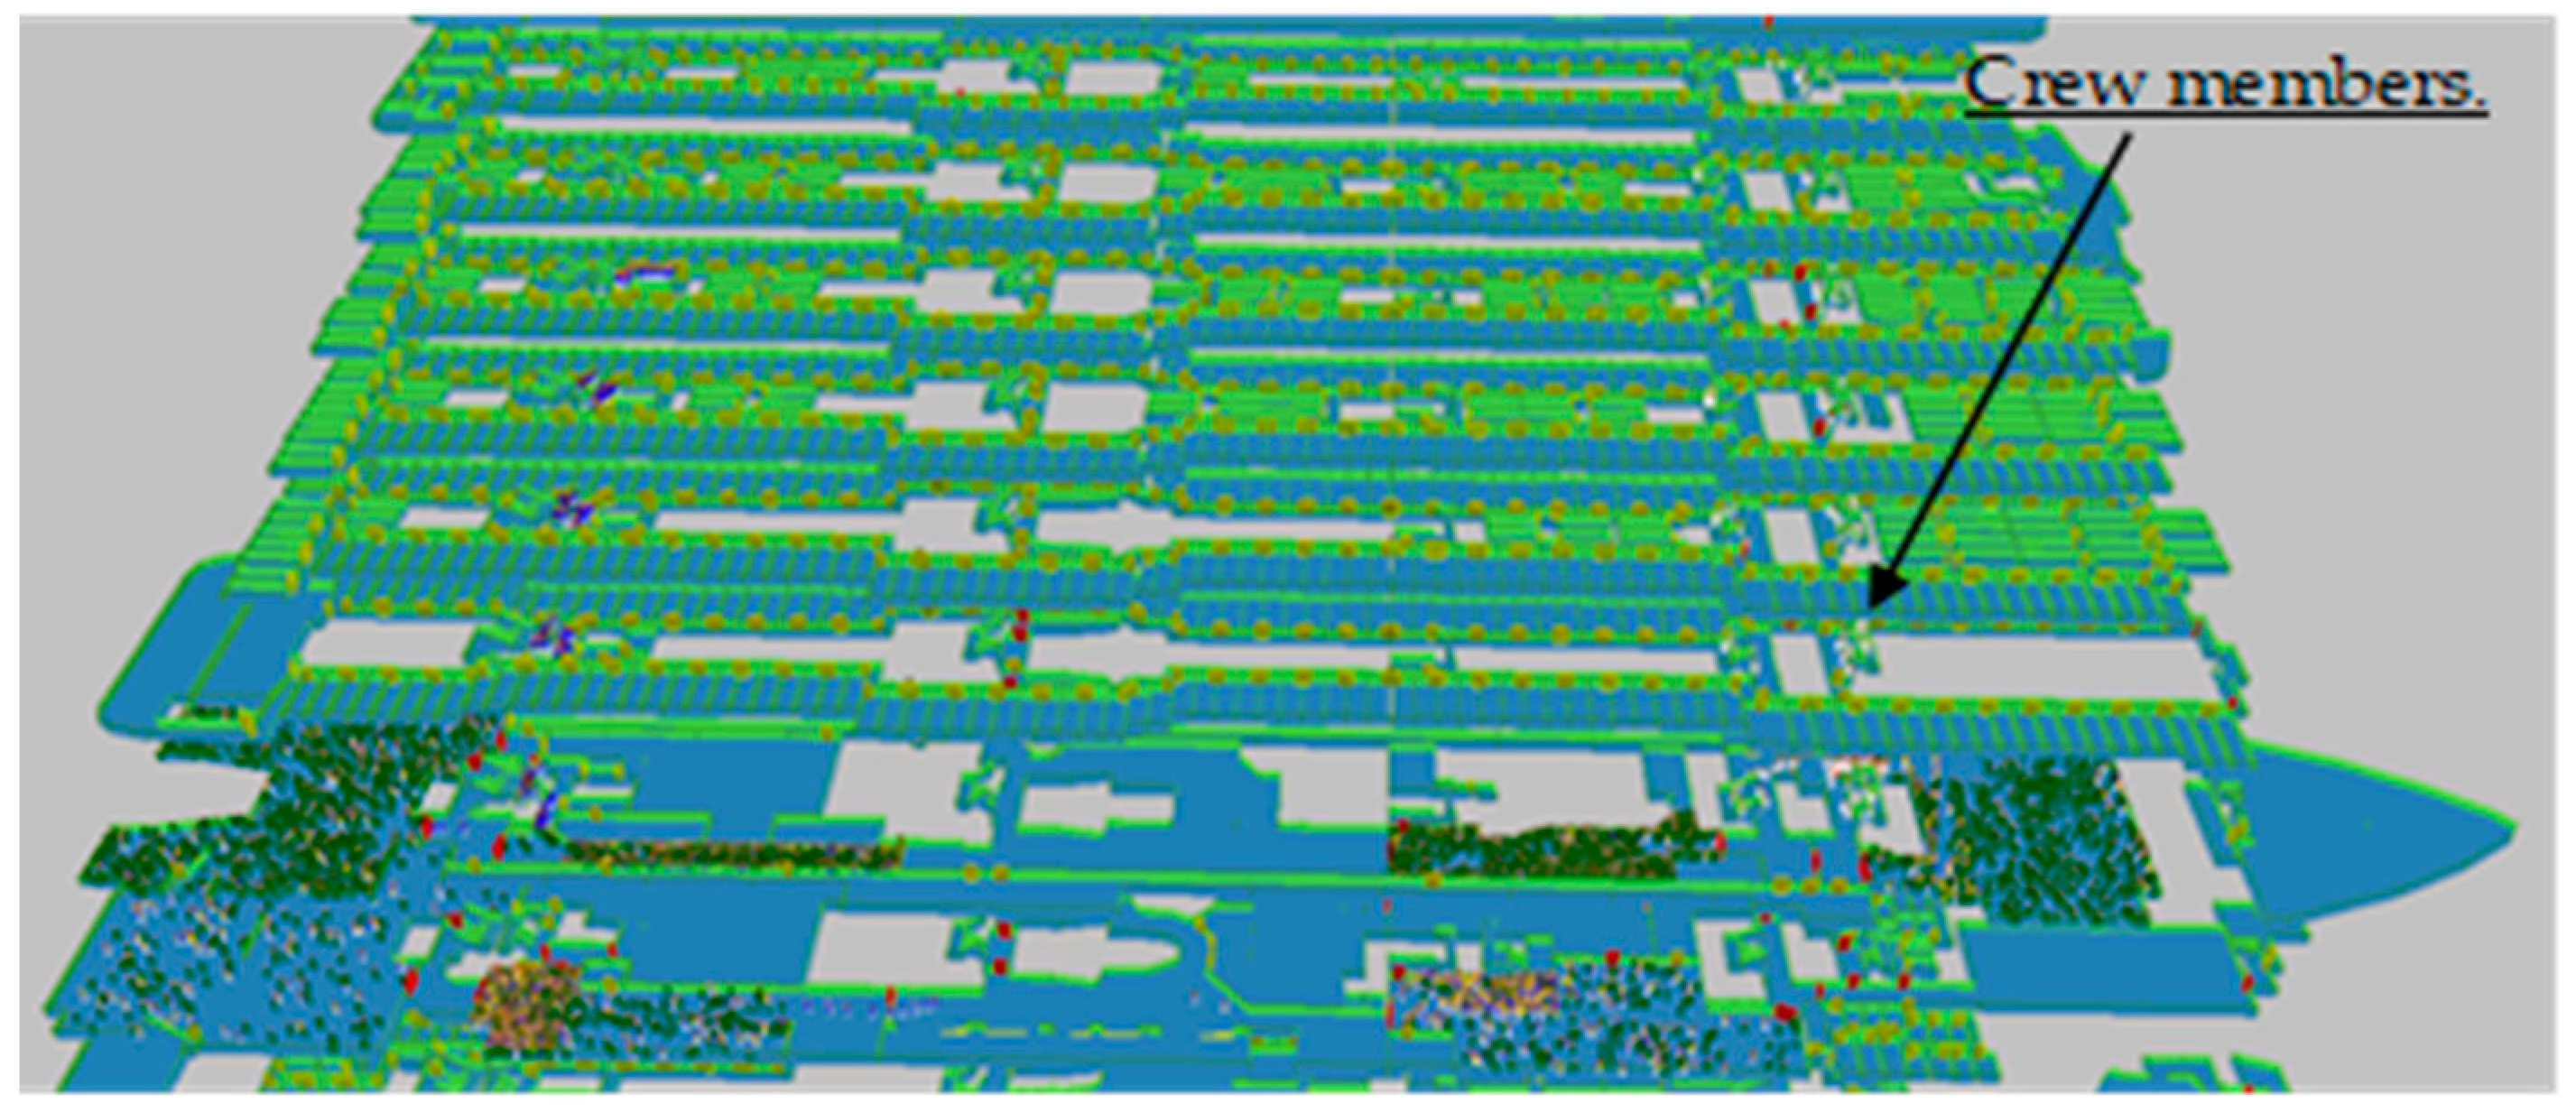
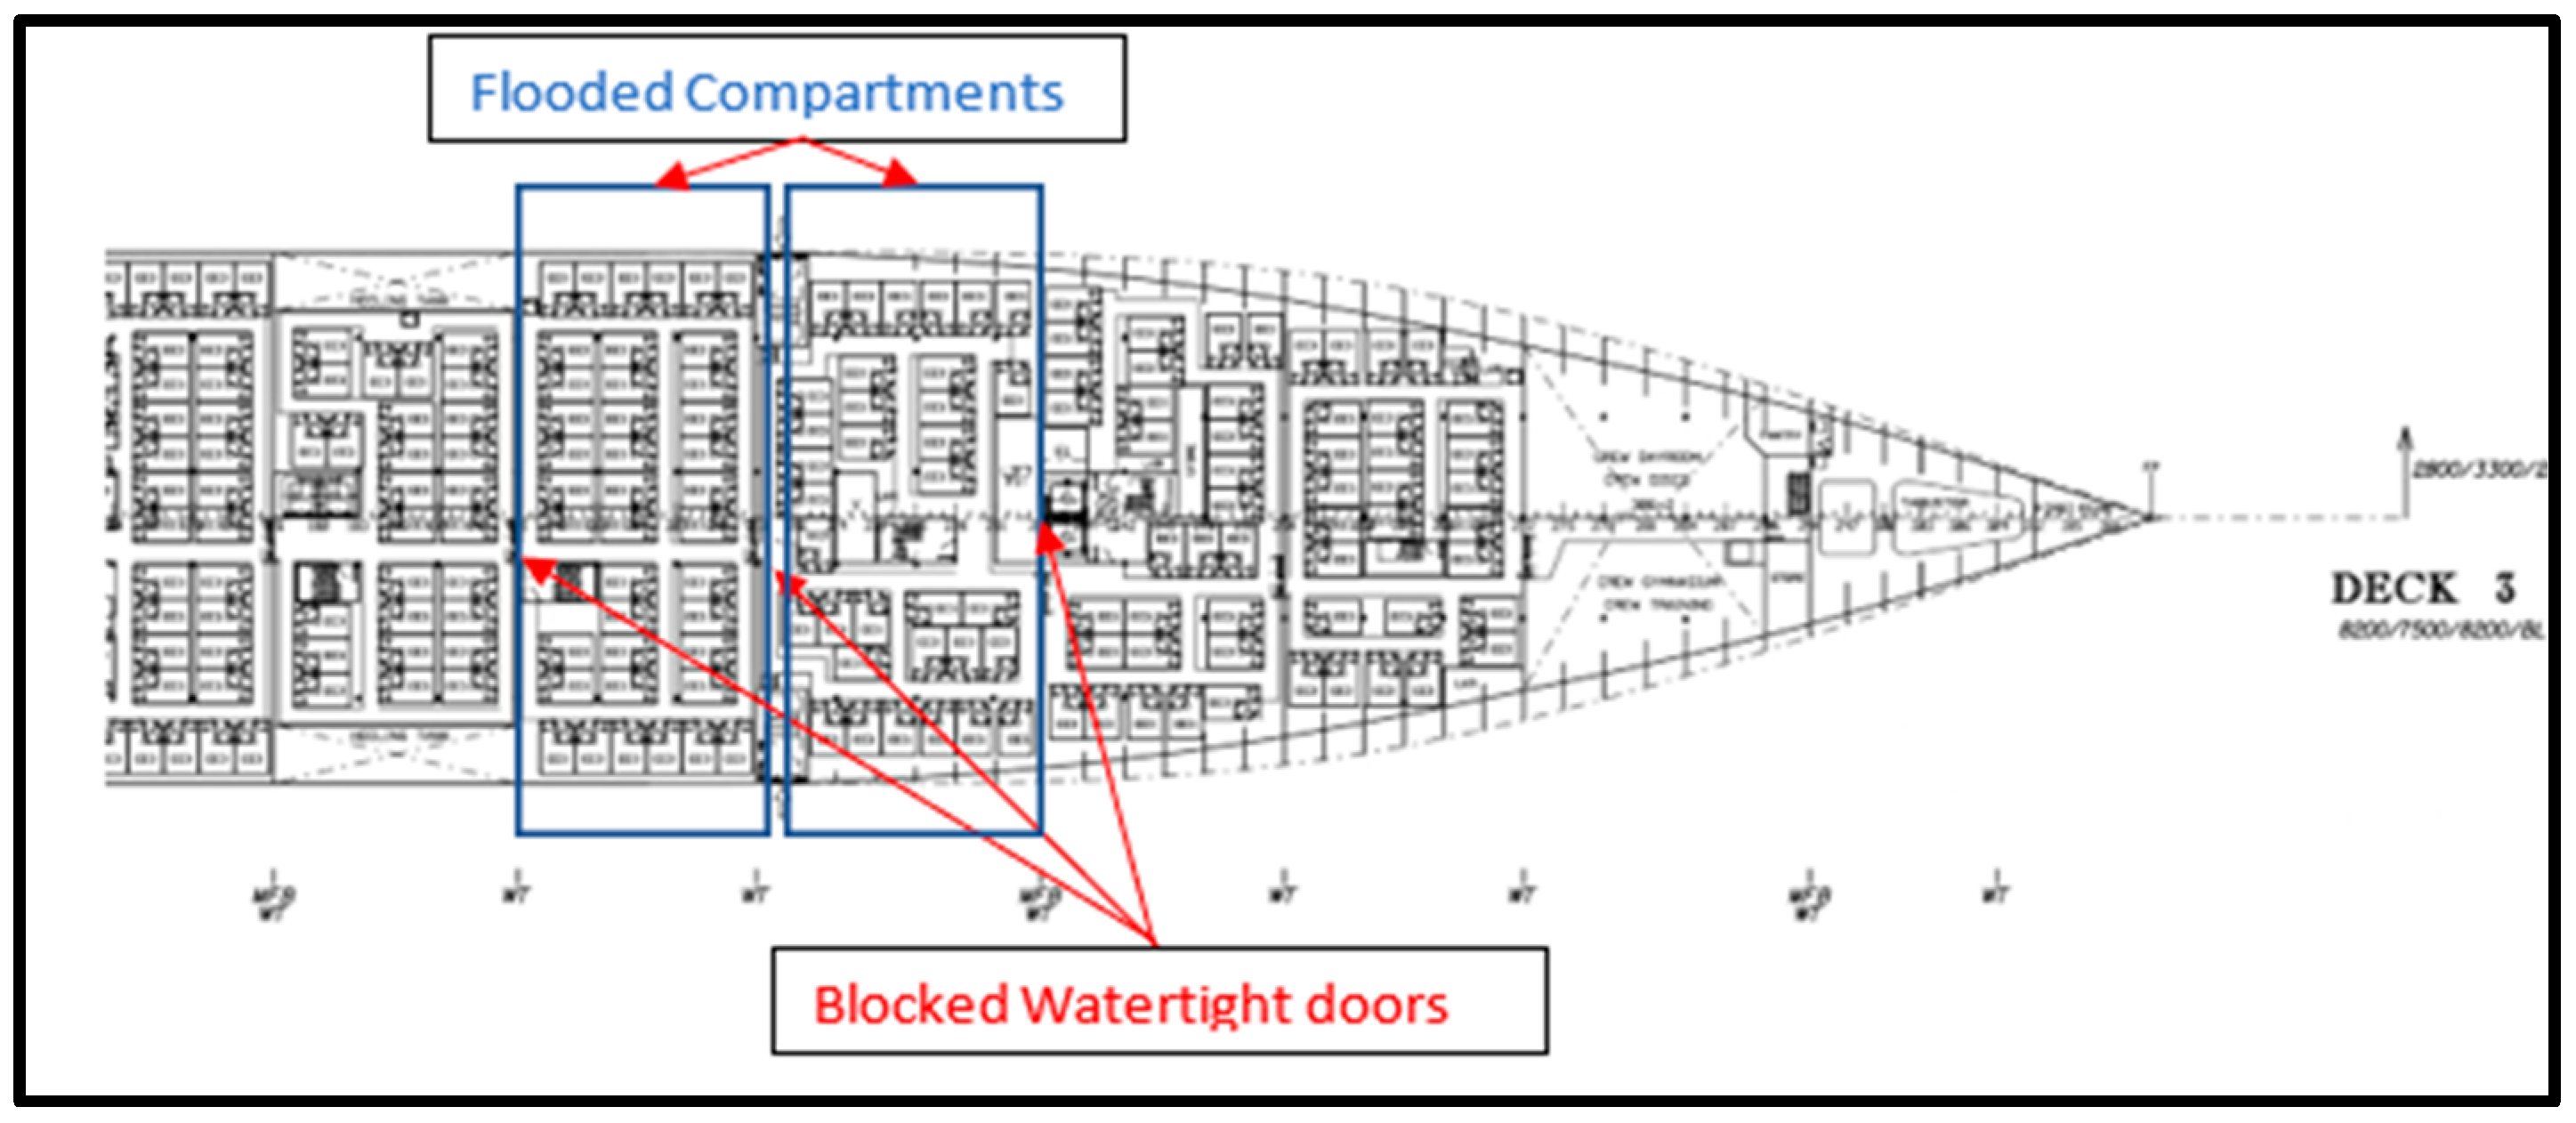
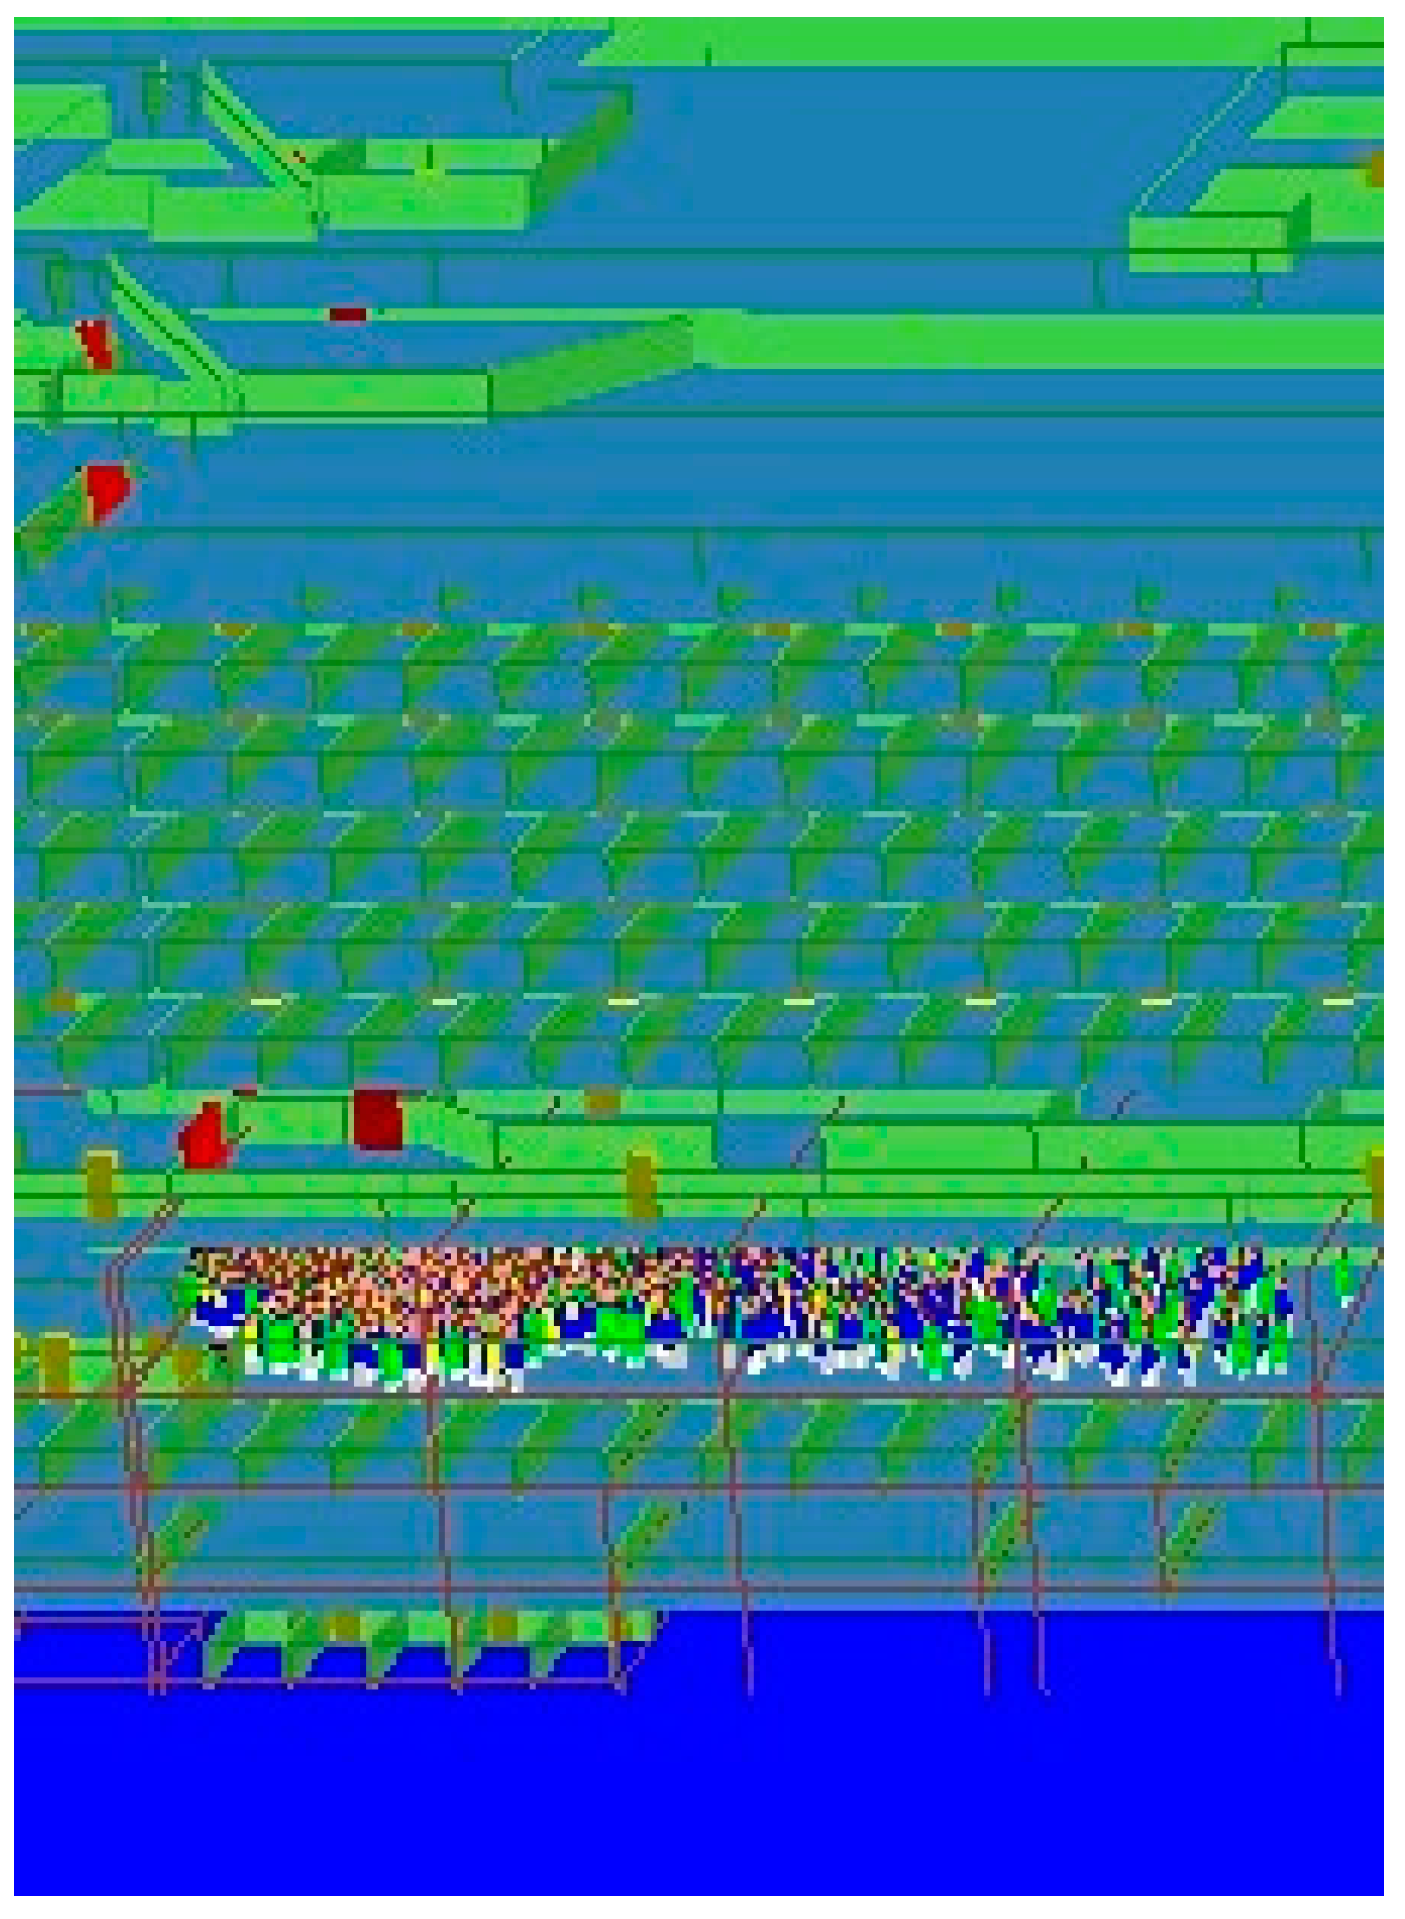
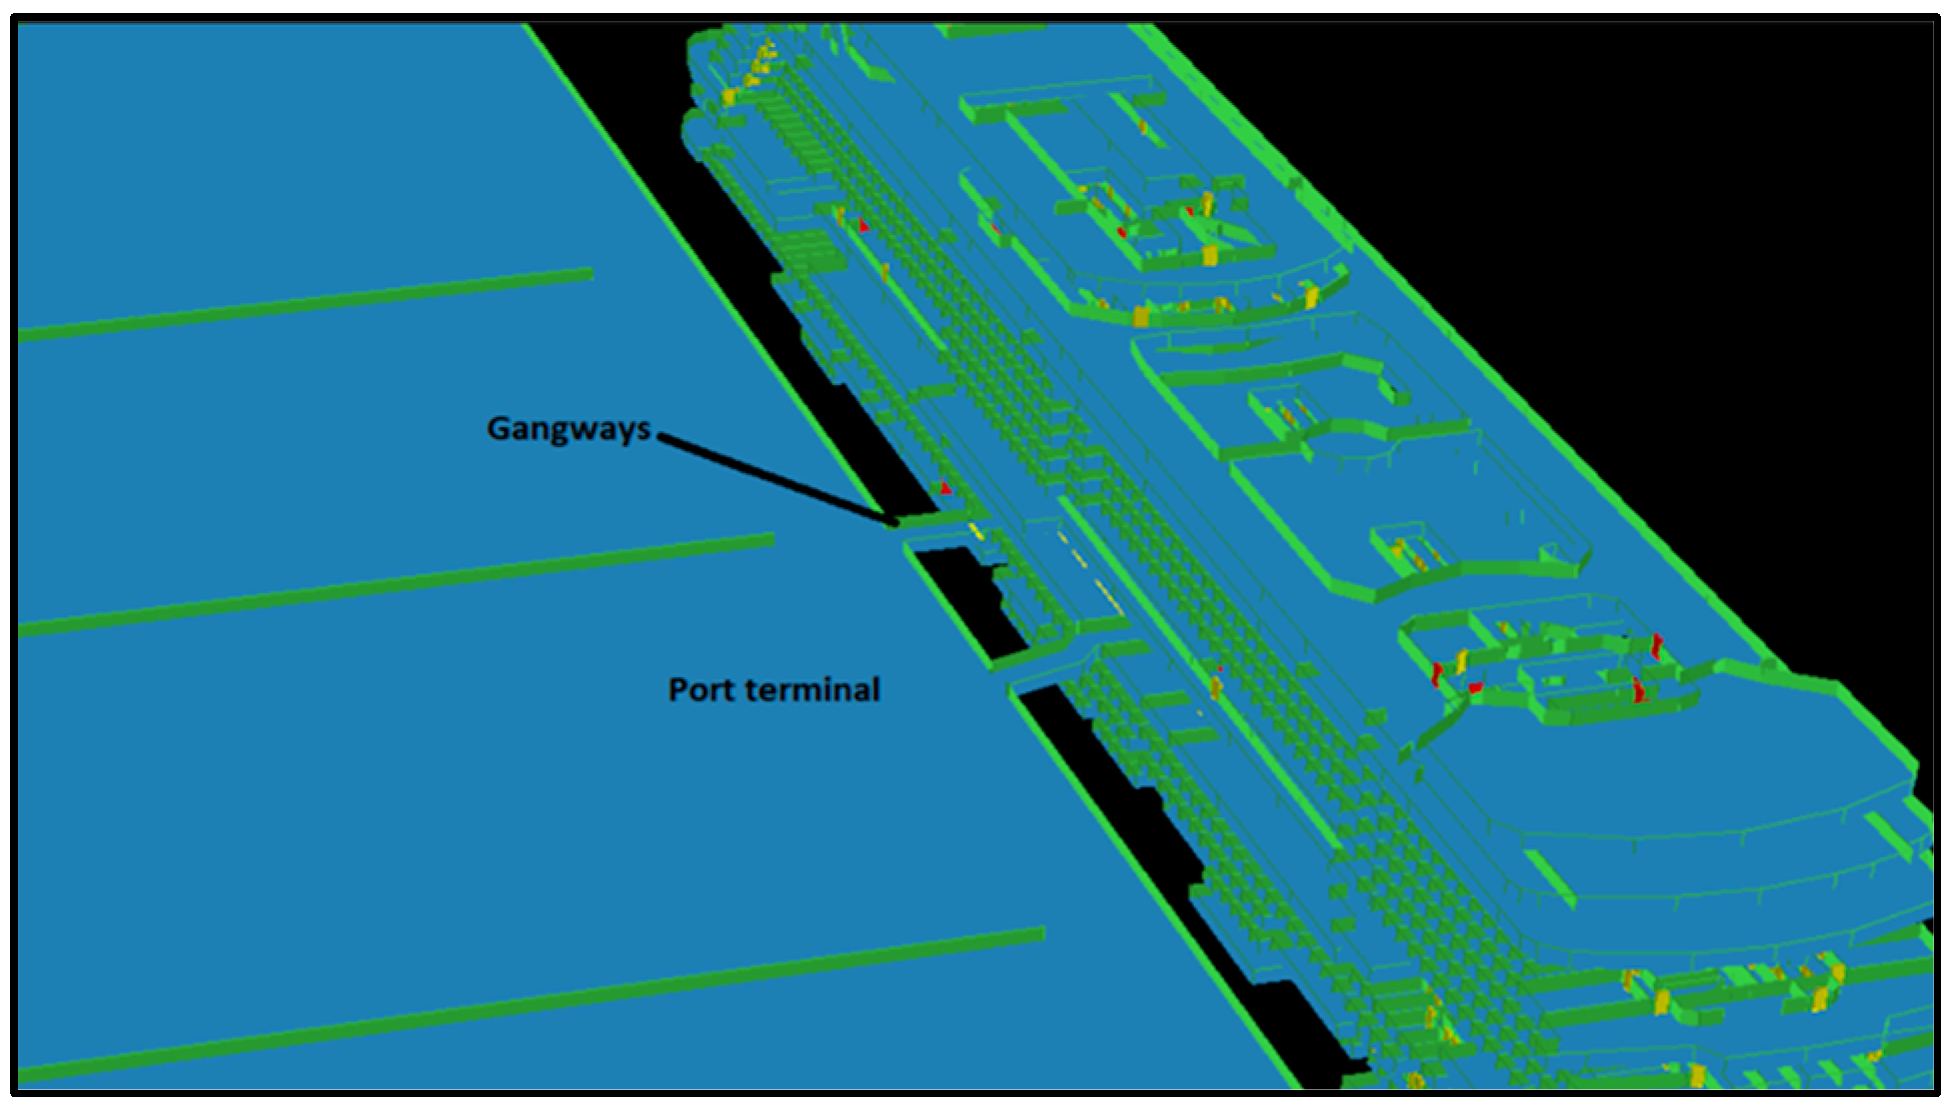
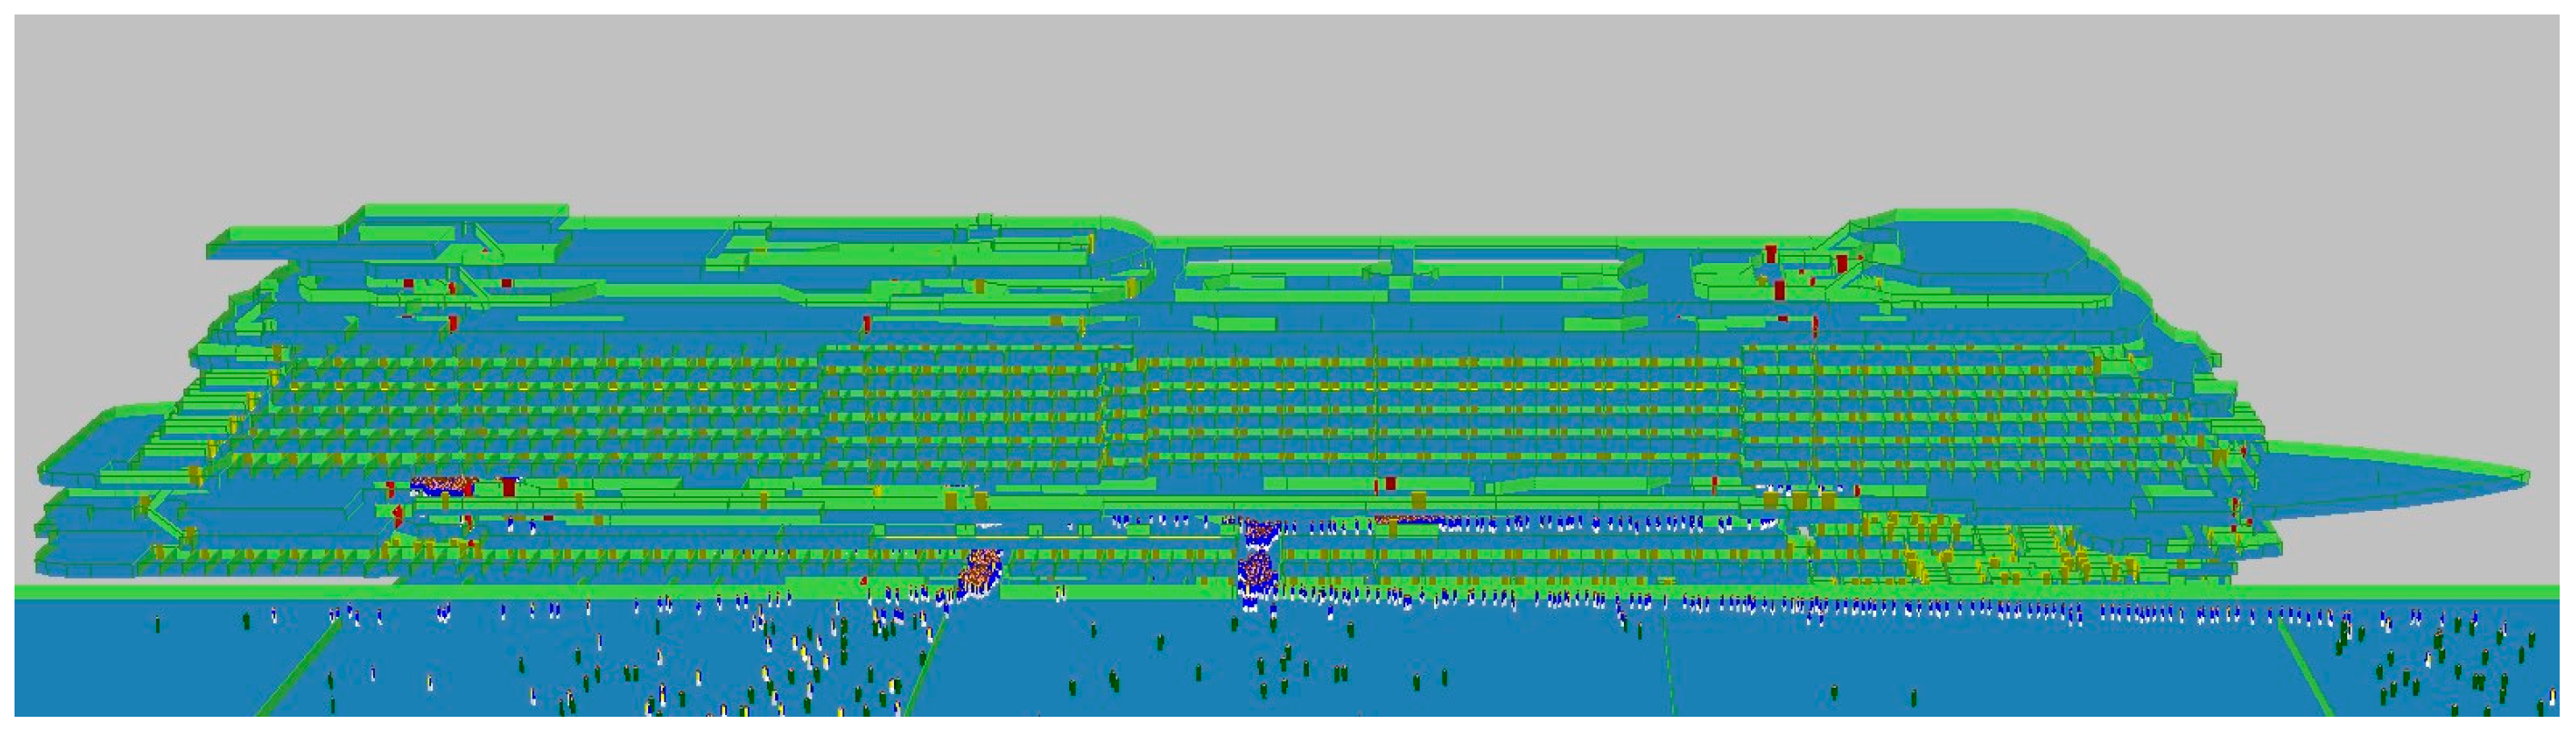
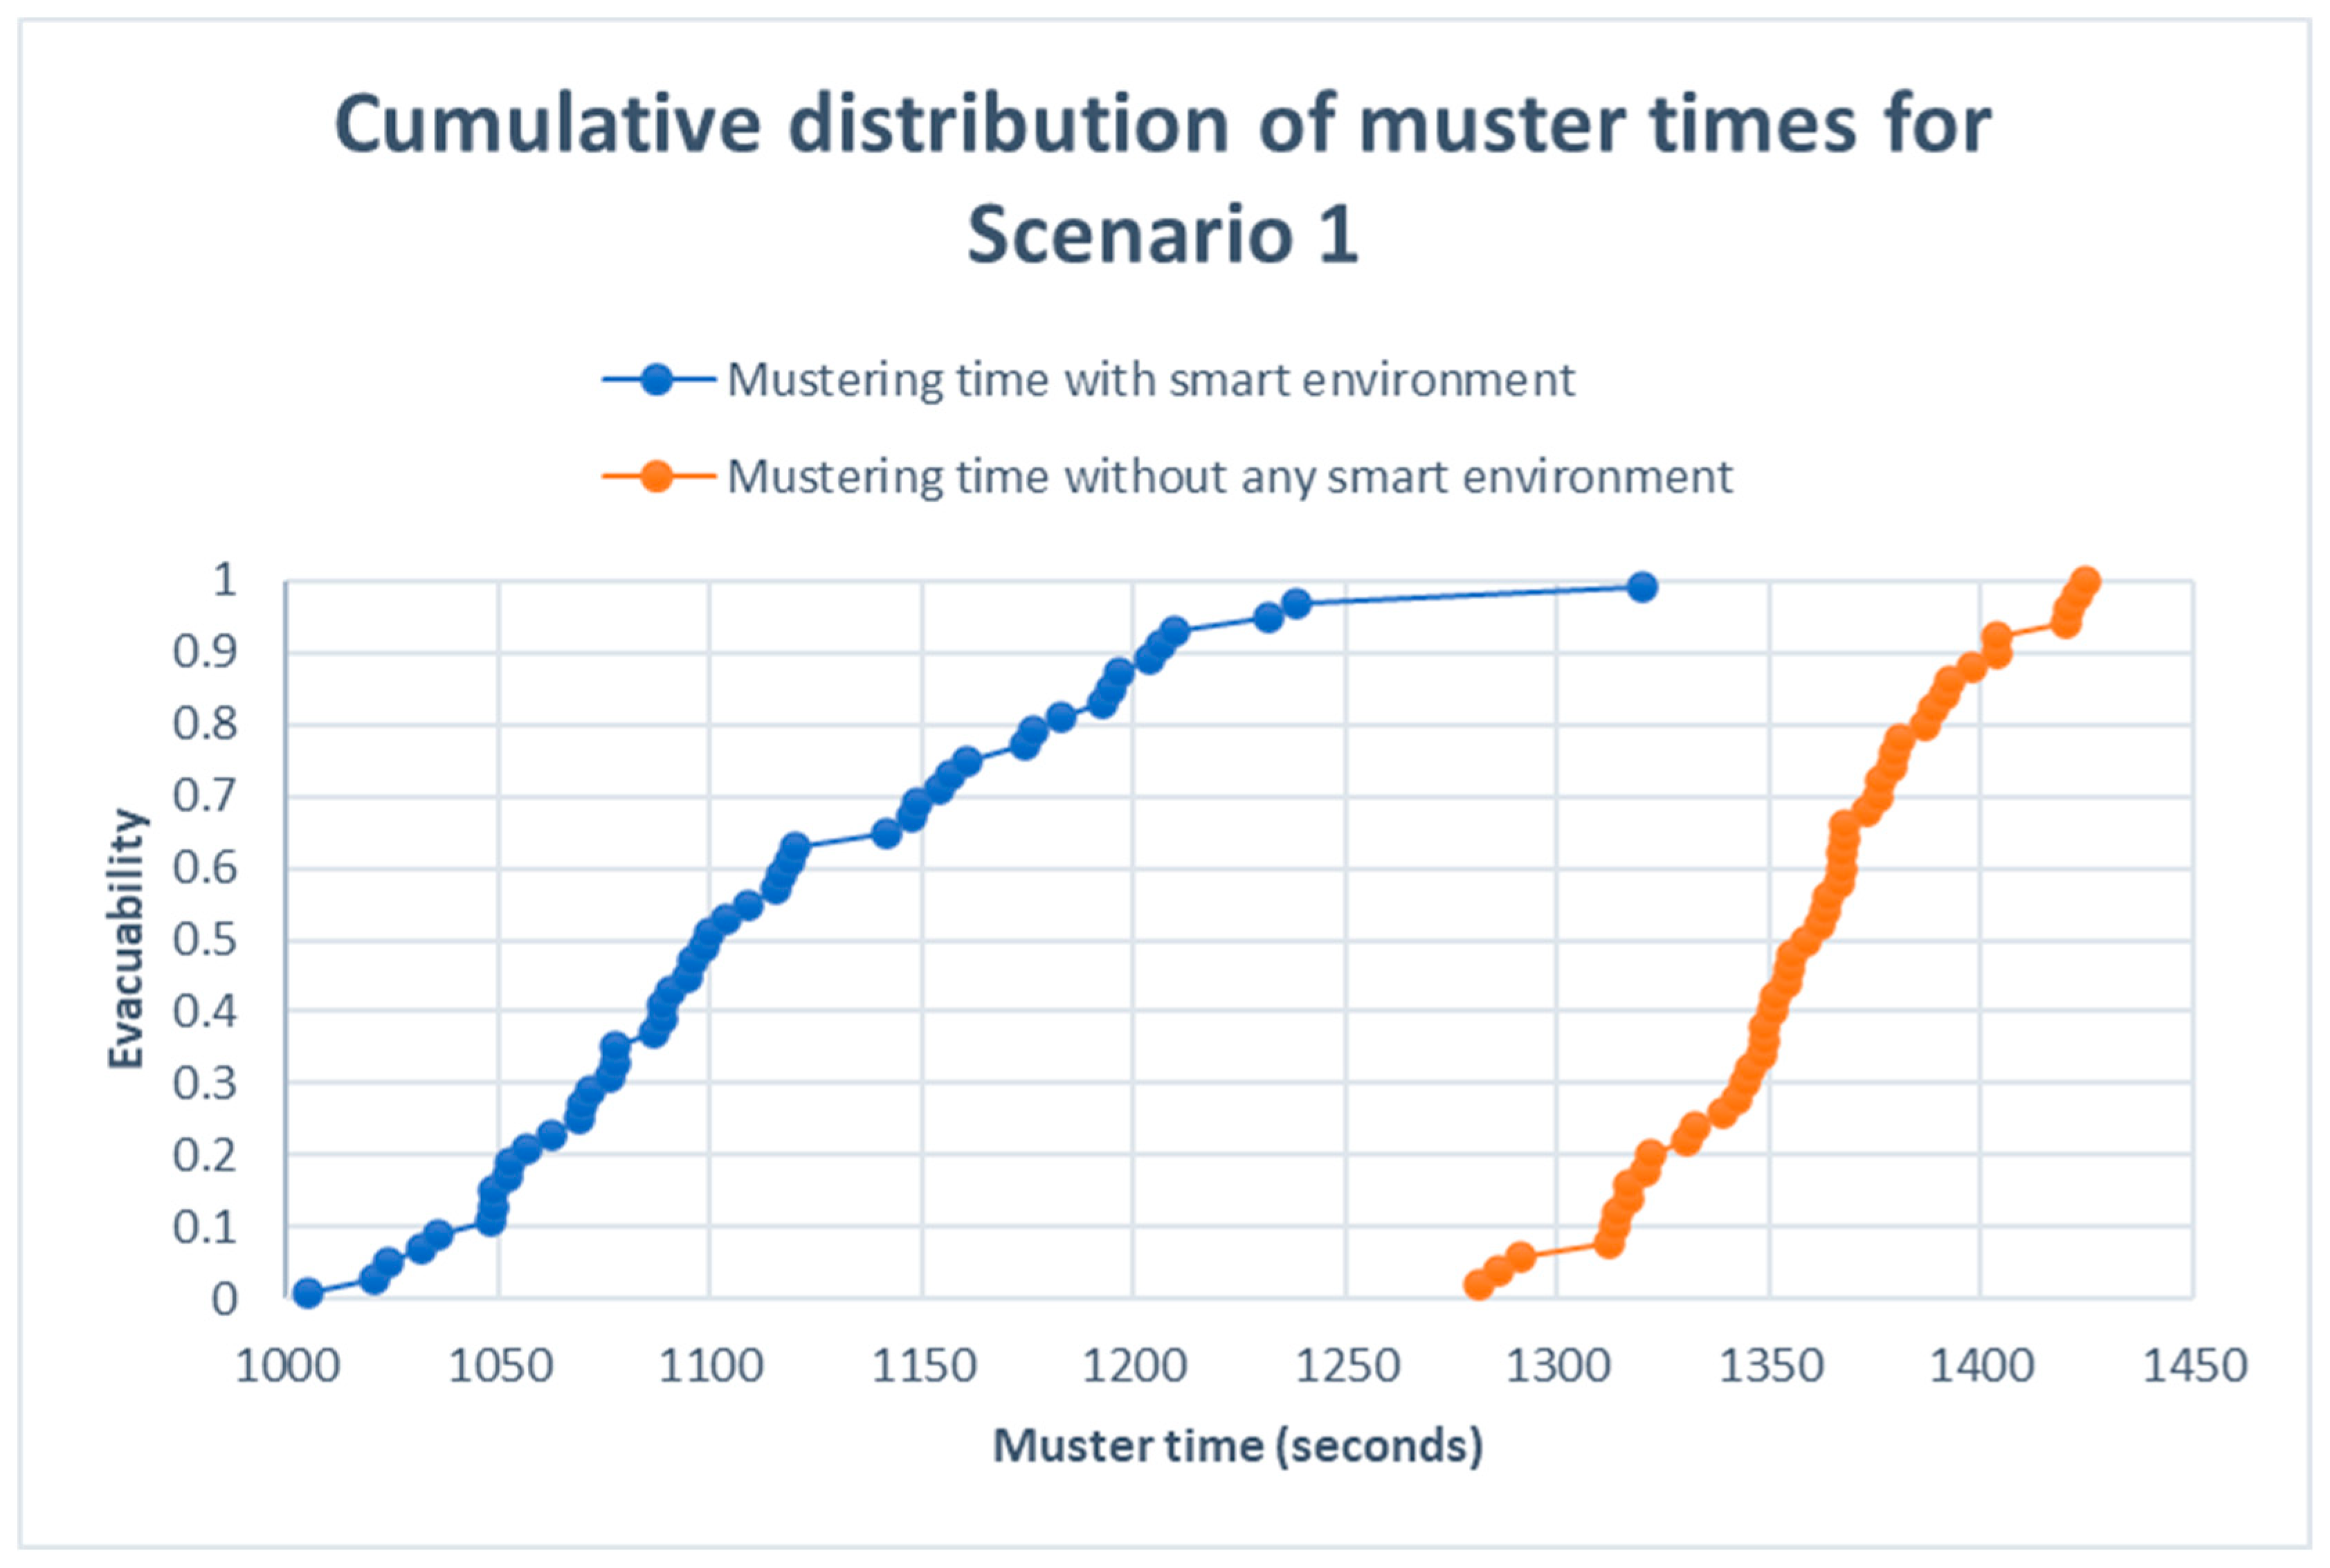
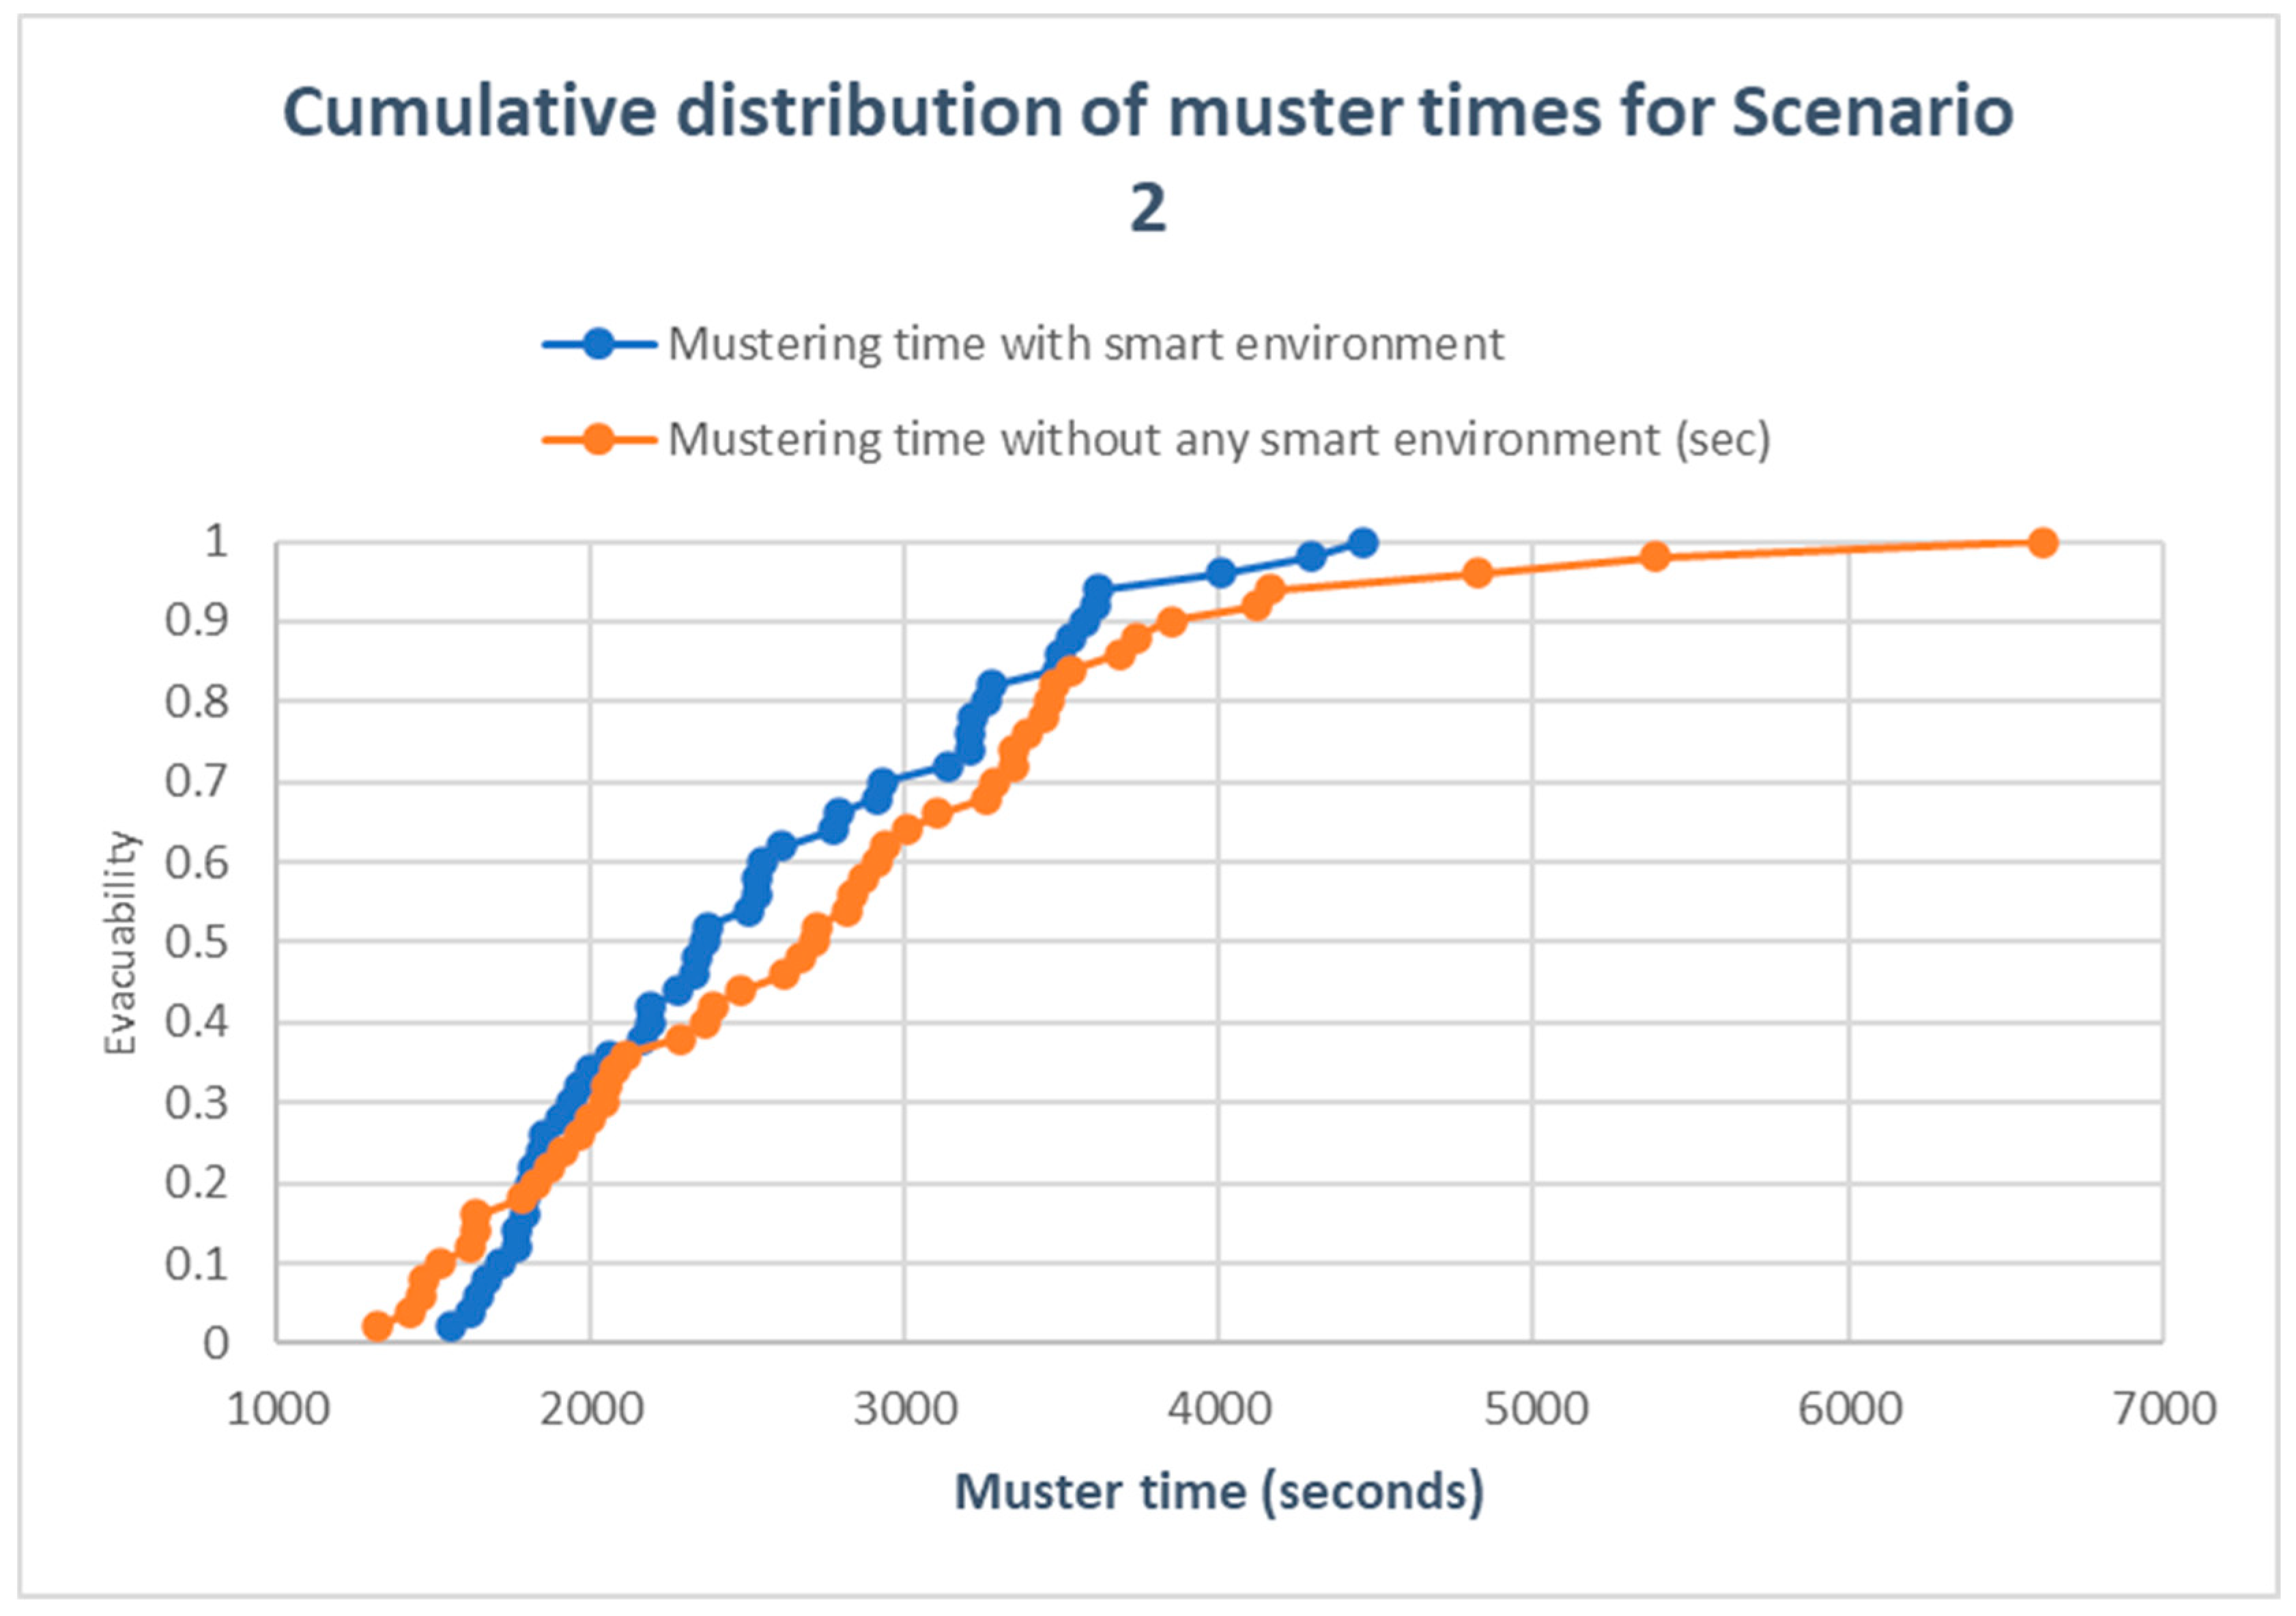
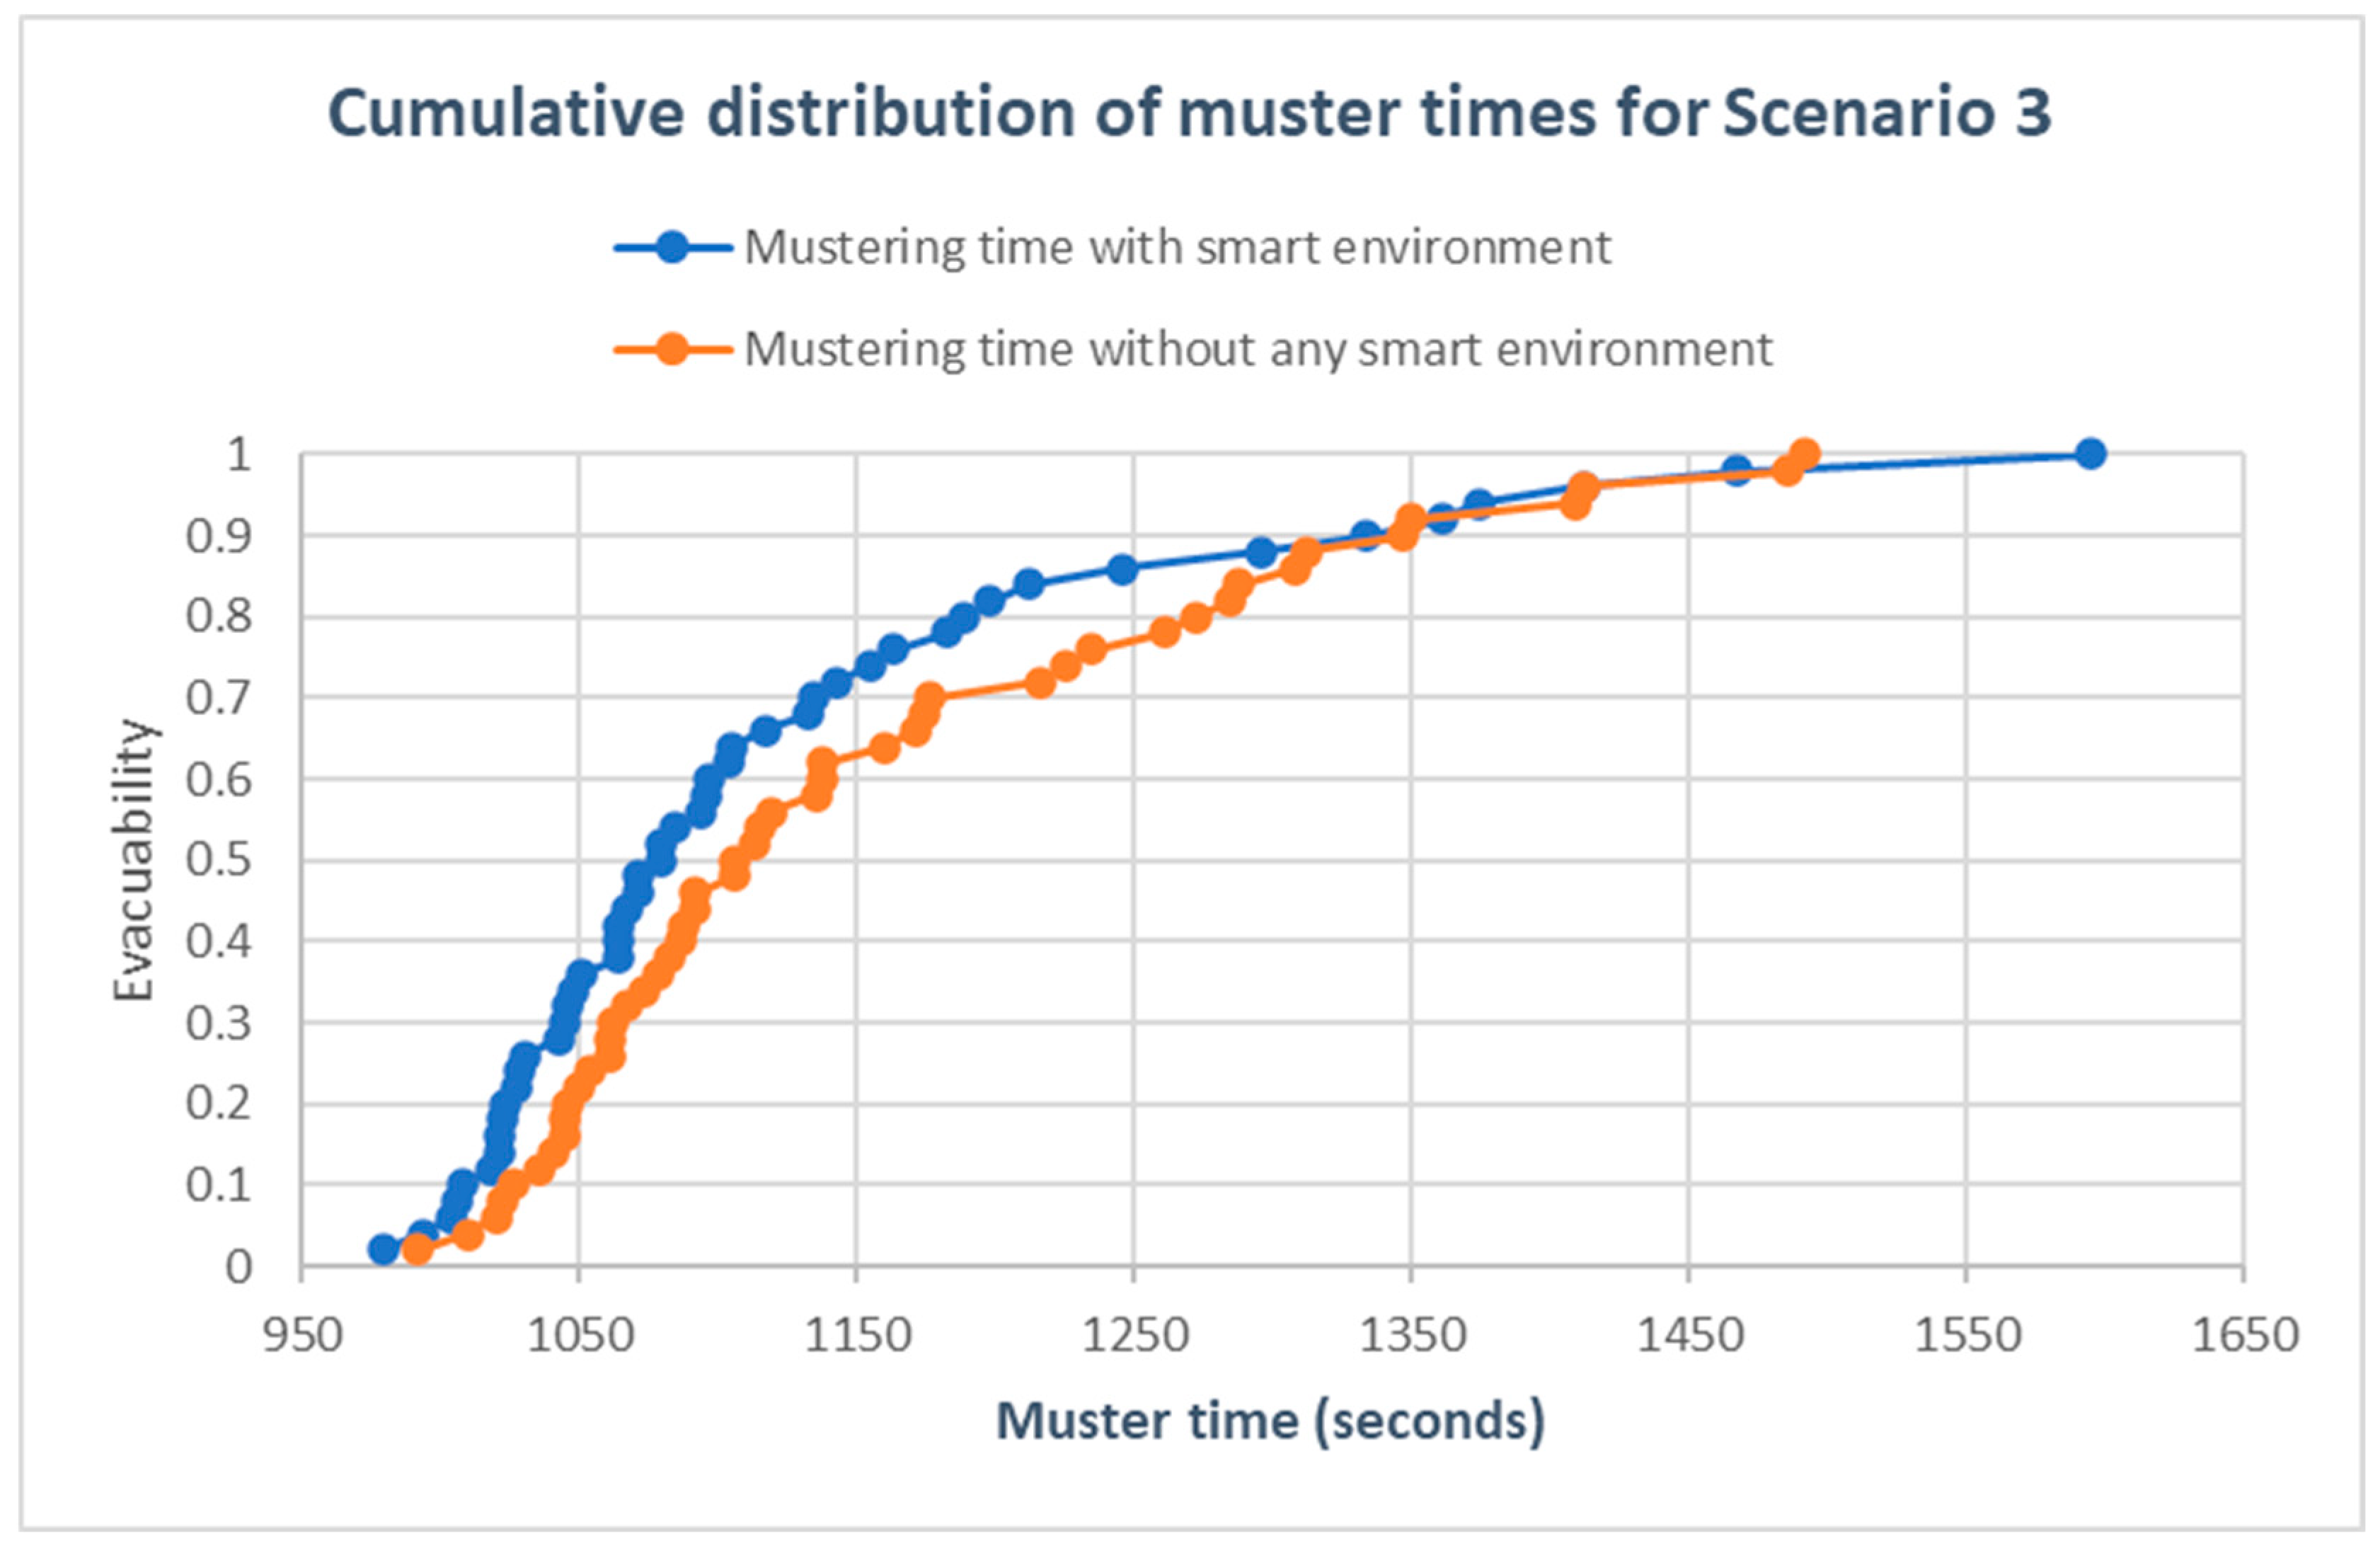
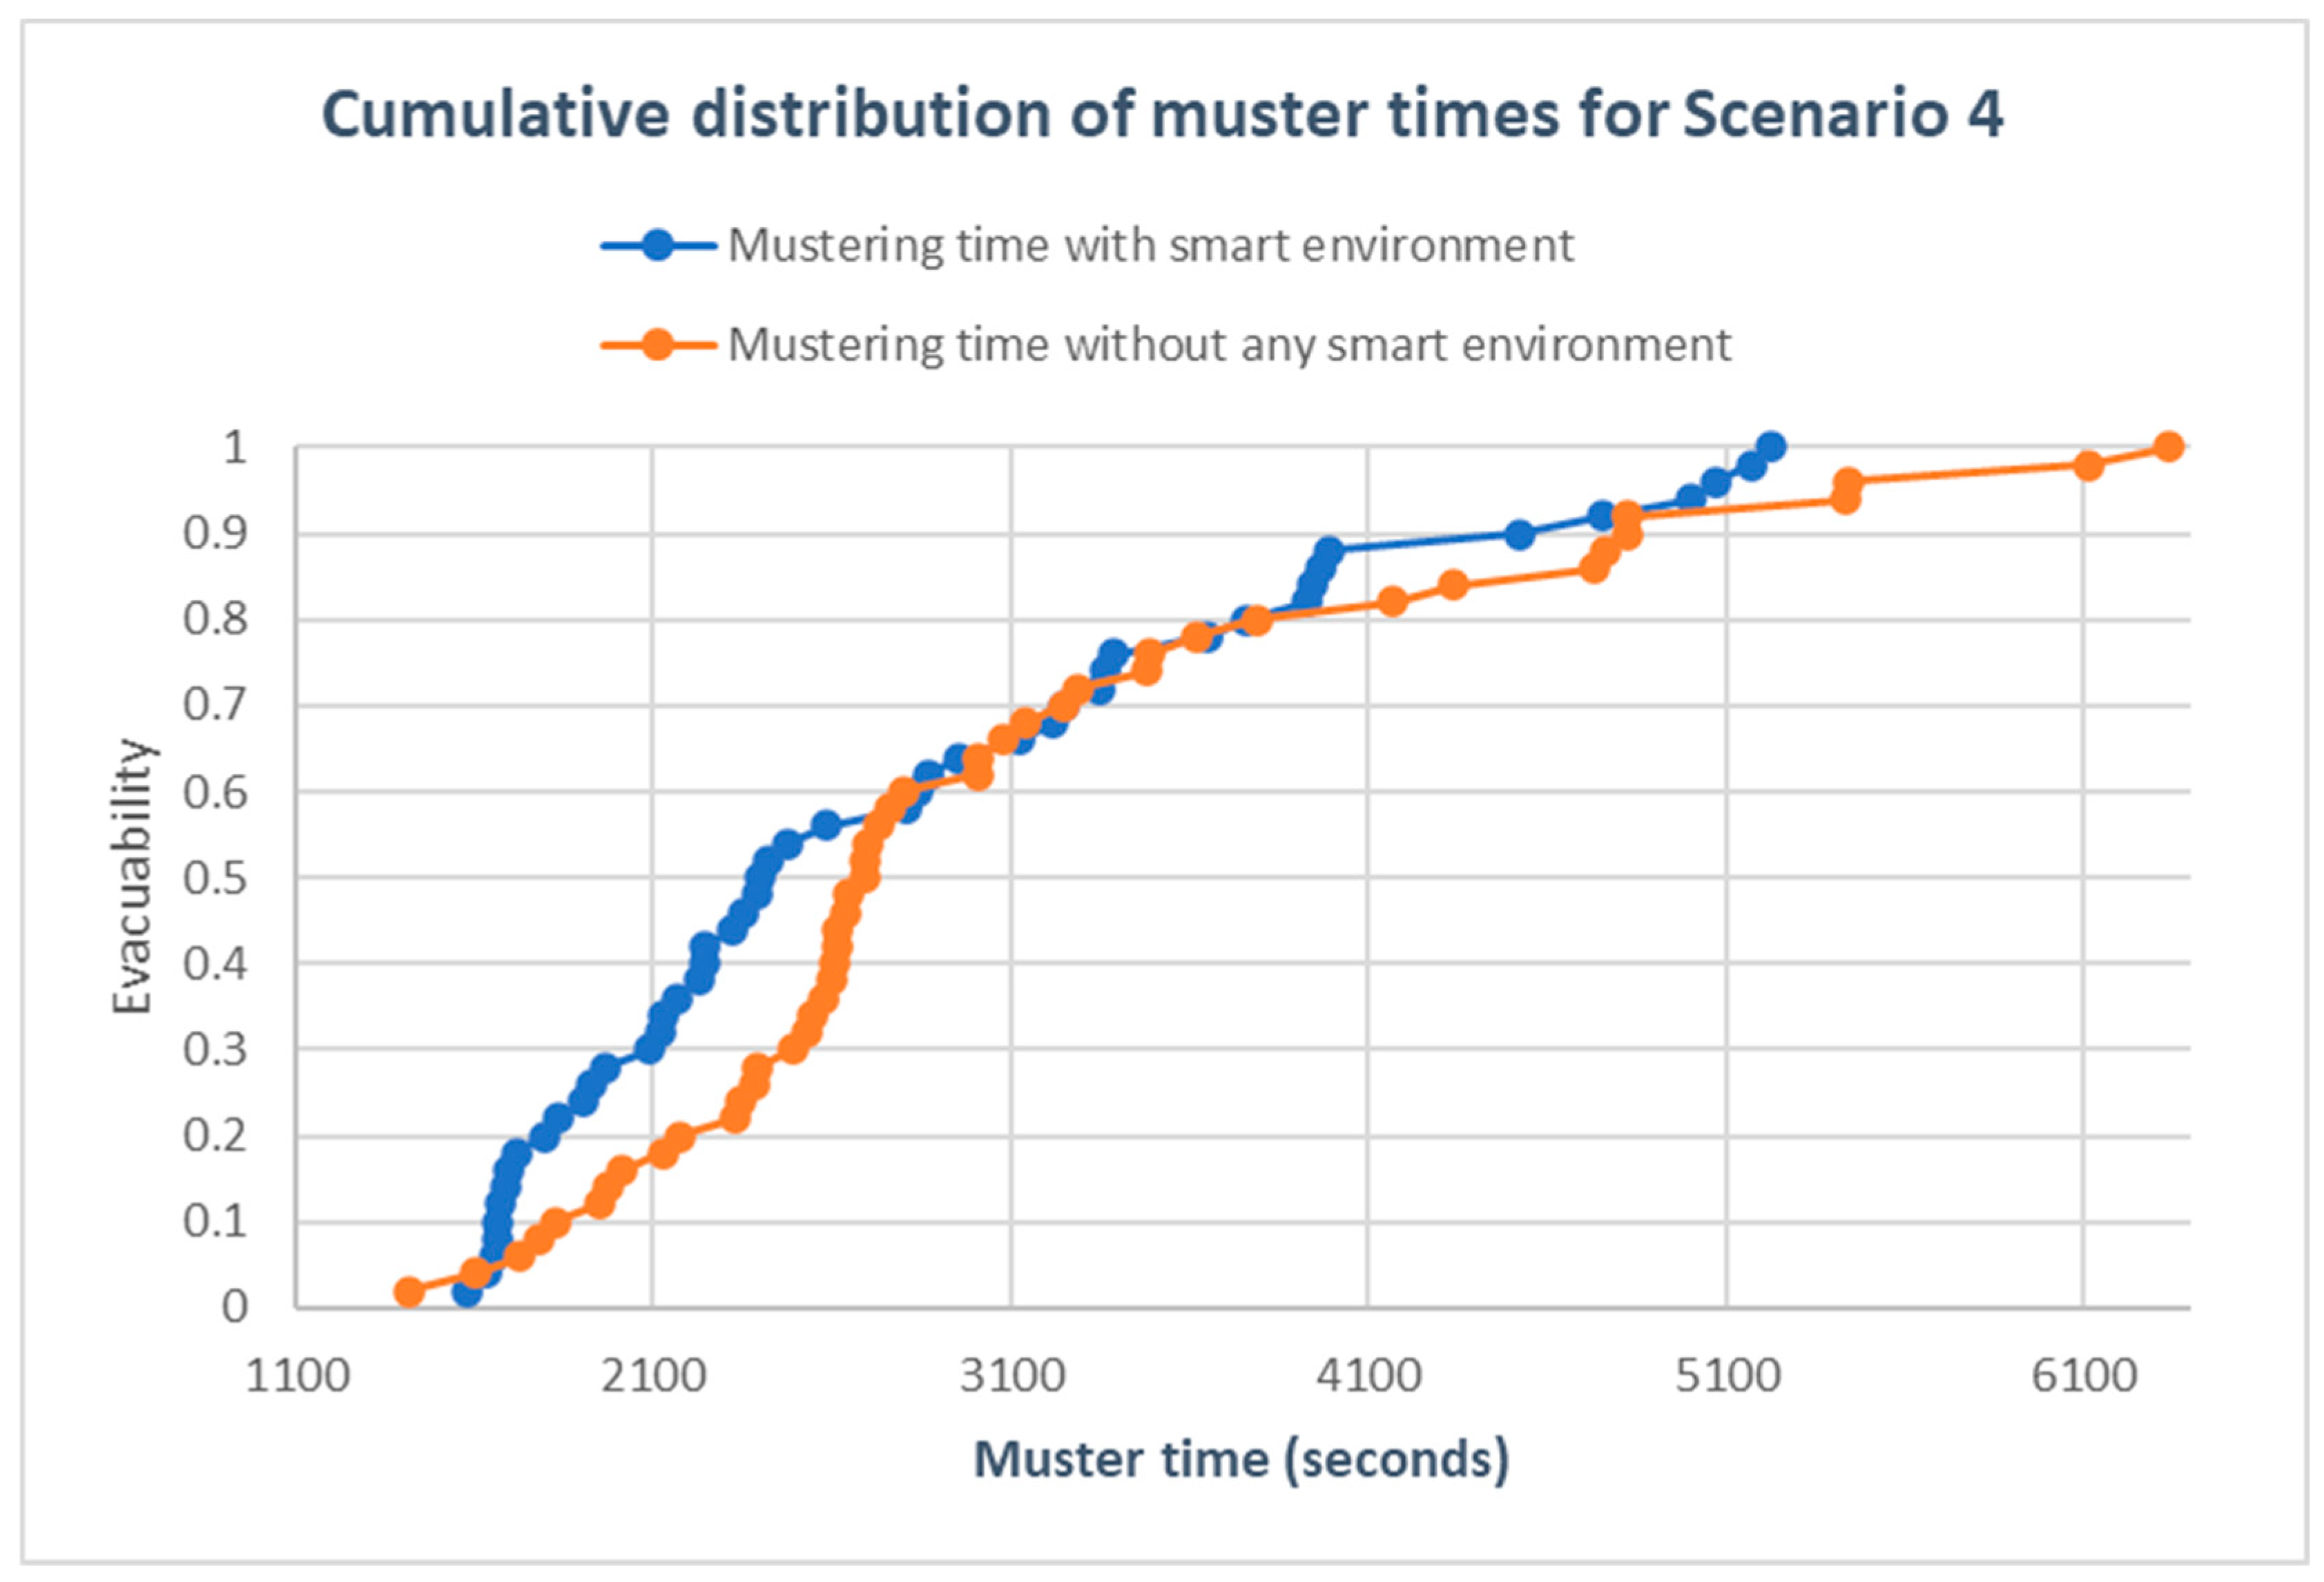
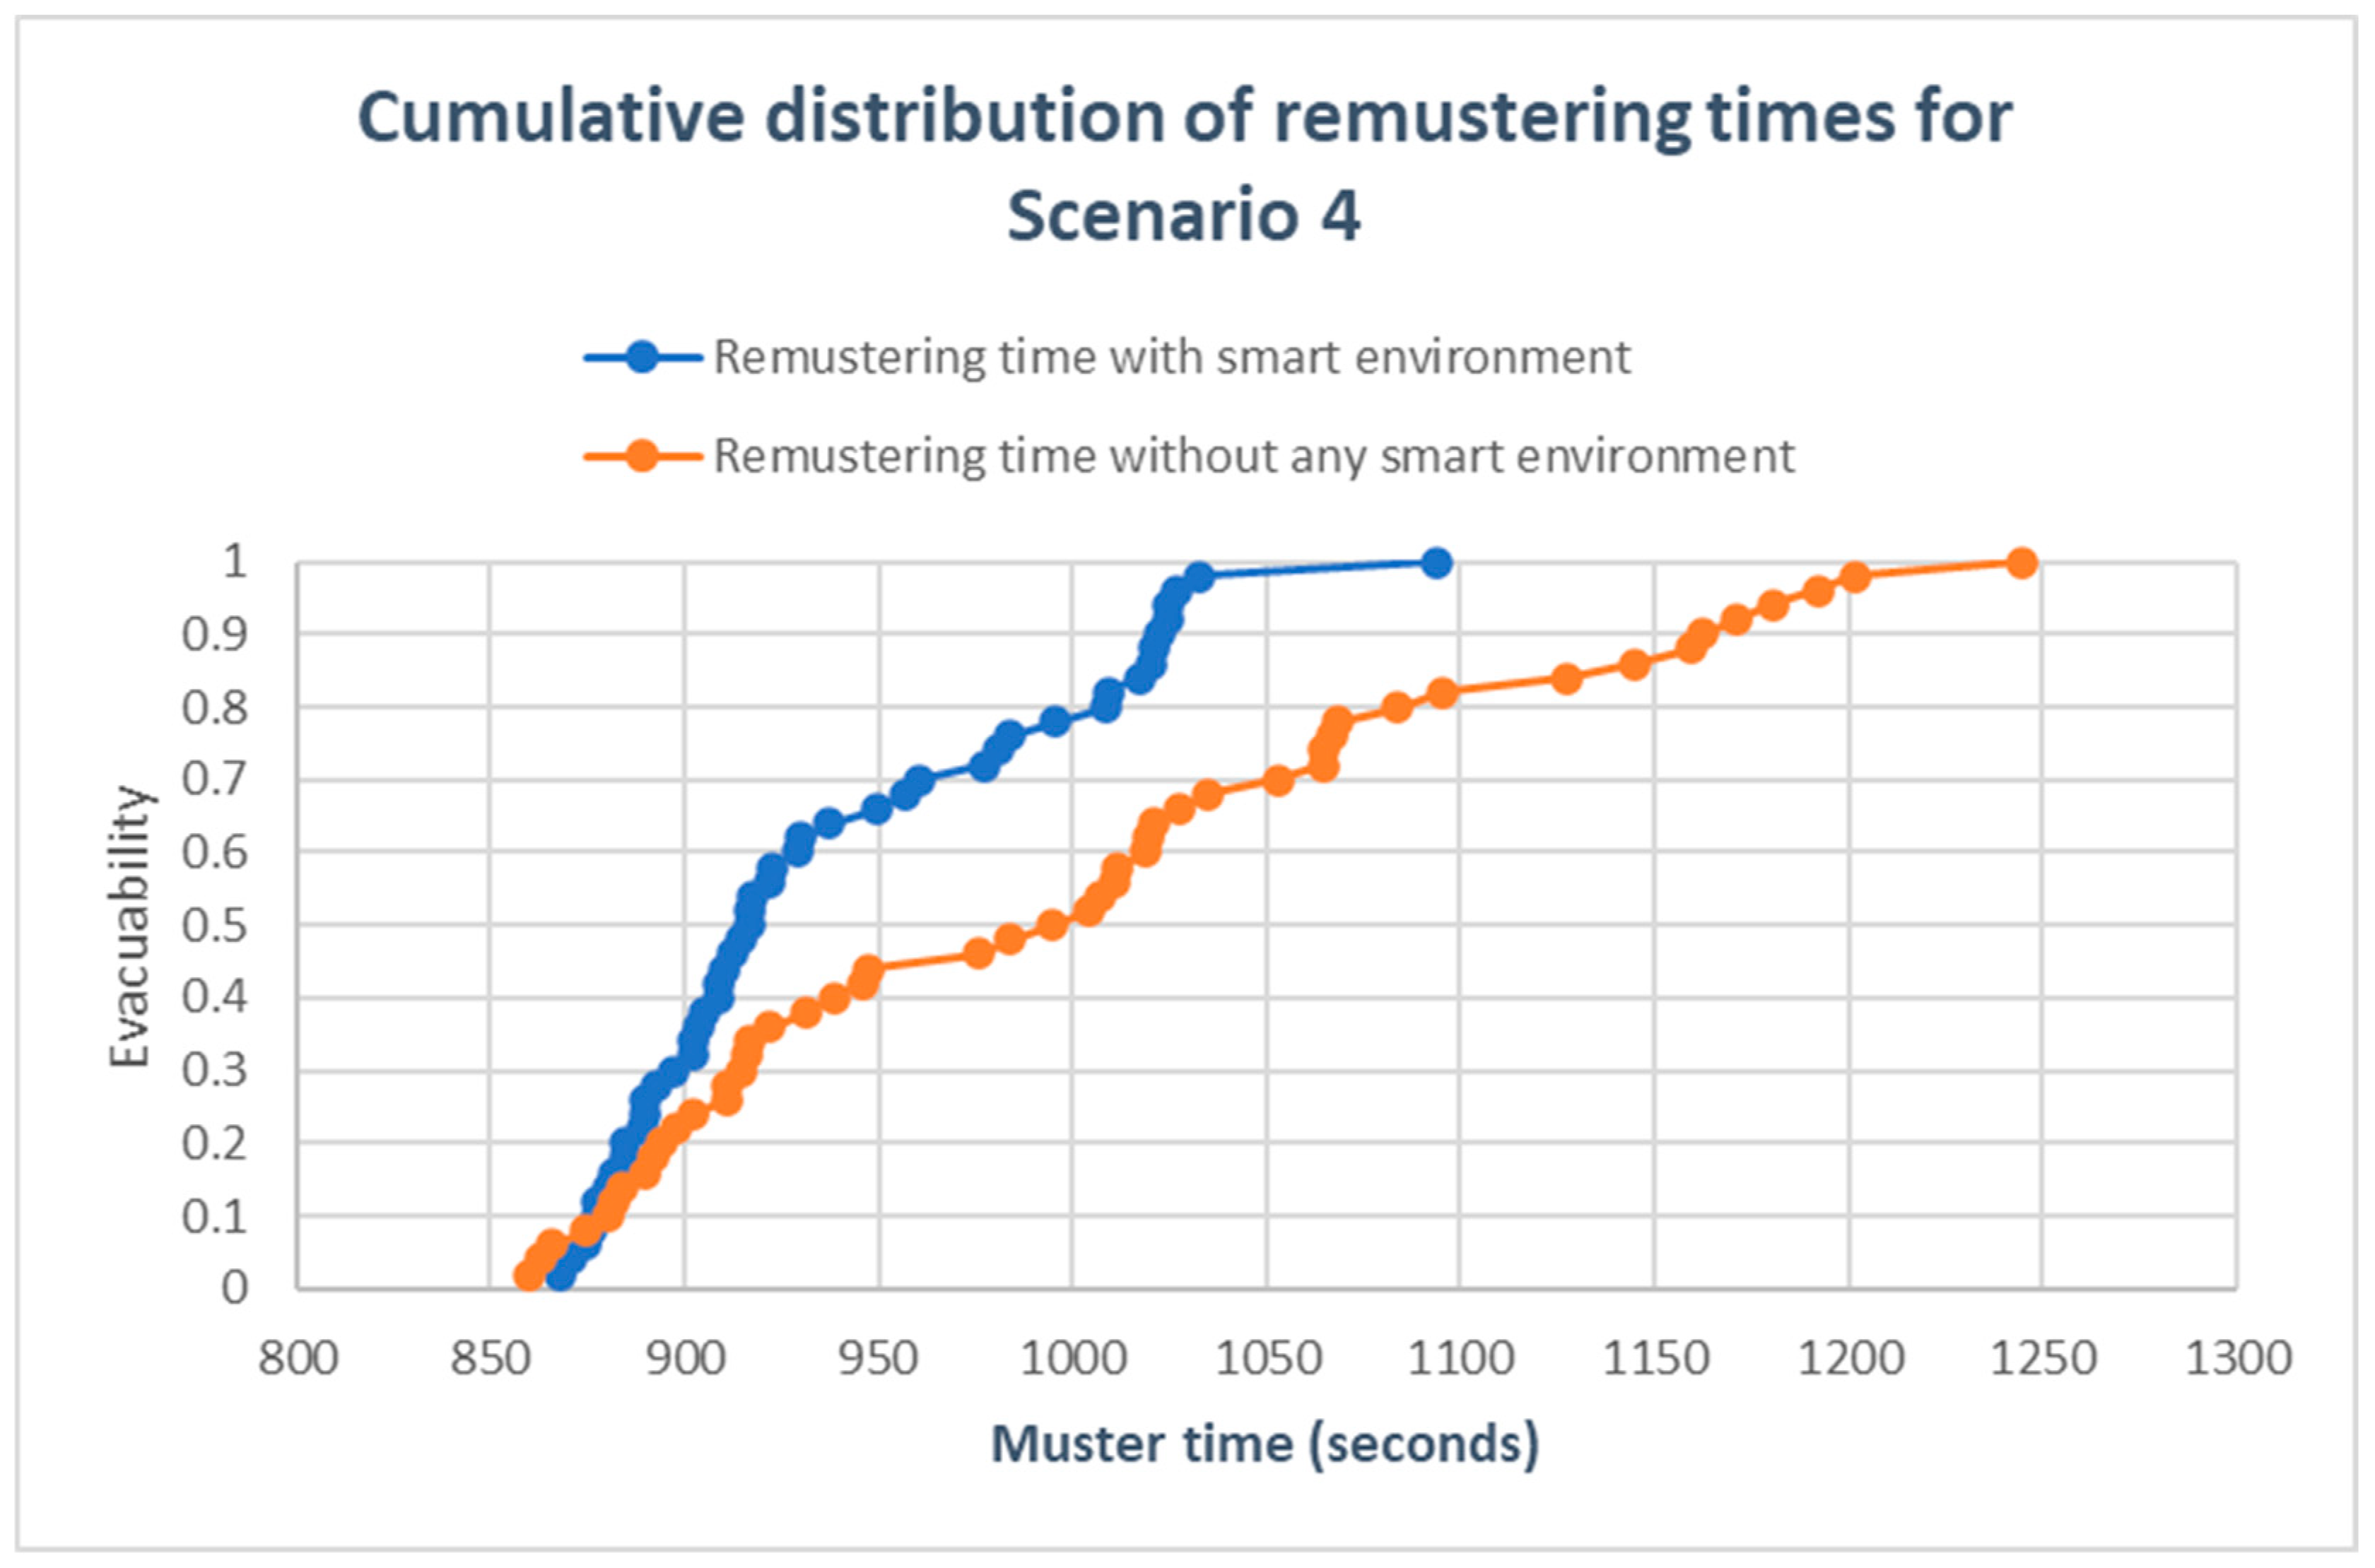
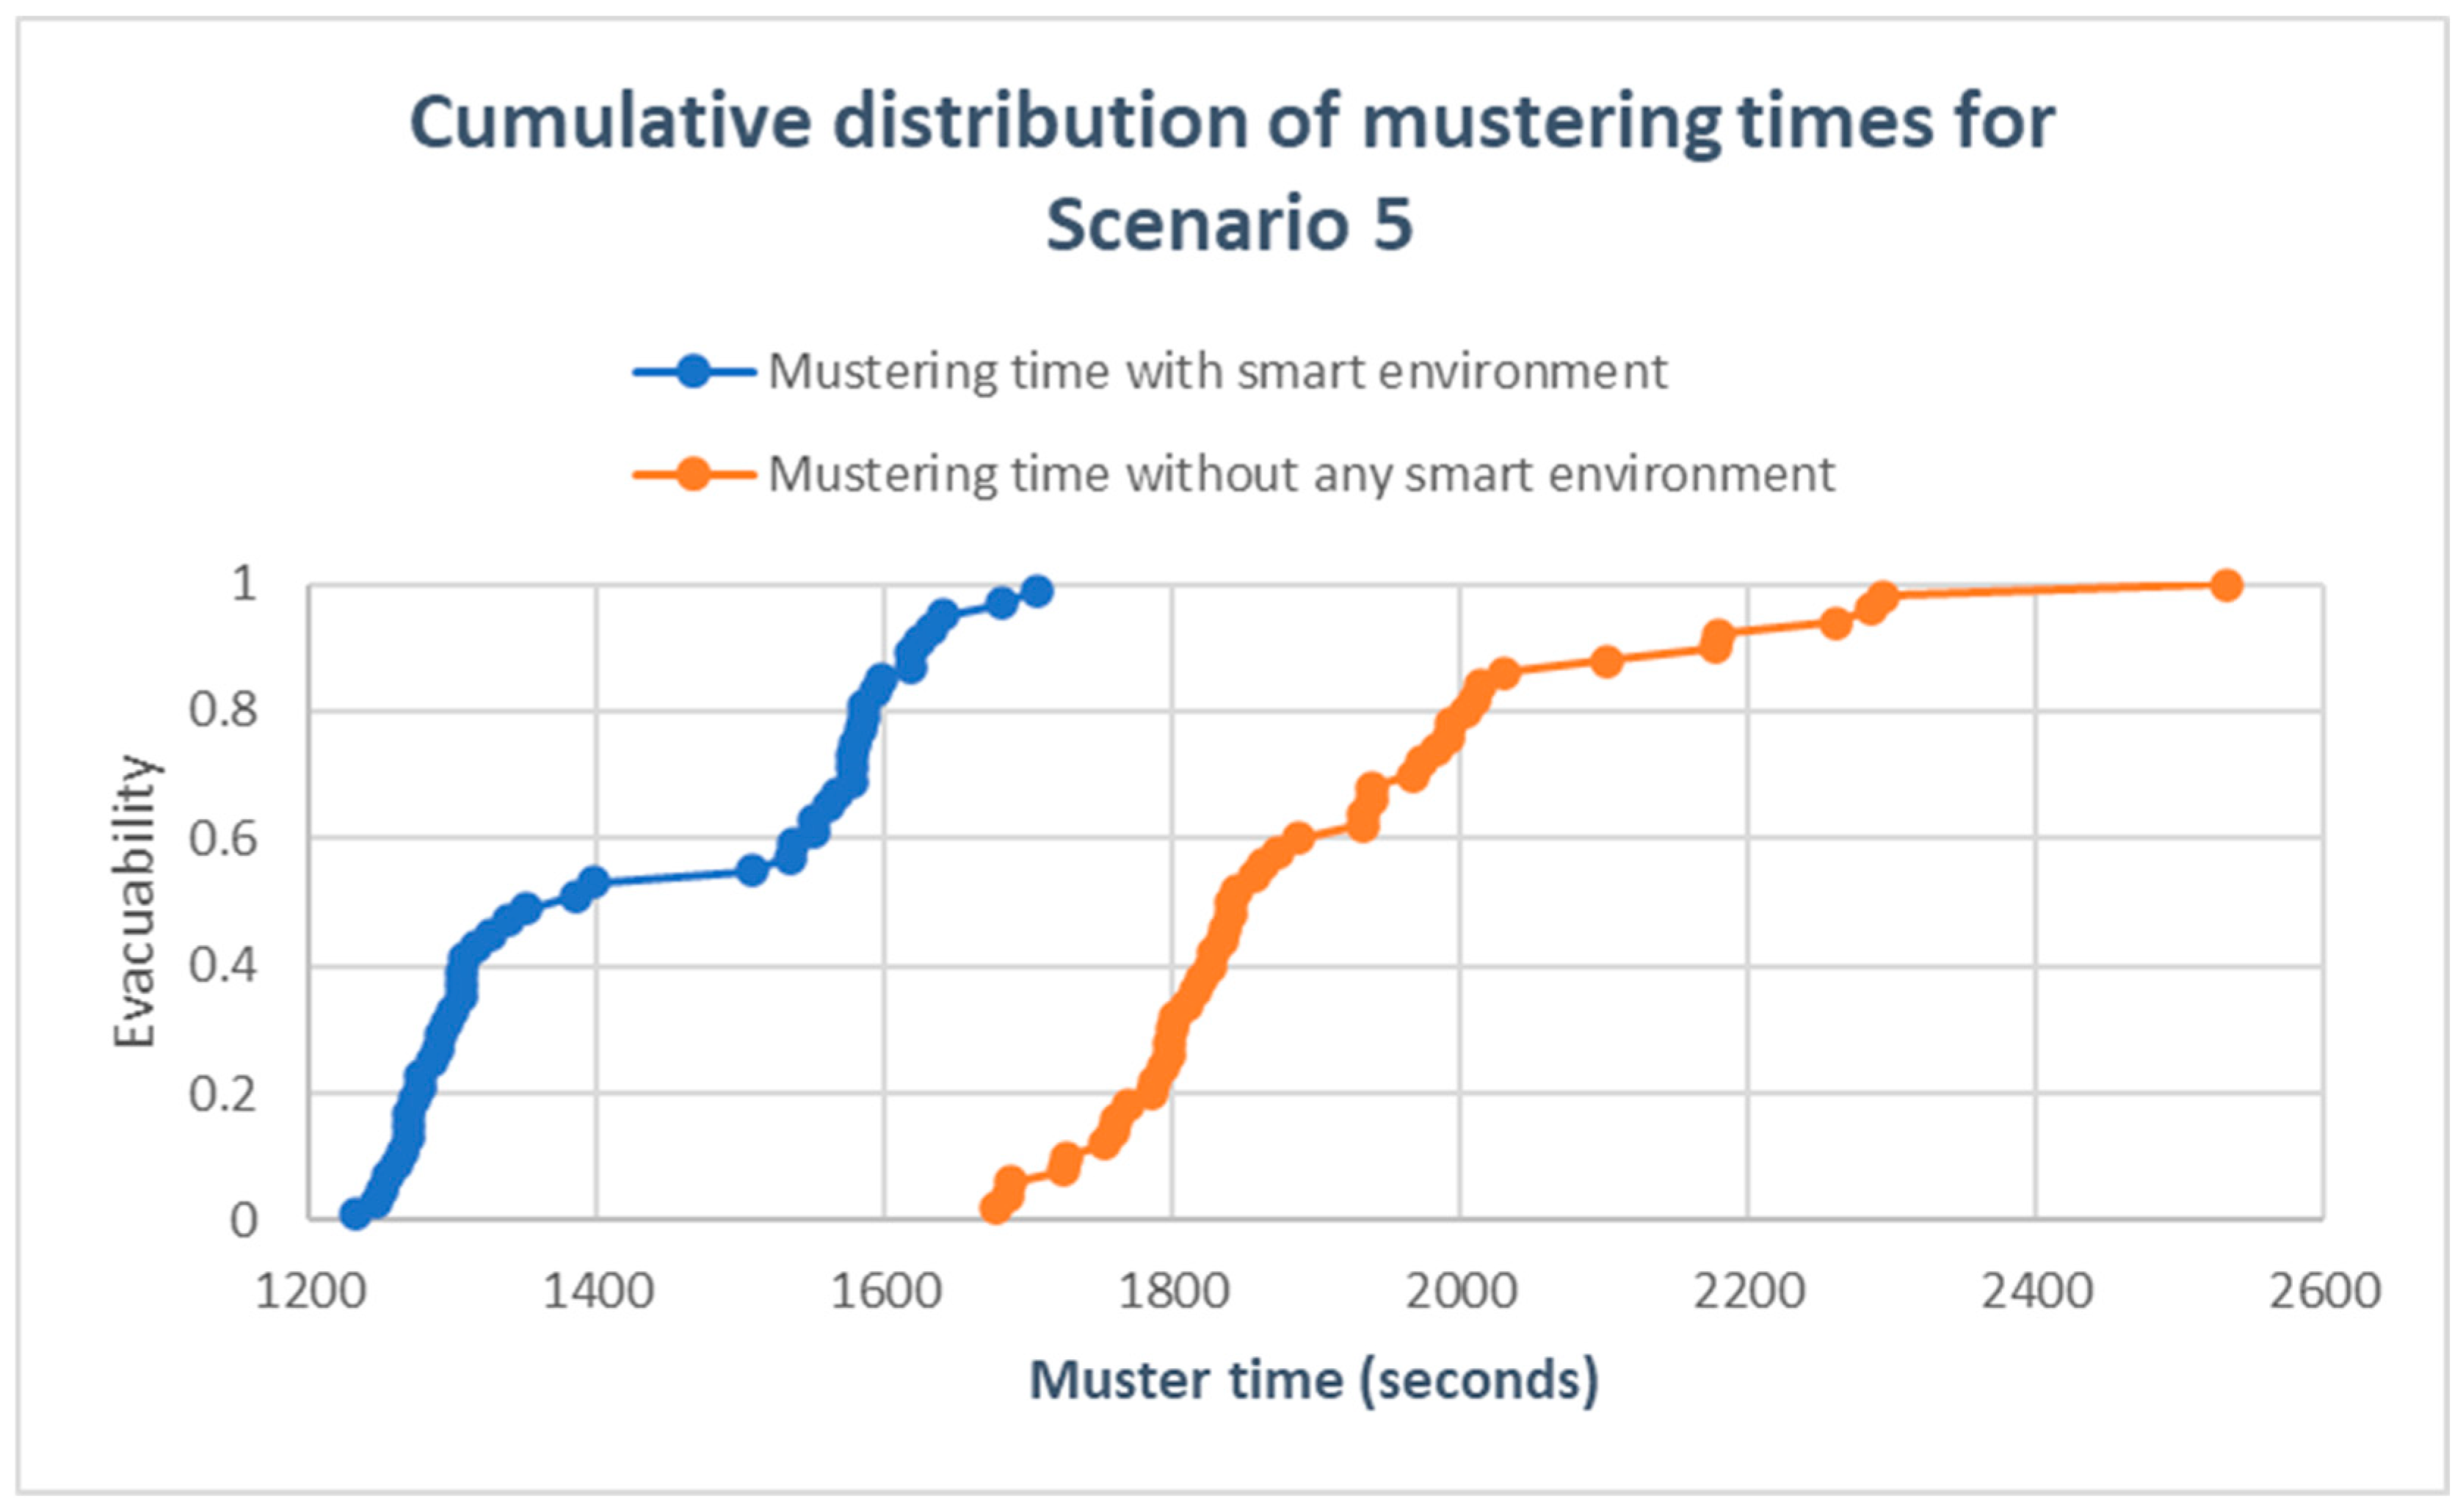
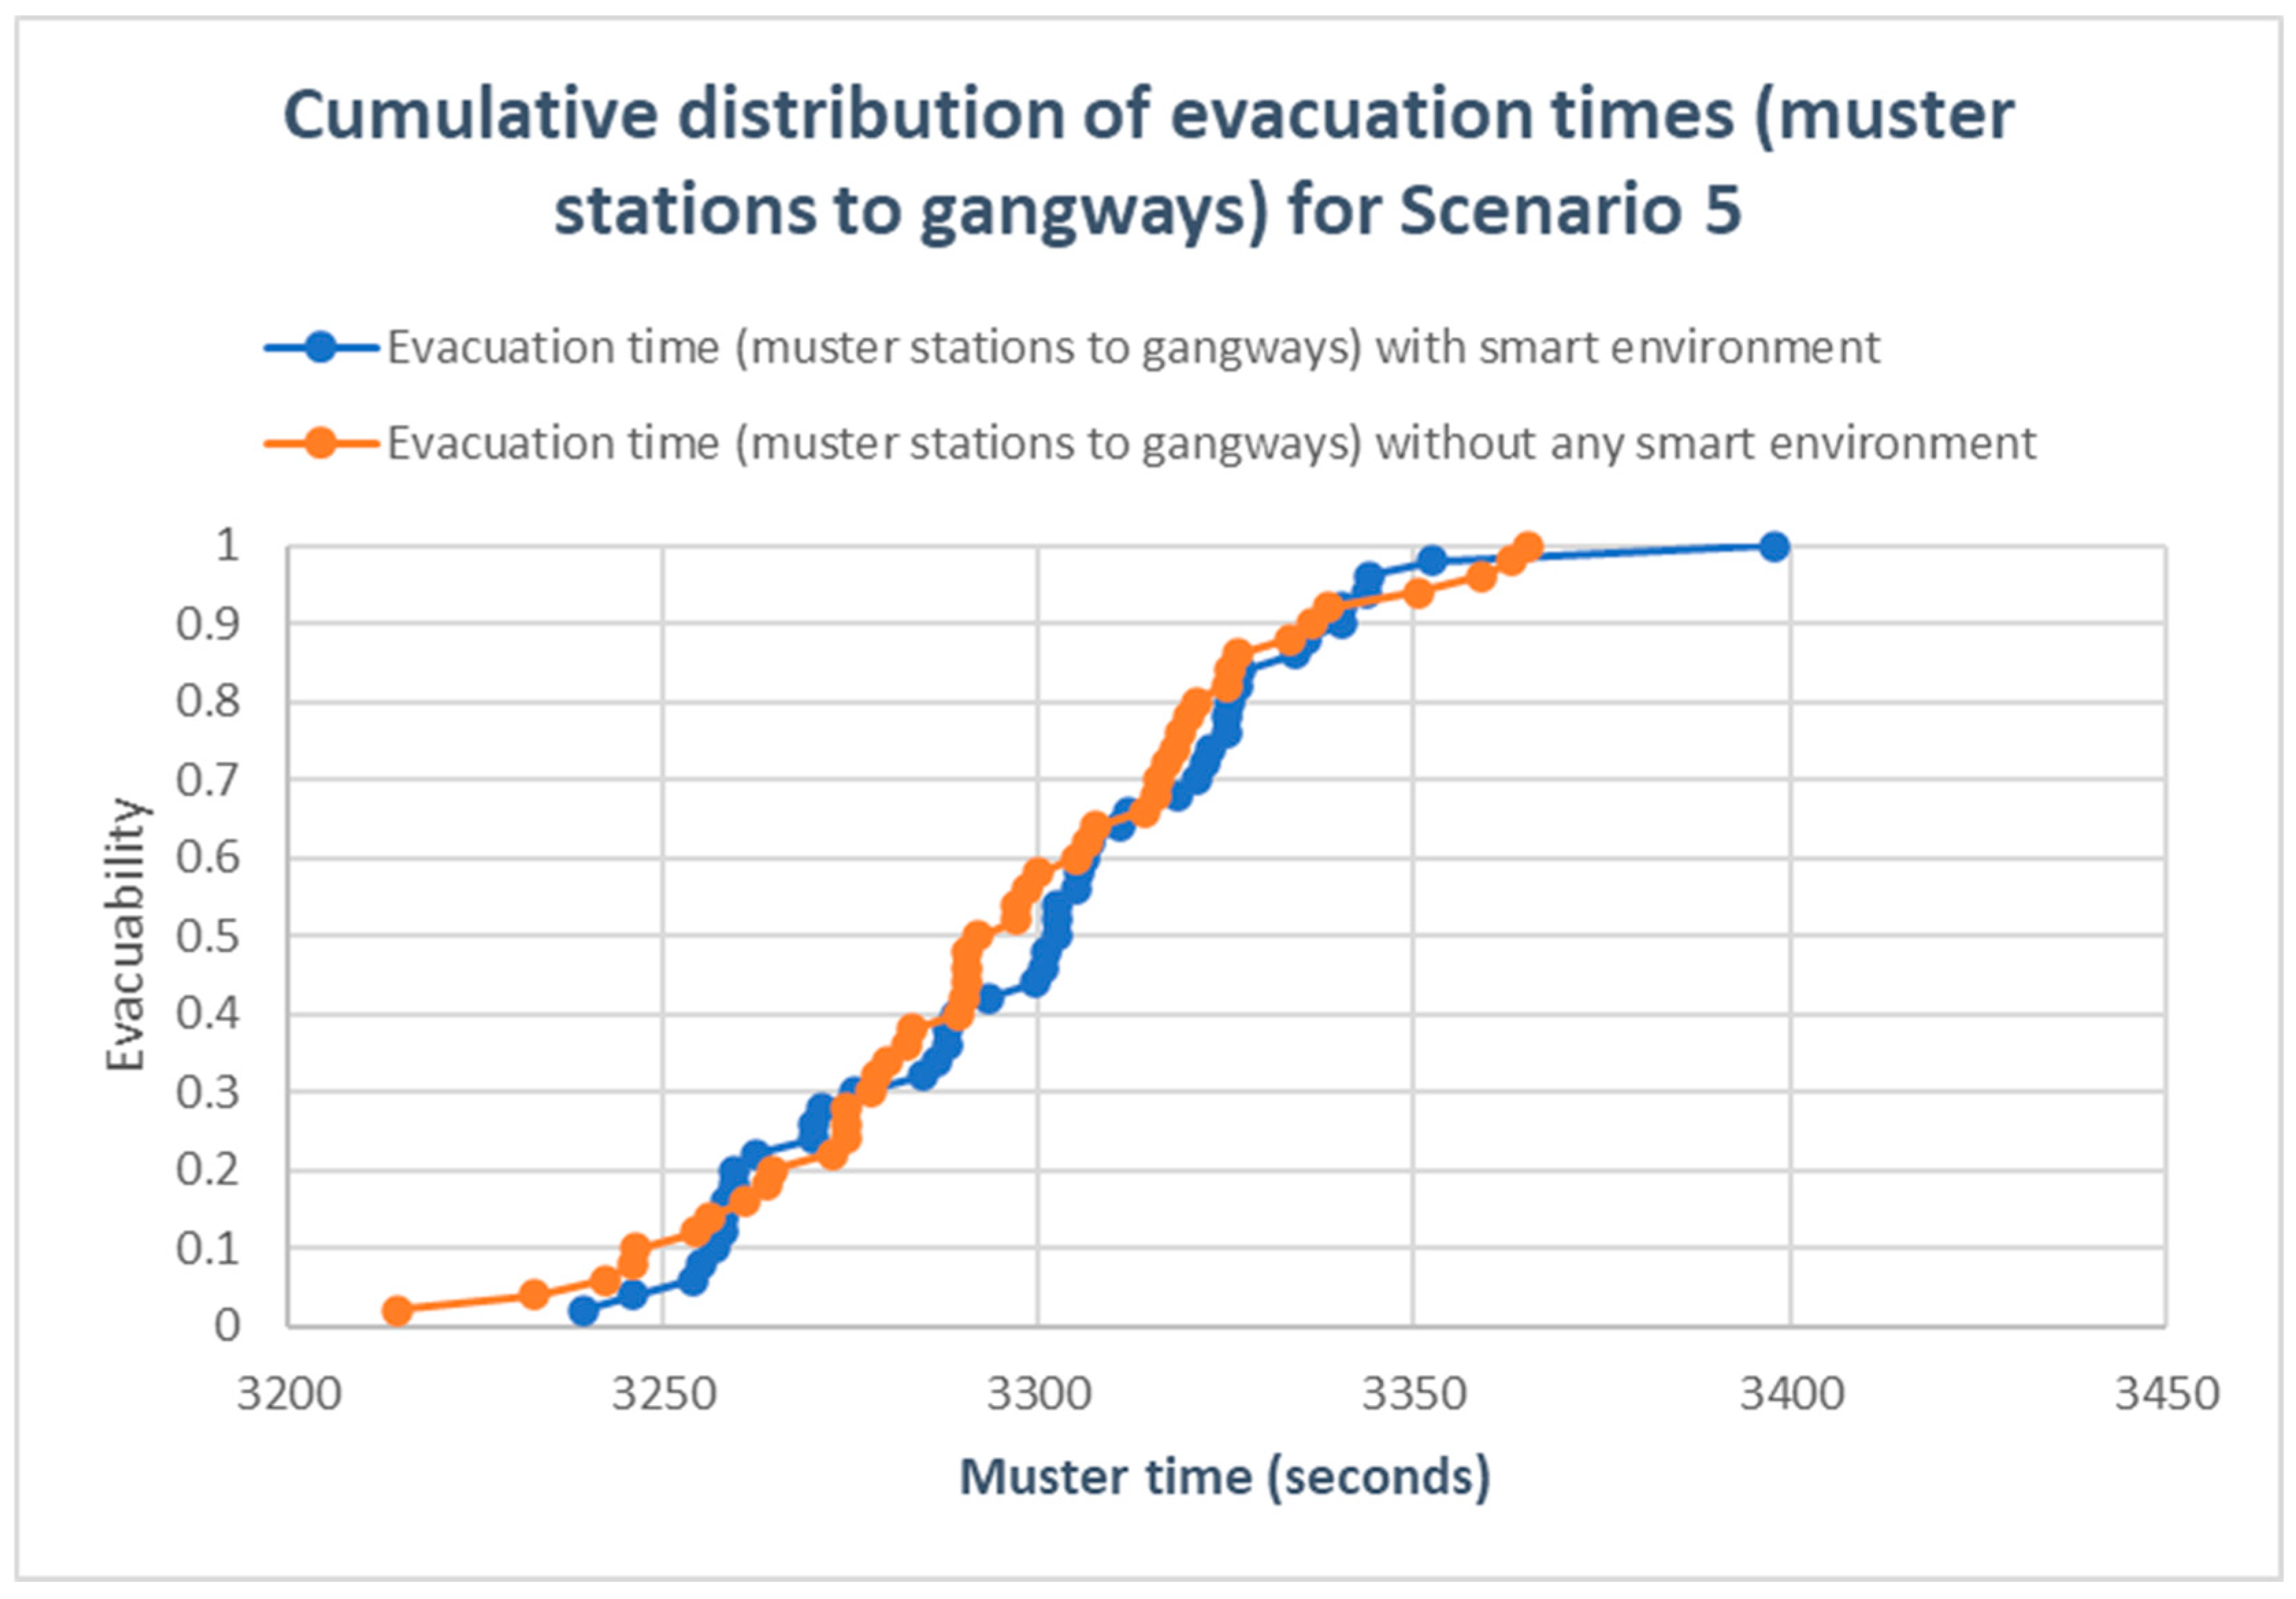
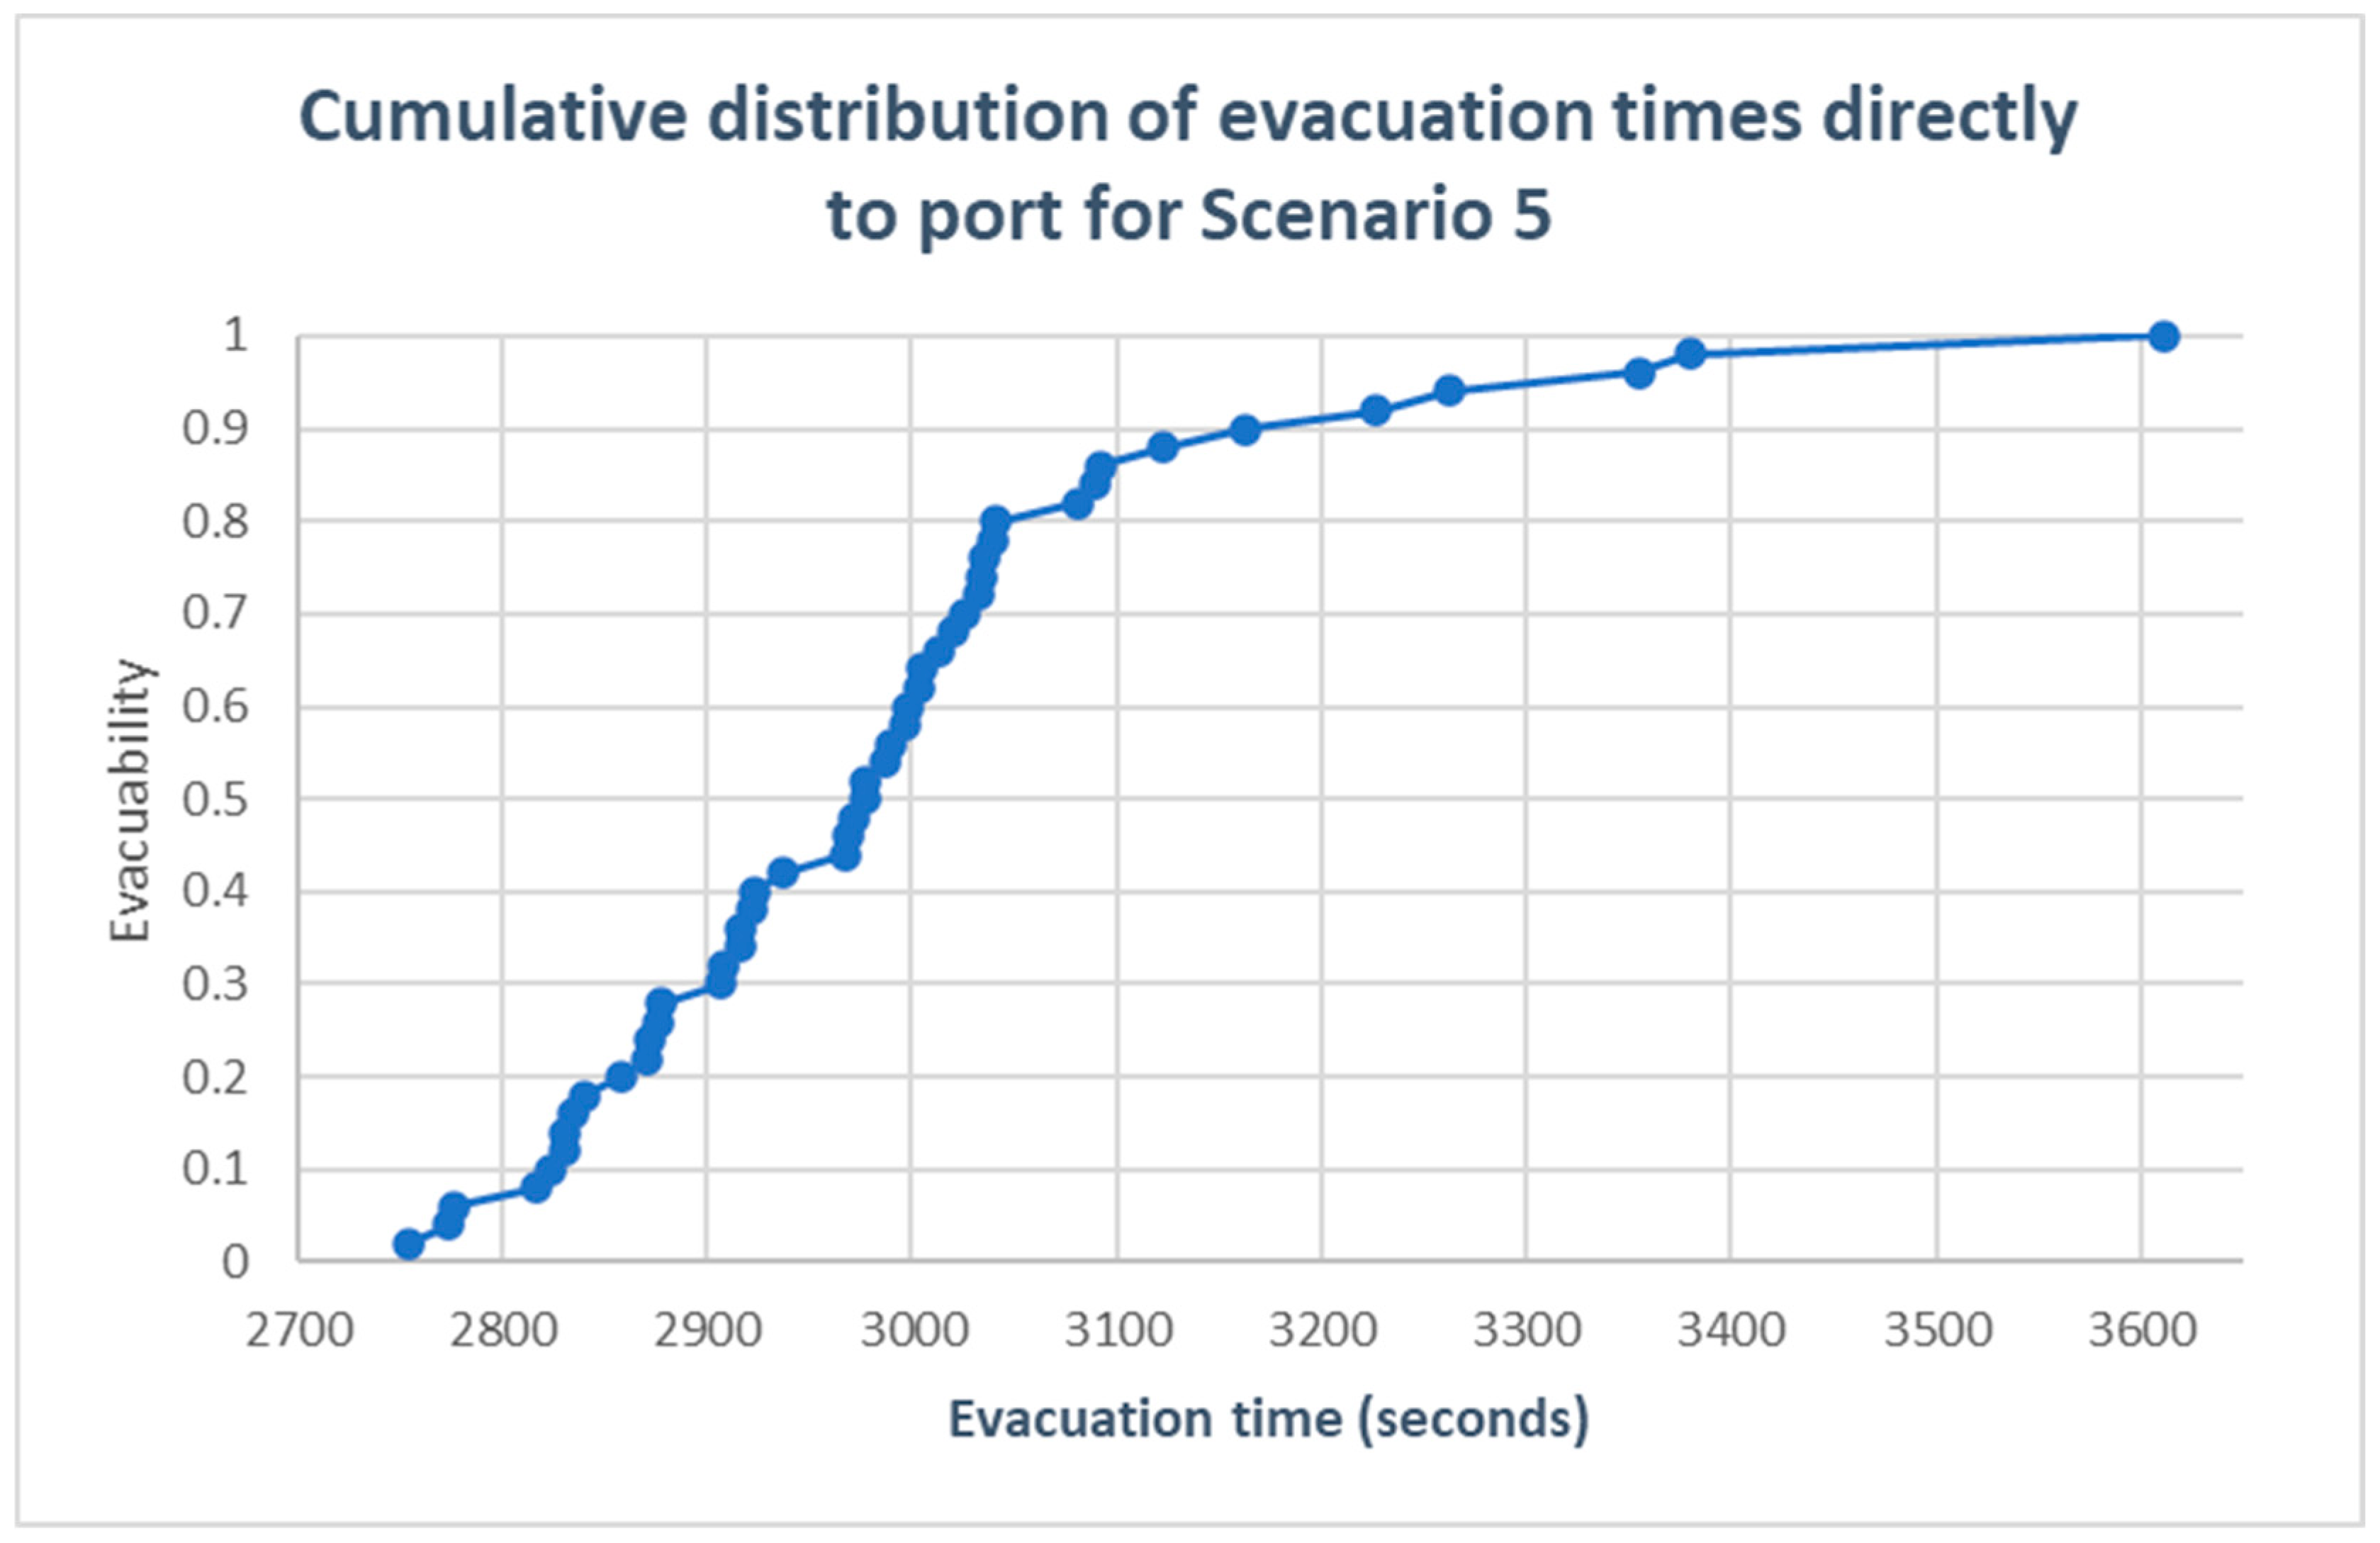
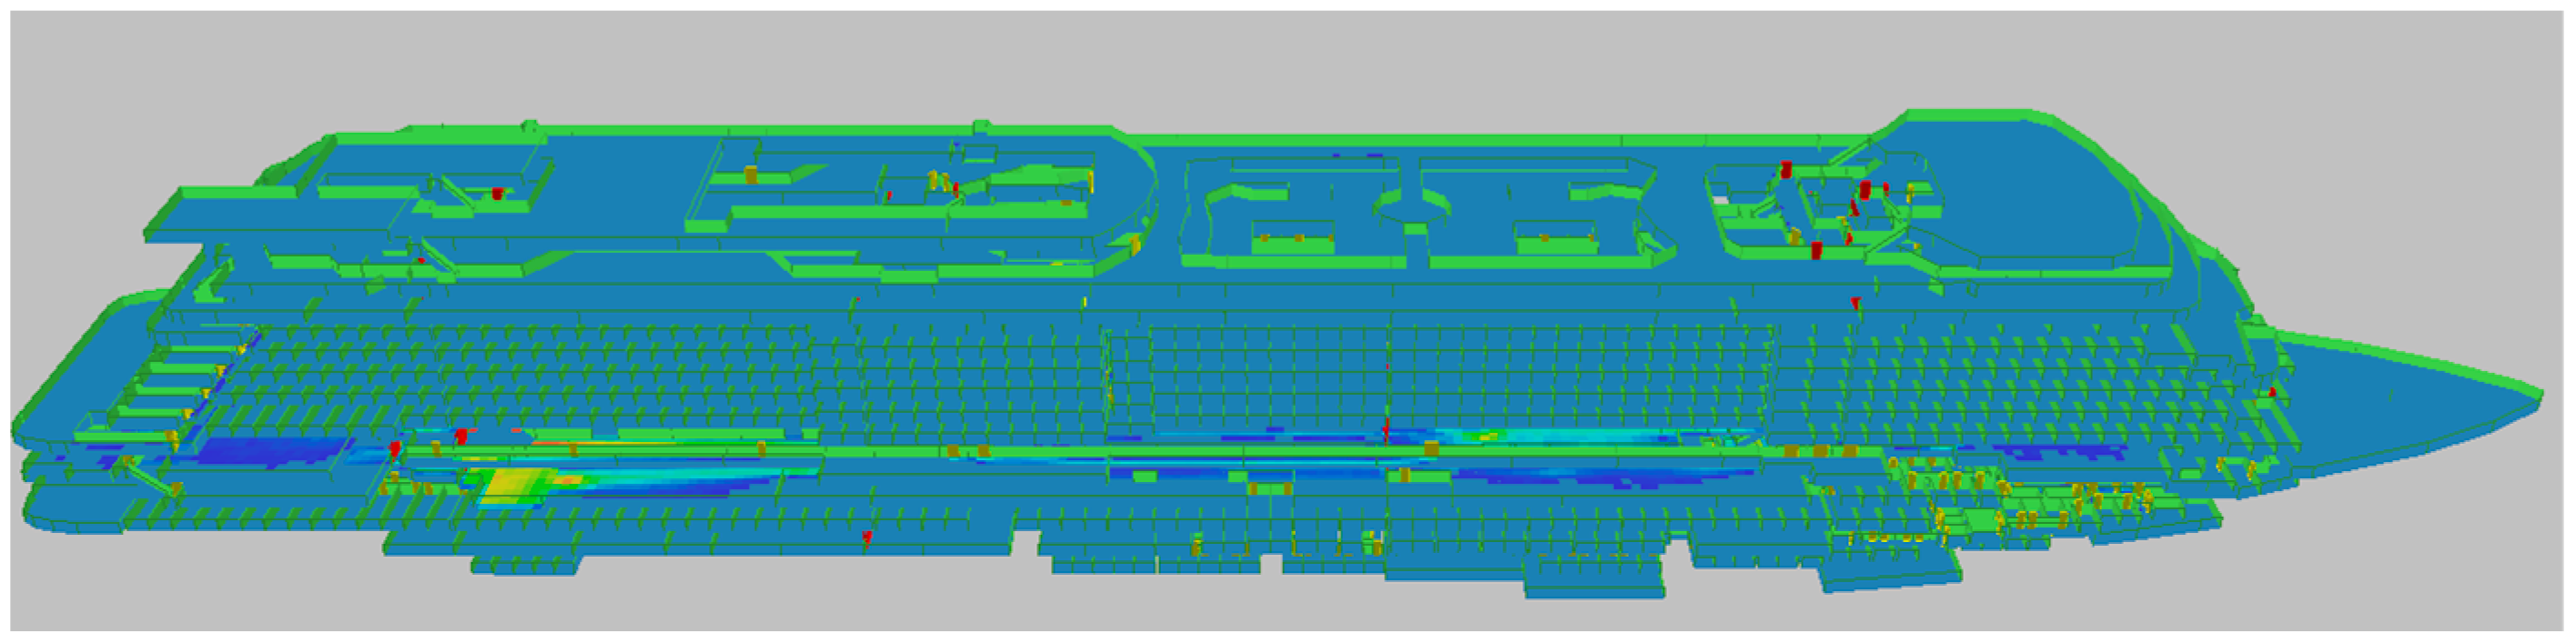
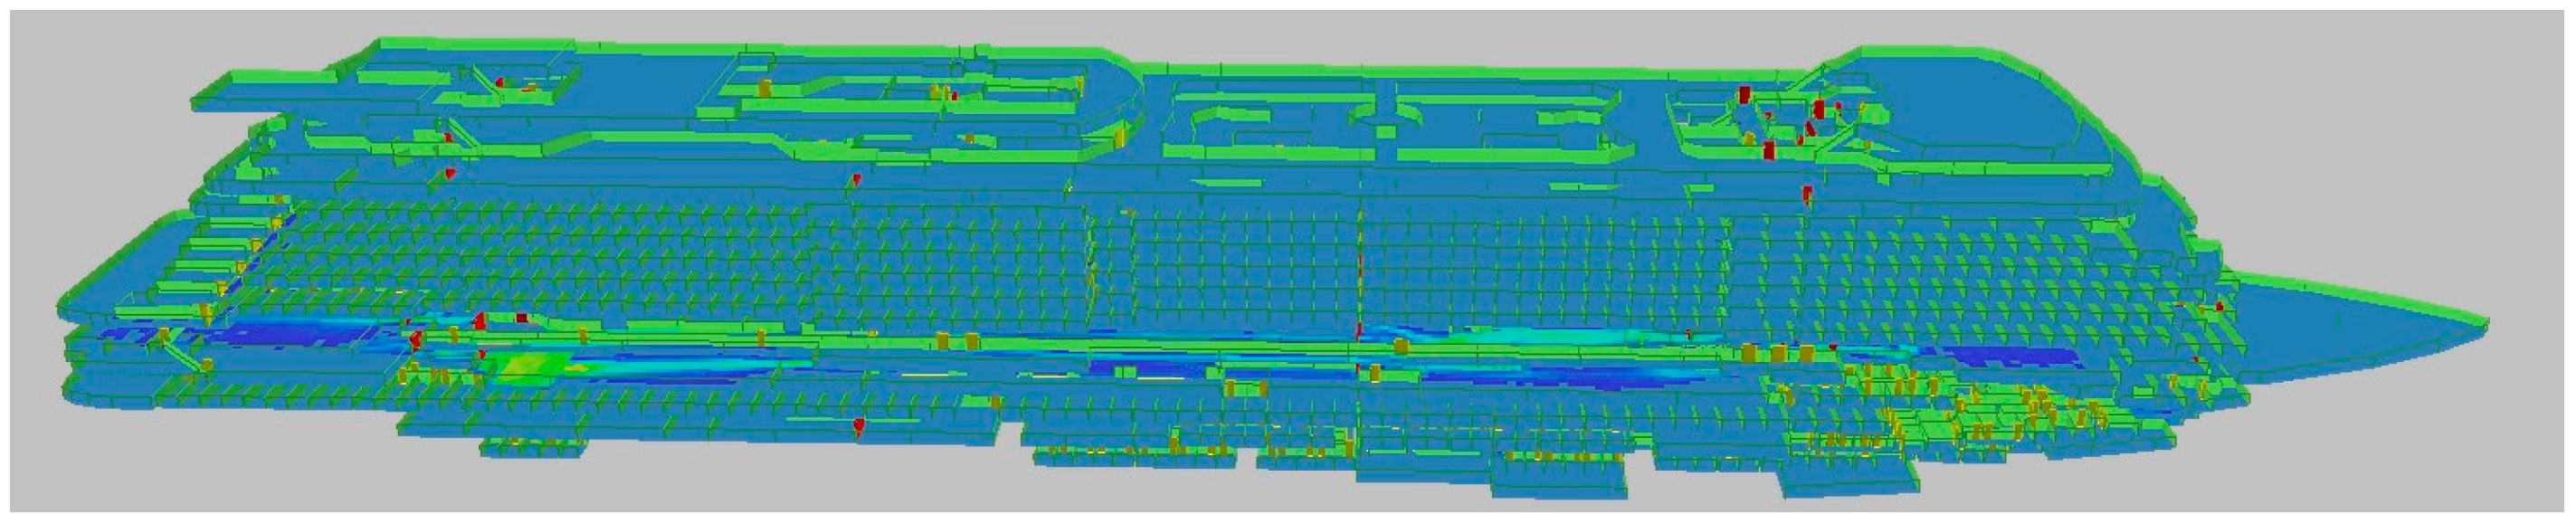
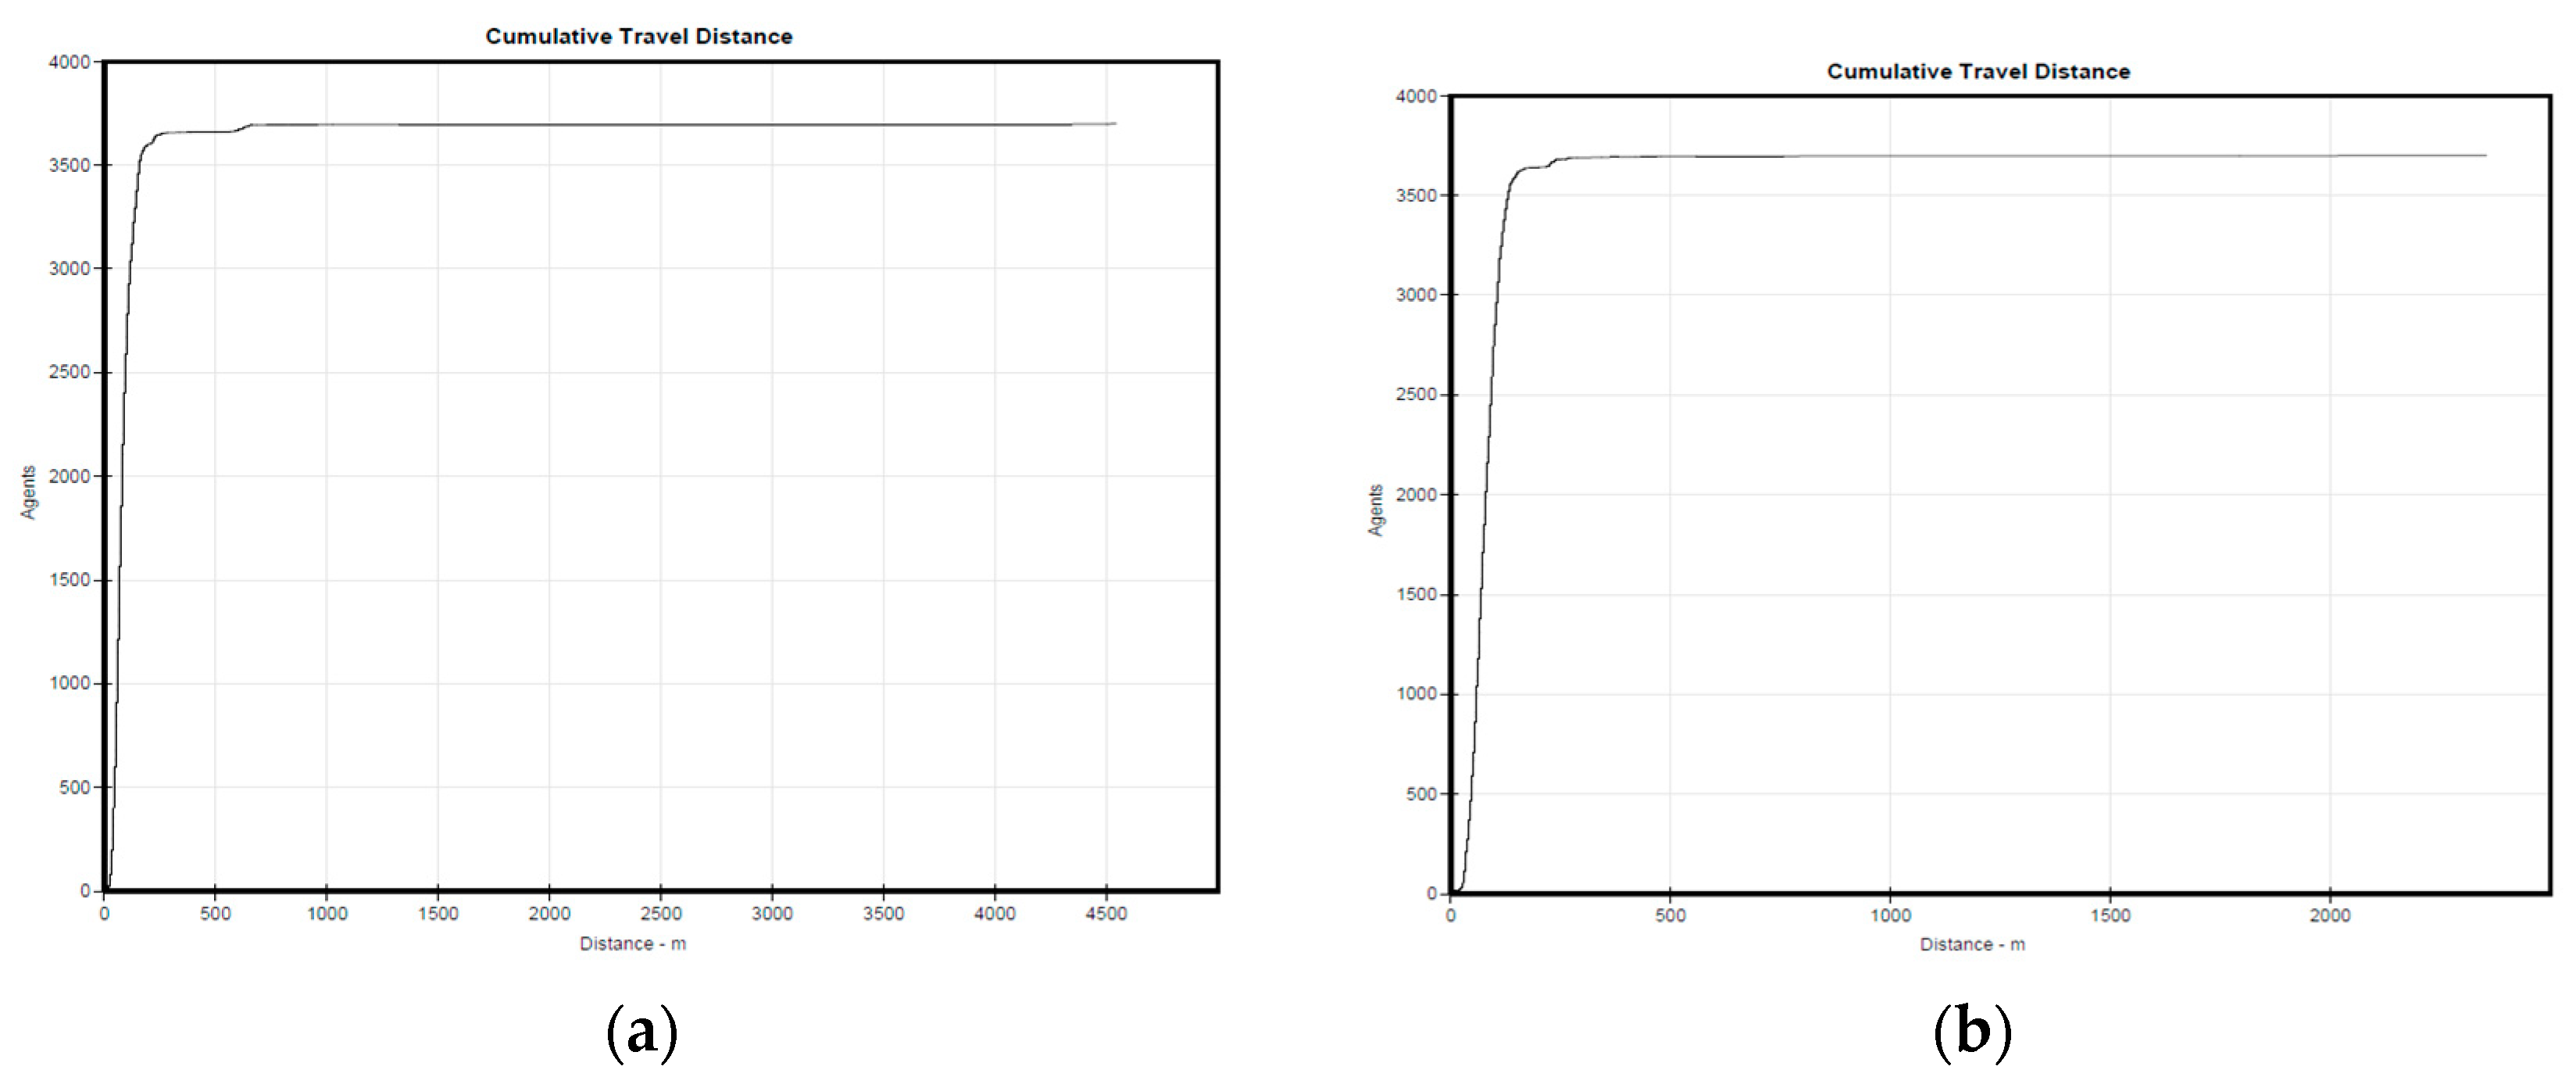
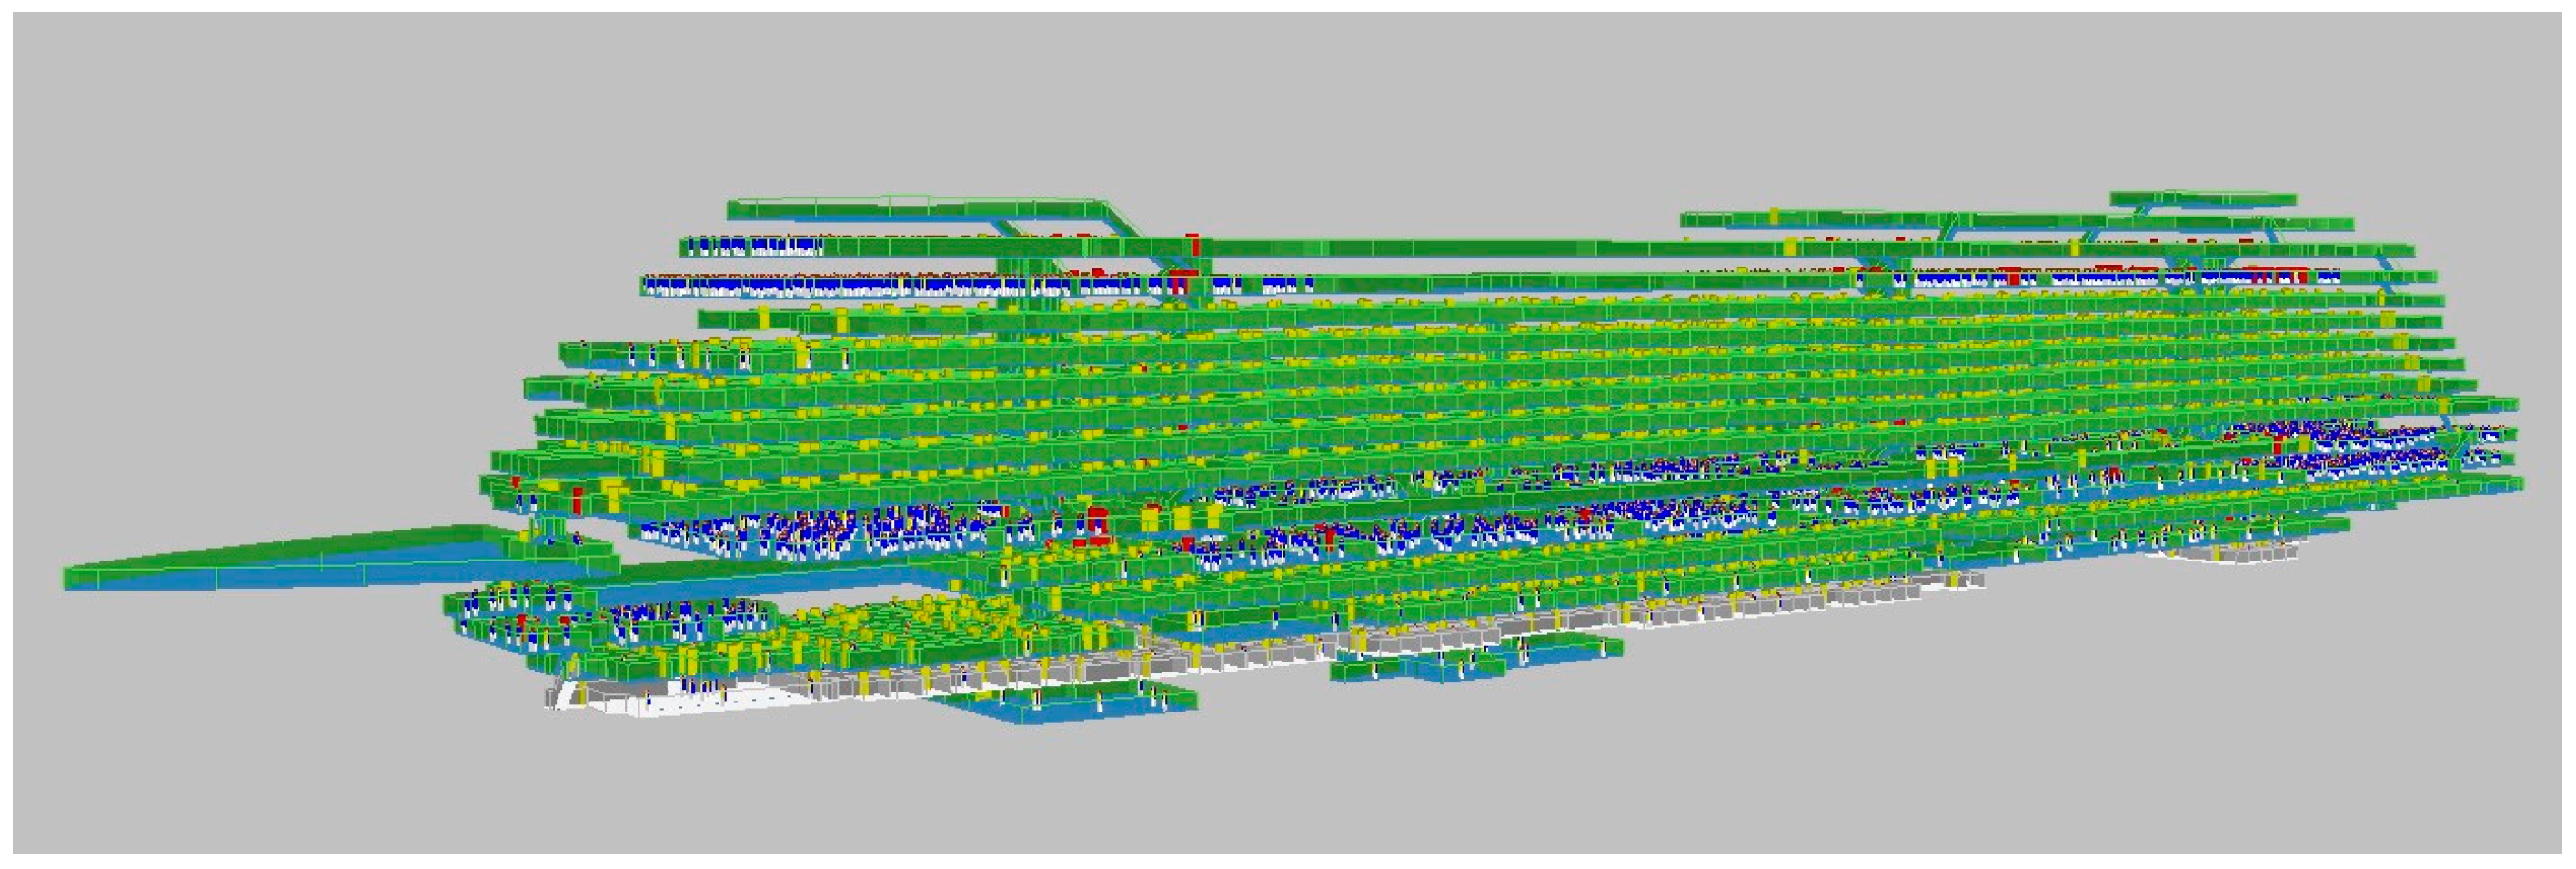
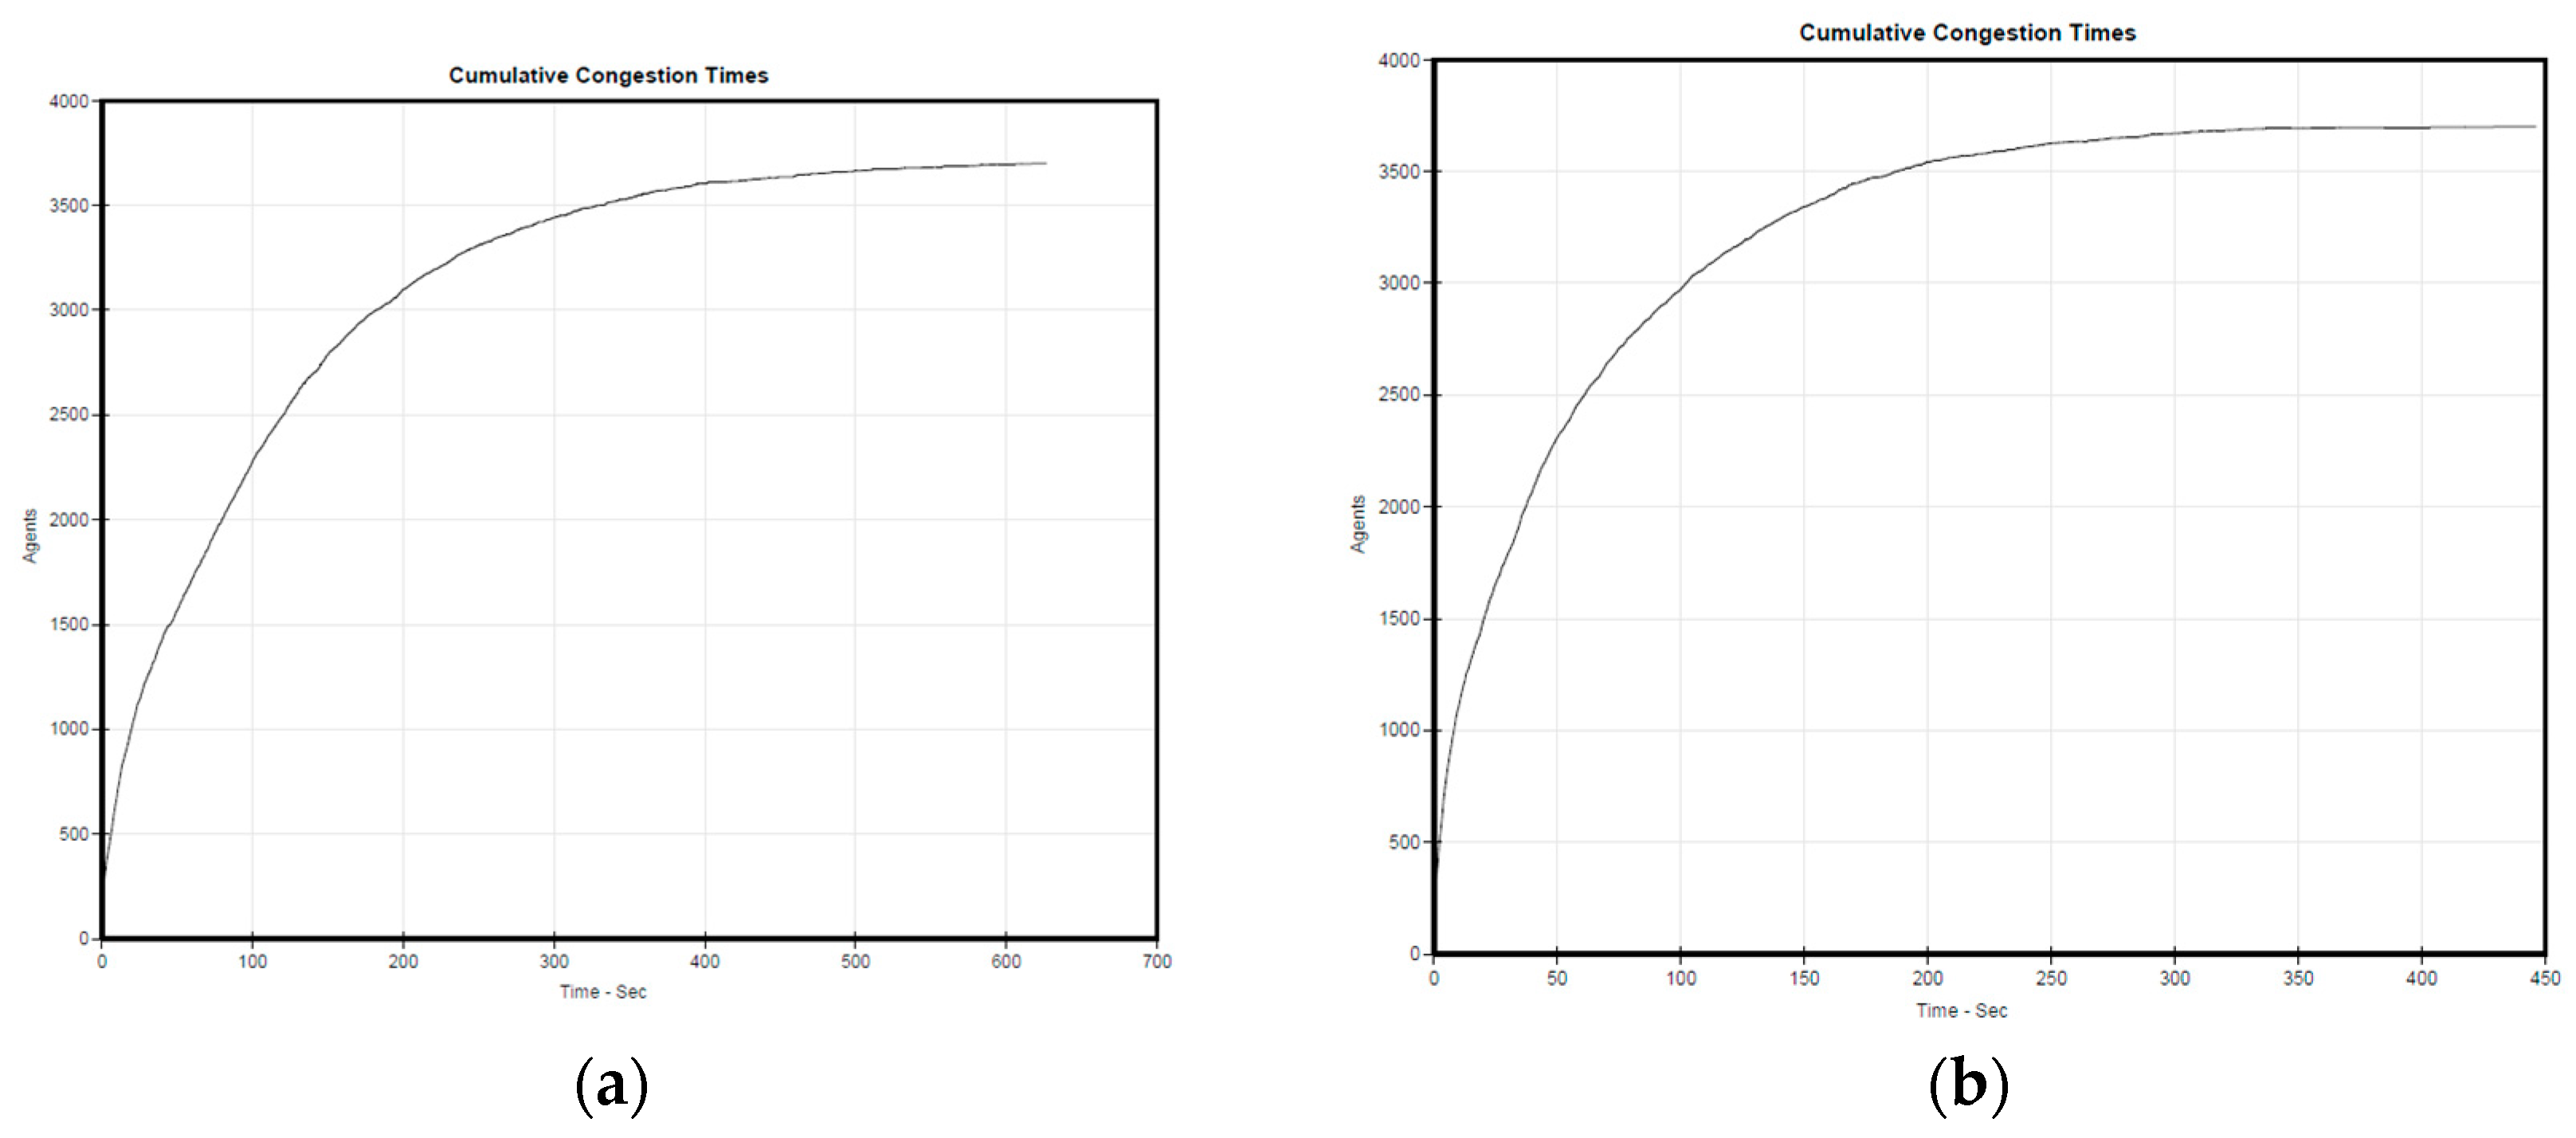
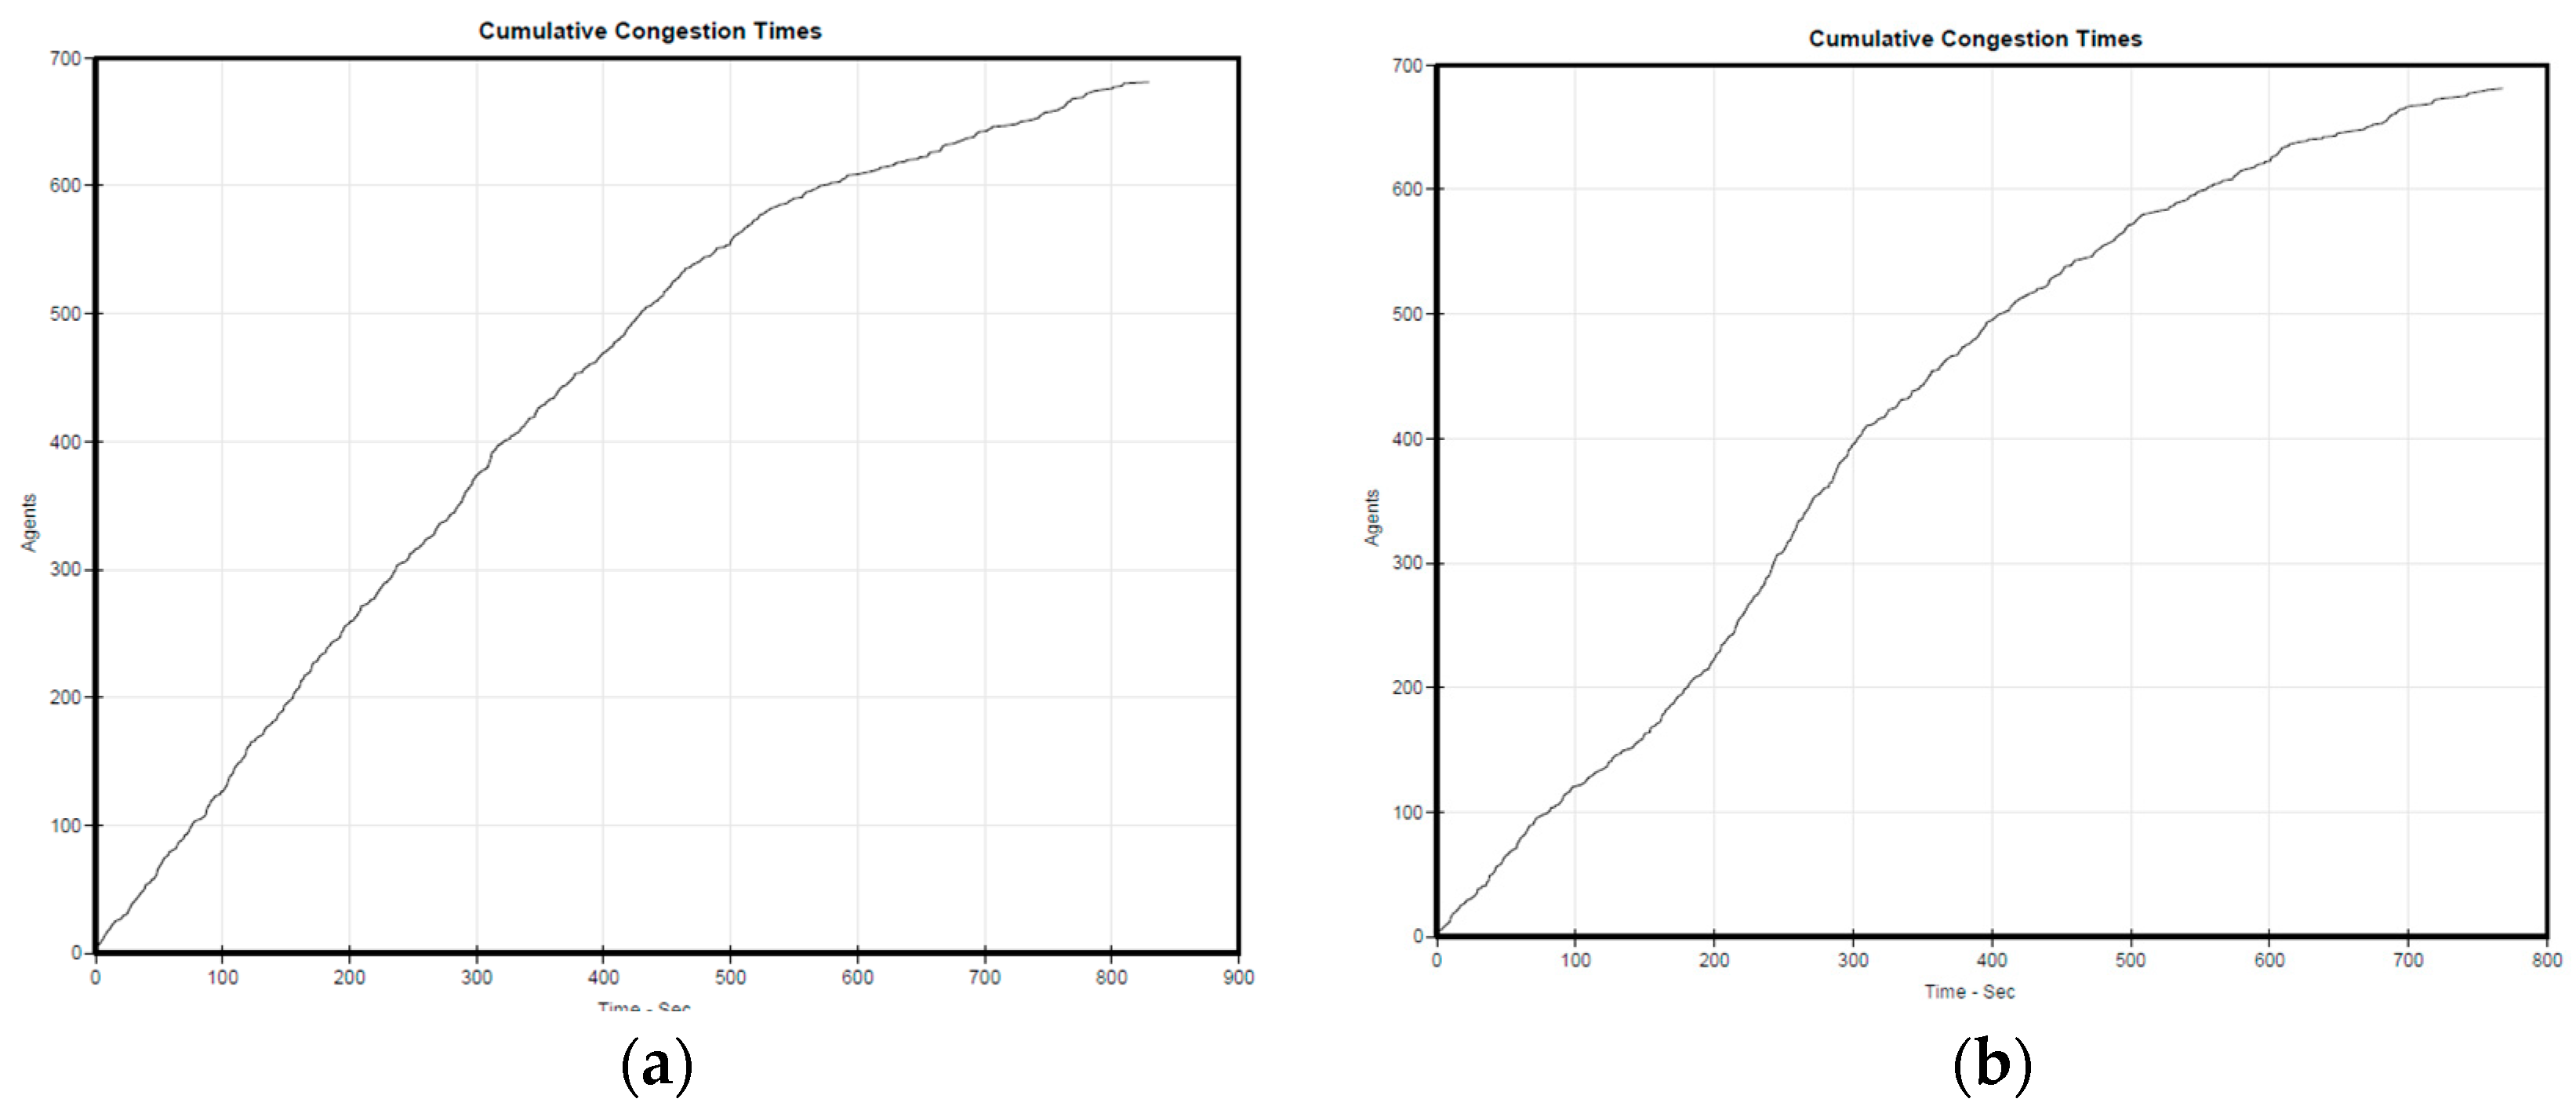
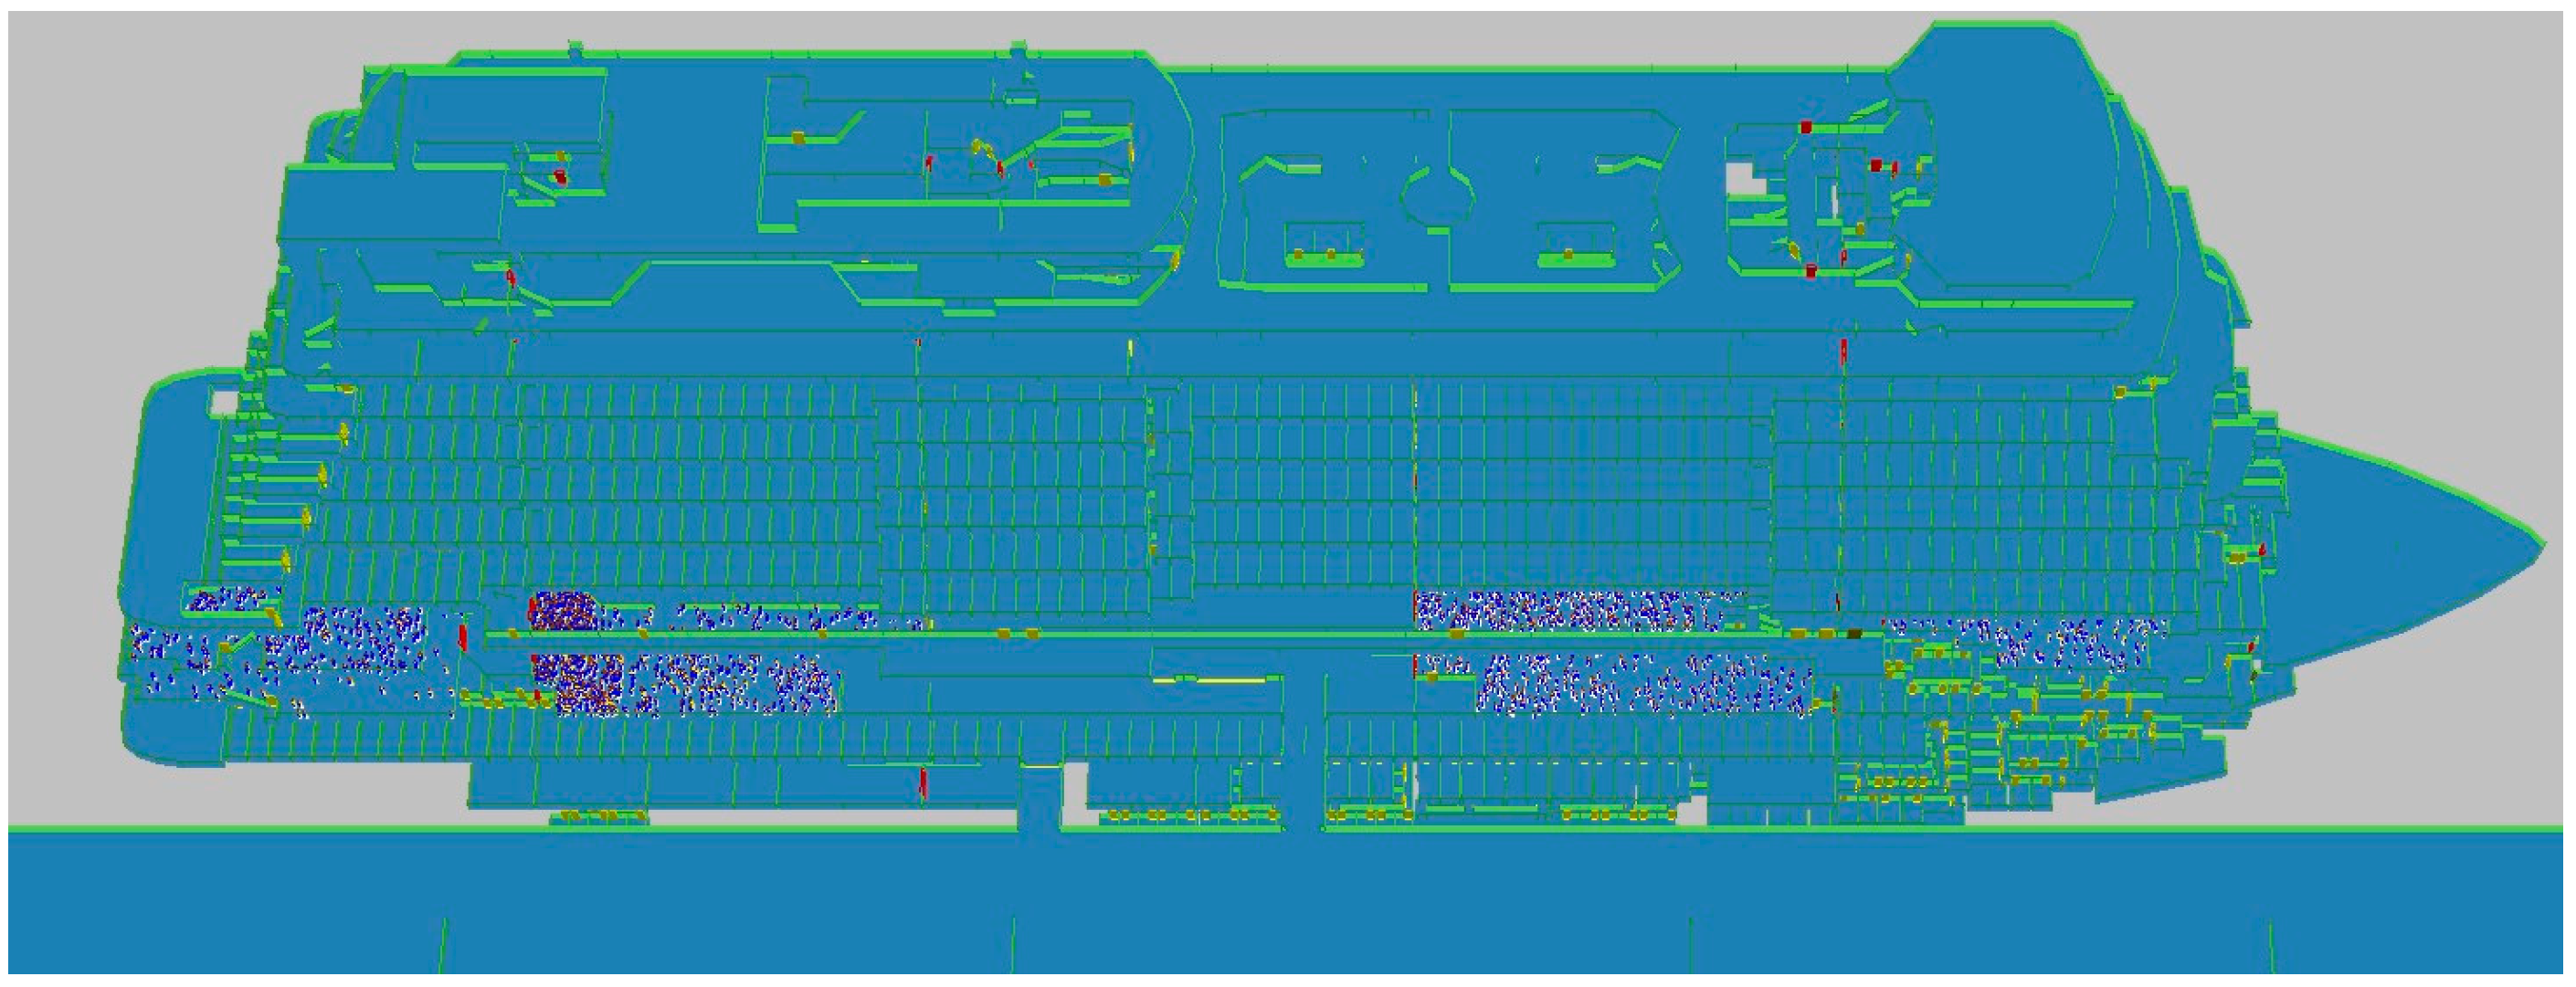