
A Survey on EEG Data Analysis Software

Abstract
:1. Introduction
2. Term Definitions
2.1. Analysis of Variance (ANOVA)
2.2. Analysis of Covariance (ANCOVA)
2.3. Brain-Computer Interface (BCI)
2.4. Common Spatial Pattern (CSP)
2.5. Convolutional Neural Networks (CNN)
2.6. Downsampling
2.7. Fast Fourier Transform (FFT)
2.8. Inverse Fast Fourier Transform (IFFT)
2.9. Independent Component Analysis (ICA)
2.10. Impulse Response
2.11. Linear Regression or Regression
2.12. Machine Learning
2.13. Neuroinformatic
2.14. Neural Networks
2.15. Neurophysiology
2.16. Passband and Bandstop
2.17. Principal Component
2.18. Principal Component Analysis (PCA)
2.19. Recurrent Neural Network (RNN)
2.20. Signal Space Projection
2.21. Spectral Analysis
2.22. Support Vector Machines (SVMs)
2.23. Time-Frequency Analysis
2.24. Wavelet
2.25. Wavelet Transform
2.26. Window (or Window Signal)
3. EEG Signal Processing Methods
3.1. Bessel Filter
3.2. Band Pass Filter
3.3. Butterworth Filter
3.4. Chebyshev Filter
3.5. Finite Impulse Response (FIR) Filter
3.6. High/Low Pass Filter
3.7. Infinite Impulse Response (IIR) Filter
3.8. Least Square Filter
3.9. K-Nearest Neighbors
3.10. Naive Bayes
3.11. Notch Filter
3.12. Non-Local Means (NLM) Filter
3.13. Partial Least Squares
3.14. Random Forest Classifier
3.15. Regularized Discriminant Analysis
4. Artifact Detection and Removal
4.1. Canonical Correlation Analysis
4.2. Common Spatial Pattern (CSP)
4.3. Empirical Mode Decomposition (EMD)
4.4. Fast Fourier Transform (FFT)
4.5. Independent Component Analysis (ICA)
4.6. Non-linear Mode Decomposition (NMD)
4.7. Principal Component Analysis (PCA)
4.8. Source Imaging-Based Methods
4.9. Wavelet Transform
5. Available Tools for EEG Signal Processing
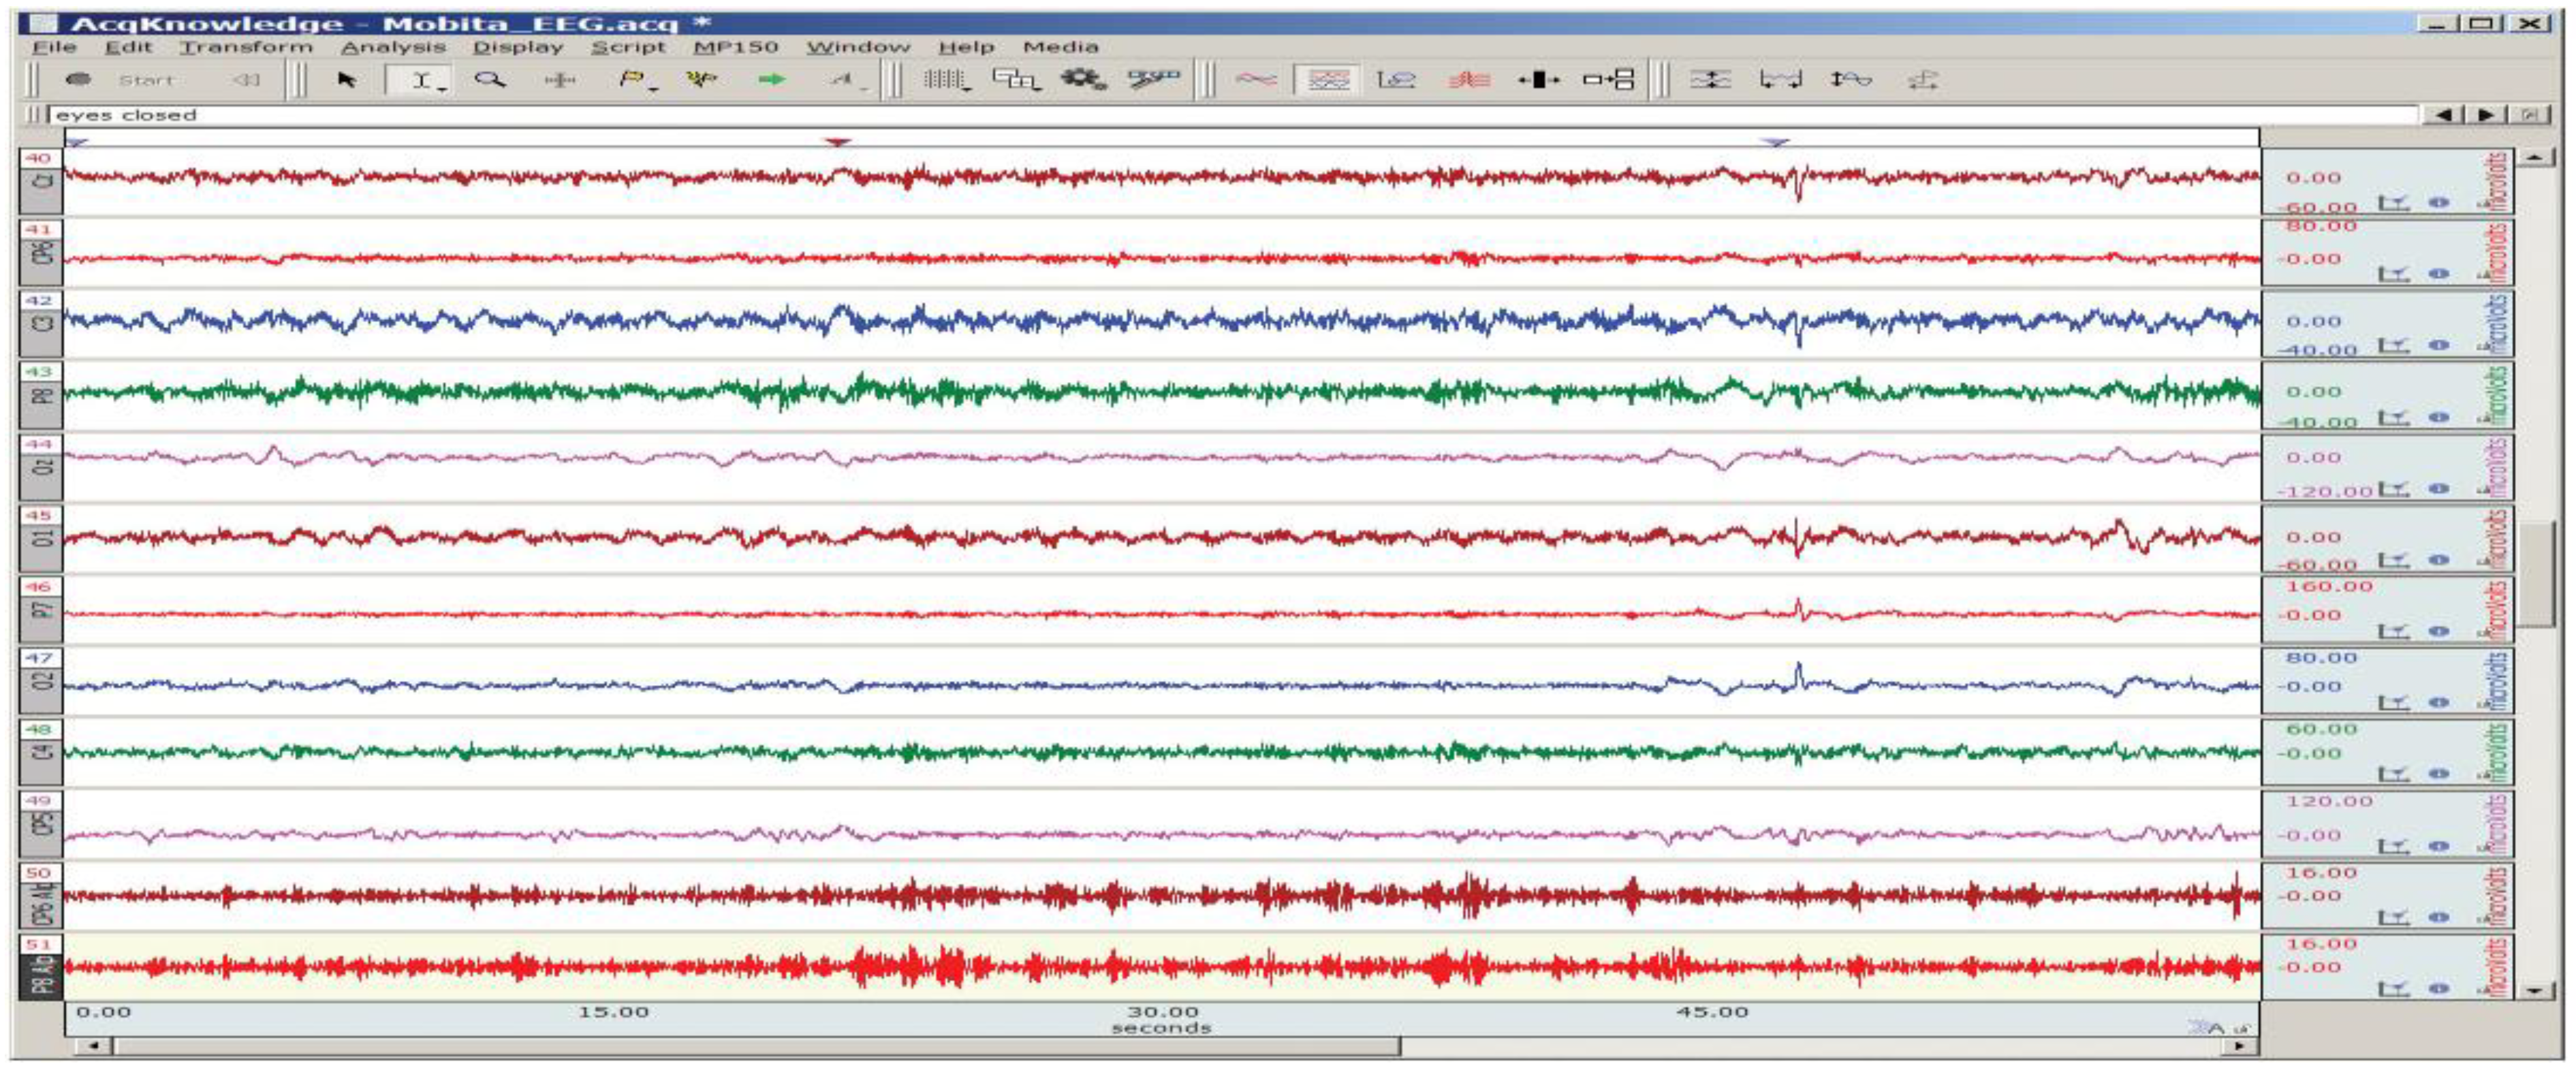
5.1. AcqKnowledge
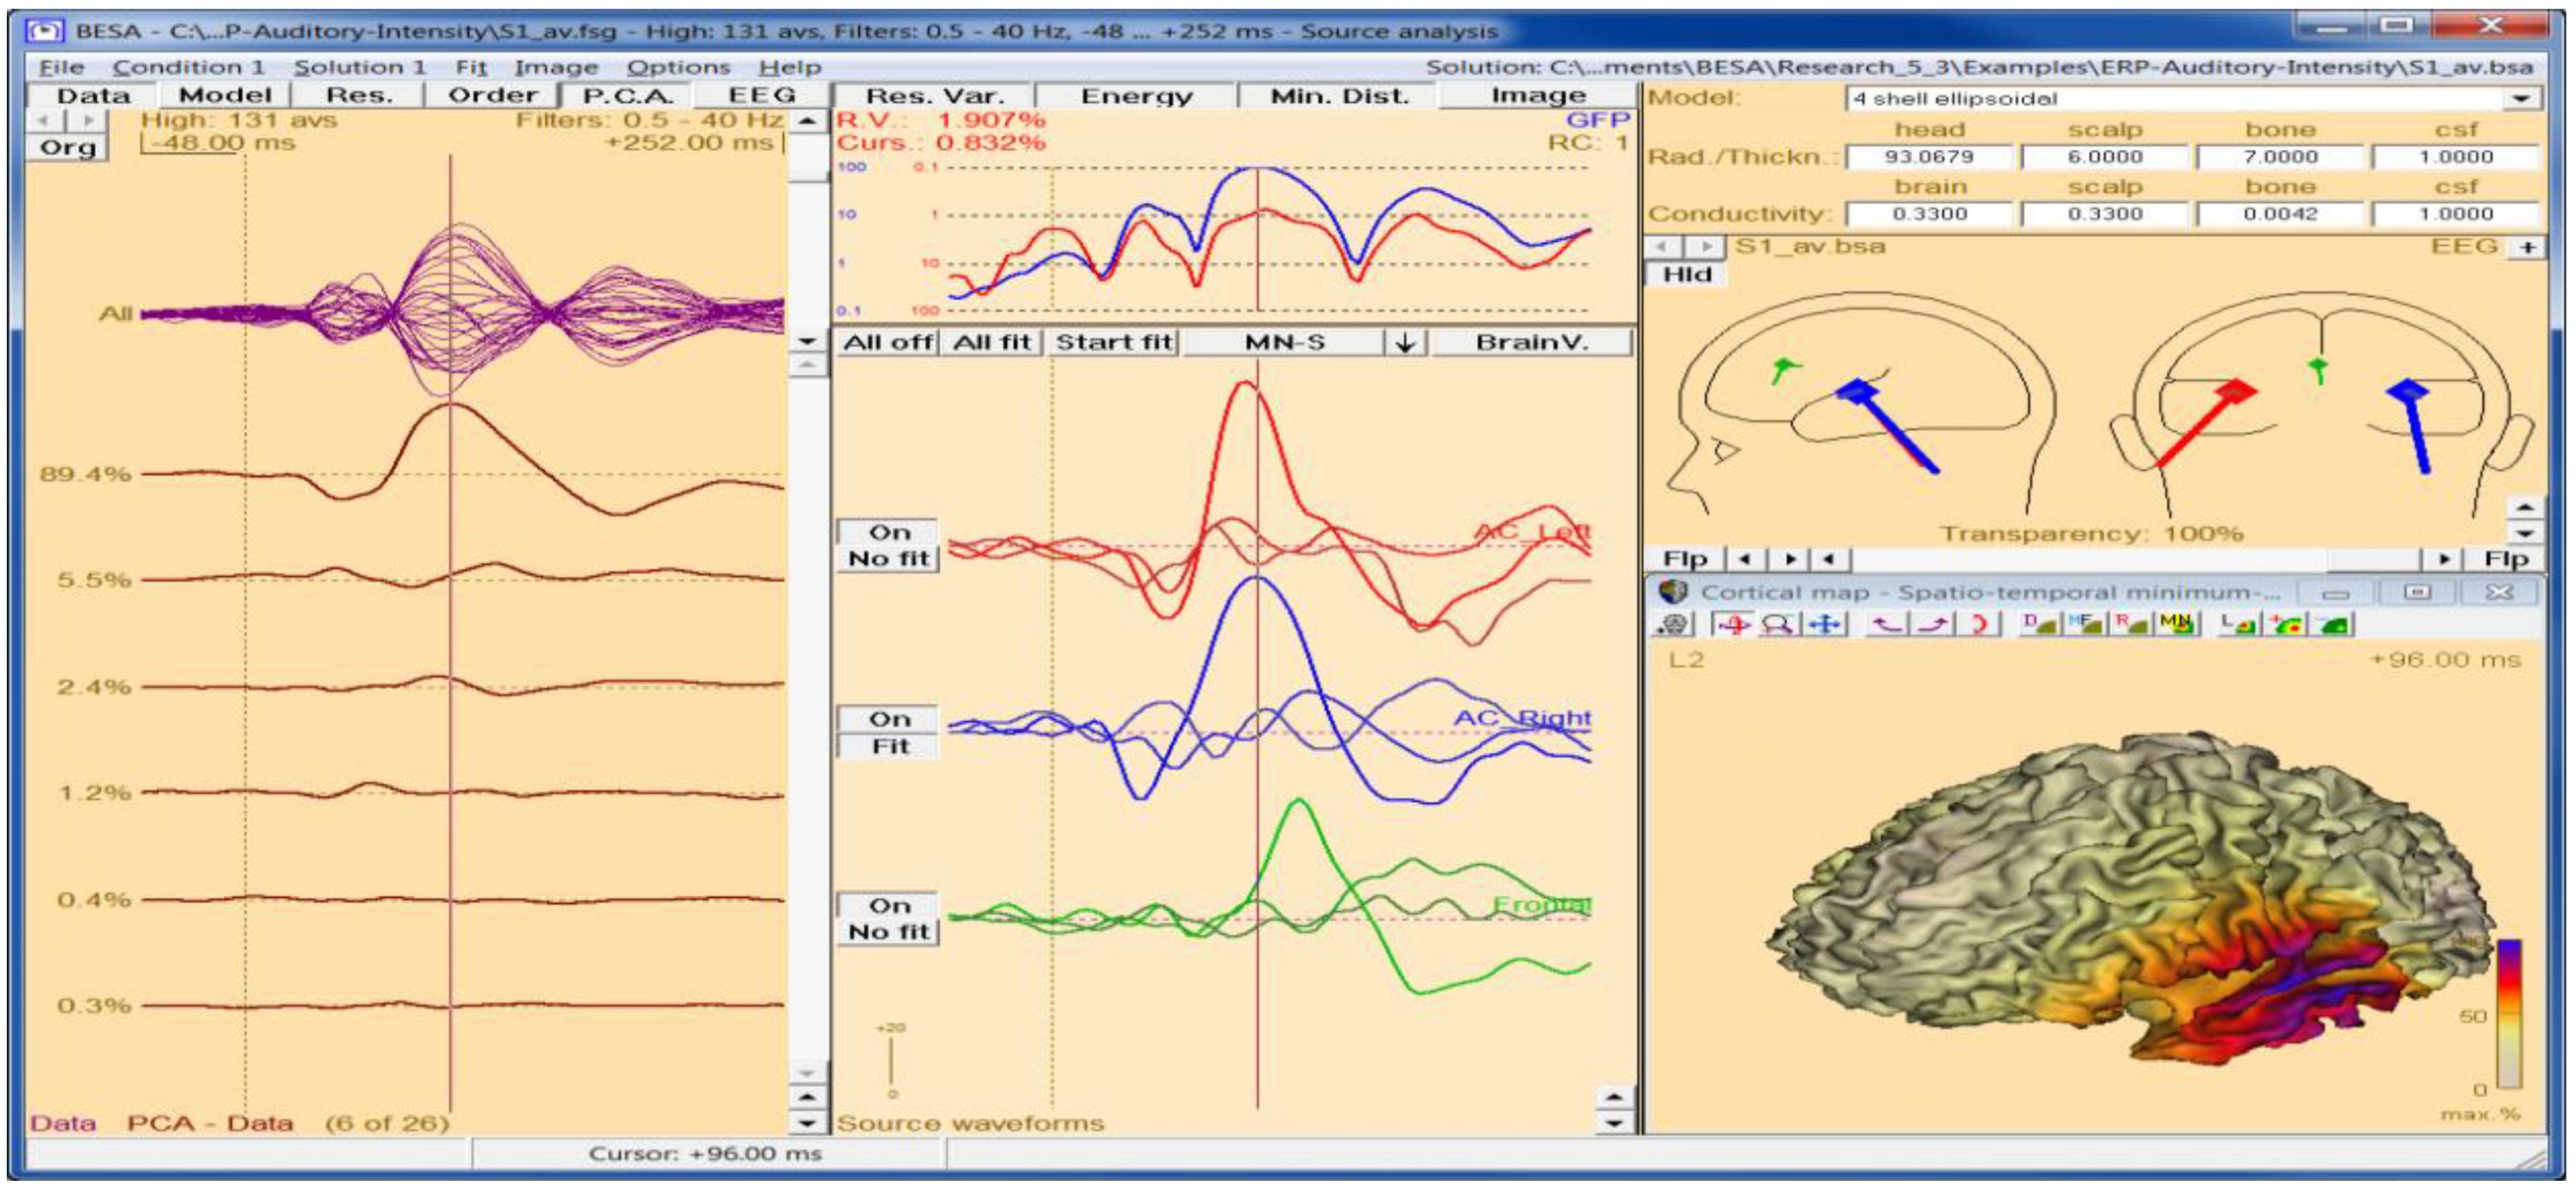
5.2. BESA
5.3. BIOPAC Student Lab (BSL)
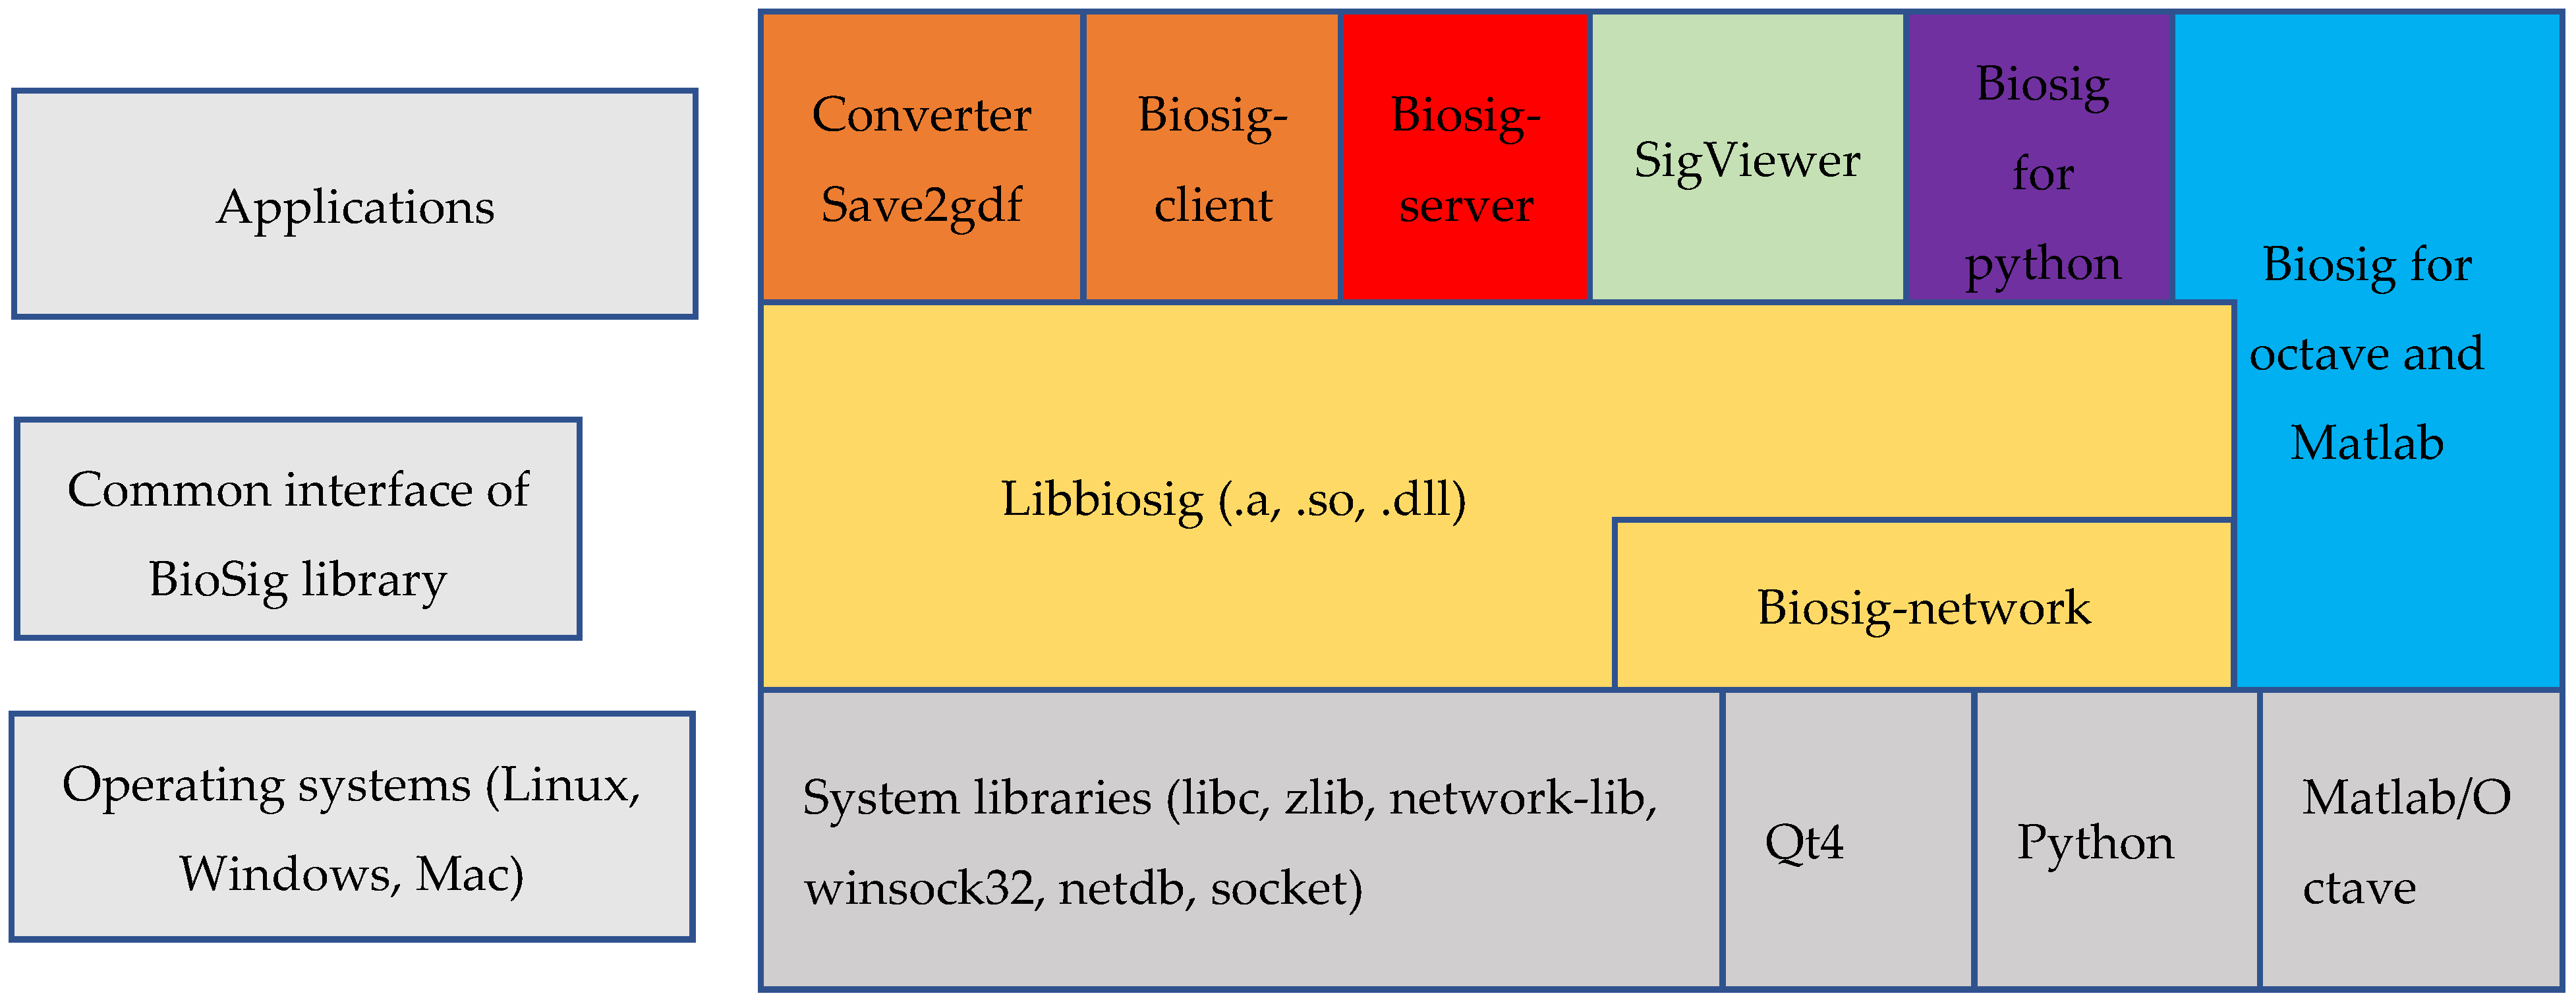
5.4. BioSig
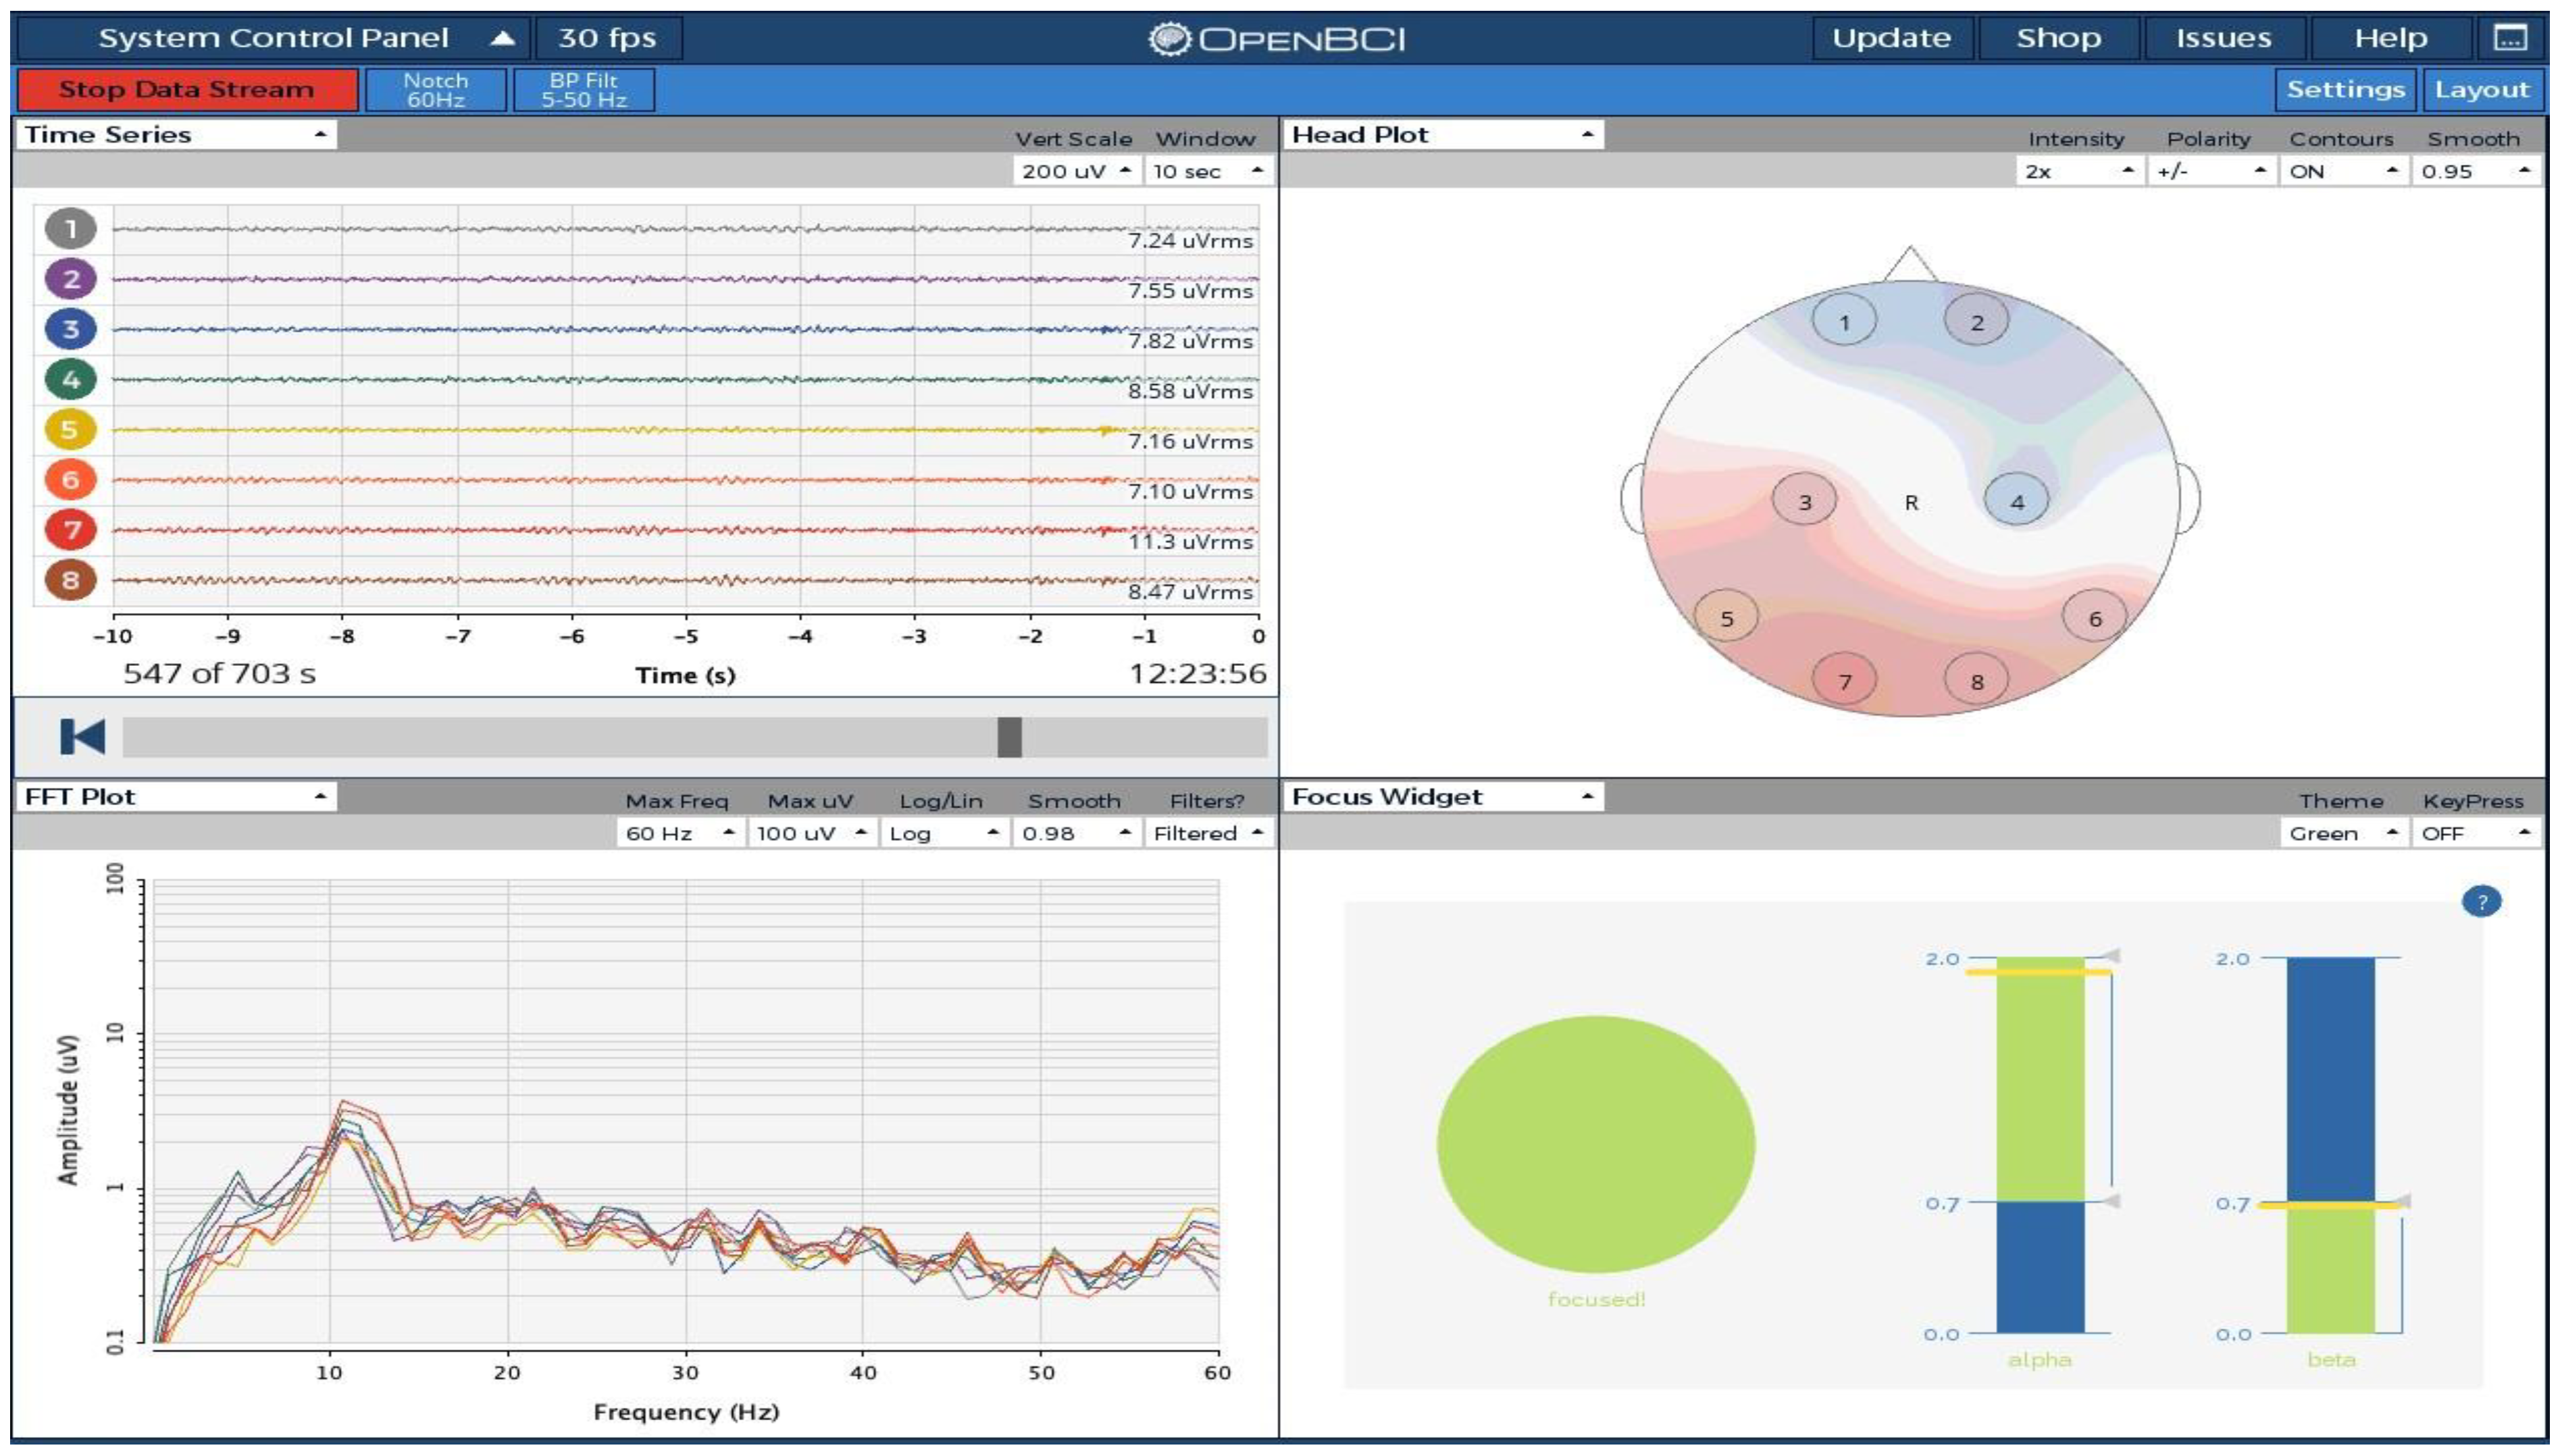
5.5. BrainFlow

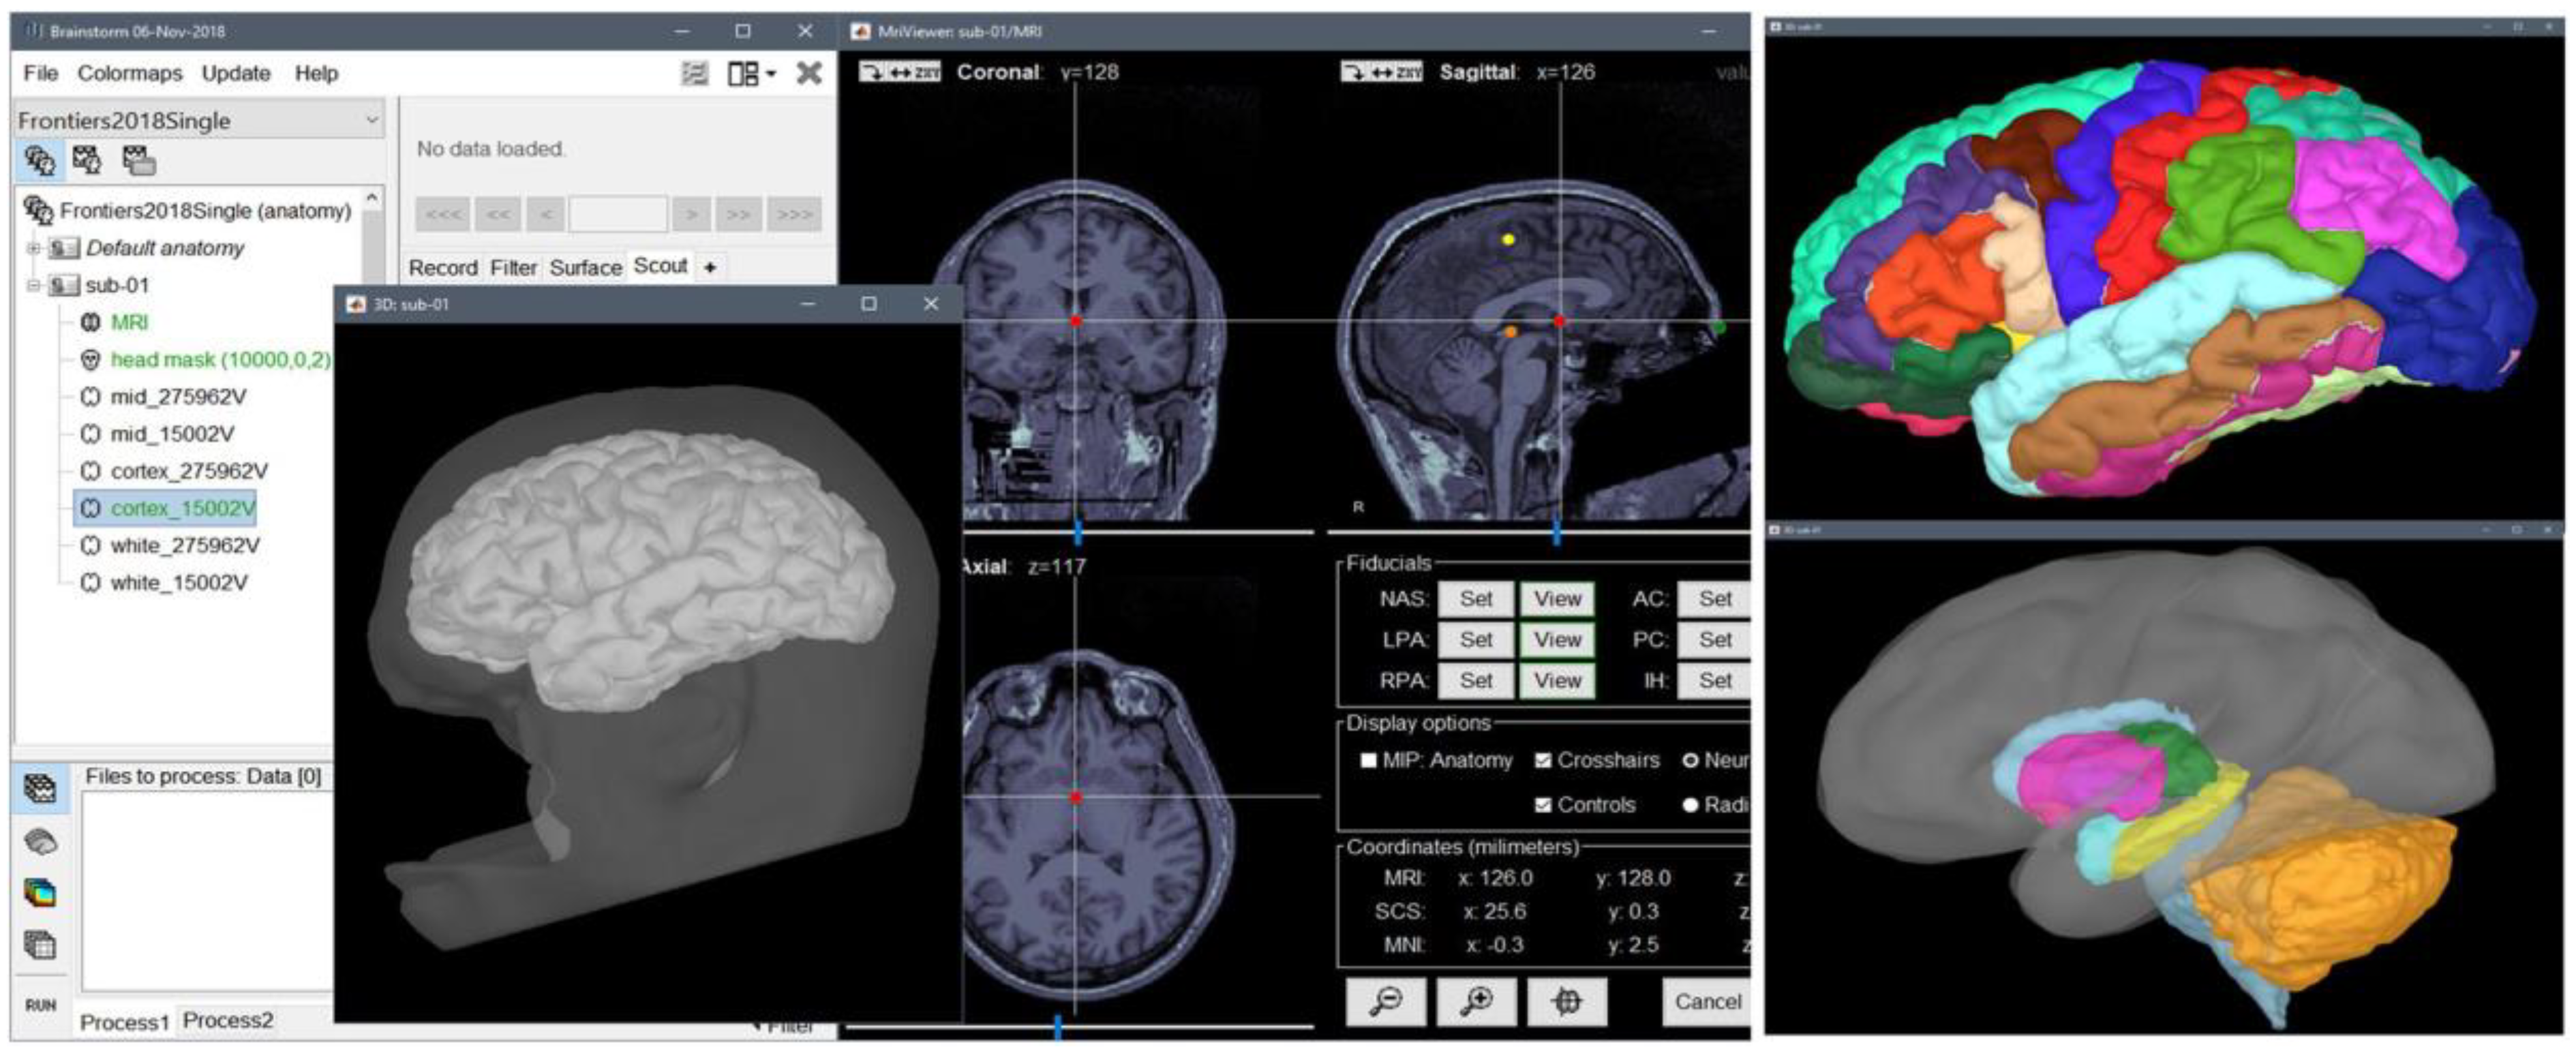
5.6. Brainstorm
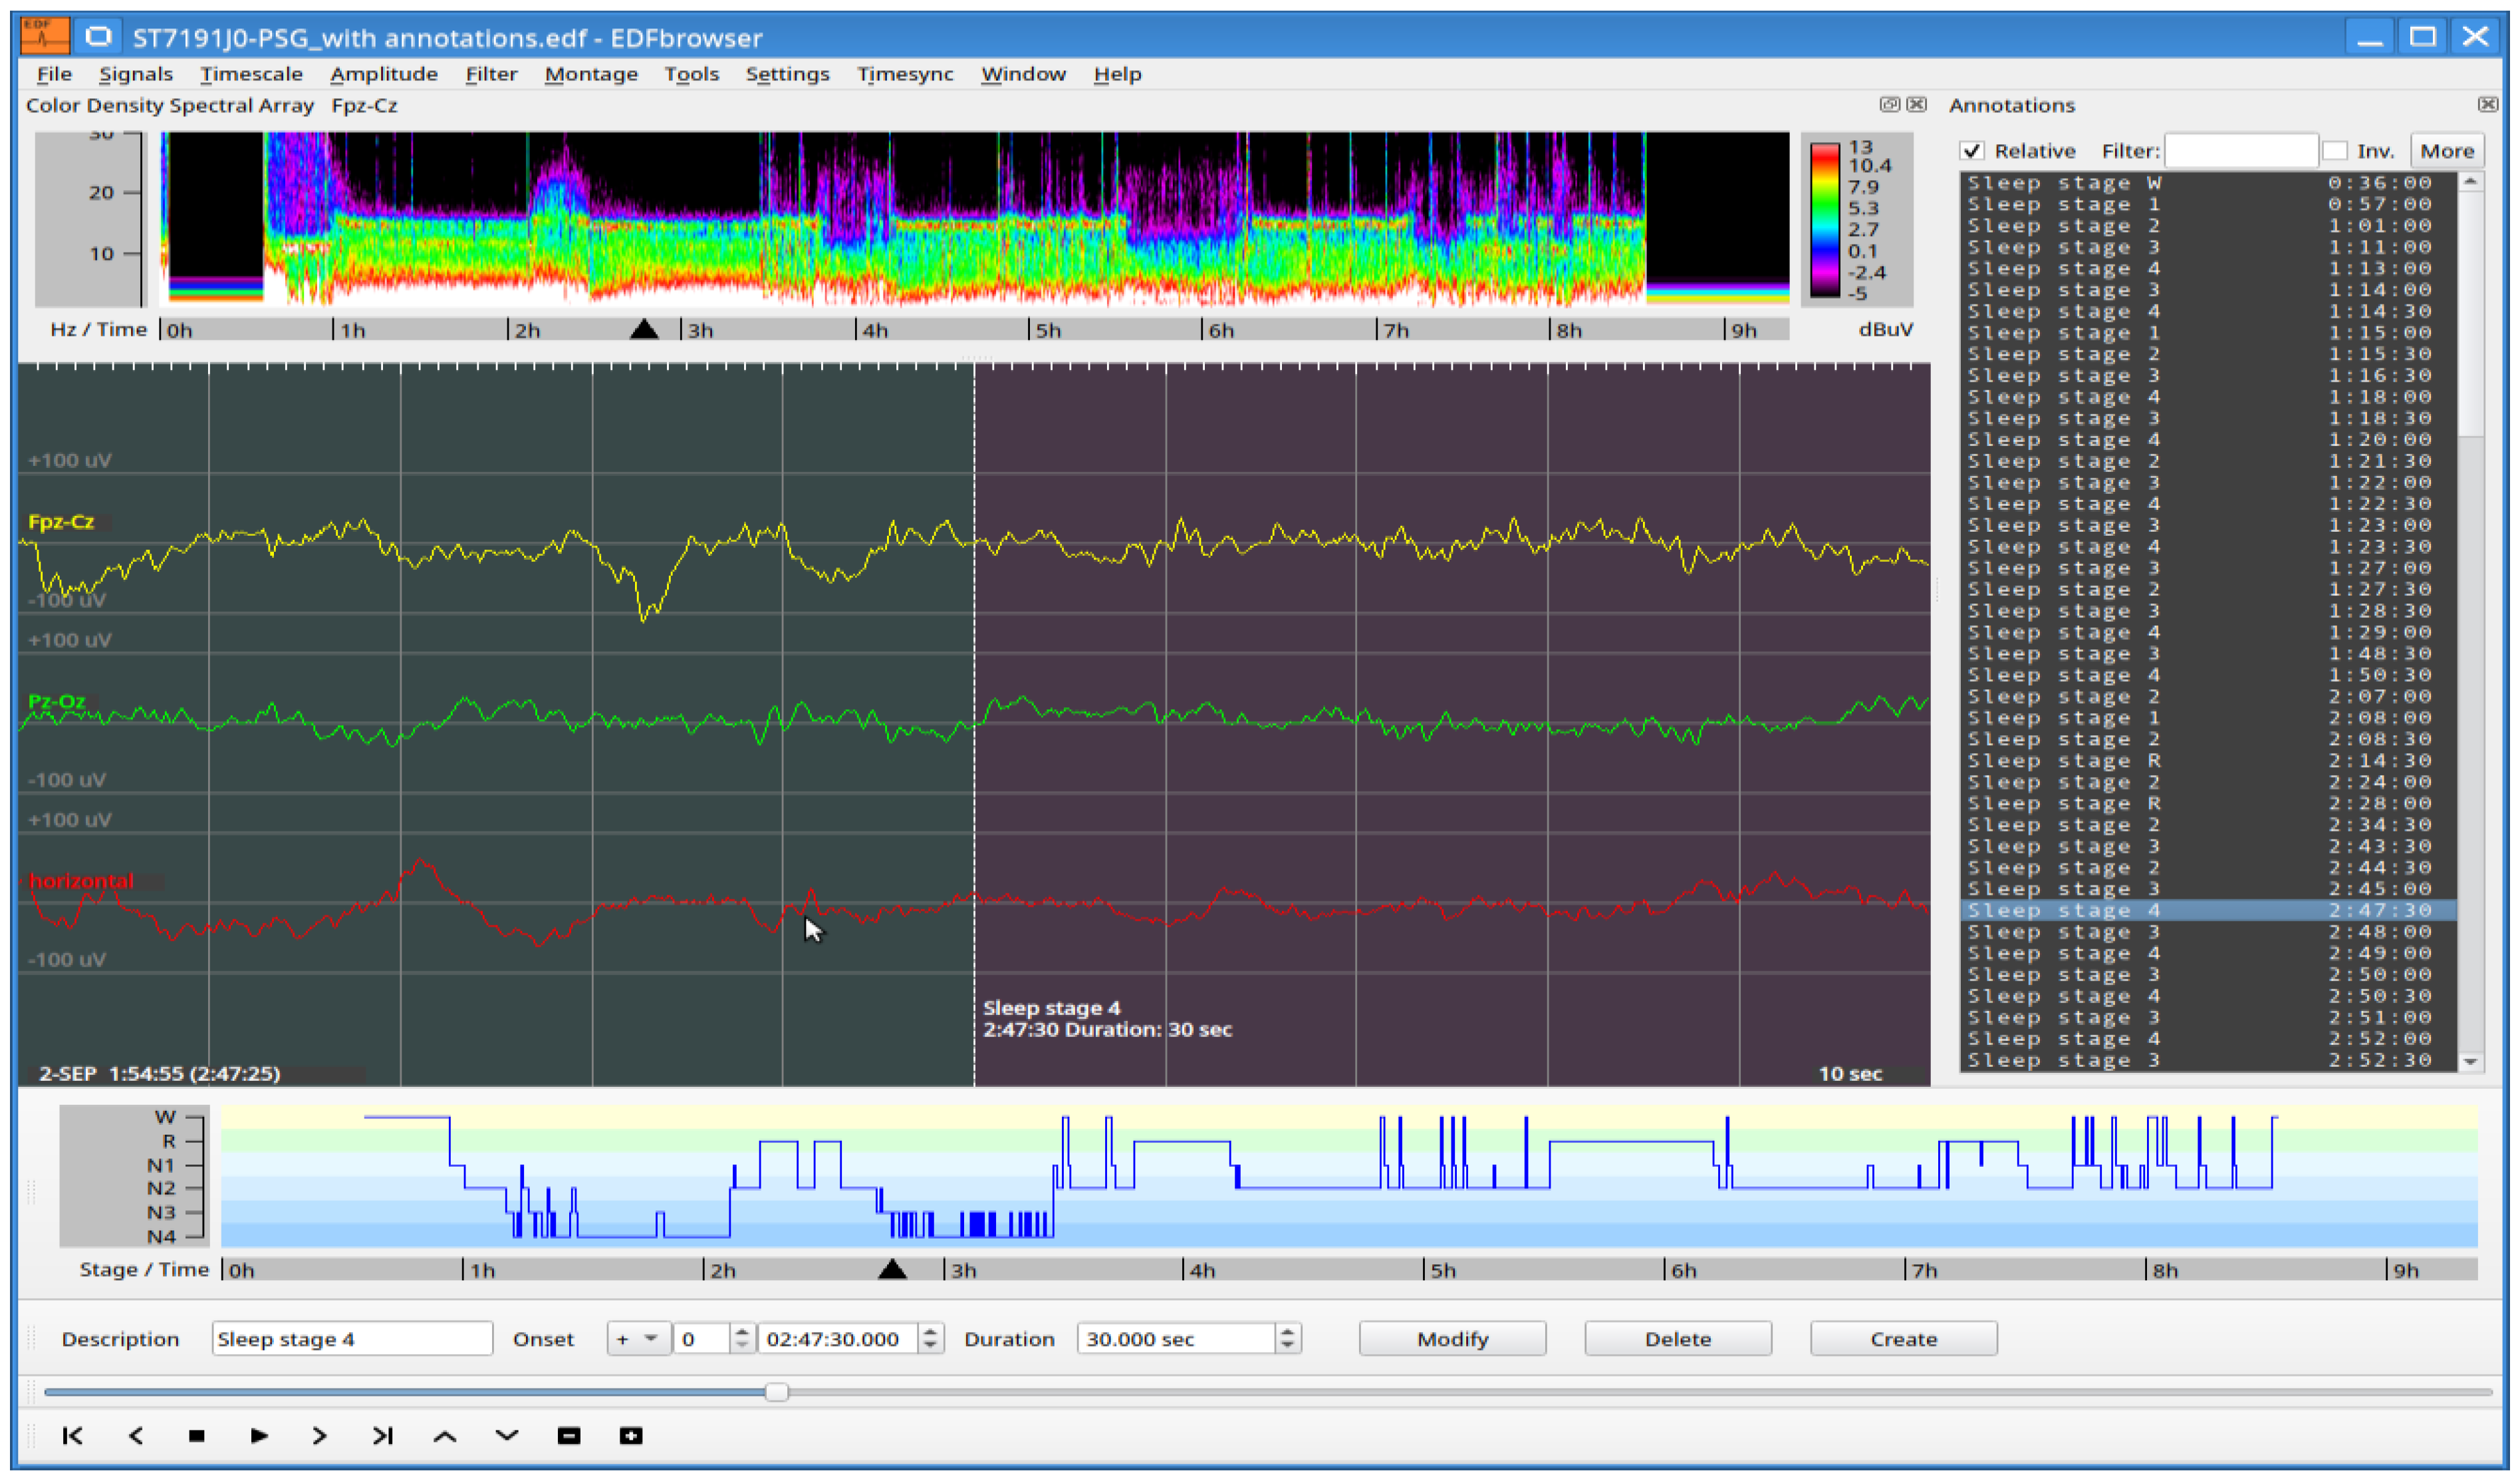
5.7. EDF Browser
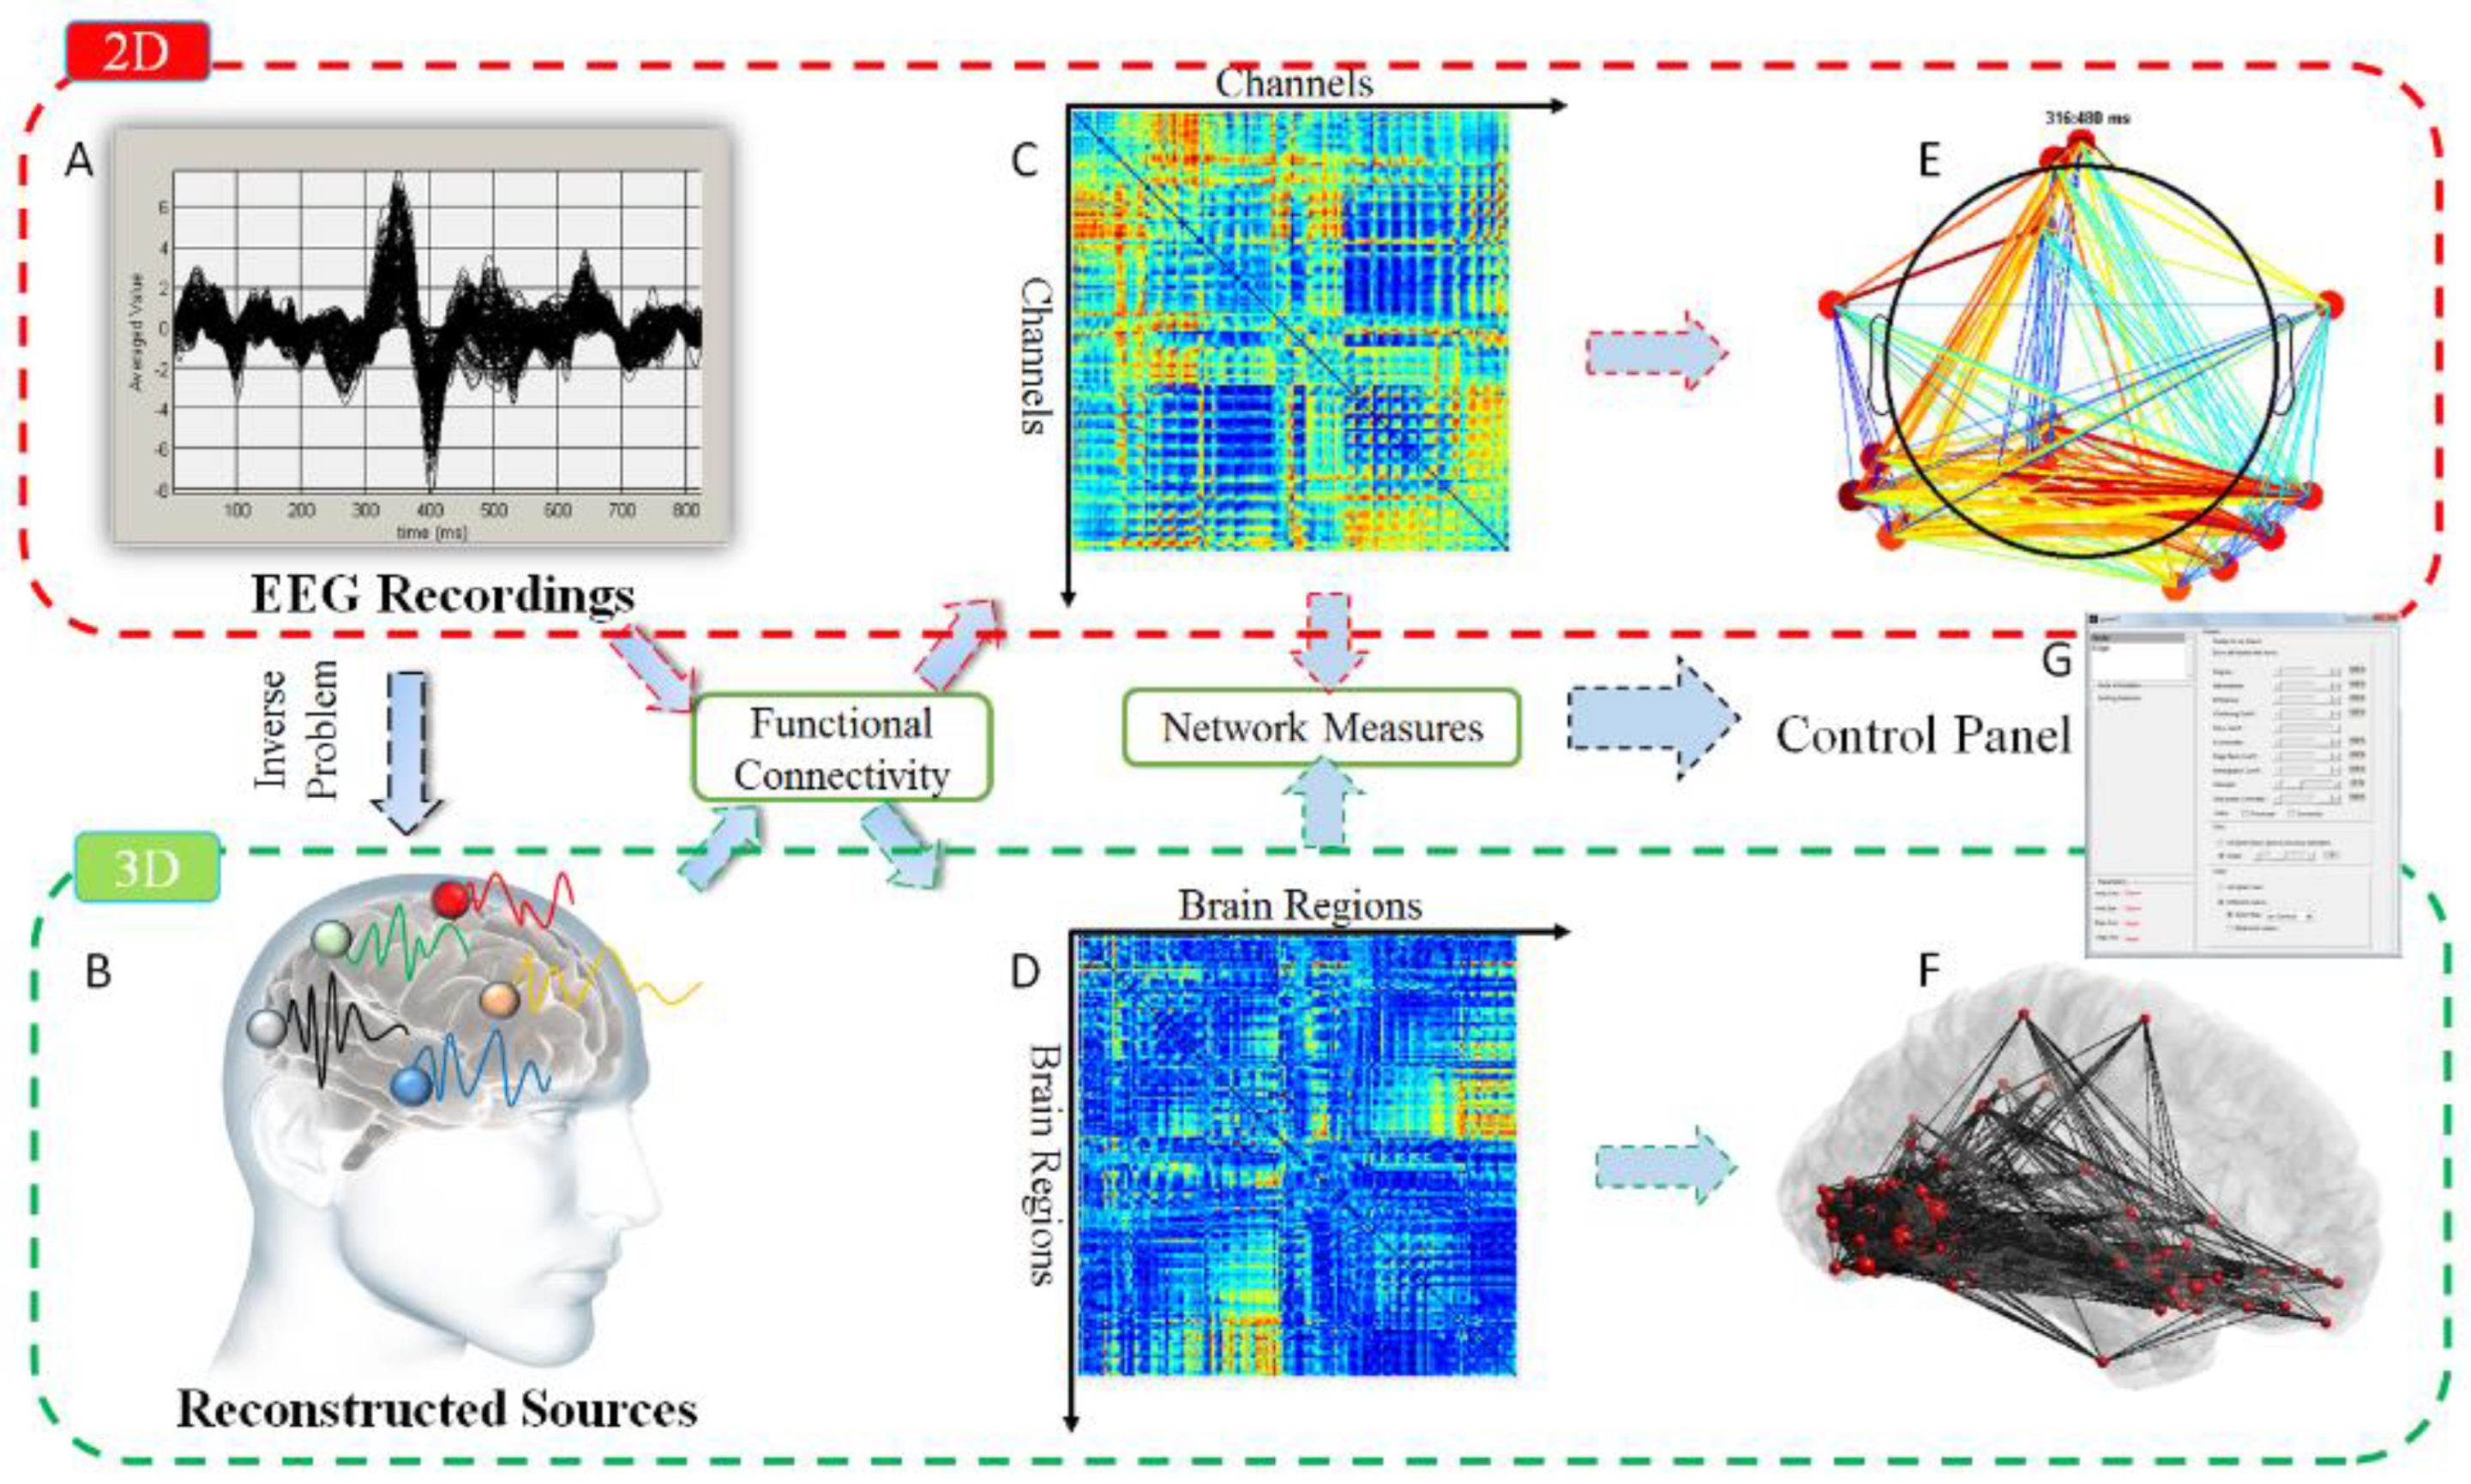
5.8. EEGNET
5.9. ELAN
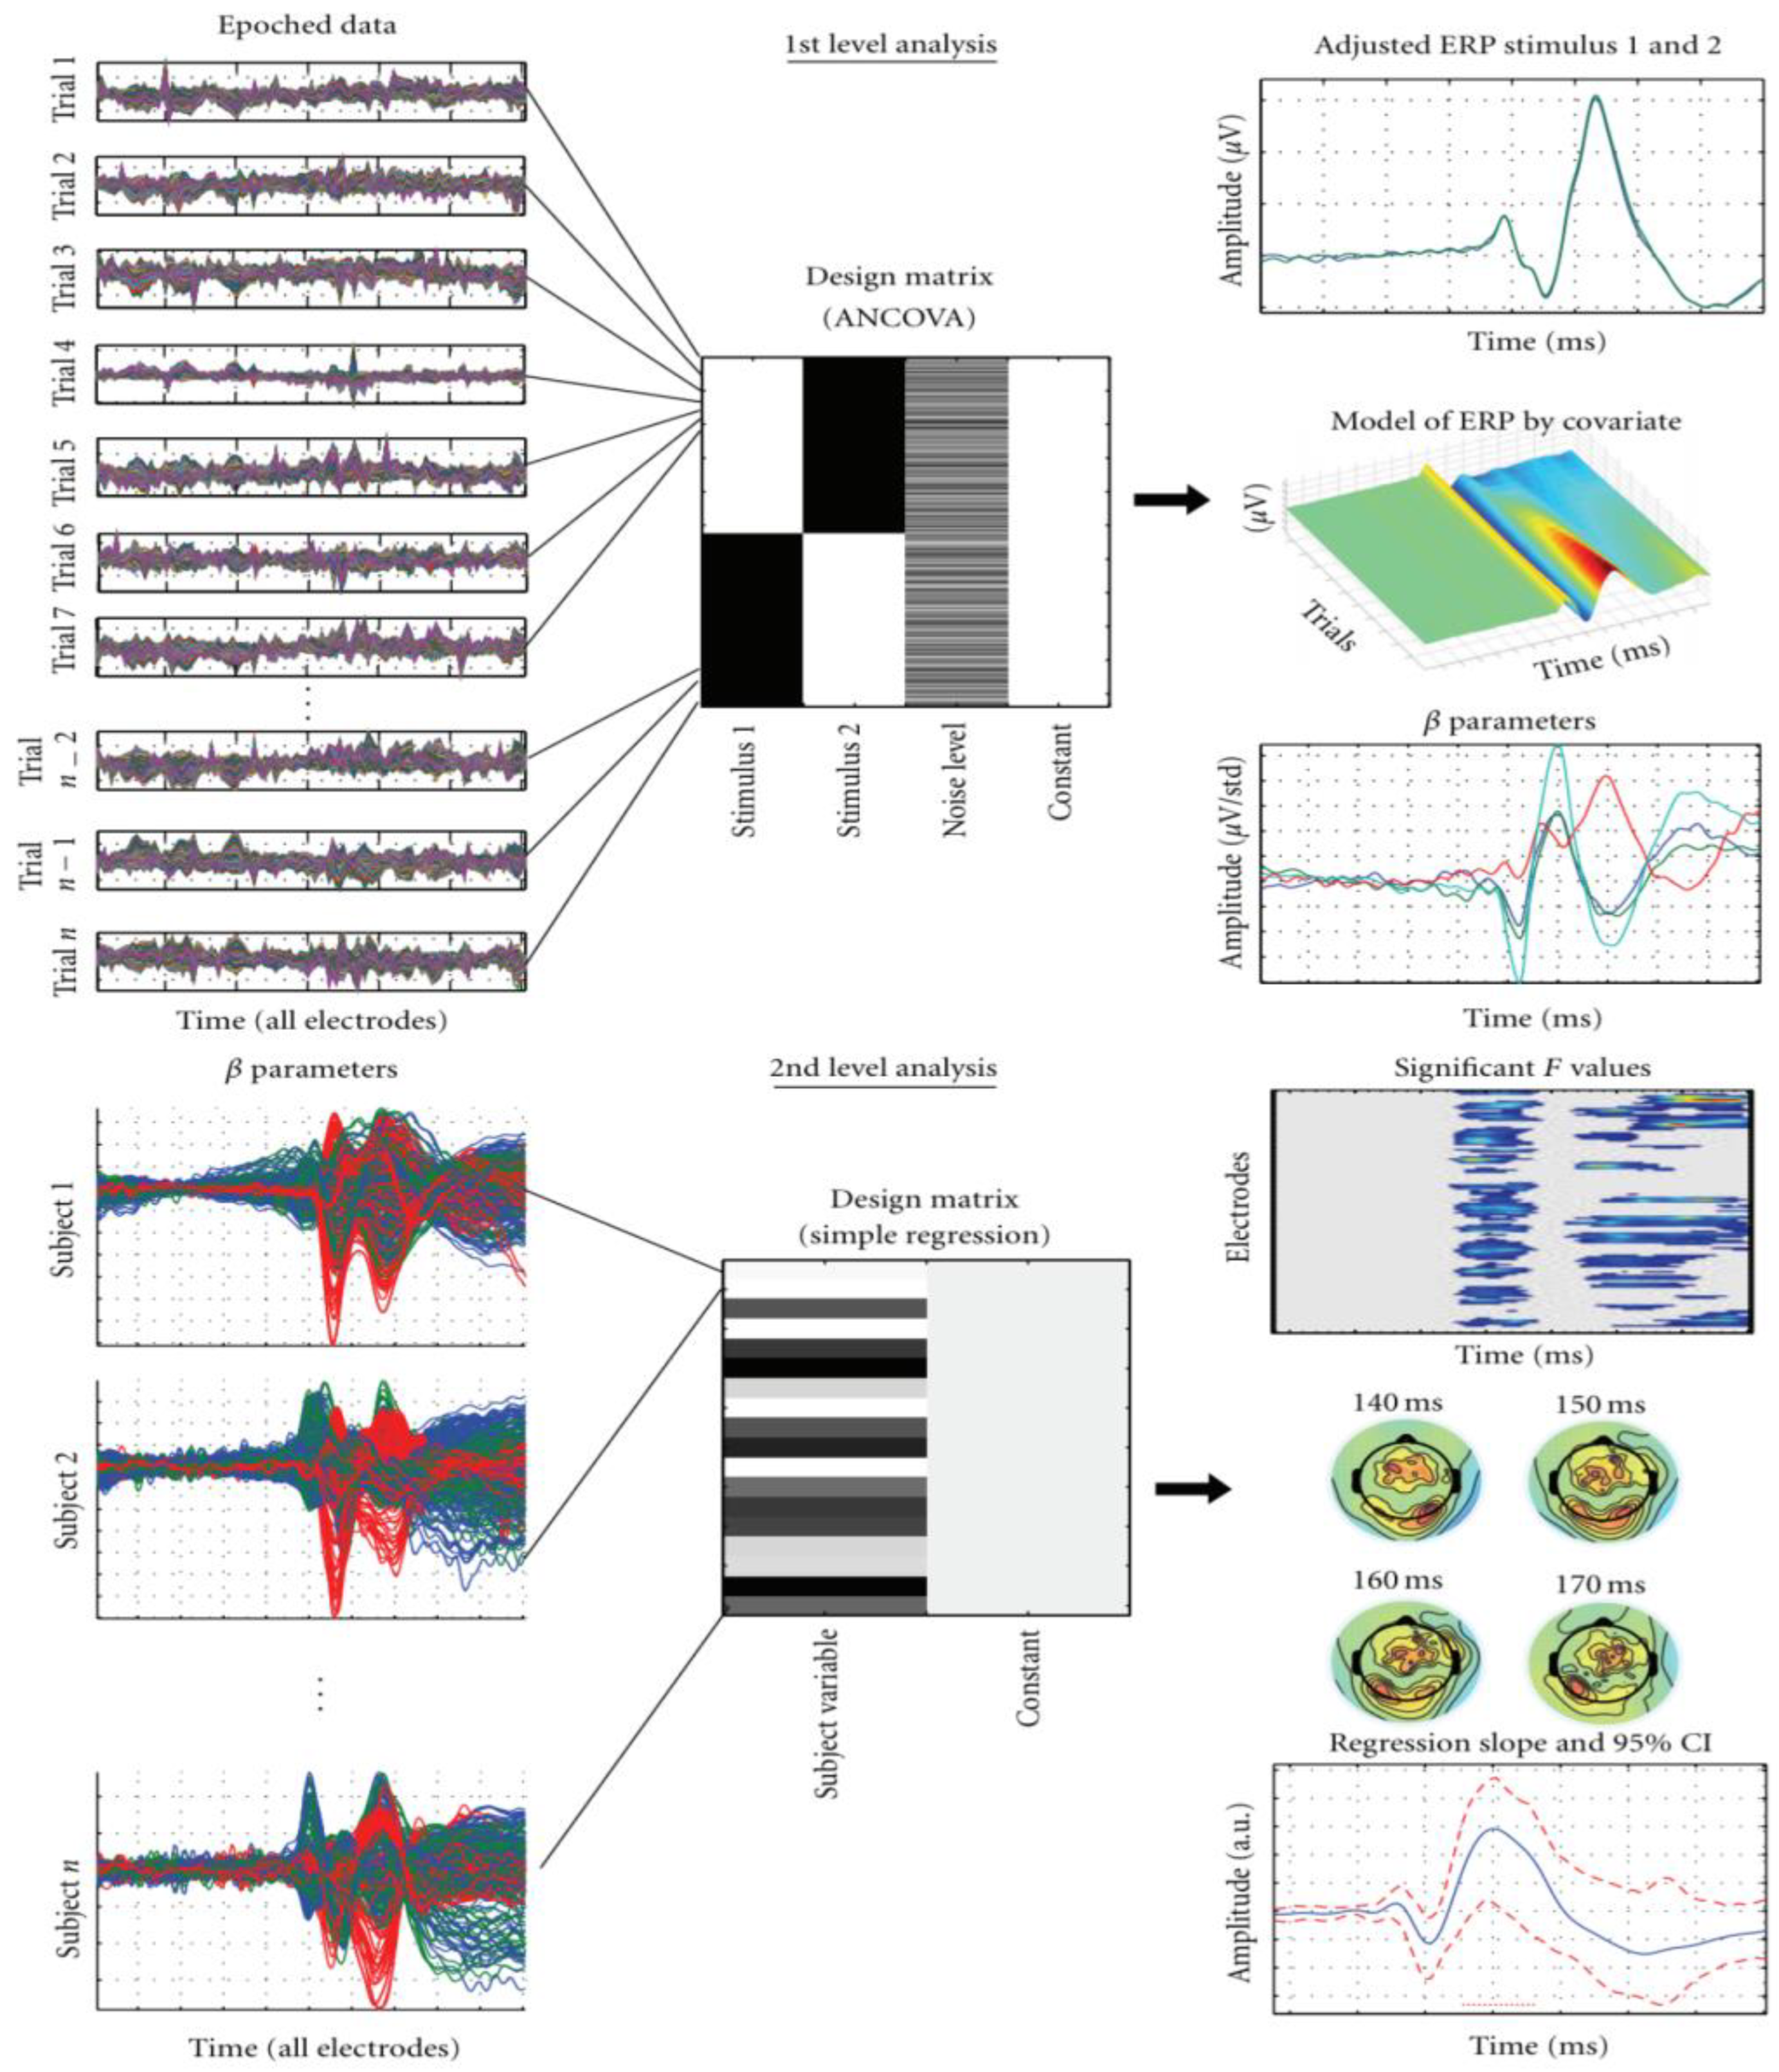
5.10. LIMO EEG
5.11. MNE-MATLAB
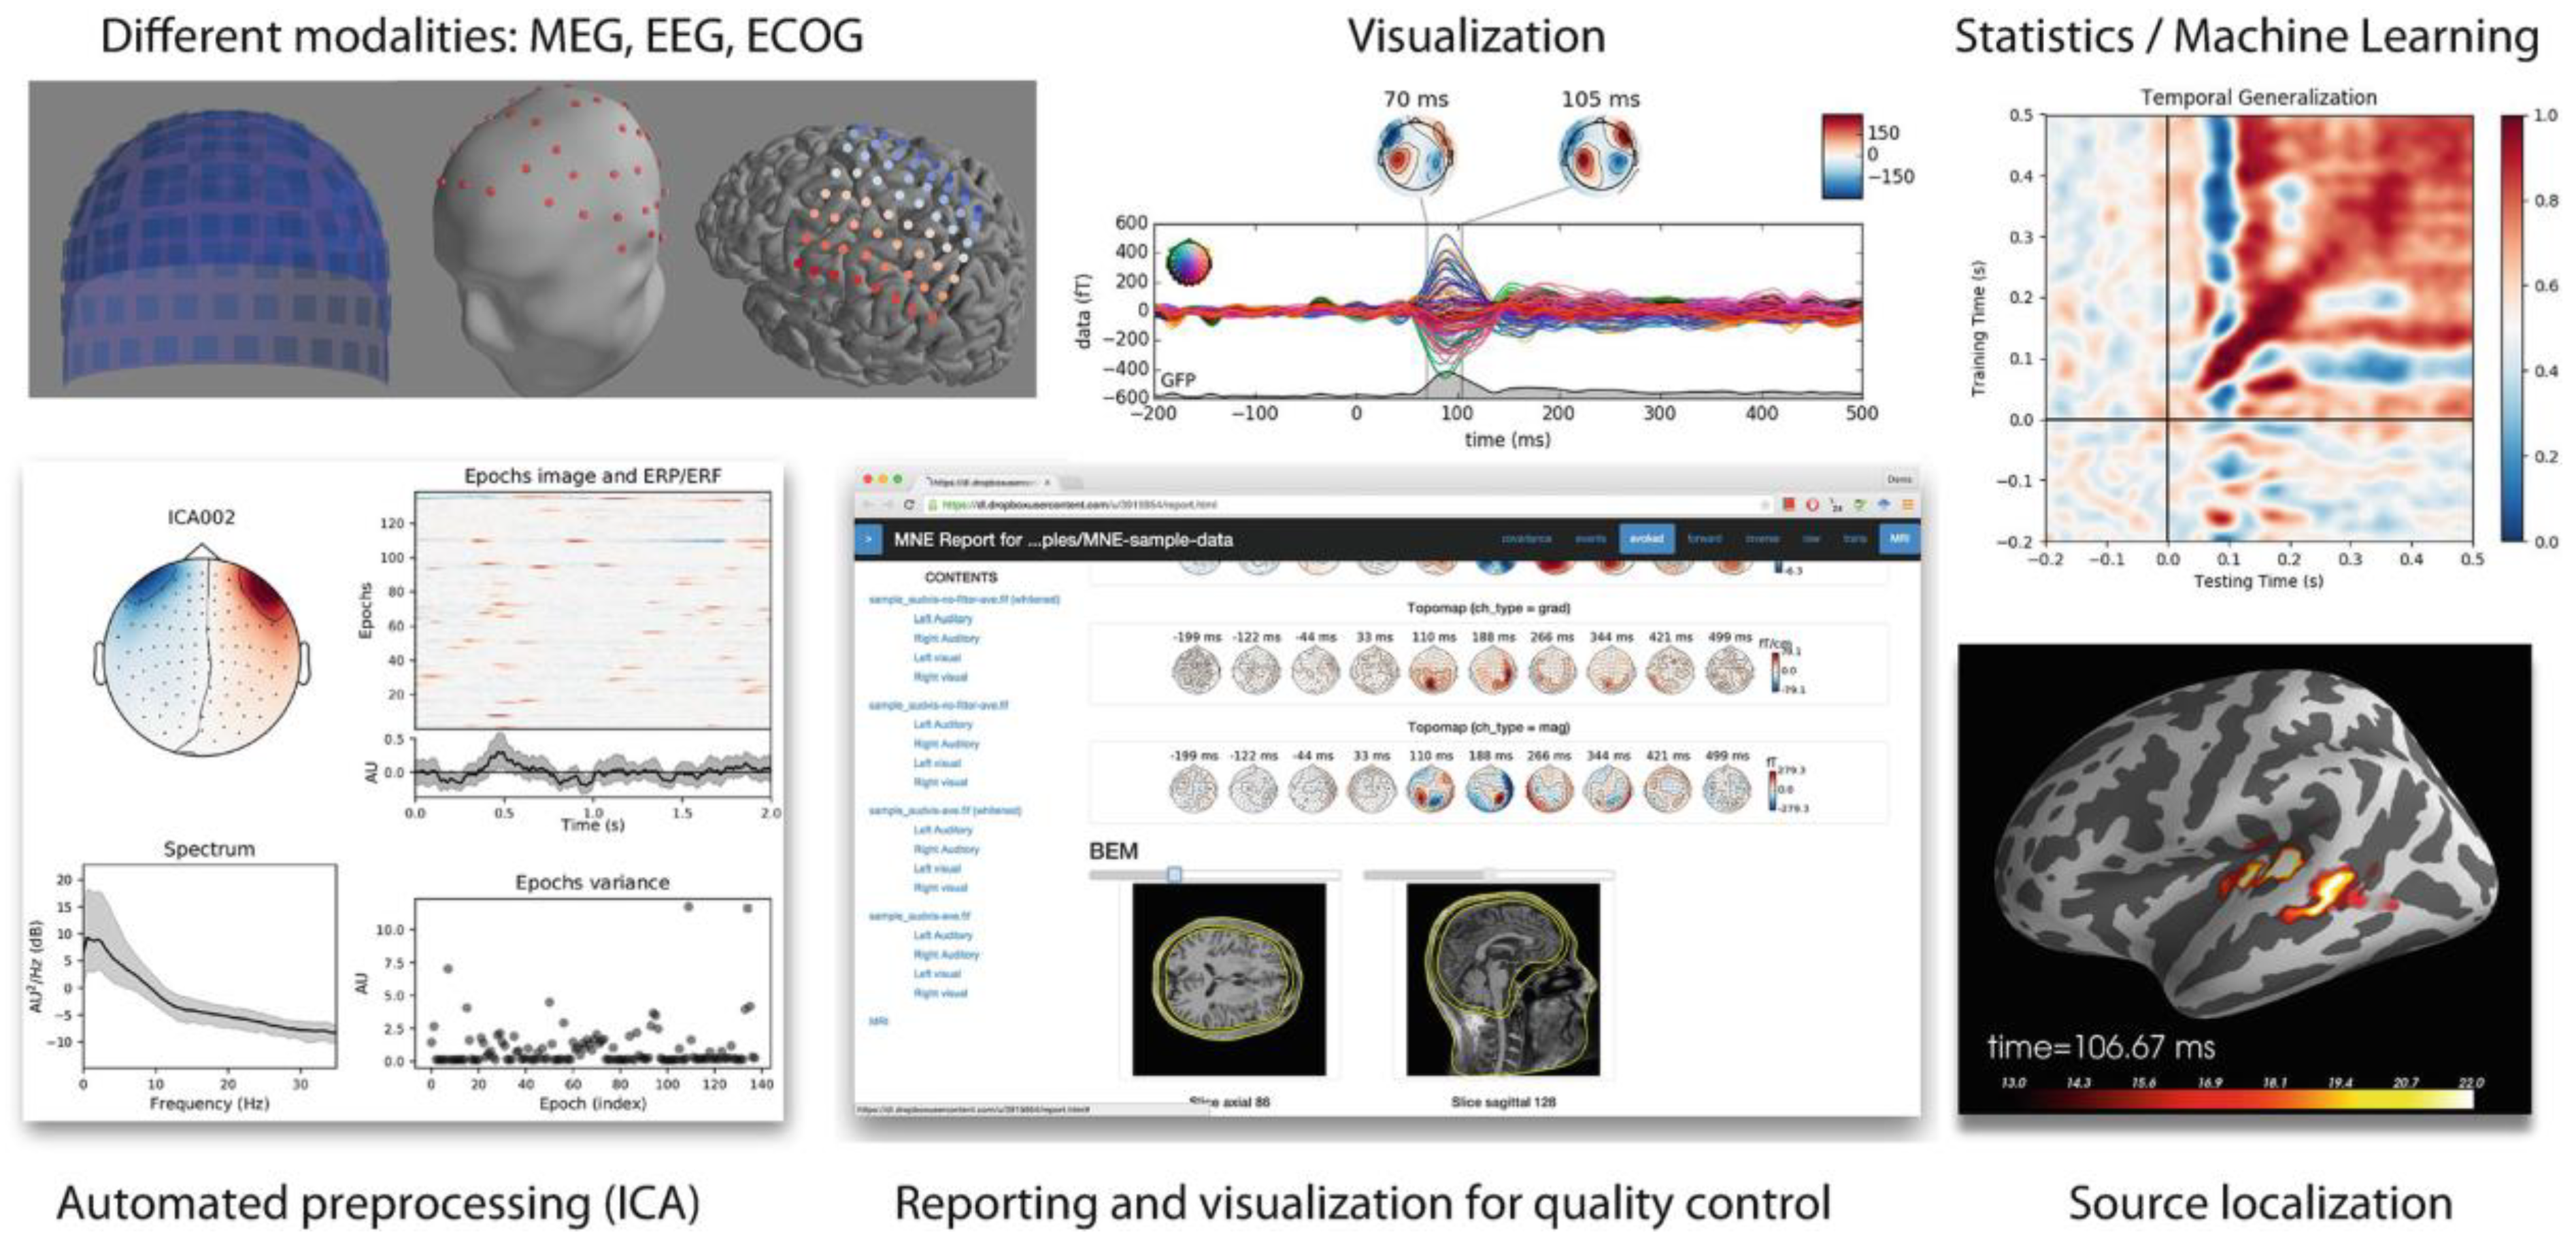
5.12. MNE-Python
5.13. OpenViBE
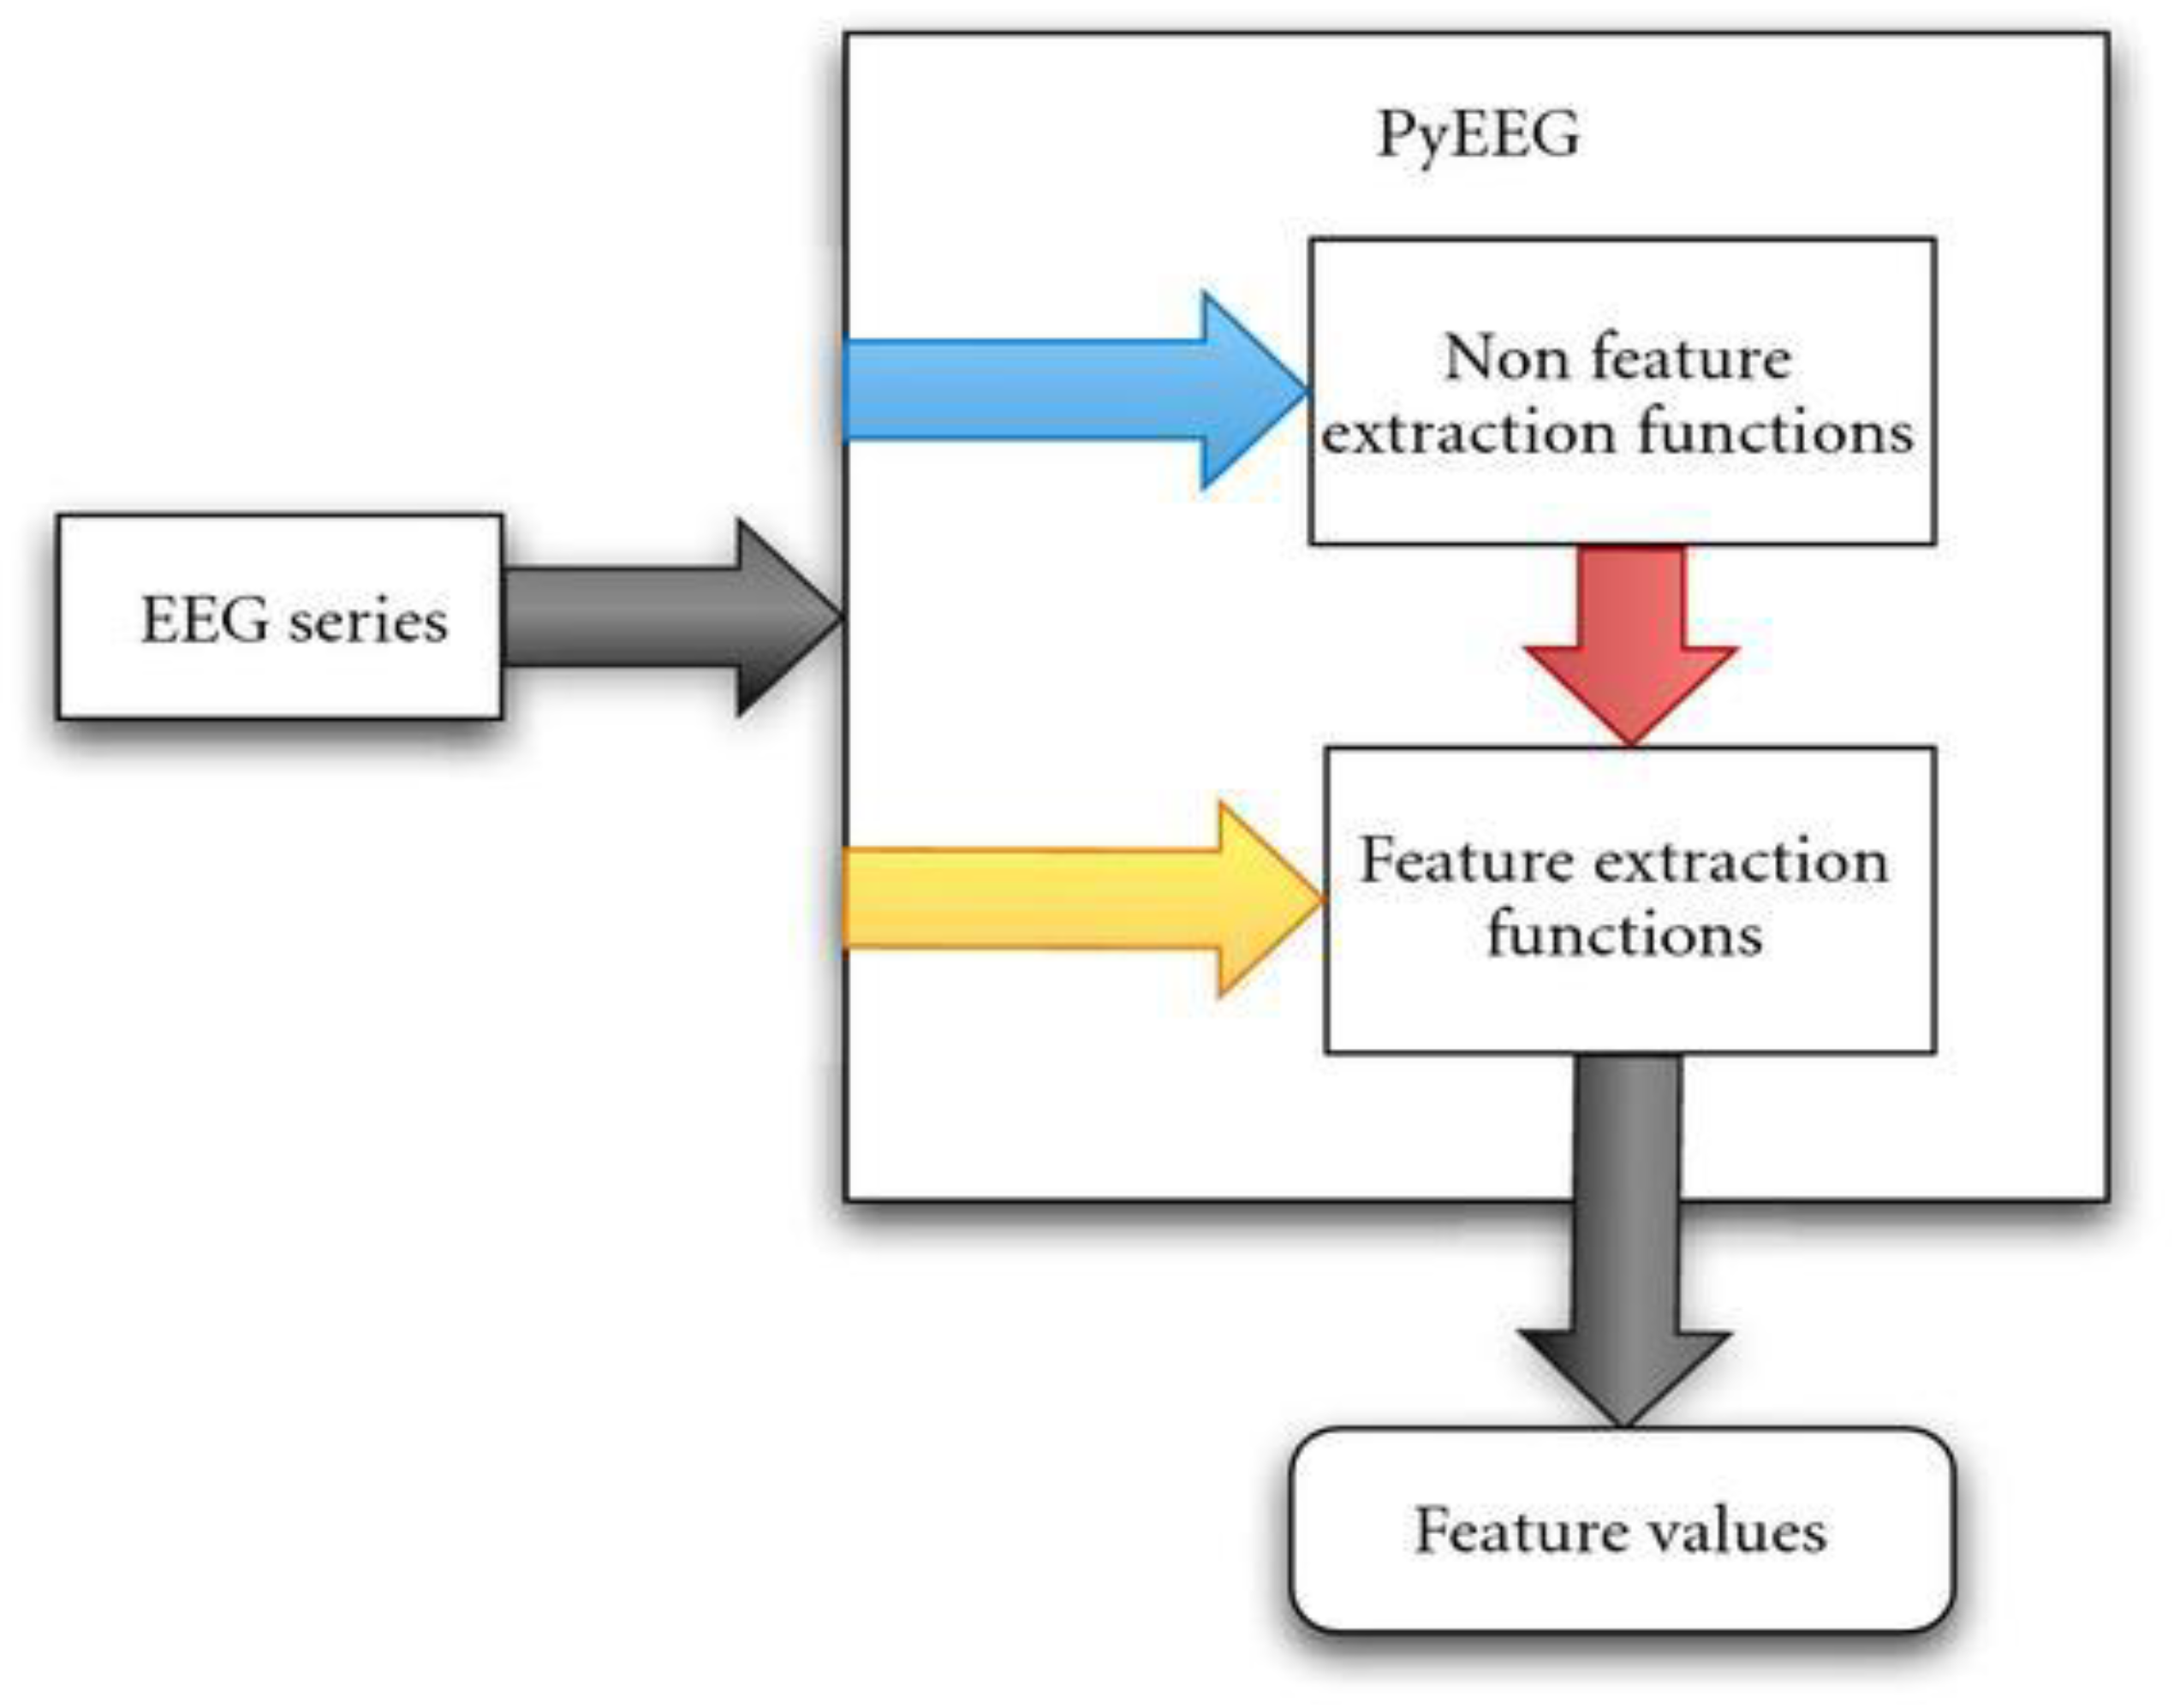
5.14. PyEEG
5.15. Statistical Parametric Mapping (SPM)
5.16. TAPEEG
5.17. EEGLab
5.18. MATLAB Plugins
6. Conclusions
Author Contributions
Funding
Data Availability Statement
Conflicts of Interest
Abbreviations
| ALLSSA | Anti-Leakage Least-Squares Spectral Analysis |
| ANOVA | Analysis of Variance |
| ANCOVAs | Analysis of Covariance |
| BCI | Brain-Computer Interface |
| BOLD | Blood Oxygen Level-Dependent |
| BSF | Broad Spatial Frequency |
| BSL | BIOPAC STUDENT LAB |
| CCA | Canonical correlation analysis |
| CLSSA | Constrained Least-Squares Spectral Analysis |
| CNN | Convolutional Neural Network |
| CSP | Common Spatial Pattern |
| CWT | Continuous Wavelet Transform |
| DFA | Detrended Fluctuation Analysis |
| ECG | Electrocardiogram |
| ECoG | Electrocorticogram |
| EEG | Electroencephalography |
| EMD | Empirical Mode Decomposition |
| EMG | Electromyogram |
| EOG | Electrooculogram |
| ERPs | Event-Related Potentials |
| FFT | Fast Fourier Transform |
| FI | Fisher Information |
| FIR | Finite Impulse Response |
| GUI | Graphical User Interface |
| HFD | Higuchi Fractal Dimension |
| ICA | Independent Component Analysis |
| iEEG | intracranial EEG |
| IFFT | Inverse Fast Fourier Transform |
| IIR | Infinite Impulse Response |
| KNN | K-Nearest Neighbors |
| LDA | Linear discriminant Analysis |
| LFP | Local Field Potentials |
| LMS | Least Mean Square |
| LPP | Late Positive Potential |
| LSSA | Least-Squares Spectral Analysis |
| LSF | Low broad Spatial Frequency |
| MALSSA | Multichannel Anti-Leakage |
| MEG | Magnetoencephalogram |
| NLM | Non-Local Means |
| NMD | Non-linear Mode Decomposition |
| PCA | Principal component analysis |
| PFD | Petrosian Fractal Dimension |
| PLS | Partial Least Squares |
| PSD | Power Spectrum Density |
| QDA | Quadratic Discriminant Analysis |
| RDA | Regularized Discriminant Analysis |
| RNN | Recurrent neural network |
| SSP | Signal Space Projection |
| SSA | Singular Spectrum Analysis |
| SVM | Support Vector Machine |
| SVDEn | Singular Value Decomposition Entropy |
| XWT | Cross-Wavelet Transform |
Appendix A

| Name | Description |
|---|---|
| FIRfilt | Apply a variety of linear filters to EEGLAB data. |
| CleanRawData | Cleans raw EEG data using a variety of methods, including Artifact Subspace Reconstruction. |
| DIPFIT | Dipole modeling of independent data components using a spherical or boundary element head model. Uses functions from the FIELDTRIP toolbox. |
| ICLabel | An automated EEG independent component classi- fier plugin for EEGLAB. |
| App- MATLABViewer | The bids-matlab-tool repository contains a collection of functions to import and export BIDS (Brain Imag- ing Data Structure)-formated experiments. |
| bids-matlab- tools | Import/export data in a wide variety of data formats. |
| BIOSIG | Toolbox allowing data import in multiple data for- mats. It contains functions redundant with EEGLAB but also contains unique functions. |
| FileIO | Import/export files from/to the Brain Vision Soft- ware Analyser suite. |
| ANTeepimport | Import data files in the EEP format of the ANT EEG company. |
| bva-io | Import/export files from/to the Brain Vision Soft- ware Analyser suite. |
| neuroscanio | Import/export files from/to the Neuroscan software. |
| MFFMATLABIO | Import/export files from/to the EGI company in MFF format. |
| xdfimport | Import files in XDF (LSL) format (EEG stream and EEG marker stream only). |
| Mobilab | Import files in XDF (LSL) format and allow fusing streams at different sampling rates for joint process- ing in EEGLAB |
| IIRfilt | Apply short non-linear infinite impulse response filters to EEGLAB data. |
| REST | A method to standardize a reference of scalp EEG recordings to a point at infinity. |
| AAR | The Automatic Artifact Removal toolbox aims to integrate several state-of-the-art methods for the au- tomatic removal of ocular and muscular artifacts in the electroencephalogram (EEG). |
| VisEd | The Vised Marks extension for EEGLAB adds editing functions to the native eegplot data scrolling figure. Specifically, it allows adding/editing event mark- ers, flagging channels/components, flagging time periods, and displaying the properties of the marks structure. |
| get_chanlocs | The get_chanlocs EEGLAB plugin locates 3-D elec- trode positions from a 3-D scanned head image. A tutorial on how to acquire these images with off-the- shelf equipment is included. |
| FMRIB | Remove fMRI-environment artifacts from EEGLAB data. This extension allows the removal of scanner- related artifacts from EEG data collected during fMRI scanning. |
| BERGEN | Removal of fMRI-related gradient artifacts from si- multaneous EEG-fMRI data. The BERGEN extension for EEGLAB provides a GUI with different methods for gradient artifact correction. |
| MARA | Automatic identification of artifactual independent components. MARA is a linear classifier that learns from expert ratings by extracting six features from the spatial, spectral, and temporal domains. |
| FASTER | Implements a fully automated, unsupervised method for processing high-density EEG data. FASTER includes common features such as data im- porting, epoching, re-referencing, grand average cre- ation, automated channel, epoch, and artifact rejec- tion based on ICA. |
| ADJUST | A completely automatic algorithm that identifies artifact-related Independent Components by com- bining stereotyped artifact-specific spatial and tem- poral features. |
| CORRMAP | Semi-automatic identification of common EEG arti- facts based on a template. The CORRMAP extension consists of a set of MATLAB functions allowing the identification and clustering of independent compo- nents representing common EEG artifacts. |
| CIAC | The cochlear implant artifact correction is a semi- automatic ICA-based tool for the correction of elec- trical artifacts originating from cochlear implants. |
| RELICA | The goal of RELICA is to identify IC processes that are most stably separated from the decomposition data across many random bootstrap selections of its data frames or epochs. |
| MP_clustering | A toolbox for Measure Projection Analysis for pro- jecting EEG measures tagged by source location into a common template brain space, testing local spatial measure consistency, and parsing measure- consistent brain areas into measure-separable domains. |
| REGICA | An extension to remove EOG artifacts by regression performed on ICA components. A semi-simulated dataset that might be used in any artifact rejection study is also available. |
| SASICA | SASICA is an EEGLAB plugin to help the researcher to reject/select independent components based on the various properties of these components. |
| Automagic | Automagic is a MATLAB-based toolbox for prepro- cessing of EEG-datasets. It has been developed to offer user-friendly preprocessing software for big (and small) EEG datasets. |
| AMICA | Adaptive Mixture Independent Component Analy- sis (AMICA) is a binary program and EEGLAB plu- gin that performs an independent component anal- ysis (ICA) decomposition on input data, potentially with multiple ICA models. Also, consider download- ing the postAmicaUtility plugin. |
Appendix B
| Name | Description |
|---|---|
| Signal Analyzer | A powerful toolbox of useful signal analysis functions. Provides visualization, preprocessing, filtering and analysis tools for generic signals. |
| EEGLab | The most popular EEG specific MATLAB plugin. Provides extensive and state of the art EEG data processing. EEGLab is capable of performing most of the tasks described in this table, and has its own extensive ecosystem of plugins. |
| NFT Toolbox | Neuroelectromagnetic Forward Head Modeling Toolbox. This tool is used to physically map EEG data to a head model. This allows for visualization and better understanding of the collected data. |
| SIFT | Used for analysis of EEG data flow between multiple Sources. |
| HeadIT | Database system for easy storage and retrieval of EEG data based on biomarkers and metadata. |
| BCILAB | Toolbox for classification of EEG signals. Simplifies the creation of Brain Computer Interfaces by allowing MATLAB to classify EEG signals in real time. |
| ERICA | Overarching framework which allows for recording, analysis, and stimulus control. |
References
- Pavlov, A.N.; Pitsik, E.N.; Frolov, N.S.; Badarin, A.; Pavlova, O.N.; Hramov, A.E. Age-related distinctions in eeg signals during execution of motor tasks characterized in terms of long-range correlations. Sensors 2020, 20, 5843. [Google Scholar] [CrossRef] [PubMed]
- Yang, H.; Han, J.; Min, K. A multi-column CNN model for emotion recognition from EEG signals. Sensors 2019, 19, 4736. [Google Scholar] [CrossRef]
- Aldayel, M.; Ykhlef, M.; Al-Nafjan, A. Deep learning for EEG-based preference classification in neuromarketing. Appl. Sci. 2020, 10, 1525. [Google Scholar] [CrossRef]
- Kopańska, M.; Ochojska, D.; Dejnowicz-Velitchkov, A.; Banaś-Ząbczyk, A. Quantitative Electroencephalography (QEEG) as an Innovative Diagnostic Tool in Mental Disorders. Int. J. Environ. Res. Public Health 2022, 19, 2465. [Google Scholar] [CrossRef]
- Annarumma, L.; D’Atri, A.; Alfonsi, V.; De Gennaro, L. The efficacy of transcranial current stimulation techniques to modulate resting-state EEG, to affect vigilance and to promote sleepiness. Brain Sci. 2018, 8, 137. [Google Scholar] [CrossRef]
- Alturki, F.A.; AlSharabi, K.; Abdurraqeeb, A.M.; Aljalal, M. EEG signal analysis for diagnosing neurological disorders using discrete wavelet transform and intelligent techniques. Sensors 2020, 20, 2505. [Google Scholar] [CrossRef]
- Prasanna, J.; Subathra MS, P.; Mohammed, M.A.; Damaševičius, R.; Sairamya, N.J.; George, S.T. Automated epileptic seizure detection in pediatric subjects of CHB-MIT EEG database—A survey. J. Pers. Med. 2021, 11, 1028. [Google Scholar] [CrossRef]
- Ebrahimzadeh, E.; Shams, M.; Rahimpour Jounghani, A.; Fayaz, F.; Mirbagheri, M.; Hakimi, N.; Rajabion, L.; Soltanian-Zadeh, H. Localizing confined epileptic foci in patients with an unclear focus or presumed multifocality using a component-based EEG-fMRI method. Cogn. Neurodyn. 2021, 15, 207–222. [Google Scholar] [CrossRef]
- Avila, J.; Perry, G. A multilevel view of the development of Alzheimer’s disease. Neuroscience 2021, 457, 283–293. [Google Scholar] [CrossRef] [PubMed]
- Soufineyestani, M.; Dowling, D.; Khan, A.A. Electroencephalography (EEG) Technology Applications and Available Devices. Appl. Sci. 2020, 10, 7453. [Google Scholar] [CrossRef]
- Kang, H.; Nam, Y.; Choi, S. Composite common spatial pattern for subject-to-subject transfer. IEEE Signal Process. Lett. 2009, 16, 683–686. [Google Scholar] [CrossRef]
- Ahmed, M.Z.I.; Sinha, N.; Phadikar, S.; Ghaderpour, E. Automated Feature Extraction on AsMap for Emotion Classification Using EEG. Sensors 2022, 22, 2346. [Google Scholar] [CrossRef] [PubMed]
- Ghaderpour, E.; Pagiatakis, S.D.; Hassan, Q.K. A survey on change detection and time series analysis with applications. Appl. Sci. 2021, 11, 6141. [Google Scholar] [CrossRef]
- Maddirala, A.K.; Shaik, R.A. Separation of sources from single-channel EEG signals using independent component analysis. IEEE Trans. Instrum. Meas. 2017, 67, 382–393. [Google Scholar] [CrossRef]
- Ponciano, V.; Pires, I.M.; Ribeiro, F.R.; Garcia, N.M.; Villasana, M.V.; Zdravevski, E.; Lameski, P. Machine learning techniques with ECG and EEG data: An exploratory study. Computers 2020, 9, 55. [Google Scholar] [CrossRef]
- Kundu, B.; Naidu, D.S. Classification and Feature Extraction of Different Hand Movements from EMG Signal using Machine Leaning based Algorithms. In Proceedings of the 2021 International Conference on Electrical, Communication, and Computer Engineering (ICECCE), Kuala Lumpur, Malaysia, 12–13 June 2021; IEEE: New York, NY, USA, 2021; pp. 1–5. [Google Scholar]
- Emmert, K.; Breimhorst, M.; Bauermann, T.; Birklein, F.; Rebhorn, C.; Van De Ville, D.; Haller, S. Active pain coping is associated with the response in real-time fMRI neurofeedback during pain. Brain Imaging Behav. 2017, 11, 712–721. [Google Scholar] [CrossRef] [PubMed]
- Li, X.; Chen, X.; Yan, Y.; Wei, W.; Wang, Z.J. Classification of EEG signals using a multiple kernel learning support vector machine. Sensors 2014, 14, 12784–12802. [Google Scholar] [CrossRef] [PubMed]
- Kasim, Ö.; Tosun, M. Effective removal of eye-blink artifacts in EEG signals with semantic segmentation. Signal Image Video Process. 2022, 16, 1289–1295. [Google Scholar] [CrossRef]
- Lasefr, Z.; Ayyalasomayajula, S.S.V.; Elleithy, K. Epilepsy seizure detection using EEG signals. In Proceedings of the 2017 IEEE 8th Annual Ubiquitous Computing, Electronics and Mobile Communication Conference (UEMCON), New York, NY, USA, 19–21 October 2017; IEEE: New York, NY, USA, 2017; pp. 162–167. [Google Scholar]
- Melinda, M.; Syahrial; Yunidar; Bahri, A.; Irhamsyah, M. Finite Impulse Response Filter for Electroencephalogram Waves Detection. Green Intell. Syst. Appl. 2022, 2, 7–19. [Google Scholar] [CrossRef]
- Li, M.; Xu, H.; Liu, X.; Lu, S. Emotion recognition from multichannel EEG signals using K-nearest neighbor classification. Technol. Health Care 2018, 26, 509–519. [Google Scholar] [CrossRef]
- Siuly; Wang, H.; Zhang, Y. Detection of motor imagery EEG signals employing Naïve Bayes based learning process. Measurement 2016, 86, 148–158. [Google Scholar] [CrossRef]
- Tibdewal, M.N.; Mahadevappa, M.; Ray, A.K.; Malokar, M.; Dey, H.R. Power line and ocular artifact denoising from EEG using notch filter and wavelet transform. In Proceedings of the 2016 3rd International Conference on Computing for Sustainable Global Development (INDIACom), New Delhi, India, 16–18 March 2016; IEEE: New York, NY, USA, 2016; pp. 1654–1659. [Google Scholar]
- Phadikar, S.; Sinha, N.; Ghosh, R.; Ghaderpour, E. Automatic Muscle Artifacts Identification and Removal from Single-Channel EEG Using Wavelet Transform with Meta-Heuristically Optimized Non-Local Means Filter. Sensors 2022, 22, 2948. [Google Scholar] [CrossRef] [PubMed]
- Edla, D.R.; Mangalorekar, K.; Dhavalikar, G.; Dodia, S. Classification of EEG data for human mental state analysis using Random Forest Classifier. Procedia Comput. Sci. 2018, 132, 1523–1532. [Google Scholar] [CrossRef]
- Veeramallu, G.K.P.; Anupalli, Y.; Kumar Jilumudi, S.; Bhattacharyya, A. EEG based automatic emotion recognition using EMD and random forest classifier. In Proceedings of the 2019 10th International Conference on Computing, Communication and Networking Technologies (ICCCNT), Kanpur, India, 6–8 July 2019; IEEE: New York, NY, USA, 2019; pp. 1–6. [Google Scholar]
- Zheng, W. Multichannel EEG-Based Emotion Recognition via Group Sparse Canonical Correlation Analysis. IEEE Trans. Cogn. Dev. Syst. 2017, 9, 281–290. [Google Scholar] [CrossRef]
- Majidov, I.; Whangbo, T. Efficient classification of motor imagery electroencephalography signals using deep learning methods. Sensors 2019, 19, 1736. [Google Scholar] [CrossRef] [PubMed]
- Zhang, Y.; Zhang, S.; Ji, X. EEG-based classification of emotions using empirical mode decomposition and autoregressive model. Multimed. Tools Appl. 2018, 77, 26697–26710. [Google Scholar] [CrossRef]
- Delimayanti, M.K.; Purnama, B.; Nguyen, N.G.; Faisal, M.R.; Mahmudah, K.R.; Indriani, F.; Kubo, M.; Satou, K. Classification of brainwaves for sleep stages by high-dimensional FFT features from EEG signals. Appl. Sci. 2020, 10, 1797. [Google Scholar] [CrossRef]
- Das, R.K.; Imtiaz, N.Z.; Khan, A. Toward Affirmation of Recovery of Deeply Embedded Autobiographical Memory with Background Music and Identification of an EEG Biomarker in Combination with EDA Signal Using Wearable Sensors. Clin. Transl. Neurosci. 2022, 6, 26. [Google Scholar] [CrossRef]
- Wu, J.; Zhou, T.; Li, T. Detecting epileptic seizures in EEG signals with complementary ensemble empirical mode decomposition and extreme gradient boosting. Entropy 2020, 22, 140. [Google Scholar] [CrossRef] [PubMed]
- Kaiboriboon, K.; Lüders, H.O.; Hamaneh, M.; Turnbull, J.; Lhatoo, S.D. EEG source imaging in epilepsy—Practicalities and pitfalls. Nat. Rev. Neurol. 2012, 8, 498–507. [Google Scholar] [CrossRef] [PubMed]
- Grobbelaar, M.; Phadikar, S.; Ghaderpour, E.; Struck, A.F.; Sinha, N.; Ghosh, R.; Ahmed, M.Z.I. A Survey on Denoising Techniques of Electroencephalogram Signals Using Wavelet Transform. Signals 2022, 3, 577–586. [Google Scholar] [CrossRef]
- AcqKnowledge 5 Demo | BIOPAC. BIOPAC Systems, Inc. Available online: https://www.biopac.com/demo/AcqKnowledge-5-demo/ (accessed on 22 February 2023).
- BESA® | Brain Electrical Source Analysis. BESA® | Brain Electrical Source Analysis. 2022. Available online: https://www.besa.de (accessed on 22 February 2023).
- Sabatinelli, D.; Lang, P.J.; Keil, A.; Bradley, M.M. Emotional perception: Correlation of functional MRI and event-related potentials. Cereb. Cortex 2007, 17, 1085–1091. [Google Scholar] [CrossRef] [PubMed]
- Vijayalakshmi, K.; Sridhar, S.; Khanwani, P. Estimation of effects of alpha music on EEG components by time and frequency domain analysis. In Proceedings of the International Conference on Computer and Communication Engineering (ICCCE’10), Kuala Lumpur, Malaysia, 11–12 May 2010; IEEE: New York, NY, USA, 2010; pp. 1–5. [Google Scholar]
- Hosen, M.R.; Hasan, S.; Hasan, M.M.; Das, R.K. Age classification based on EMG signal using Artificial Neural Network. In Proceedings of the 2015 International Conference on Electrical Engineering and Information Communication Technology (ICEEICT), Dhaka, Bangladesh, 21–23 May 2015; IEEE: New York, NY, USA, 2015; pp. 1–5. [Google Scholar]
- Vidaurre, C.; Sander, T.H.; Schlögl, A. BioSig: The free and open source software library for biomedical signal processing. Comput. Intell. Neurosci. 2011, 2011, 935364. [Google Scholar] [CrossRef] [PubMed]
- Ovcharenko, V.V.; Rudenko, M.A.; Larina, N.V.; Sivtseva, A.S. Analysis and Assessment of Dynamics of Neurocomputer Performance Measures. In Proceedings of the 2020 International Conference on Industrial Engineering, Applications and Manufacturing (ICIEAM), Sochi, Russia, 18–22 May 2020; IEEE: New York, NY, USA, 2020; pp. 1–5. [Google Scholar]
- Parfenov, Andrey. n.d. OpenBCI GUI with BrainFlow. Available online: https://brainflow.org/2020-06-11-openbcigui/ (accessed on 22 February 2023).
- Tadel, F.; Baillet, S.; Mosher, J.C.; Pantazis, D.; Leahy, R.M. Brainstorm: A user-friendly application for MEG/EEG analysis. Comput. Intell. Neurosci. 2011, 2011, 1–13. [Google Scholar] [CrossRef] [PubMed]
- Méndez-Bértolo, C.; Moratti, S.; Toledano, R.; Lopez-Sosa, F.; Martinez-Alvarez, R.; Mah, Y.H.; Vuilleumier, P.; Gil-Nagel, A.; Strange, B.A. A fast pathway for fear in human amygdala. Nat. Neurosci. 2016, 19, 1041–1049. [Google Scholar] [CrossRef] [PubMed]
- EDFbrowser. Available online: https://www.teuniz.net/edfbrowser/ (accessed on 22 February 2023).
- Bansal, D.; Mahajan, R.; Singh, S.; Rathee, D.; Roy, S. Real time acquisition and analysis of neural response for rehabilitative control. Int. J. Electr. Robot. Electron. Commun. Eng. 2014, 8, 697–701. [Google Scholar]
- Hassan, M.; Shamas, M.; Khalil, M.; Falou, W.E.; Wendling, F. EEGNET: An Open Source Tool for Analyzing and Visualizing M/EEG Connectome. PLoS ONE 2015, 10, e0138297. [Google Scholar] [CrossRef]
- Shamas, M.; Wendling, F.; El Falou, W.; Hassan, M. EEGNET: A novel tool for processing and mapping EEG functional networks. In Proceedings of the 2015 7th International IEEE/EMBS Conference on Neural Engineering (NER), Montpellier, France, 22–24 April 2015; IEEE: New York, NY, USA, 2015; pp. 1064–1067. [Google Scholar]
- Hassan, M.; Merlet, I.; Mheich, A.; Kabbara, A.; Biraben, A.; Nica, A.; Wendling, F. Identification of interictal epileptic networks from dense-EEG. Brain Topogr. 2017, 30, 60–76. [Google Scholar] [CrossRef]
- Aguera, P.E.; Jerbi, K.; Caclin, A.; Bertrand, O. ELAN: A software package for analysis and visualization of MEG, EEG, and LFP signals. Comput. Intell. Neurosci. 2011, 2011, 1–11. [Google Scholar] [CrossRef]
- Bottari, D.; Caclin, A.; Giard, M.H.; Pavani, F. Changes in early cortical visual processing predict enhanced reactivity in deaf individuals. PLoS ONE 2011, 6, e25607. [Google Scholar] [CrossRef]
- Pernet, C.R.; Chauveau, N.; Gaspar, C.; Rousselet, G.A. LIMO EEG: A toolbox for hierarchical LInear MOdeling of ElectroEncephaloGraphic data. Comput. Intell. Neurosci. 2011, 2011, 1–11. [Google Scholar] [CrossRef] [PubMed]
- Esch, L.; Dinh, C.; Larson, E.; Engemann, D.; Jas, M.; Khan, S.; Gramfort, A.; Hämäläinen, M.S. MNE: Software for acquiring, processing, and visualizing MEG/EEG data. In Magnetoencephalography: From Signals to Dynamic Cortical Networks; Springer: Berlin/Heidelberg, Germany, 2019; pp. 355–371. [Google Scholar]
- Jas, M.; Engemann, D.A.; Bekhti, Y.; Raimondo, F.; Gramfort, A. Autoreject: Automated artifact rejection for MEG and EEG data. NeuroImage 2017, 159, 417–429. [Google Scholar] [CrossRef] [PubMed]
- Renard, Y.; Lotte, F.; Gibert, G.; Congedo, M.; Maby, E.; Delannoy, V.; Bertrand, O.; Lécuyer, A. Openvibe: An open-source software platform to design, test, and use brain–computer interfaces in real and virtual environments. Presence 2010, 19, 35–53. [Google Scholar] [CrossRef]
- Zich, C.; Debener, S.; Kranczioch, C.; Bleichner, M.G.; Gutberlet, I.; De Vos, M. Real-time EEG feedback during simultaneous EEG–fMRI identifies the cortical signature of motor imagery. Neuroimage 2015, 114, 438–447. [Google Scholar] [CrossRef]
- Bao, F.S.; Liu, X.; Zhang, C. PyEEG: An open source python module for EEG/MEG feature extraction. Comput. Intell. Neurosci. 2011, 2011, 406391. [Google Scholar] [CrossRef]
- Thara, D.; Premasudha, B. Electroencephalogram analysis for Automatic Epileptic Seizure detection method using PyEEG. Int. J. Eng. Sci. Manag.-Multidiscip. Publ. VTU 2019, 1, 22–26. [Google Scholar]
- Flandin, G.; Friston, K.J. Statistical parametric mapping (SPM). Scholarpedia 2008, 3, 6232. [Google Scholar] [CrossRef]
- Franke, K.; Ziegler, G.; Klöppel, S.; Gaser, C.; Alzheimer’s Disease Neuroimaging Initiative. Estimating the age of healthy subjects from T1-weighted MRI scans using kernel methods: Exploring the influence of various parameters. Neuroimage 2010, 50, 883–892. [Google Scholar] [CrossRef]
- Hatz, F.; Hardmeier, M.; Benz, N.; Ehrensperger, M.; Gschwandtner, U.; Rüegg, S.; Schindler, C.; Monsch, A.U.; Fuhr, P. Microstate connectivity alterations in patients with early Alzheimer’s disease. Alzheimers Res. Ther. 2015, 7, 1–11. [Google Scholar] [CrossRef]
- Delorme, A.; Makeig, S. EEGLAB: An open source toolbox for analysis of single-trial EEG dynamics including independent component analysis. J. Neurosci. Methods 2004, 134, 9–21. [Google Scholar] [CrossRef]
- Valipour, S.; Shaligram, A.; Kulkarni, G. Detection of an alpha rhythm of EEG signal based on EEGLAB. Int. J. Eng. Res. Appl. 2014, 4, 154–159. [Google Scholar]
- Ahirwal, M.K.; Londhe, N. Power spectrum analysis of EEG signals for estimating visual attention. Int. J. Comput. Appl. 2012, 42, 22–25. [Google Scholar]
- Gao, Y.; Lee, H.J.; Mehmood, R.M. Deep learninig of EEG signals for emotion recognition. In Proceedings of the 2015 IEEE International Conference on Multimedia & Expo Workshops (ICMEW), Torino, Italy, 29 June–3 July 2015; IEEE: New York, NY, USA, 2015; pp. 1–5. [Google Scholar]


Disclaimer/Publisher’s Note: The statements, opinions and data contained in all publications are solely those of the individual author(s) and contributor(s) and not of MDPI and/or the editor(s). MDPI and/or the editor(s) disclaim responsibility for any injury to people or property resulting from any ideas, methods, instructions or products referred to in the content. |
© 2023 by the authors. Licensee MDPI, Basel, Switzerland. This article is an open access article distributed under the terms and conditions of the Creative Commons Attribution (CC BY) license (https://creativecommons.org/licenses/by/4.0/).
Share and Cite
Das, R.K.; Martin, A.; Zurales, T.; Dowling, D.; Khan, A. A Survey on EEG Data Analysis Software. Sci 2023, 5, 23. https://doi.org/10.3390/sci5020023
Das RK, Martin A, Zurales T, Dowling D, Khan A. A Survey on EEG Data Analysis Software. Sci. 2023; 5(2):23. https://doi.org/10.3390/sci5020023
Chicago/Turabian StyleDas, Rupak Kumar, Anna Martin, Tom Zurales, Dale Dowling, and Arshia Khan. 2023. "A Survey on EEG Data Analysis Software" Sci 5, no. 2: 23. https://doi.org/10.3390/sci5020023