Article

Assessment of Habitat Change Processes within the Oti-Keran-Mandouri Network of Protected Areas in Togo (West Africa) from 1987 to 2013 Using Decision Tree Analysis

1
West African Science Service Center for Climate Change and Adapted Land Use, Université Félix Houphouët-Boigny, 31 BP 165 Abidjan, Cote D’Ivoire
2
Laboratoire de Botanique et Ecologie Végétale, Faculté des Sciences, Université de Lomé, BP 1515 Lomé, Togo
3
Laboratoire de Zoologie et Biologie Animale, UFR Biosciences, Université Félix Houphouët-Boigny, 02 BP 1170 Abidjan, Cote D’Ivoire
*
Author to whom correspondence should be addressed.
Submission received: 16 January 2019 / Revised: 17 January 2019 / Accepted: 2 February 2019 / Published: 1 January 2020

Abstract

:
Biodiversity conservation planning is highly important in the current context of global change. Biodiversity conservation can be achieved by understanding changes in land use at the landscape scale. Such understanding is needed to reverse the unprecedented pressure on natural resources that has been reported by many studies conducted on biodiversity conservation within the Oti-Keran-Mandouri protected areas. Land cover maps reflecting different dates (1987, 2000, and 2013) and depicting different management systems, with overall accuracy ranging from 73% to 79%, were analyzed to understand the processes that lead to habitat degradation within these protected areas. The nature of change, within a given land cover class, was determined by comparing land cover maps on different dates using a decision tree algorithm that compares the number of patches, their areas, and their perimeters at different time periods (T1 and T2). Specifically, two time-periods were considered for this analysis: 1987–2000 and 2000–2013. Croplands and settlements increased at an average of 108.13% and 5.45%, respectively, from 1987 to 2000. From 2000 to 2013, croplands gained from all other land categories and continued to increase at a rate of 11.77% per year, whereas forests and savannas decreased at an annual average rate by 5.79% and 2.32%, respectively. The dominant processes of habitat change from 1987 to 2000 were the creation of forests, dissection of savannas, attrition of wetlands, and creation of croplands. Meanwhile, from 2000 to 2013, there was attrition of forests, as well as attrition of savannas, dissection of wetlands, and aggregation of croplands. In general, from 1987 to 2013, natural habitats regressed and were replaced by croplands; forests, savannas, and wetlands decreased at an average annual percentage 5.74%, 3.94%, and 2.02%, respectively, whereas croplands increased at an average annual rate of 285.39% of their own area. Aggregation, attrition, dissection, and creation were the main habitat change processes identified for the overall period from 1987 to 2013. There was habitat loss in forests and savannas and habitat fragmentation in wetland due to attrition and dissection, respectively. Identifying and understanding habitat change processes would enable the taking of appropriate biodiversity conservation actions.

1. Introduction

In the current context of climate change, it is very important to preserve nature and its biodiversity components through sustainable conservation planning. Such action will contribute to climate mitigation and provide habitats for wildlife. Habitats are the foundation of natural resource management and conservation [1]. However, increasing human pressure on natural resources leads to habitat loss and habitat fragmentation. Habitat loss has strong negative effects on biodiversity, whereas the influence of habitat fragmentation appears to be much weaker and may range from negative to positive. Long-term fragmentation experiments indicate that habitat fragmentation reduces biodiversity by 13–75% and impairs key ecosystem functions by decreasing biomass and altering nutrient cycles [2].
Habitat loss refers to the reduction in the overall area of a particular land cover type [3]. Meanwhile, habitat fragmentation is described as a disruption of the linkages among patches that exchange ecologically important resources [4]. Ultimately, what separates habitat fragmentation from simple habitat loss is the disproportionate reduction in the numerical capacity of the remaining habitat of the same net area [5]. The principal countermeasure to habitat fragmentation is maintaining and improving habitat connectivity. Natural or constructed corridors have often been promoted to mitigate the effects of habitat fragmentation by maintaining or improving animal movement and gene flow between habitat patches [5]. Beyond thresholds of disturbance, changes in a habitat could be irreversible [1]. Therefore, understanding forest and natural habitat change processes in the study area could improve biodiversity conservation. Such knowledge is needed to prioritize conservation actions and improve habitat connectivity where needed.
Advances in geospatial science and technologies enable the use of satellite data for the quick assessment of the spatial land change processes that induce changes in natural habitats and forest ecosystems. The assessment of land cover/land use change gives information relevant to all land-related actions, such as conservation planning. Most studies in land cover/land use science focus on detecting changes in land cover/land use, as well as the direction and magnitude of changes considering a given period. Some studies also explore the driving factors of land cover change. Few studies assess the spatial processes inducing the observed land transformation. For instance, there are multiple and complex causes of forest degradation and wildlife habitat loss in West Africa. The expanding human population and intensified agricultural activities have been reported as some of the most significant causes [6]. Climate change has also been cited in some studies; however, its exact effect remains difficult to discern [7].
The study of the spatial configuration of the landscape could give new insights. According to Bannerman [8], the analysis of spatial landscape patterns can enhance the understanding of dynamic ecological patterns, the role of disturbance in ecosystems, and the characteristics of spatial and temporal scales of ecological events.
Landscape ecologists have conducted many studies to illustrate the relationship between landscape configuration and functioning. It appears that spatial change processes result from a limited number of common spatial configurations. A multitude of metrics were developed to assess landscape spatial configurations. Some metrics, such as area, perimeter, and the number of patches of a focal landscape class, have been used to identify the spatial processes involved in land transformation. Bogaert et al. [9] proposed a decision tree to identify such spatial processes. These spatial change processes are sequential, and their identification could improve conservation planning by guiding appropriate interventions.
Forest ecosystems and wildlife habitats are currently under high human pressure and climate change impacts in West Africa [10,11,12], particularly in Togo [13]. In this country, forest cover is being highly reduced with serious impacts on ecosystem resilience to climate change [14]. It has become important to characterize the spatial process transforming the landscape, because this information could contribute to sustainable conservation planning or better environmental management. No study has been conducted yet to assess habitat change processes within the Oti-Keran-Mandouri complex of protected areas in Togo, but such a study was successfully conducted by Barima et al. [15] to assess landscape dynamics in a transitional forest–savanna zone in Côte d’Ivoire.
Therefore, the main objective of this study is to contribute to sustainable conservation planning in Togo, especially for large mammals such as the African savanna elephant. This study specifically assesses habitat change processes within the Oti-Keran-Mandouri complex of protected areas using satellite-derived land cover maps. This study will enable the identification of habitat change processes on going in the complex of protected areas and help direct eventual restoration actions.

2. Materials and Methods

2.1. Study Area

The study was conducted within Oti-Keran-Mandouri (OKM) (Figure 1), a complex of protected areas, Oti-Keran and Oti-Mandouri, covering about 179,000 ha [16]. The complex is located in the flat plains of the Oti River basin in Togo. It belongs to the eco-floristic zone I [17] and is characterized by a tropical climate.
Sudanian savanna, dry forest, and riparian forest constitute the main vegetation of this area. The large wetlands of the Oti River and its tributaries present important biotopes for migrating birds. Thus, these wetlands are recognized as an important bird area [18]. The OKM complex is also considered to be a key component of the range and conservation corridors of the savanna elephant in West Africa.
Oti-Keran-Mandouri lies within two administrative regions: “Savanes” and “Kara”. Agriculture, especially smallholder farming, is the principal activity in this area and occupies around 70–80% of the active population [19]. The most cultivated crops are sorghum (Sorghum bicolor (L.) Moench.), corn (Zea mays L.), millet (Pennisetum glaucum (L.) R. Br. Ssp. glaucum), rice (Oryza sativa L.), yams (Dioscorea sp), and cassava (Manihot esculenta Crantz.). There is currently increasing interest in cash crop production, such as cotton (Gossypium hirsutum L.). Consequently, there is great pressure from farmers to access fertile lands. In addition to farming, service timber lodging, firewood harvesting [20,21], non-timber product cultivation (e.g., fruits, medicinal plants, straw), charcoal production [22,23,24], hunting, and fishing [25] are other activities practiced by the local communities. Transnational livestock transhumance constitutes another important activity and threat to biodiversity that is yet to be documented in this area.

2.2. Data Acquisition

Landsat images of 30-m spatial resolution acquired in 1987, 2000, and 2013 were downloaded for free from United State Geological Survey (USGS) platform (https://glovis.usgs.gov/). These timeframes were chosen to characterize 3 important periods marked by different management systems of the protected areas in Togo as described by Folega et al. [26]. The first period, from the colonial era to 1990, was marked by strict protection; the second period, from 1990 to 2000, was marked by anarchic exploitation; and the third period, from 2000 to the present, is characterized by a process of rehabilitation. The chosen image scenes covering the study area were acquired at the beginning of the dry season to avoid cloud cover. The images were already orthorectified and terrain-corrected. They have not been subjected to further radiometric corrections. Their characteristics are presented below in Table 1.

2.3. Data Analysis

2.3.1. Land Cover Mapping

The training sites were defined and digitized on the basis of color infrared composition for 6 land categories identified during field campaigns (Table 2) according to the classification scheme recommended by the Intergovernmental Panel on Climate Change (IPCC) [27]. Training polygon digitization followed the rule of obtaining enough pixels so that there are at least 10 times as many pixels for each training class as there are bands in the image to classify [28]. Based on defined training sites, a supervised classification using a maximum likelihood algorithm was performed. The classifications were performed using IDRISI GIS and Image Processing software. The classifications were performed with all the bands except band 6 for TM, bands 6 and 8 for ETM, and bands 1, 6, 8, 9, 10, and 11 for OLI. The accuracy assessment was based on Cohen’s Kappa [29,30], as well as on the user’s, producer’s, and overall accuracies [31].
Landsat 4 scenes (1 and 2) and Landsat 7 scenes (3 and 4) were mosaicked to create a larger image composite. This process was done by matching the images’ grey levels in the overlapping areas using a cover method and by calculating matching statistics based on non-background values [28]. The resulting composites were registered to the 2013 Landsat 8 scene, which covers the entire study area due to the scene size of Landsat 8, which is 185 km cross-track by 180 km along-track [32].
The reference data for accuracy assessment of classified images have been collected differently for each image. They were based on ground verification data for the recent image, while they were generated from the national topographic map established in 1980, the national vegetation map [33], and other available maps for the historical images (2000 and 1987).
Binomial distribution was used to determine the appropriate sample size to obtain an unbiased ground reference for valid statistical testing of the land cover map accuracy. This is recognized as an appropriate mathematical model to use in determining an adequate sample size for accuracy assessment [34,35,36,37,38]. The formula used for the binomial distribution is as follows:
N = z 2 p q E 2
where N is the number of samples, p is the expected or calculated accuracy (in percentage), q is 100-p, E is the allowable error, and Z is the standard normal deviate for the 95% 2-tail confidence level (1.96).
The confidence level is set in a realistic way, considering field effort and time. Therefore, an allowable error of 5% and an overall map accuracy of between 60% and 95% are usually set [39,40]. Here, the allowable error E was set to 5% for an overall expected accuracy of 80%. The minimum sample size was then calculated and apportioned to the area of the different land cover categories (Table 3). A minimum threshold of 20 sample points was set for each land category [41]. However, this minimum threshold was not reached for the category of water bodies because of the field conditions.
The ground verification points were generated in ERDAS IMAGINE by applying a stratified random sampling scheme with a window kernel of 3 × 3 pixels and on the basis of a majority rule. This results in the selection of a sample point only if a clear majority threshold of 6 pixels out of 9 in the window belonged to the same class [39]. The generation of sample points in this manner ensured that the points were extracted from areas of relatively homogenous land cover classes.

2.3.2. Land Cover Change Analysis

The land cover change analyses were performed on the basis of the pixel by pixel comparison using Land Change Modeler fully integrated software in the IDRISI GIS and Image Processing system [28]. The land cover maps were compared as follows: 1987 and 2000, 2000 and 2013, and 1987 and 2013. Change maps were produced with the combination of Land Change Modeler and ArcGIS.

2.3.3. Assessment of Habitat Change Processes

Forest, savanna, wetland, and settlements land cover categories were considered to be different types of habitats and were used to assess habitat change processes. The earlier and later land cover maps were compared, and the nature of the change process underway within each land cover class was determined. This analysis was performed by using a decision tree procedure [9] that compares the number of land cover patches present within each class between the 2 time periods to changes in their areas and perimeters using the Land Change Modeler [28]. The output is a map where each land cover class is assigned the category of change that it is experiencing.
The decision tree procedure is proposed based on three spatial attributes that are easy to calculate and that are recognized as key elements of landscape pattern measures [42]: area, perimeter, and number of patches of the focal landscape class. The identification of the spatial process responsible for habitat pattern changes was implemented following the procedure outlined by Bogaert, Ceulemans and Salvador-Van Eysenrode [9]. This identification process is presented in Figure 2.
A cross-tabulation analysis [43] was performed afterward to identify the particular change process in each land cover class. These analyses were conducted by using IDRISI GIS software [28], while the number of patches was computed for each land cover by using LecoS [44], a plugin for the QGIS GIS software suite.
The 10 spatial processes for landscape transformation are considered to reflect pattern changes in landscapes (Figure 3):
  • Aggregation: the action or process of collecting units or parts into a whole; to bring or gather together into a whole; to fill gaps or open space;
  • Attrition: the reduction or decrease in the number of patches; the disappearance of patches;
  • Creation: the formation of new patches, which results in an increase in the total number of patches; the act of causing patches to exist; patch genesis;
  • Deformation: the change of patch shape without a change in patch size; patch disfigurement;
  • Dissection: the carving up or subdividing of an area or patch using equal width lines; the sectioning of an area or patch; area or patch (sub)division;
  • Enlargement: the increase of patch size; patch size expansion;
  • Fragmentation: the breaking up of an area into smaller parcels resulting in unevenly separated patches; the breaking up of extensive landscape features into disjointed, isolated, or semi-isolated patches;
  • Perforation: the process of making holes in an area or patch; gap formation; the interruption of land cover continuity by the formation of openings;
  • Shift: patch repositioning; patch translocation;
  • Shrinkage: the decrease or reduction in the size of patches without “attrition”; the progressive reduction of the initial land cover patch, ideally maintaining its original shape.

3. Results

3.1. Classification Accuracy

The overall accuracy of the land cover map is 79.28%, 73.33%, and 79.06% for 1987, 2000, and 2013, respectively. There is a good agreement between the classification results and the reference data with values of Kappa statistics of 0.69, 0.65, and 0.72 as the respective overall classification accuracy. However, there were low producer’s accuracies for the 1987 and 2000 land covers. On the other side, the user’s accuracy was low for croplands and water bodies for TM 1987 (Table 4).

3.2. Land Cover Dynamics

Wetland was the most represented land cover type. From 1987 to 2013, wetlands, forests, and savannas regressed to the benefit of anthropogenic land cover types, which are croplands and settlements (Figure 4). Figure 5 shows the change in the percentage of the overall area of OKM in each land cover type from 1987 to 2013. Wetlands decreased in percentage of the overall area from 43.05% in 1987 to 36.30% in 2000 and to 31.71% in 2013. Savannas decreased from 37.72% in 1987 to 26.34% in 2000 and to 18.41% in 2013. Forests increased from 8.84% in 1987 to 9.03% in 2000 but decreased to 2.24% in 2013. Meanwhile, croplands increased from 0.91% in 1987 to 13.75% in 2000 and to 34.81% in 2013. Settlements decreased from 7.74% in 1987 to 13.22% in 2000 and to 10.22% in 2013. Water bodies decreased from 1.74% in 1987 to 1.36% in 2000 but increased to 2.61% in 2013.
The net change in each land category, i.e., the result of adding the gains, and then subtracting the losses to the earlier land cover areas, is reported in Table 5.
Croplands and settlements increased at an average of 108.13% and 5.45%, respectively, based on the proportion of their own area from 1987 to 2000. From 2000 to 2013, croplands gained from all the other land categories and then continued to increase at a rate of 11.77% per year. Forests and savannas decreased at an annual average rate of 5.79% and 2.32%, respectively. Globally, from 1987 to 2013, forests, savannas, and wetlands decreased at an annual average percentage of 5.74%, 3.94%, and 2.02%, respectively, whereas croplands increased at an annual average rate of 285.39%.

3.3. Habitat Change Processes

Different habitat changes processes dominated the time periods considered for this analysis (1987–2000; 2000–2013; and the overall period from 1987 to 2013). These processes were aggregation, attrition, dissection, and creation (Table 6). Figure 6 and Figure 7 represent the number of patches and their areas for each land category for the same period, respectively. The change process was different from one land category to another. Forests experienced creation from 1987 to 2000 and attrition from 2000 to 2013. However, the dominant change process from 1987 to 2013 was attrition. Concurrently, the number of forest patches increased, and an expansion of the area was observed from 1987 to 2000. However, forest patches, as well as their area, decreased from 2000 to 2013. The number of savanna patches increased from 1987 to 2000 and decreased from 2000 to 2013, whereas their area decreased during both of the two periods. These conversion processes are denoted as dissection from 1987 to 2000 and as attrition from 2000 to 2013. Meanwhile, wetlands were dominated by attrition from 1987 to 2000 and dissection from 2000 to 2013. The number of wetland patches decreased from 1987 to 2000 and increased from 2000 to 2013. The area of wetlands decreased consistently from 1987 to 2000 and from 2000 to 2013. Croplands experienced a continuous increase in area from 1987 to 2013, while the number of cropland patches increased only from 1987 to 2000 but decreased from 2000 to 2013. The underlining land conversion processes were a creation from 1987 to 2000 and aggregation from 2000 to 2013. The dominant habitat changes processes from 1987 to 2013 are the attrition of forests and savannas, dissection of wetlands, and creation of croplands.

4. Discussion

4.1. Image Classification and Accuracy Assessment

The overall accuracy assessment values are good for the classified images of 1987 and 2013 and fair for the image of 2000 compared with the fixed overall accuracy of 80% and an allowable error of 5% set for the calculation of the number of ground-truthing points. These results could be explained by the mix-up in some areas of land categories, such as settlements and croplands. This mix-up could also explain the poor producer’s accuracy for both classes. A similar mix-up was previously reported by Folega, Zhang, Zhao, Wala, Batawila, Huang, Dourma and Akpagana [26]. The study area is characterized by a cultural landscape defined by smallholder agriculture with a traditional agroforestry system wherein farmers dwell in farmlands and crops are associated with multipurpose trees. The cultural landscape has been described by several studies [21,45,46,47]. The mixing of trees and houses in this cultural landscape is the source of the misclassification of settlements and croplands. There is even misclassification of settlements with savannas. This latter confusion was also noticed by Badjana et al. [48].
Poor producer accuracies with Landsat TM imagery, especially for agricultural land cover types and shrublands, were consistently noted by Smith et al. [49], although the overall map accuracy was 74%. This result was explained by the fact that agricultural cover types are highly dynamic in their spectral responses, and shrublands can be confused with other forest types [50]. This almost the same issue in the study area, where there are high heterogeneities in the landscape due to human interventions making it difficult to avoid confusion. On the other hand, the fixed overall accuracy of 80% and an allowable error of 5% were set because of the time and cost to complete this study. This study aims to contribute to sustainable conservation planning, especially for large mammals such as the African savanna elephant. Therefore, the use of moderate-resolution Landsat imagery for this study does not invalidate the results. As stated by Keller and Smith [51], for larger or wider ranging species, landscape component classification may be more general and may be adequately represented by traditional, broader cover types, such as forest or grassland.

4.2. Land Cover Dynamics

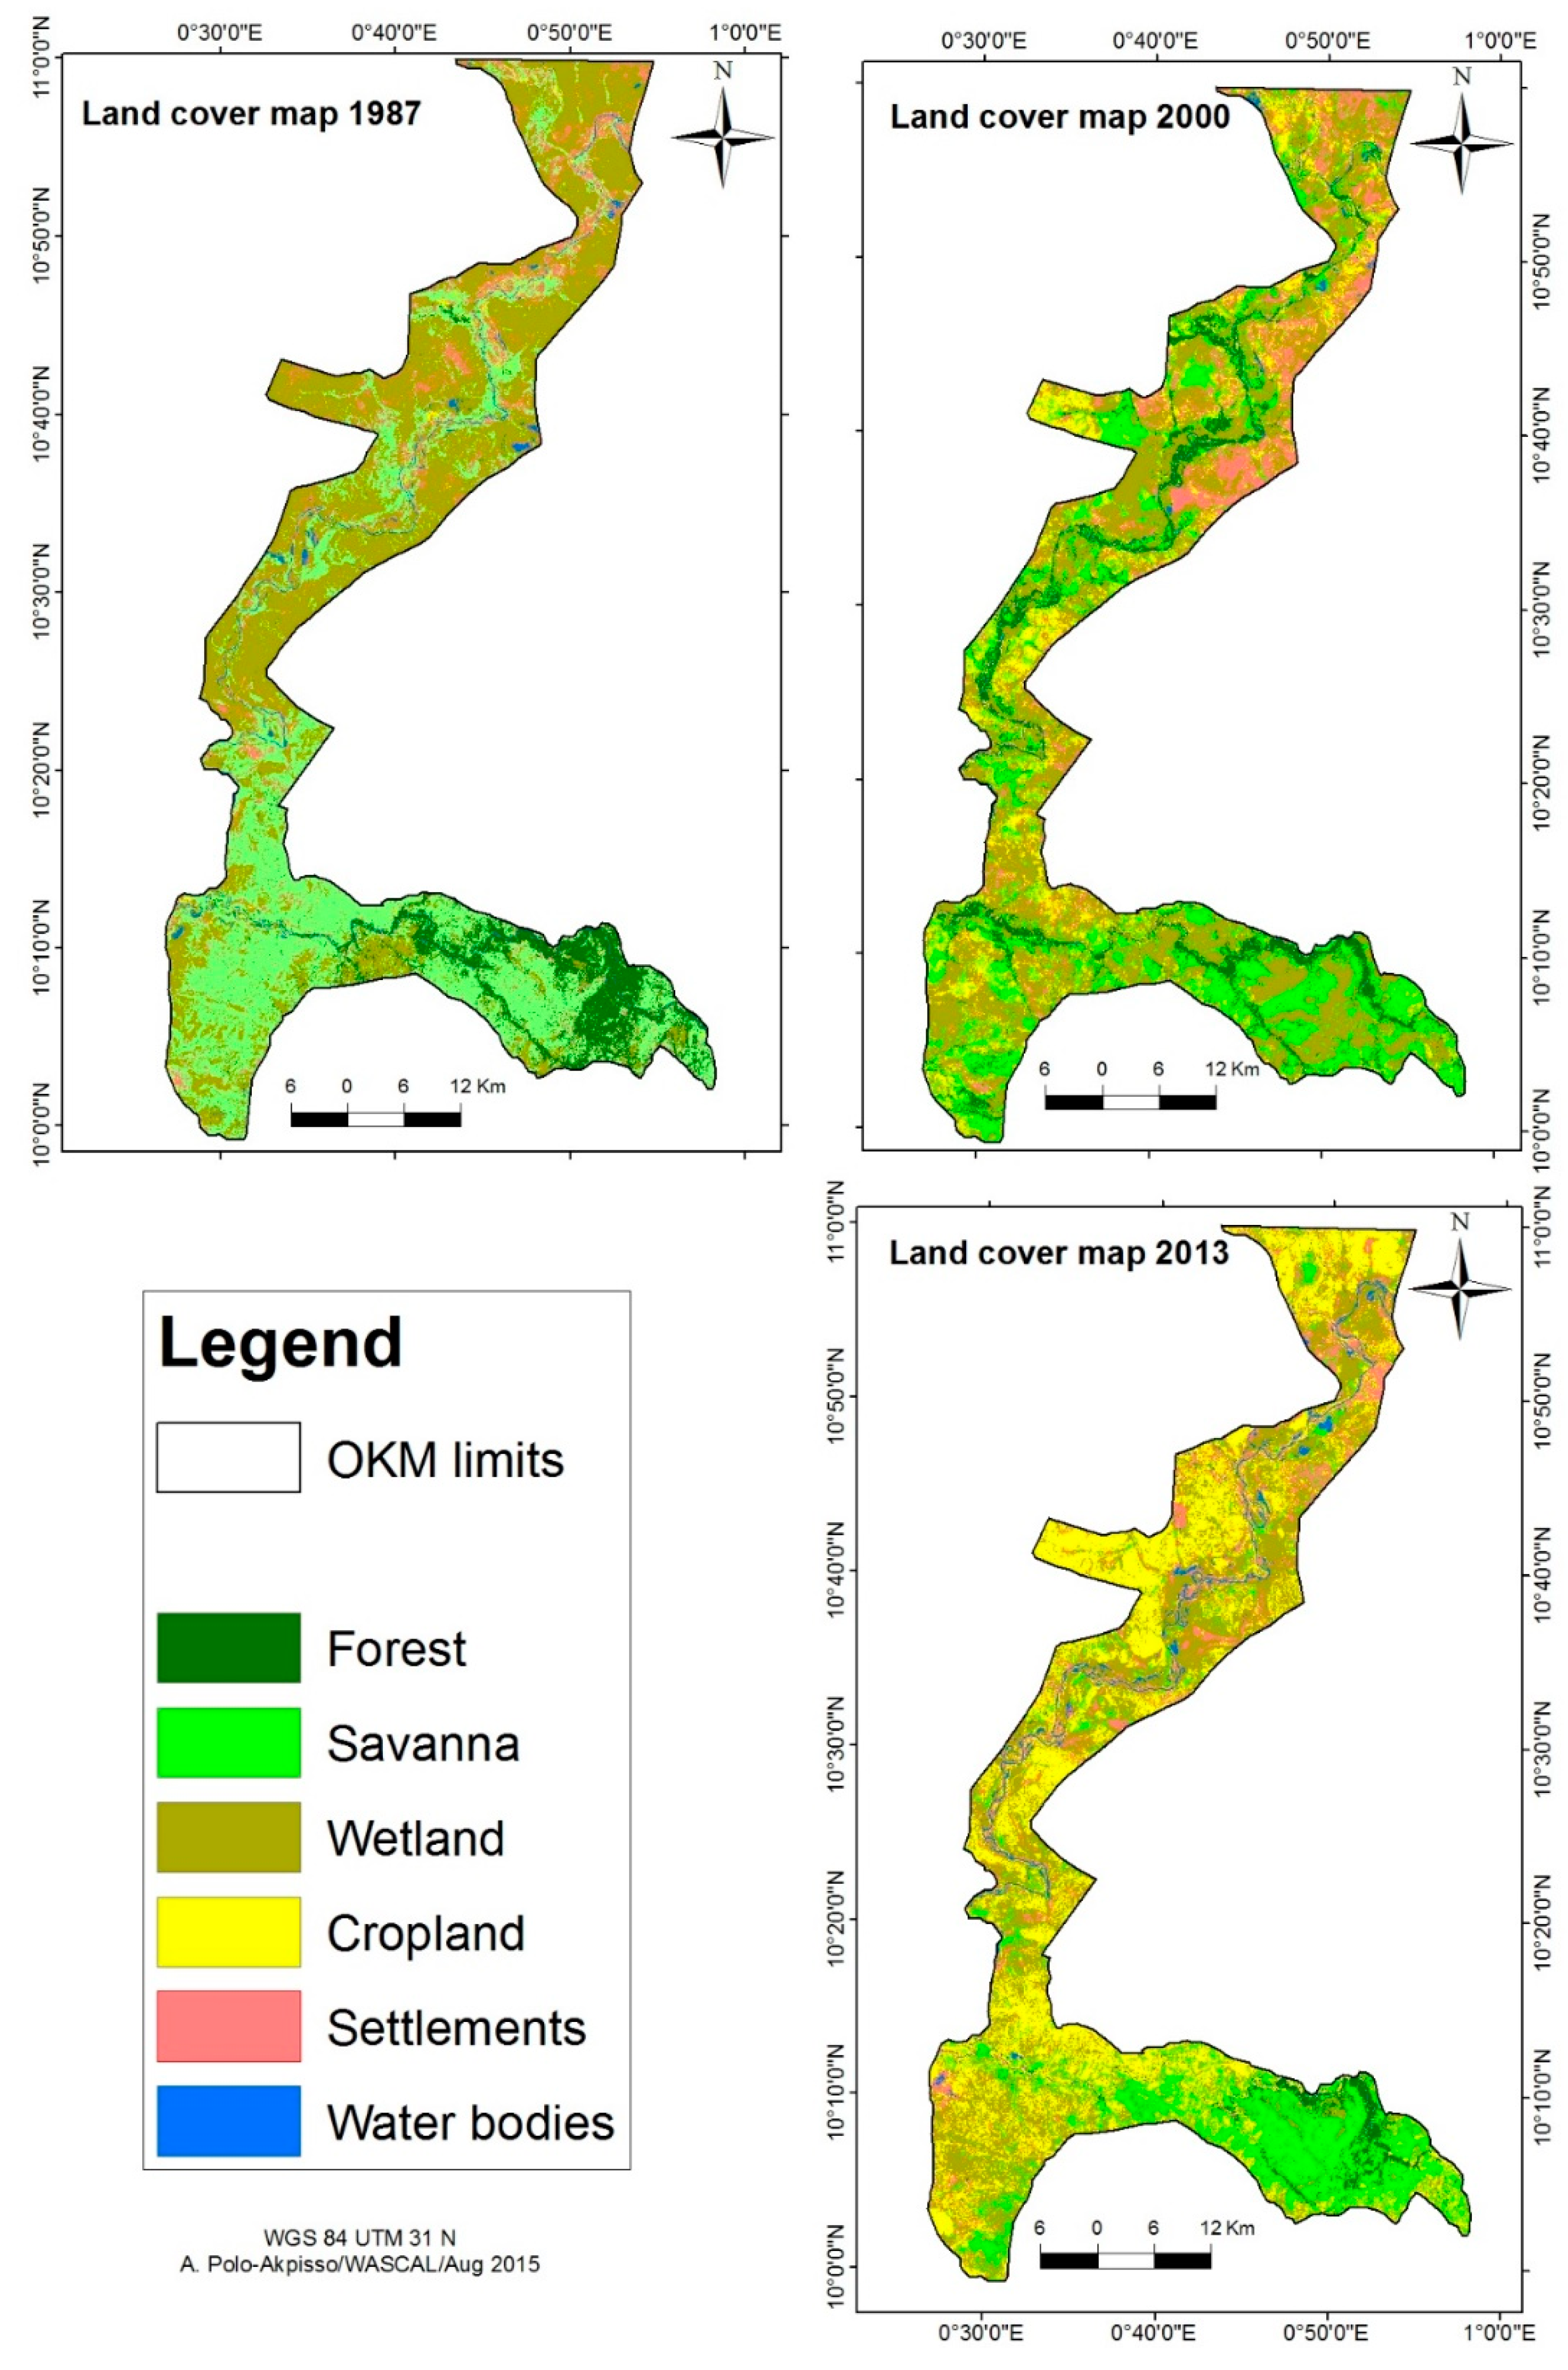
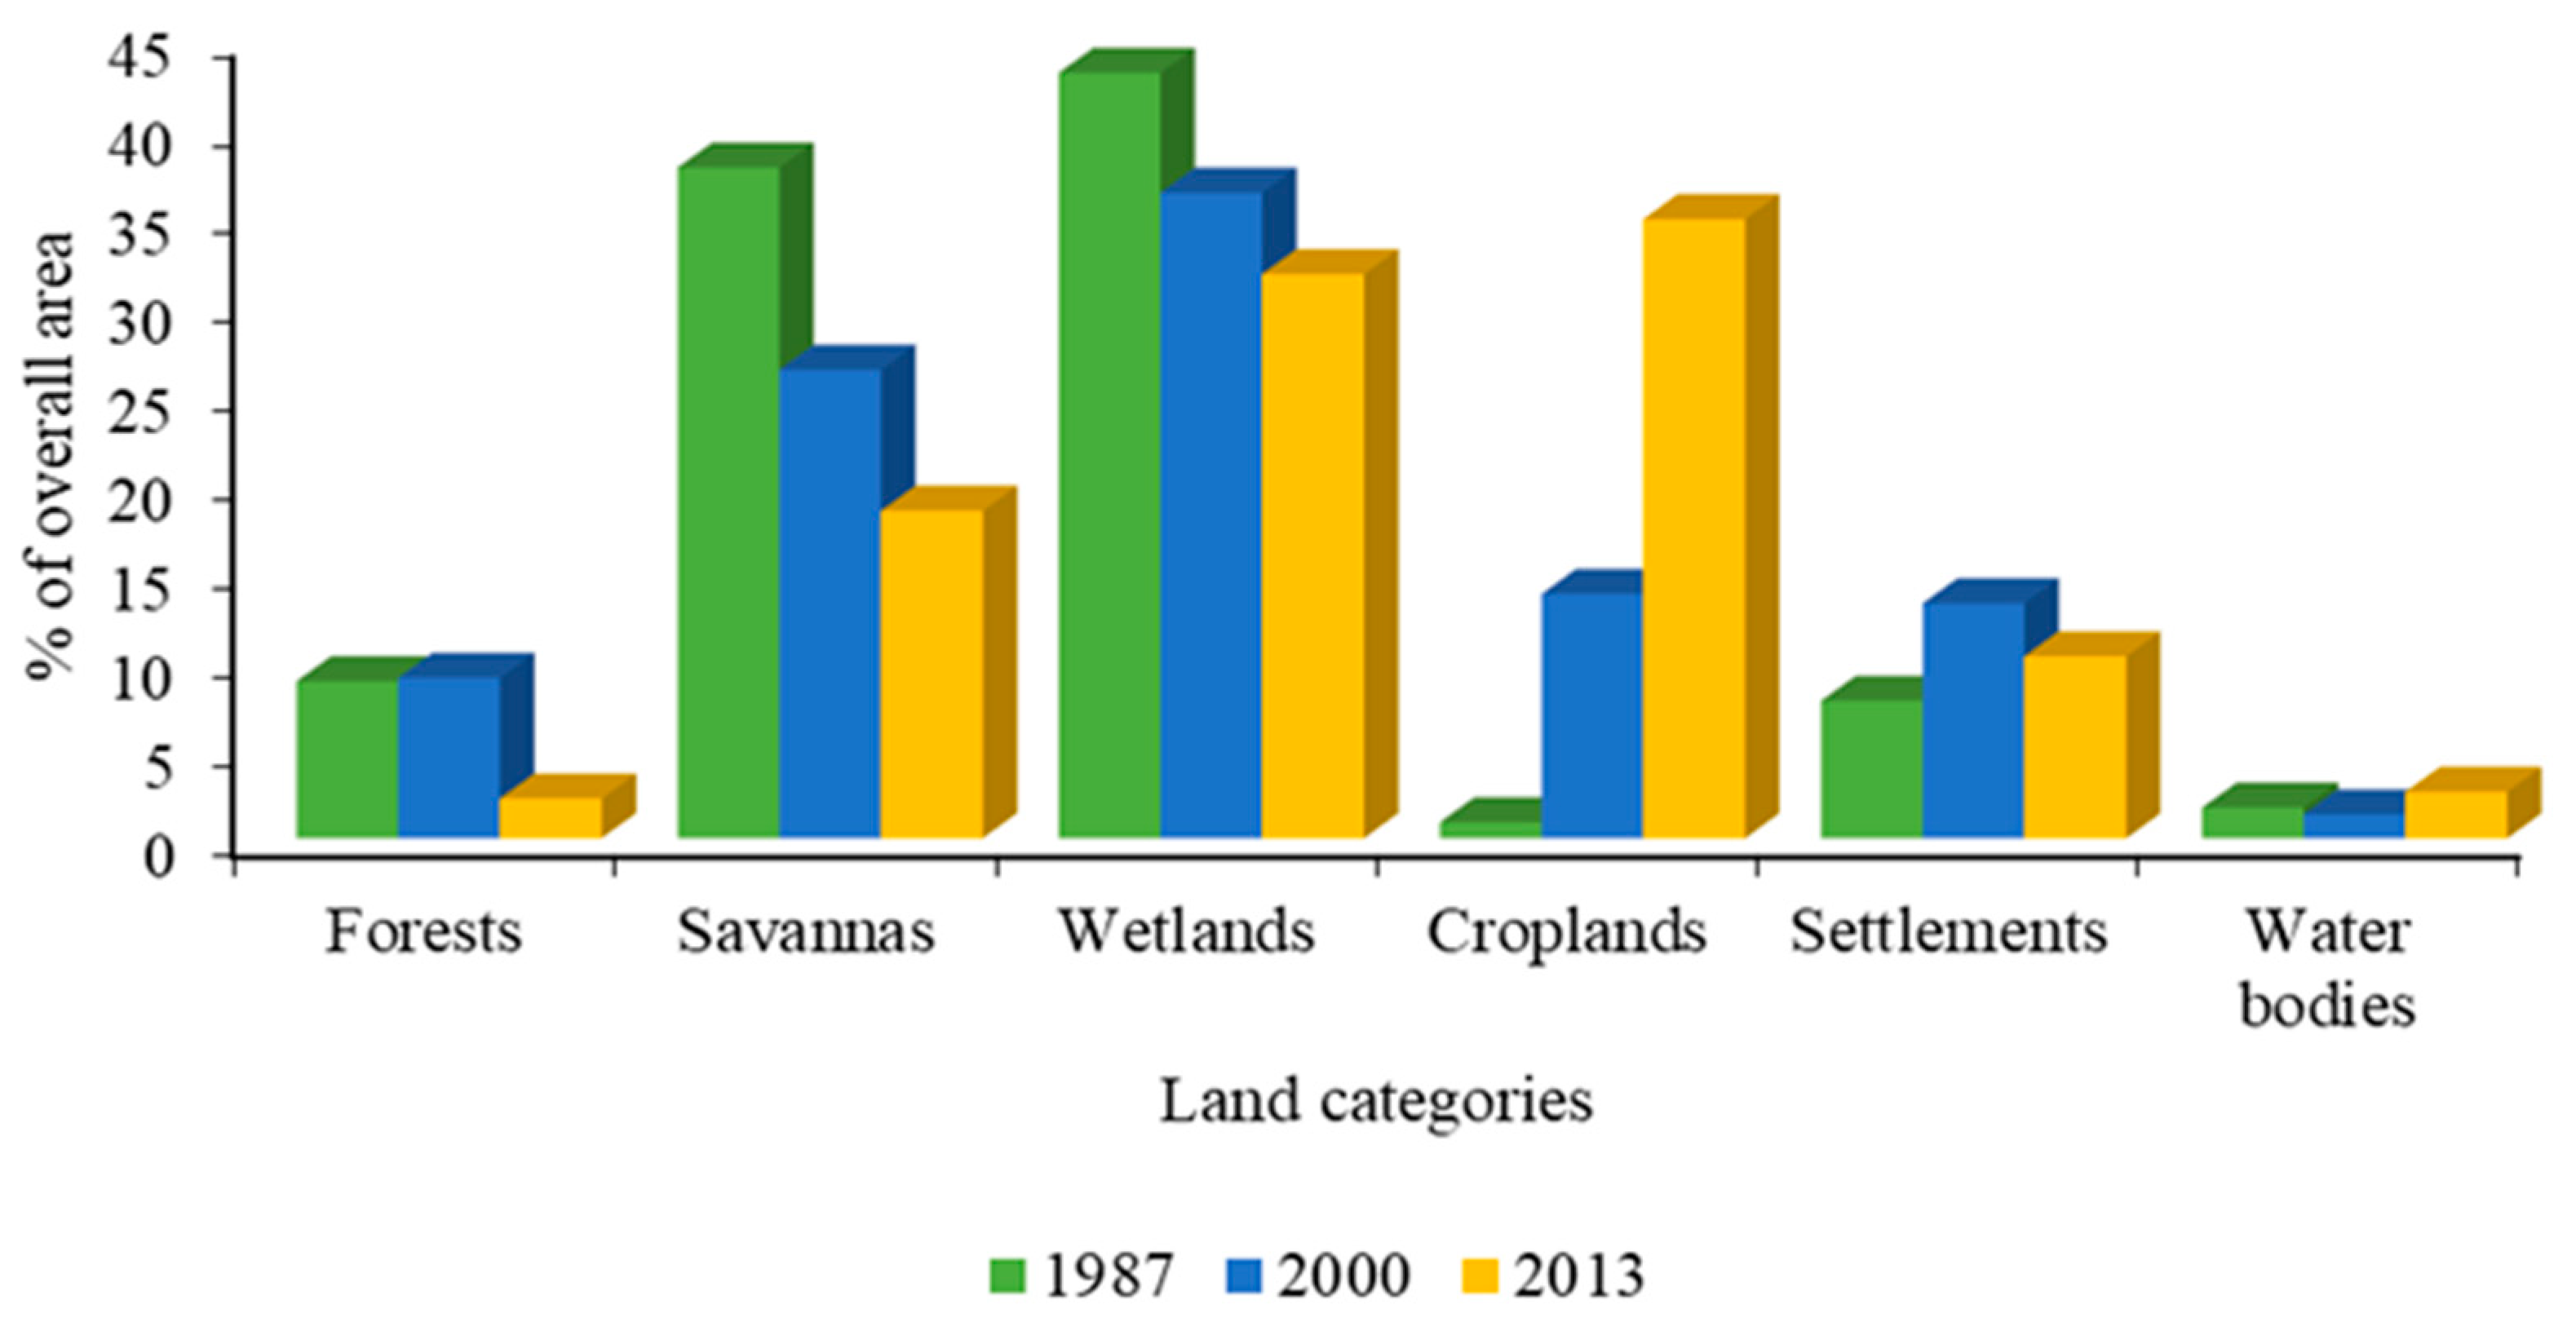
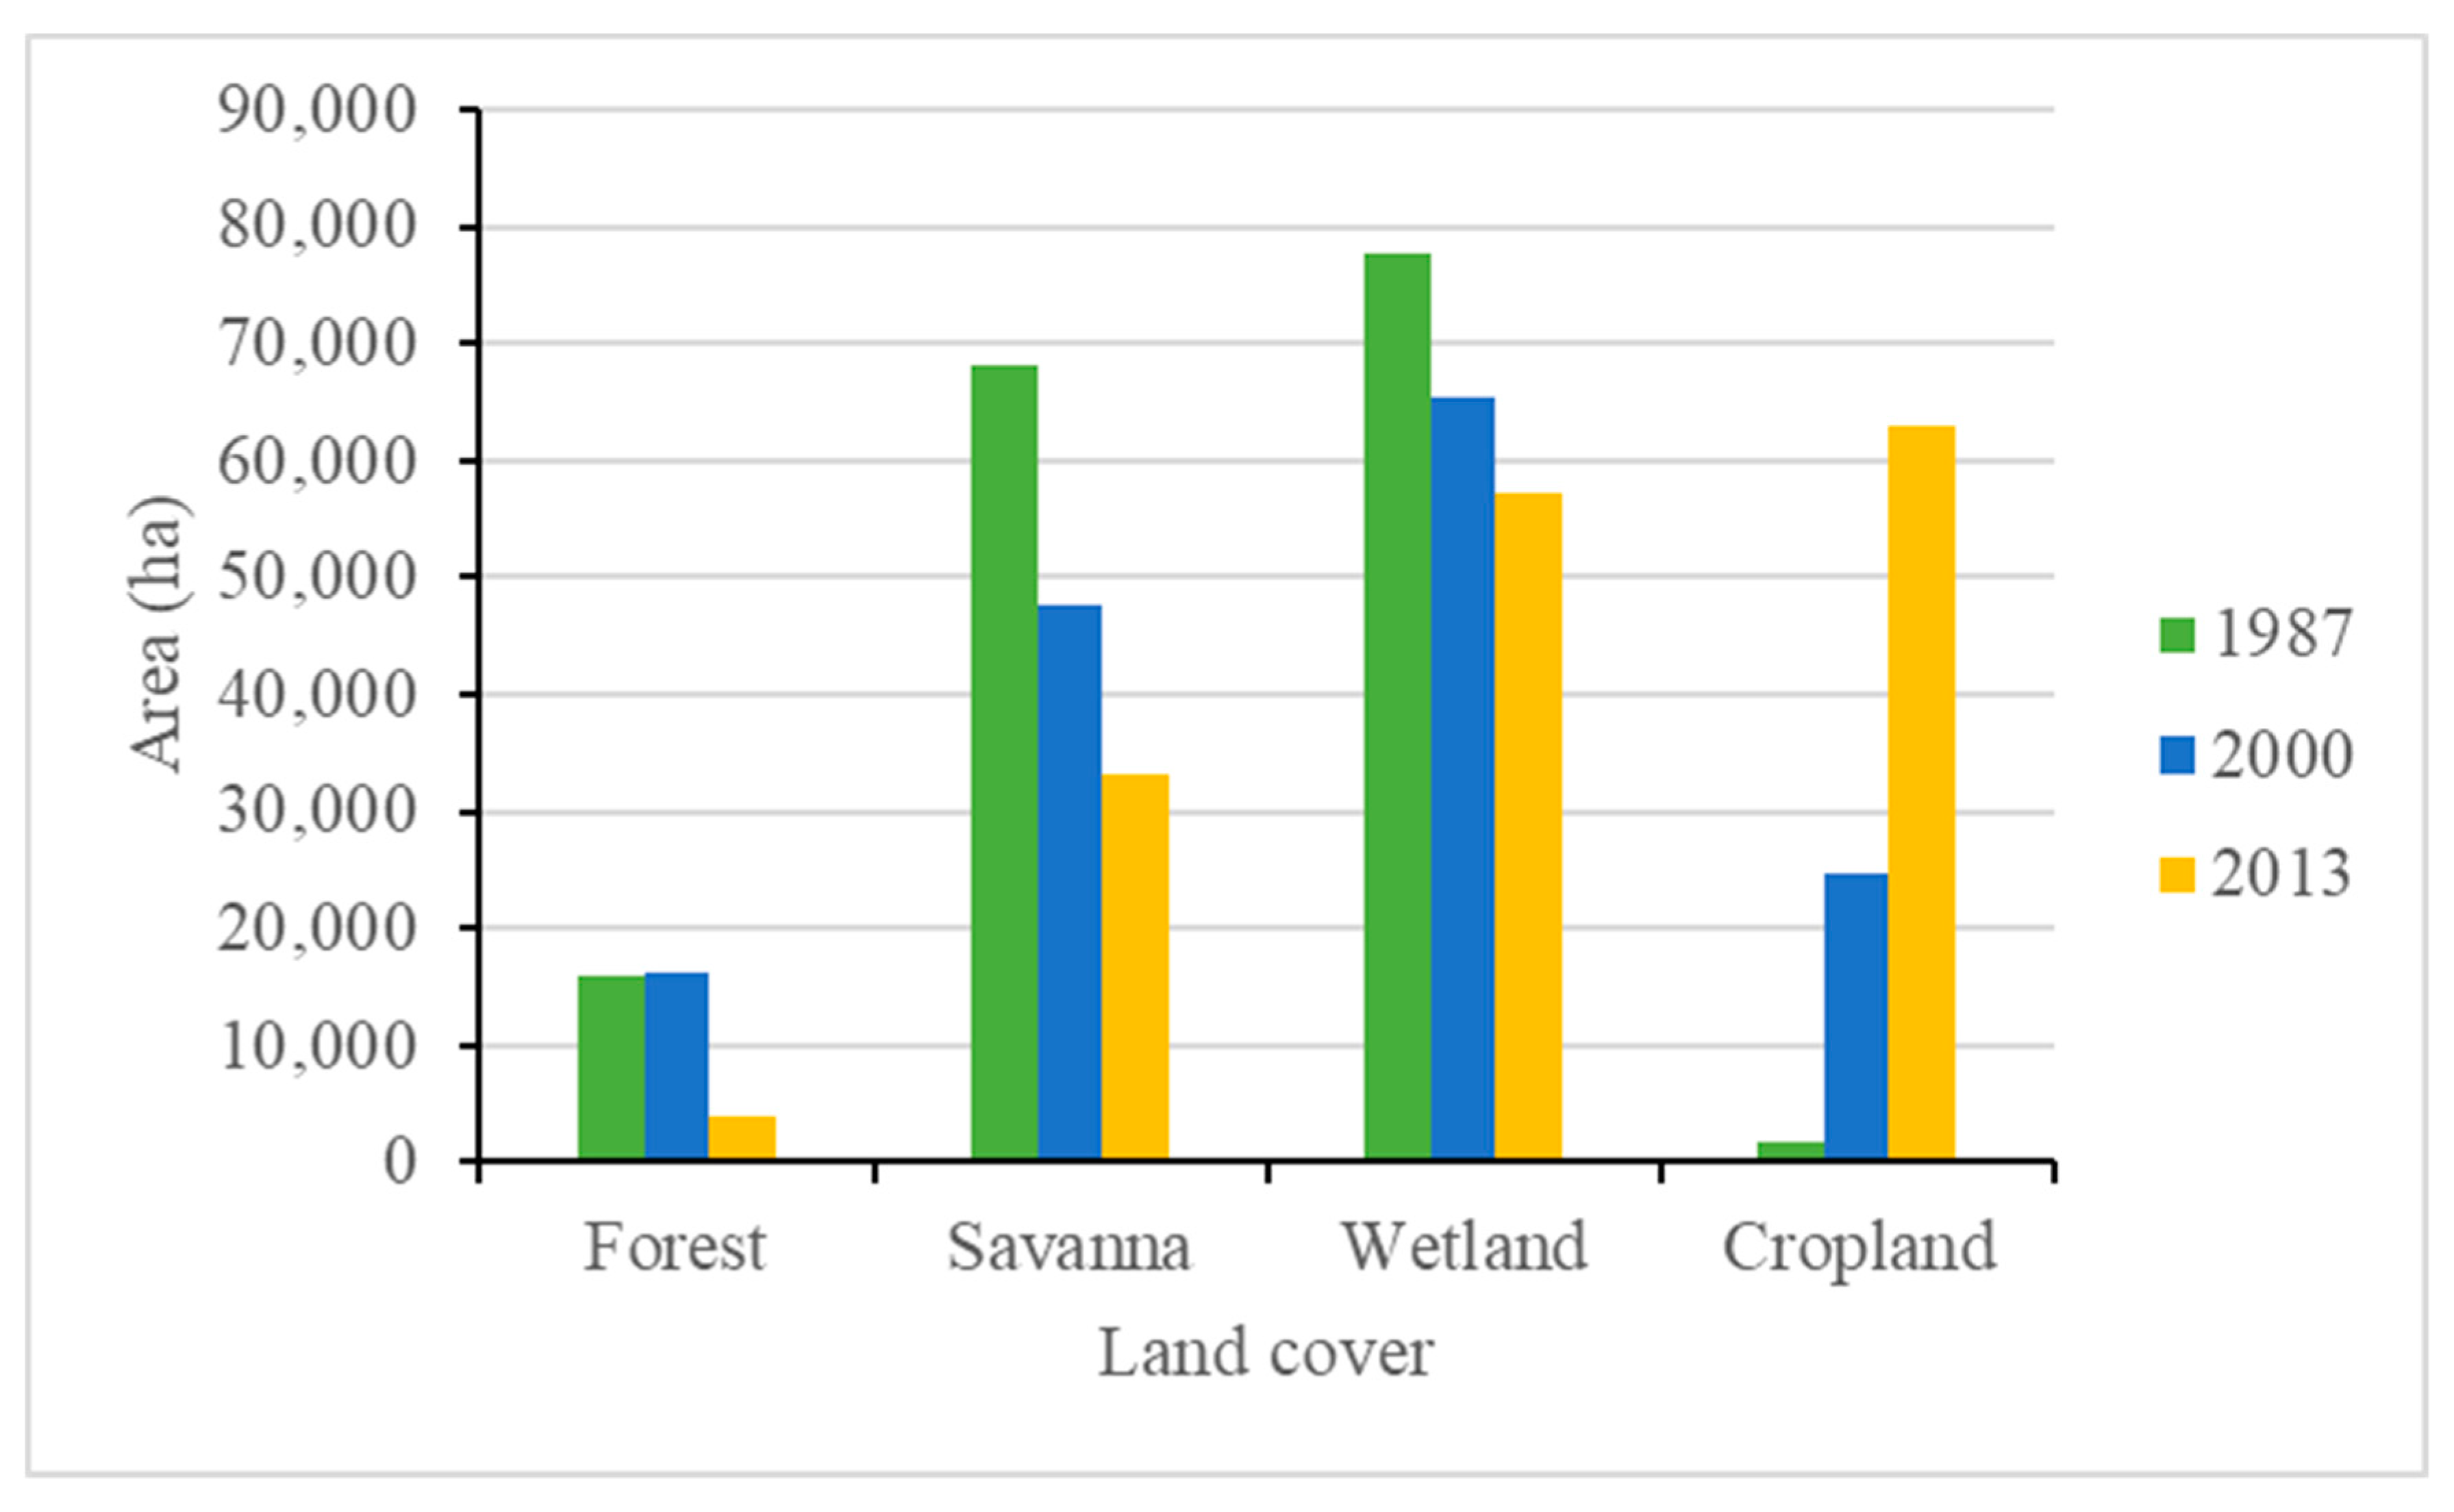
Wetlands are the most important land category found within OKM. This is well in line with the classification of OKM as a Ramsar site [18,52]. It is also the most converted land category into others, especially croplands. There is high pressure on wetlands, which are often systematically converted into large paddy fields. Agriculture is the main driver of change in land cover and land use dynamics (LCLU). It is shifting cultivation, such as elsewhere in Togo and in West Africa. This result is in line with previous studies in tropical regions, particularly in West Africa [53,54,55]. Other studies have concluded that agriculture, population growth, and the indirect effects of climate change remain the main factors of land change and the main threats to biodiversity conservation [6,7]. Changes in populations’ livelihoods through the implementation of indigenous adaptation strategies [56,57,58,59] could be considered to be the indirect effects of climate change. The implementation of recessional agriculture as an adaptive strategy in the study area shows that climate change and LCLU change are tightly linked. Pressure is put on wetland because of water availability and high soil moisture.
The increase of settlements could be related to the annual rate of population growth in the study area. In fact, OKM is within a region where the population growth rate is the highest in Togo (3.18%) [60]. Moreover, the Kpendjal, Oti, and Keran districts are the poorest in Togo [61]. Therefore, there is high pressure on natural resources from the local population. The intrinsic relationship between natural resource degradation and poverty has been shown by many studies [62,63]. On the other hand, there is a particular problem of natural resource management, which increases the pressure on protected areas in Togo after 1990. As described by Folega, Zhang, Zhao, Wala, Batawila, Huang, Dourma and Akpagana [26], the period from 1990 to 2000 was marked by illegal and anarchic exploitation of protected resources by residents. This situation resulted from the political, economic, and social troubles of 1990 in Togo mainly due to the nascent, uncontrolled democratic process and the semi-military and repressive management system implemented from the colonial period to 1990. These illegal and anarchic anthropogenic activities led to important land conversion. This could explain the increase in croplands from 1987 to 2000. This increment is higher than the reported agricultural expansion on the national scale for the period of 25 years from 1975 to 2000 by United States Geological Survey (USGS [64]. While this study reported an increase in cropland of about 34% of the total area of OKM from 1987 to 2013, USGS [64] reported an increase of about 10% at the national level from 1975 to 2000. OKM could be considered to be one of the areas with the highest current agricultural expansion.
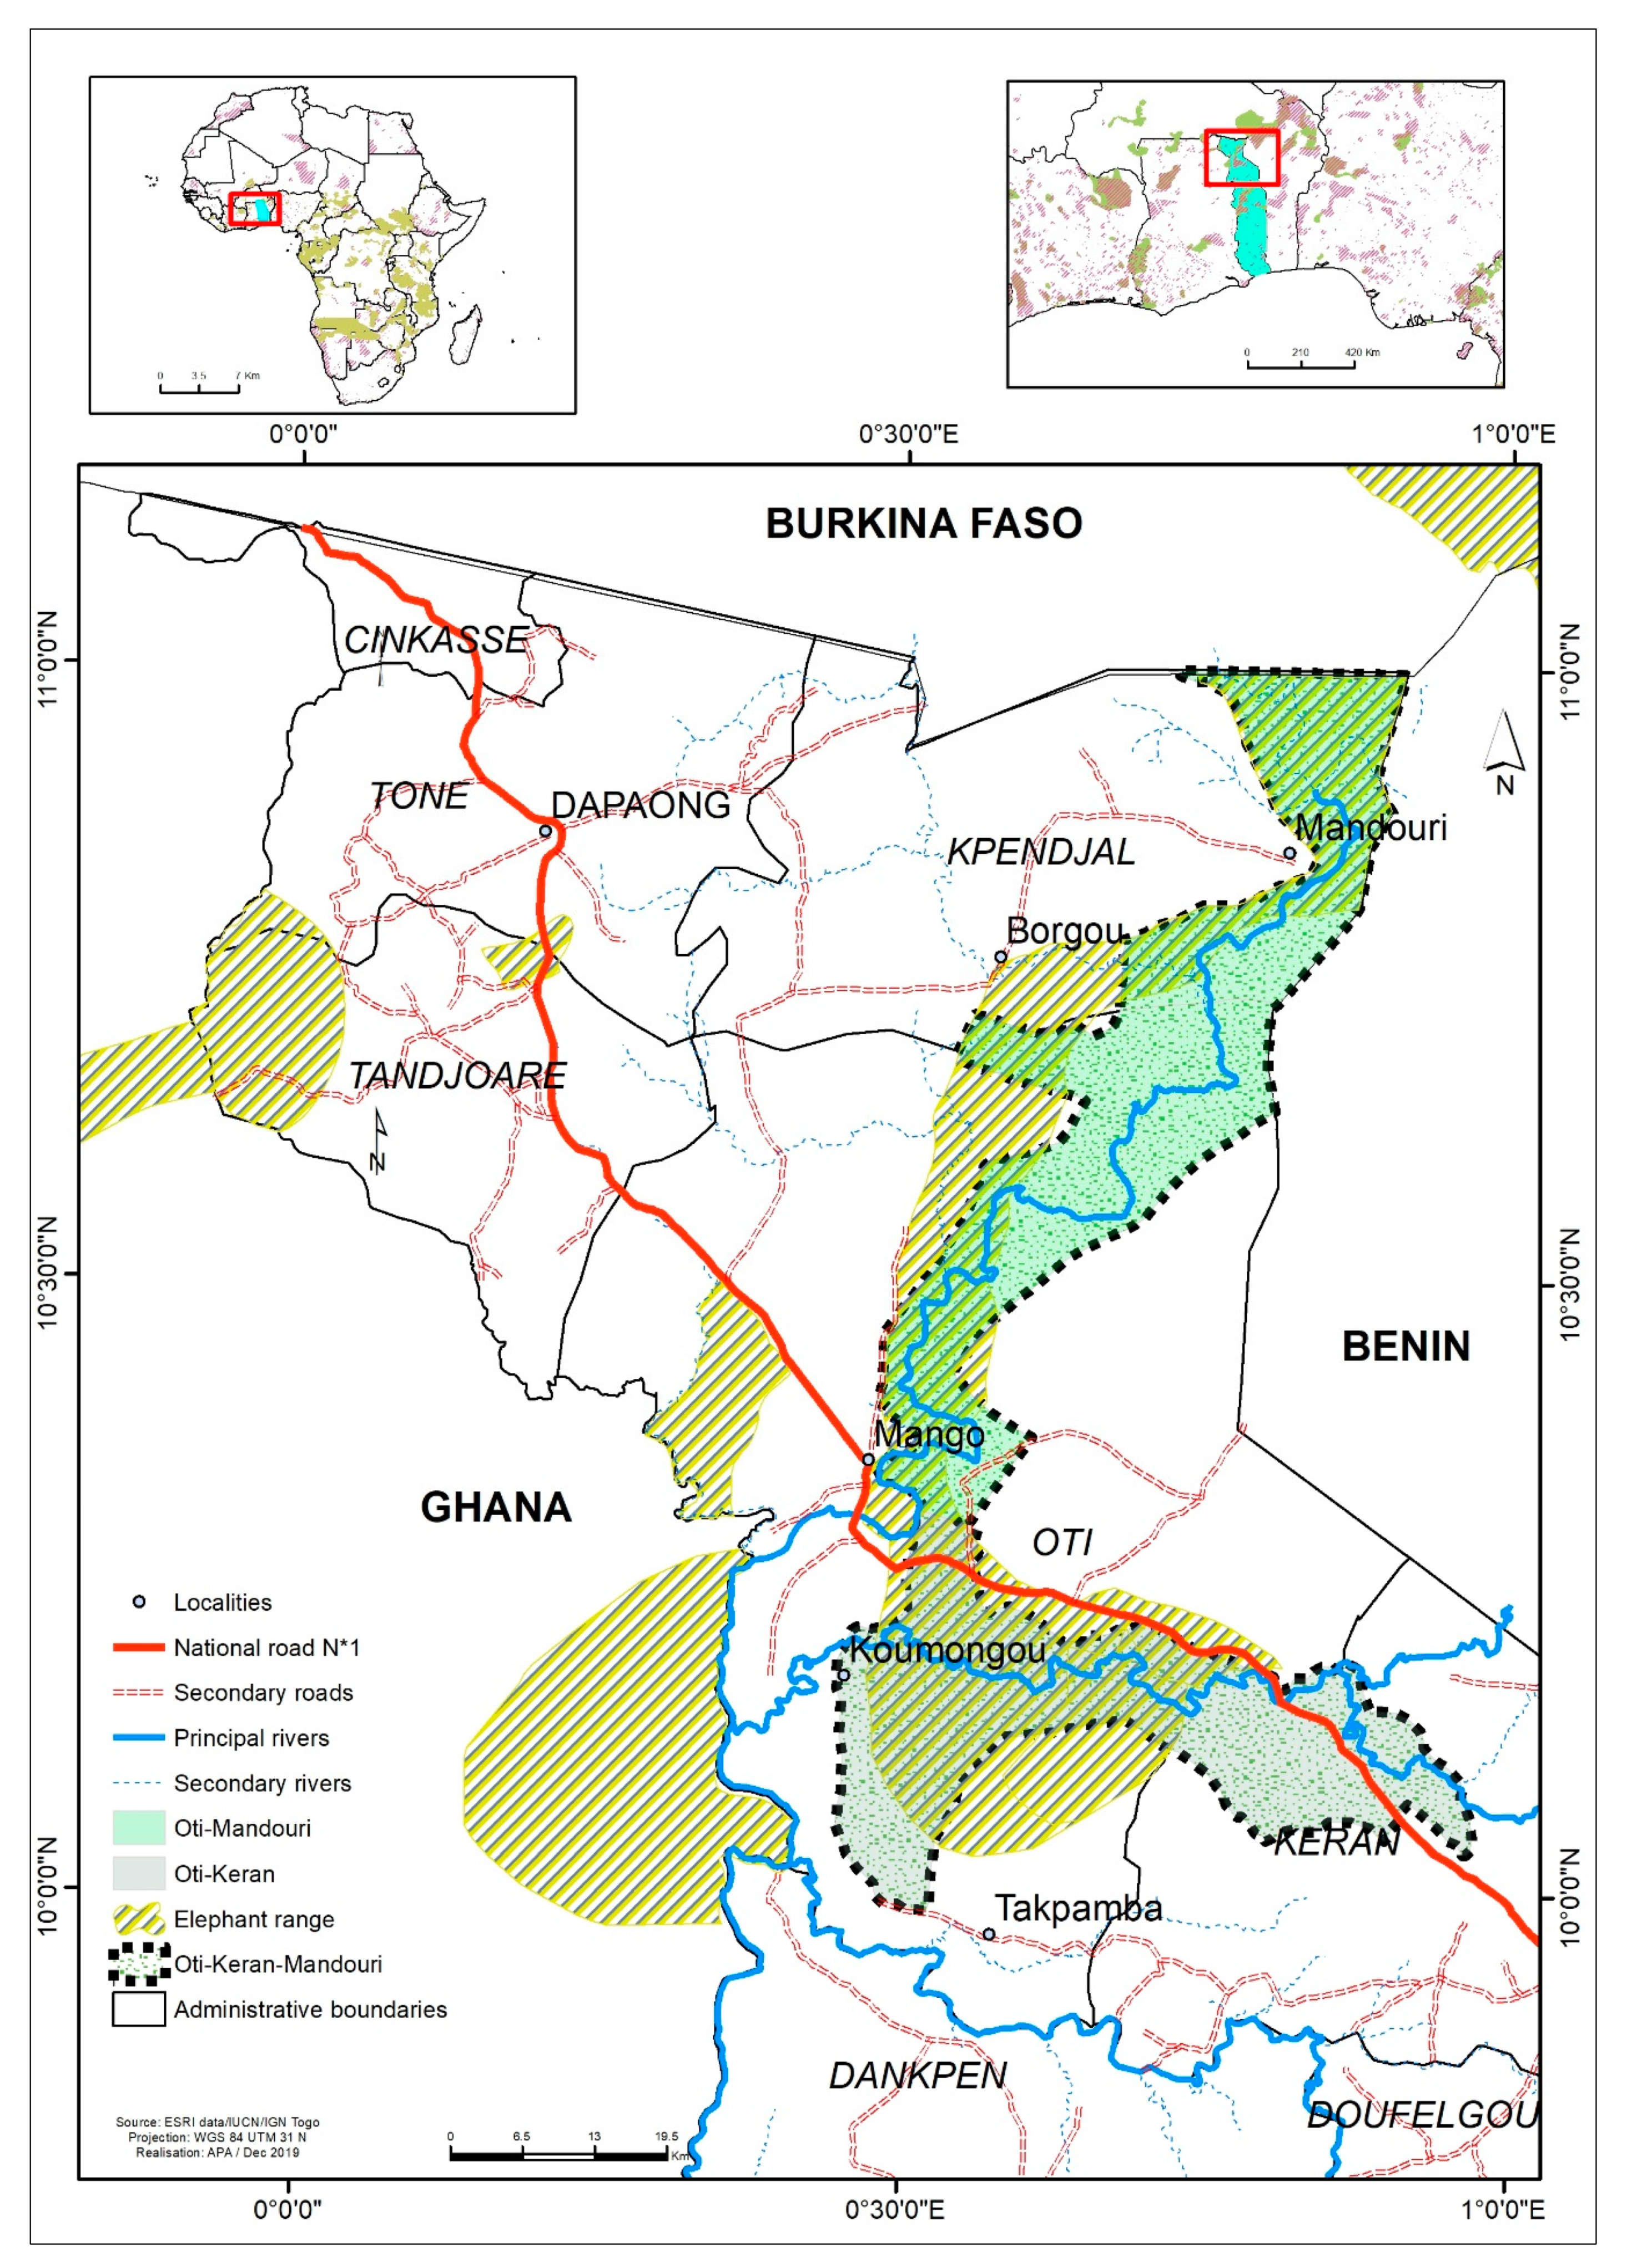
As shown by the land cover maps, there is a core area of remaining natural ecosystems (savanna and forest) within OKM (the southeast). This area has been already mentioned by International Union for Conservation of Nature (UICN [16] as the most conserved area. Periodic visits to this area by savanna elephants coming from bordering countries have been mentioned in several studies [16,65]. This relatively conserved area could be explained by the presence of park managers. Their presence is preventing anthropogenic pressure. Thus, better management of the entire OKM is possible if adequate means are provided. This area requires particular conservation attention. Its remaining natural habitats are still under threat from anthropogenic activities such as wood cutting [20] and charcoal production [22]. In the center of Benin, Arouna et al. [66] also found that charcoal production represented the main activity leading to forest destruction and land cover change. Moreover, there are also threats from transhumance, on which no accurate data are currently available. There are a thousand heads of cattle pasturing through this area each year, damaging the crops and invading the protected areas.
Usually, foraging plants are cut down for cattle and the savanna is burnt without any respect to the established fire calendar set by the National Department of Environment. Considering the net change, the increase of forests from 1987 to 2000 could be explained by natural regeneration, because forests are located along rivers and in the well-protected core area (the southeastern part of the study area). However, the decrease in forests from 2000 to 2013 is the result of the combined continuous impact of increasing anthropogenic activities (wood cutting and charcoal production) and climate change. Recent studies have demonstrated that climate change effects in Northern Togo have been expressed by inter-annual fluctuations with the declining tendency of rainfall and the increasing tendency of high temperatures during the period from 1961 to 2010 [56,67]. The deficit in rainfall could weaken plant resilience to fire events. Furthermore, one of the most adaptive strategies to climate change implemented in this area by the local population is recessional agriculture. This activity consists of crop cultivation during the dry season on river banks and in wetlands where the crops could benefit from flooding and soil moisture. This practice involves the destruction of gallery forests [48,57]. Recessional agriculture is categorized as wetland agriculture and considered to be one of the largest overall agriculture adaptations [68]. It is described as been highly productive in many tropical regions [69]. On the other hand, the decrease of forests from 2000 to 2013 reflected the ineffectiveness of the management system of this complex of protected areas and the weakness of the current rehabilitation process.

4.3. Habitat Change Processes

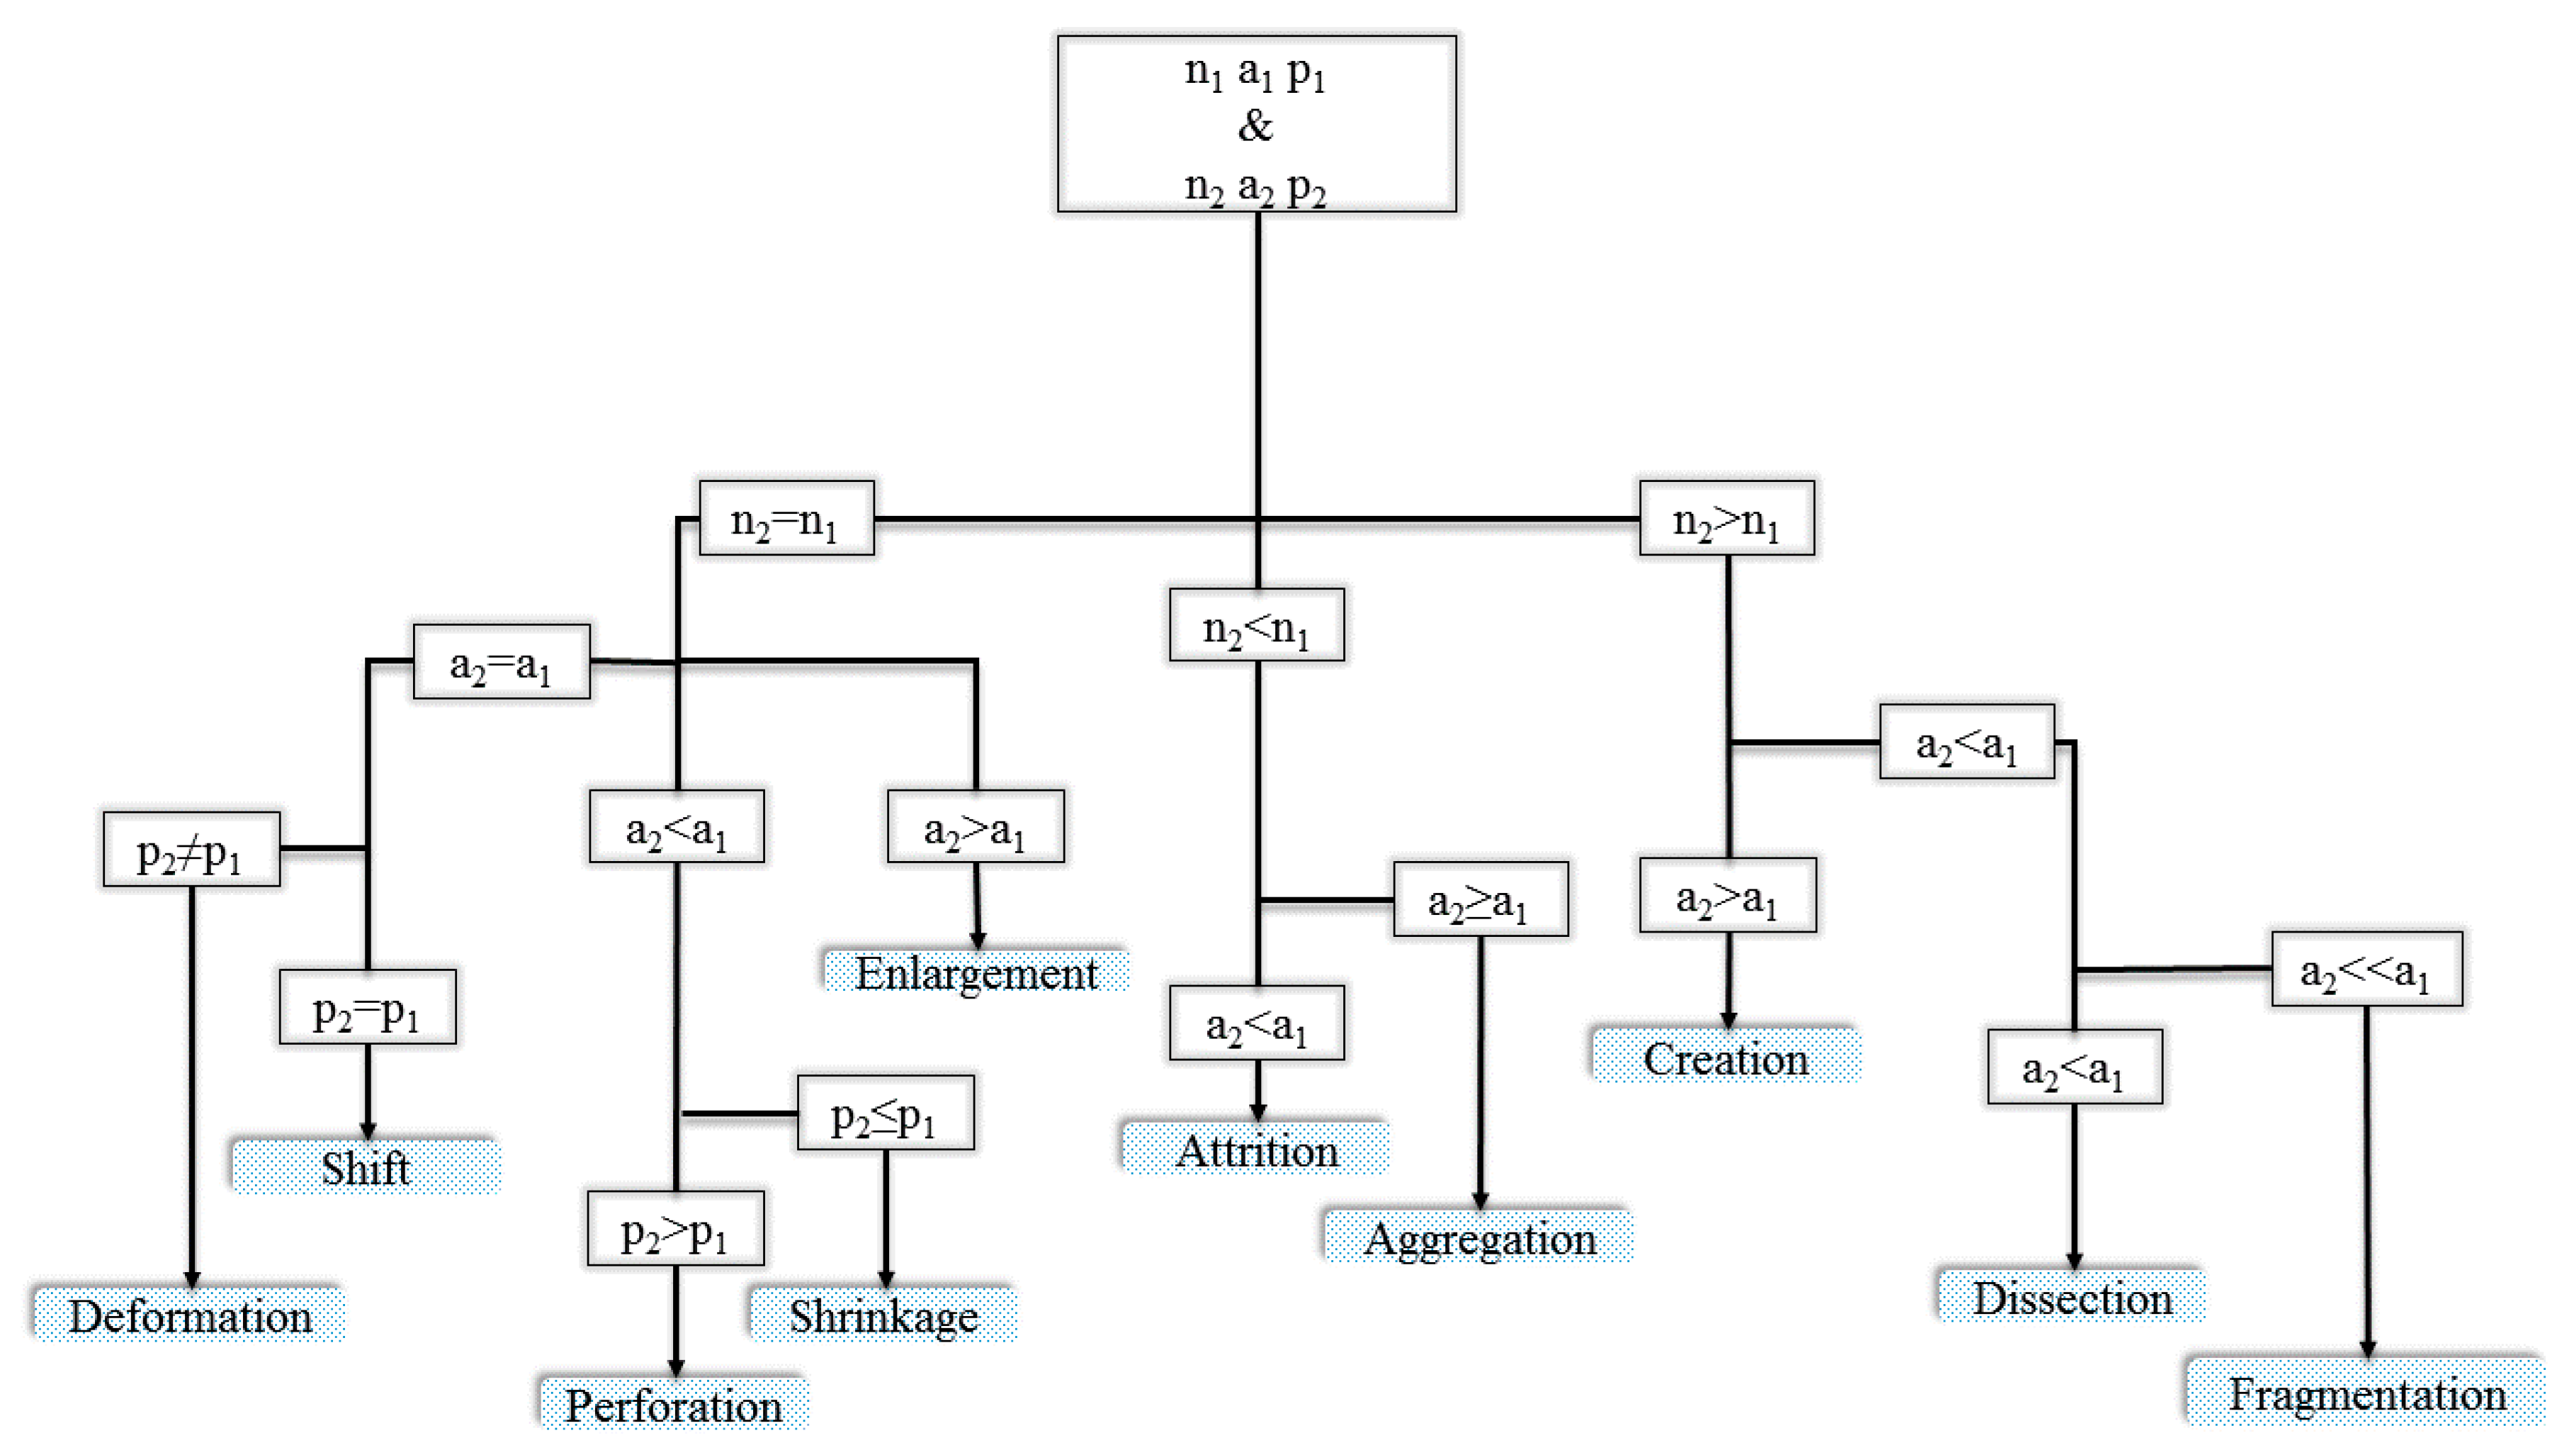
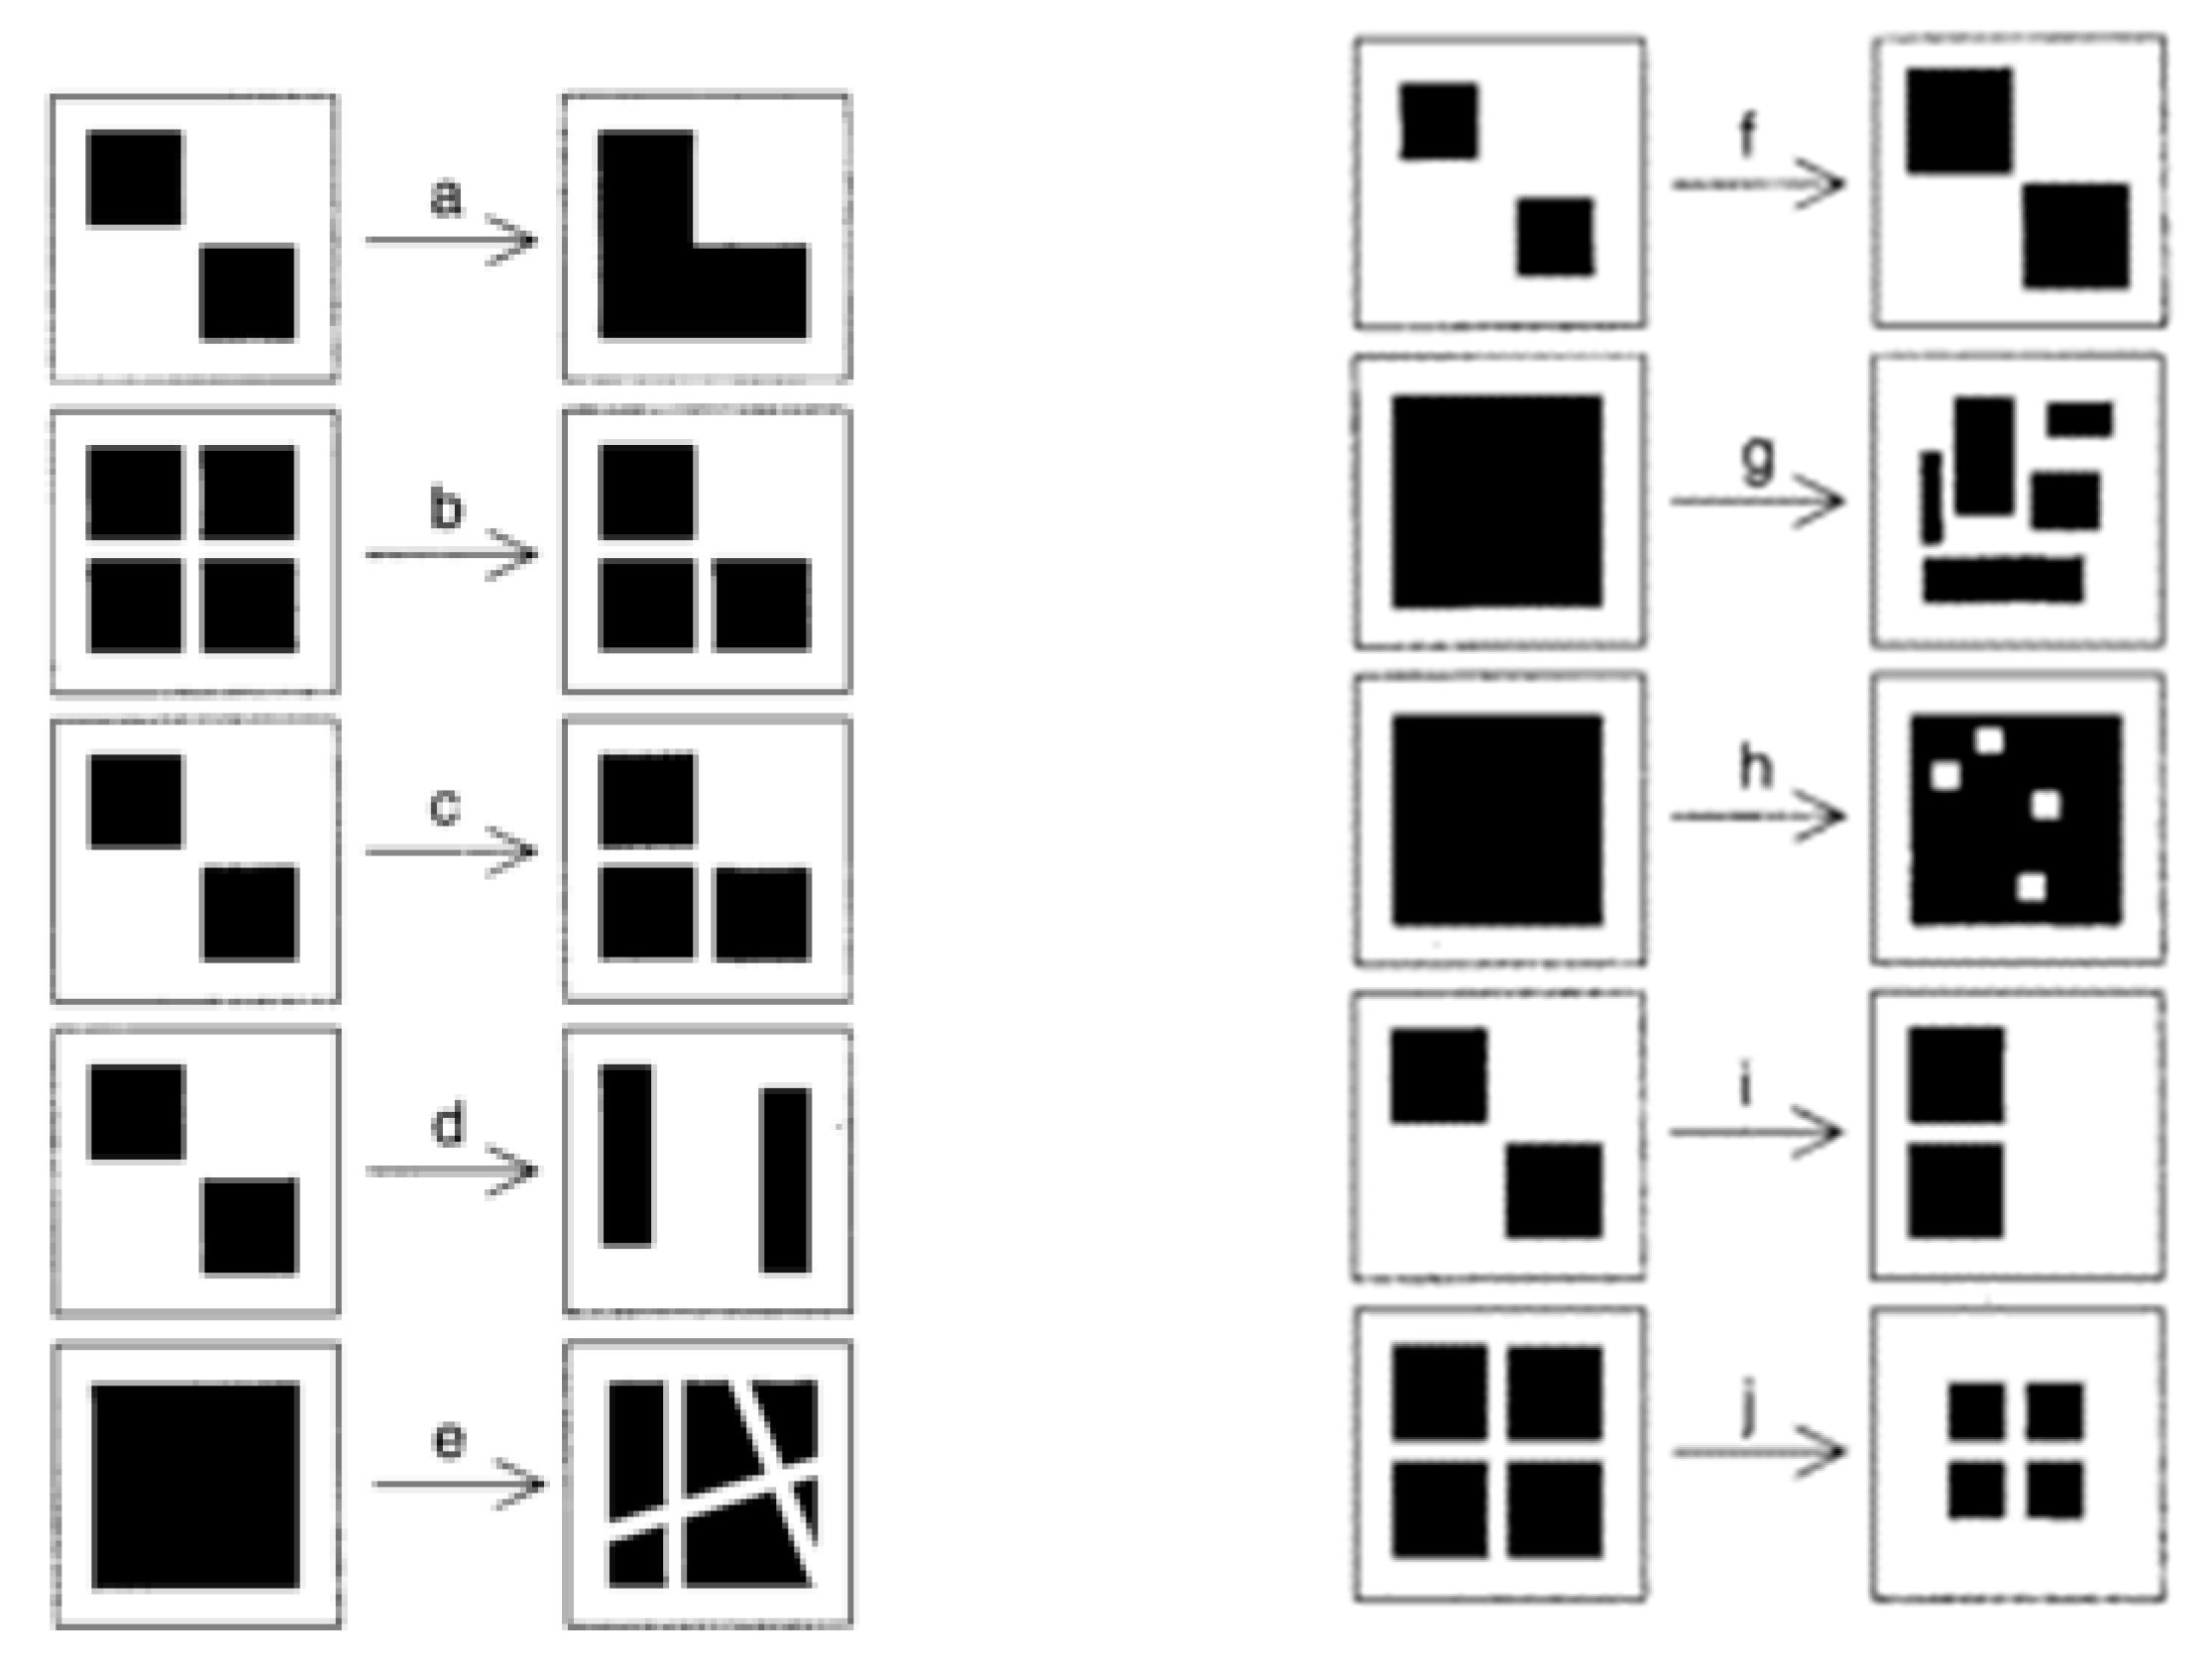
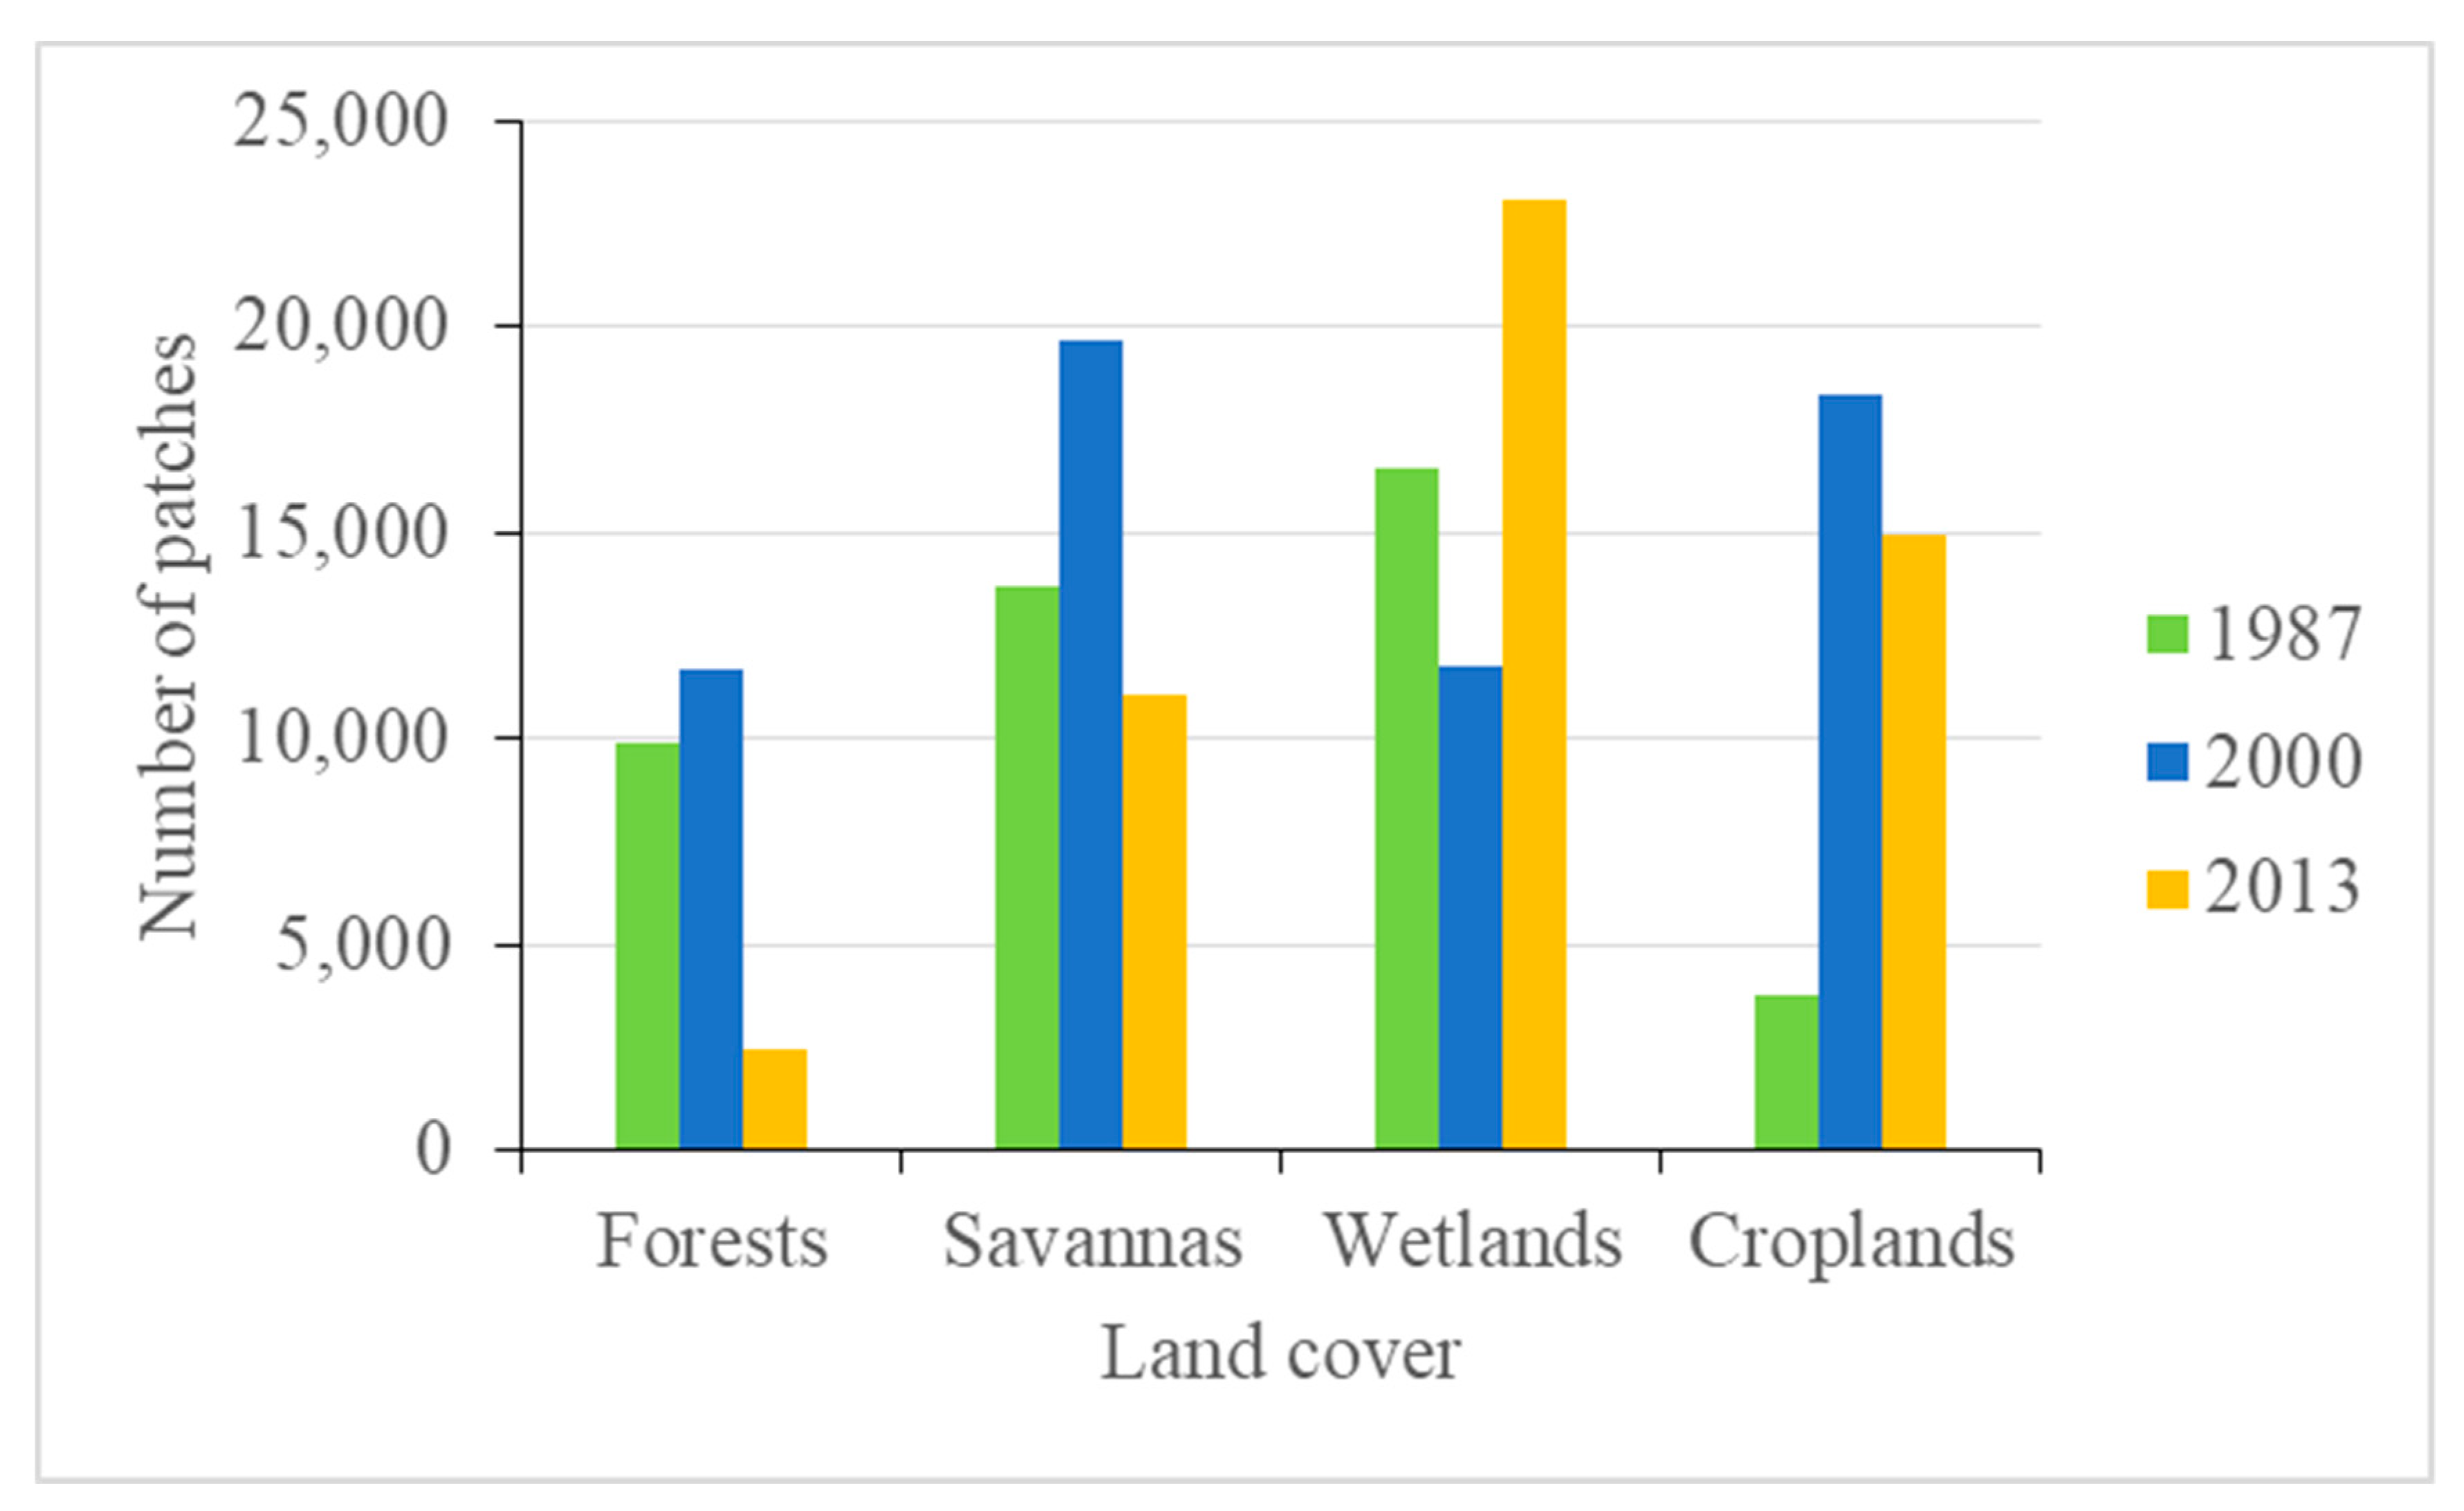
The changes in land cover categories, for the different periods studied, resulted from different transformation processes. These transformation processes implied profound consequences for the landscape structure and functioning [9]. Here, three main transformations or change processes were identified when considering the period from 1987 to 2013. These were the attrition of forests and savannas, dissection of wetlands, and creation of croplands. However, when this period is decomposed into two parts (1987–2000 and 2000–2013), then four transformation processes can be described. From 1987 to 2000, there was the creation of forests and croplands, dissection of savannas, and attrition of wetlands, whereas from 2000 to 2013, there was the attrition of forests and savannas, dissection of wetlands, and aggregation of croplands. The temporal resolution is essential when designing a study for the identification of transformation processes as suggested Bogaert, Ceulemans and Salvador-Van Eysenrode [9]. According to these authors, all the identified transformation processes characterize two main changes in the habitat configuration. Attrition and dissection indicate habitat degradation, while creation and aggregation imply the appearance of new habitat units. The process of creation means the formation of new patches of a given land cover or habitat. However, depending on the considered land cover category, the process of creation could have different causes. For instance, from 1987 to 2000, the creation process of forests could be explained by the colonization of bare soil, converting other land cover to forest. Meanwhile, the creation process of croplands is caused by anthropogenic pressure with increasing afforestation. Aggregation indicates the merging of existing patches by physical connection. This explains well what happened to cropland from 2000 to 2013.
Dissection and attrition are considered to represent different steps of the process of fragmentation. Dissection is a subdivision of the area with a minimal area loss associated with the linear structure of disruption, while attrition is the disappearance of patches. There is still a debate over whether to consider the transformation processes to be equally equivalent or steps of the whole process of landscape fragmentation. However, Jaeger [70] considered attrition to be the last of the six steps of fragmentation. Dissection is considered to be the initial step of fragmentation by Bogaert, Ceulemans and Salvador-Van Eysenrode [9], and attrition is expected to occur in a patchy landscape, which is the result of another pattern conversion. Considering this sequence, savannas experienced a steady process of fragmentation with a dissection (initial step) from 1987 to 2000 and attrition (last step) from 2000 to 2013. However, the transformation processes were particular in both forests and wetlands. By experiencing creation from 1987 to 2000 and attrition from 2000 to 2013, the fragmentation process was very rapid in forests, especially from 2000 to 2013. This period corresponds to the period of the implementation of the requalification process of protected areas. However, instead of observing a decrease in the pressure on natural resources, it was marked by an increase in anthropogenic pressures. The requalification process in Togo was ineffective in OKM. This complex continues to be pressured by anthropogenic activities, such as illegal logging and the intensification of charcoal production, which have already reported by many studies [20,22,23,63]. The sequence of the transformation processes of wetlands (attrition from 1987 to 2000 and dissection from 2000 to 2013) indicates that the fragmentation process here is really intensive. This may be linked to the increasing pressure on water resources in the context of climate change.
In summary, there is habitat loss in forests and in savannas (attrition) and habitat fragmentation in wetlands (dissection). These processes are leading to an anthropization process as described by Barima, Barbier, Bamba, Traore, Lejoly and Bogaert [15] in the forest–savanna transition zone of Côte d’Ivoire. Moreover, in concert with habitat loss, habitat fragmentation is a grave threat to species survival [71].

5. Conclusions

A detailed analysis of the dynamics, direction of the changes in land cover, and landscape transformation processes were performed from 1987 to 2013. There were important changes in land cover within the protected area. Forests, savannahs, and wetlands were converted into human-transformed landscapes. Wetlands were the most converted land category. Croplands and settlements increased with a high magnitude, especially from 1987 to 2000. Three main transformation processes were identified from 1987 to 2013. These were the attrition of forests and savannas, dissection of wetlands, and creation of croplands involving habitat loss in forests and in savannas (attrition) and habitat fragmentation in wetlands (dissection), leading to an anthropization process. The main drivers of this degradation were agriculture expansion and population growth.
The degradation has worsened due to implemented adaptation strategies to climate change that are mostly linked to land use change, such as recessional agriculture. An assessment of the socio-ecological system should be conducted to show the link between the residents’ livelihoods, perceived impacts of climate change, and values ascribed to biodiversity conservation.
According to this study, the disturbance is not yet at the irreversible threshold. Actions need to be taken to reverse the current state of degradation. Although, wetland is the most converted land category into others, forest and savanna restoration should be prioritized because of their attrition (loss). Connectivity should be increased in wetland by limiting anthropogenic activities, which would enhance natural plant recruitment.

Author Contributions

Conceptualization, A.P.-A., K.W. and O.S.; methodology, A.P.-A.; software, A.P.-A.; validation, A.P.-A., K.W. and O.S.; formal analysis, A.P.-A.; investigation, A.P.-A.; resources, A.P.-A.; data curation, A.P.-A. and F.F.; original draft preparation, A.P.-A.; review and editing of the manuscript, F.F., O.S., K.W., K.A. and Y.T.; supervision, Y.T., K.W. and O.S.; project administration, Y.T.; and funding acquisition, A.P.-A. All authors have read and agreed to the published version of the manuscript.

Funding

This research was funded by the German Federal Ministry of Education and Research (BMBF) through the West African Science Service Centre on Climate Change and Adapted Land Use (WASCAL) initiative.

Acknowledgments

We acknowledge all the anonymous reviewers who added a great value to the first version of this manuscript. We are grateful to Emmanuel Amoah Bokye for English editing.

Conflicts of Interest

The authors declare no conflicts of interest. The funders had no role in the design of the study; in the collection, analyses, or interpretation of data; in the writing of the manuscript; or in the decision to publish the results.

References

  1. Van Horne, B.; Wiens, J.A. Managing habitats in a changing world. In Wildlife Habitat Conservation: Concepts, Challenges, and Solutions; Morrison, M.L., Mathewson, H.A., Eds.; Johns Hopkins University Press: Baltimore, MD, USA, 2015; pp. 34–43. [Google Scholar]
  2. Haddad, N.M.; Brudvig, L.A.; Clobert, J.; Davies, K.F.; Gonzalez, A.; Holt, R.D.; Lovejoy, T.E.; Sexton, J.O.; Austin, M.P.; Collins, C.D.; et al. Habitat fragmentation and its lasting impact on Earth’s ecosystems. Sci. Adv. 2015, 1, 1–9. [Google Scholar] [CrossRef] [PubMed] [Green Version]
  3. Francis, C.D. Habitat loss and degradation: Understanding anthropogenic stressors and their impacts on individuals, populations, and communities. In Wildlife Habitat Conservation; Morrison, M.L., Mathewson, H.A., Eds.; Johns Hopkins University Press: Baltimore, MD, USA, 2015; pp. 47–62. [Google Scholar]
  4. Karr, J.R. Landscape and management for ecological integrity. In Biodiversity and Landscapes: A Paradox of Humanity; Kim, K.C., Weaver, R.D., Eds.; Cambridge University Press: Cambridge, UK, 1994; pp. 229–251. [Google Scholar]
  5. Smallwood, K.S. Habitat fragmentation and corridors. In Wildlife Habitat Conservation: Concepts, Challenges, and Solutions; Morrison, M.L., Mathewson, H.A., Eds.; Johns Hopkins University Press: Baltimore, MD, USA, 2015; pp. 84–101. [Google Scholar]
  6. Landmann, T.; Machwitz, M.; Schmidt, M.; Dech, S.; Vlek, P. Land cover change in West Africa as observed by satellite remote sensing. In Biodiversity Atlas of West Africa: Côte d’Ivoire; Konaté, S., Kampmann, D., Eds.; BIOTA: Cotonou, Benin, 2010; Volume III, pp. 92–101. [Google Scholar]
  7. Heubes, J.; Schmidt, M.; Stuch, B.; García Márquez, J.R.; Wittig, R.; Zizka, G.; Thiombiano, A.; Sinsin, B.; Shaldach, R.; Hahn, K. The projected impact of climate and land use change on plant diversity: An example from West Africa. J. Arid Environ. 2012, 96, 48–54. [Google Scholar] [CrossRef]
  8. Bannerman, S. Spatial Patterns and Landscape Ecology: Implications for Biodiversity; British Columbia Ministry of Forests Research Program: Victoria, BC, Canada, 1997; p. 9. [Google Scholar]
  9. Bogaert, J.; Ceulemans, R.; Salvador-Van Eysenrode, D. Decision Tree Algorithm for Detection of Spatial Processes in Landscape Transformation. Environ. Manag. 2004, 33, 62–73. [Google Scholar] [CrossRef] [PubMed]
  10. Dimobe, K.; Ouédraogo, A.; Soma, S.; Goetze, D.; Porembski, S.; Thiombiano, A. Identification of driving factors of land degradation and deforestation in the Wildlife Reserve of Bontioli (Burkina Faso, West Africa). Glob. Ecol. Conserv. 2015, 4, 559–571. [Google Scholar] [CrossRef] [Green Version]
  11. Houehanou, T.D.; Glèlè Kakaï, R.L.; Assogbadjo, A.E.; Kindomihou, V.; Houinato, M.; Wittig, R.; Sinsin, B.A. Change in the woody floristic composition, diversity and structure from protected to unprotected savannahs in Pendjari Biosphere Reserve (Benin, West Africa). Afr. J. Ecol. 2013, 51, 358–365. [Google Scholar] [CrossRef]
  12. Boakye, E.A.; Gebrekirstos, A.; Hyppolite, D.N.D.; Barnes, V.R.; Kouamé, F.N.; Kone, D.; Porembski, S.; Bräuning, A. Influence of climatic factors on tree growth in riparian forests in the humid and dry savannas of the Volta basin, Ghana. Trees 2016, 1–15. [Google Scholar] [CrossRef]
  13. Polo-Akpisso, A.; Folega, F.; Soulemane, O.; Atakpama, W.; Coulibaly, M.; Wala, K.; Röder, A.; Akpagana, K.; Tano, Y. Habitat biophysical and spatial patterns assessment within Oti-Keran-Mandouri protected area network in Togo. Int. J. Biodivers. Conserv. 2018, 10, 214–229. [Google Scholar] [CrossRef] [Green Version]
  14. Folega, F.; Woegan, Y.A.; Dourma, M.; Wala, K.; Batawila, K.; Seburanga, J.L.; Zhang, C.-Y.; Peng, D.-L.; Zhao, X.-H.; Akpagana, K. Long term evaluation of green vegetation cover dynamic in the Atacora Mountain chain (Togo) and its relation to carbon sequestration in West Africa. J. Mt. Sci. 2015, 12, 921–934. [Google Scholar] [CrossRef]
  15. Barima, Y.S.S.; Barbier, N.; Bamba, I.; Traore, D.; Lejoly, J.; Bogaert, J. Dynamique paysagère en milieu de transition forêt-savane ivoirienne. Bois et Forets des Tropiques 2009, 299, 15–25. [Google Scholar] [CrossRef] [Green Version]
  16. International Union for Conservation of Nature (IUCN). Evaluation de L’efficacité de la Gestion des aires Protégées: Aires Protégées du Togo; Programme Afrique Centrale et Occidentale (PACO): Ouagadougou, Burkina Faso, 2008; p. 44. [Google Scholar]
  17. Ern, H. Die Vegetation Togos. Gliederung, Gefährdung, Erhaltung. Willdenowia 1979, 9, 295–312. [Google Scholar]
  18. Cheke, R.A. Togo. In Important Bird Areas in Africa and Associated Islands: Priority Sites for Conservation; Fishpool, L.D.C., Evans, M.I., Eds.; Pisces Publications and BirdLife International: Newbury/Cambridge, UK, 2001; pp. 947–952. [Google Scholar]
  19. Union Internationale pour la Conservation de la Nature (UICN). Baseline Study B: Etat actuel de la recherche et de la compréhension des liens entre le changement climatique, les aires protégées et les communautés, Projet: Evolution des systèmes d’aires protégées au regard des conditions climatiques, institutionnelles, sociales, et économiques en Afrique de l’Ouest, Rapport Final; GEF/UNEP/WCMC/UICN: Lomé, Togo, 2009; p. 34. [Google Scholar]
  20. Adjonou, K.; Bellefontaine, R.; Kokou, K. Les forêts claires du Parc national Oti-Kéran au Nord-Togo: Structure, dynamique et impacts des modifications climatiques récentes. Secheresse 2009, 20, 1–10. [Google Scholar] [CrossRef]
  21. Folega, F.; Samake, G.; Zhang, C.-Y.; Zhao, X.-H.; Wala, K.; Batawila, K.; Akpagana, K. Evaluation of agroforestry species in potential fallows of areas gazetted as protected areas in North-Togo. Afr. J. Agric. Res. 2011, 6, 2828–2834. [Google Scholar]
  22. Kokou, K.; Nuto, Y.; Atsri, H. Impact of charcoal production on woody plant species in West Africa: A case study in Togo. Sci. Res. Essays 2009, 4, 881–893. [Google Scholar]
  23. Folega, F.; Dourma, M.; Wala, K.; Batawila, K.; Zhang, C.Y.; Zhao, X.H.; Koffi, A. Assessment and impact of anthropogenic disturbances in protected areas of northern Togo. Stud. China 2012, 14, 216–223. [Google Scholar]
  24. Atato, A.; Wala, K.; Batawila, K.; Lamien, N.; Akpagana, K. Edible Wild Fruit Highly Consumed during Food Shortage Period in Togo: State of Knowledge and Conservation Status. J. Life Sci. 2011, 5, 1046–1057. [Google Scholar]
  25. Dimobe, K.; Wala, K.; Batawila, K.; Dourma, M.; Woegan, Y.A.; Akpagana, K. Analyse spatiale des différentes formes de pressions anthropiques dans la réserve de faune de l’Oti-Mandouri (Togo). VertigO 2012. [Google Scholar] [CrossRef]
  26. Folega, F.; Zhang, C.Y.; Zhao, X.H.; Wala, K.; Batawila, K.; Huang, H.G.; Dourma, M.; Akpagana, K. Satellite monitoring of land-use and land-cover changes in northern Togo protected areas. J. Res. 2014, 25, 385–392. [Google Scholar] [CrossRef]
  27. Intergovernmental Panel on Climate Change (IPCC). Good Practice Guidance for Land Use, Land-Use Change and Forestry; Intergovernmental Panel on Climate Change: Geneva, Switzerland, 2003; p. 554. [Google Scholar]
  28. Eastman, J.R. IDRISI Selva Manual; Labs, C., Ed.; Clark University: Worcester, MA, USA, 2012; Volume 17, p. 322. [Google Scholar]
  29. Cohen, I. A coefficient of agreement of nominal scales. Educ. Psychol. Meas. 1960, 20, 37–46. [Google Scholar] [CrossRef]
  30. Congalton, R.G.; Oderwald, R.; Mead, R. Assessing Landsat classification accuracy using discrete multivariate analysis statistical techniques. Photogramm. Eng. Remote Sens. 1983, 49, 1671–1678. [Google Scholar]
  31. Liu, C.; Frazier, P.; Kumar, L. Comparative assessment of the measures of thematic classification accuracy. Remote Sens Environ. 2007, 107, 606–616. [Google Scholar] [CrossRef]
  32. Lira, C.; Taborda, R. Advances in Applied Remote Sensing to Coastal Environments Using Free Satellite Imagery. In Remote Sensing and Modeling: Advances in Coastal and Marine Resources; Finkl, C.W., Makowski, C., Eds.; Springer International Publishing: Berlin, Germany, 2014; Volume 9, pp. 77–102. [Google Scholar]
  33. Afidégnon, D.; Carayon, J.-L.; Fromard, F.; Lacaze, D.; Guelly, K.A.; Kokou, K.; Woegan, Y.A.; Batawila, K.; Blasco, F.; Akpagana, K. Carte de Végétation de la Végétation du Togo; Laboratoire de Botanique et Ecologie Végétale & Laboratoire d’Ecologie Tropicale: Lomé, Togo, 2002. [Google Scholar]
  34. Hord, R.M.; Brooner, W. Land use map accuracy criteria. Photogramm. Eng. Remote Sens. 1976, 42, 671–677. [Google Scholar]
  35. Hay, A.M. Sampling designs to test land use map accuracy. Photogramm. Eng. Remote Sens. 1979, 45, 529–533. [Google Scholar]
  36. Rosenfield, G.H. Sample design for estimating change in land use and land cover. Photogramm. Eng. Remote Sens. 1982, 48, 793–801. [Google Scholar]
  37. Rosenfield, G.H.; Melley, M.L. Applications of statistics to thematic mapping. Photogramm. Eng. Remote Sens. 1980, 48, 1287–1294. [Google Scholar]
  38. Fitzpatrick-Lins, K. Comparison of sampling procedures and data analysis for a land use and land cover maps. Photogramm. Eng. Remote Sens. 1981, 47, 343–351. [Google Scholar]
  39. Maingi, J.K.; Marsh, S.E.; Kepner, W.G.; Edmonds, C.M. An Accuracy Assessment of 1992 Landsat-MSS Derived Land Cover for the Upper San Pedro Watershed (U.S./Mexico); United States Environmental Protection Agency: Washington, DC, USA, 2002; p. 21.
  40. McCoy, R.M. Field Methods in Remote Sensing; The Guilford Press: New York, NY, USA, 2005; p. 151. [Google Scholar]
  41. van Genderen, J.L.; Lock, B.F. Testing land use map accuracy. Photogramm. Eng. Remote Sens. 1977, 43, 1135–1137. [Google Scholar]
  42. Giles, J.R.R.H.; Trani, M.K. Key Elements of Landscape Pattern Measures. Environ. Manag. 1999, 23, 477–481. [Google Scholar] [CrossRef]
  43. Pontius, R.G.; Shusas, E.; McEachern, M. Detecting important categorical land changes while accounting for persistence. Agric. Ecosyst. Environ. 2004, 101, 251–268. [Google Scholar] [CrossRef]
  44. Jung, M. LecoS—A QGIS plugin for automated landscape ecology analysis. PeerJ PrePrints 2013, e116v2. [Google Scholar] [CrossRef]
  45. Padakale, E.; Atakpama, W.; Dourma, M.; Dimobe, K.; Wala, K.; Guelly, K.A.; Akpagana, K. Woody Species Diversity and Structure of Parkia biglobosa Jacq. Dong Parklands in the Sudanian Zone of Togo (West Africa). Annu. Res. Rev. Biol. 2015, 6, 103–114. [Google Scholar] [CrossRef]
  46. Kebenzikato, A.B.; Wala, K.; Dourma, M.; Atakpama, W.; Dimobe, K.; Pereki, H.; Batawila, K.; Akpagana, K. Distribution et structure des parcs à Adansonia digitata L. (baobab) au Togo (Afrique de l’Ouest). Afr. Sci. 2014, 10, 434–449. [Google Scholar]
  47. Wala, K.; Sinsin, B.; Guelly, K.A.; Kokou, K.; Akpagana, K. Typologie et structure des parcs agroforestiers dans la préfecture de Doufelgou (Togo). Science et Changements Planétaires/Sécheresse 2005, 16, 209–216. [Google Scholar]
  48. Badjana, H.M.; Selsam, P.; Wala, K.; Flügel, W.-A.; Fink, M.; Urban, M.; Helmschrot, J.; Afouda, A.; Akpagana, K. Assessment of land-cover changes in a sub-catchment of the Oti basin (West Africa): A case study of the Kara River basin. Zentralblatt für Geologie und Paläontologie, Teil I 2014, 1, 151–170. [Google Scholar] [CrossRef]
  49. Smith, C.D.; DeGloria, S.D.; Richmond, M.E.; Gregory, S.K.; Laba, M.; Smith, S.D.; Braden, J.L.; Fegraus, E.H.; Hill, E.A.; Ogureak, D.E.; et al. The New York Gap Analysis Project Final Report; New York Cooperative Fish and Wildlife Research Unit, Cornell University: Ithaca, NY, USA, 2001. [Google Scholar]
  50. Lapin, C.N.; Etterson, M.A.; Niemi, G.J. Occurrence of Connecticut Warbler Increases with size of patches of coniferous forest. Condor 2013, 115, 168–177. [Google Scholar] [CrossRef]
  51. Keller, J.K.; Smith, C.R. Improving GIS-Based Wildlife-Habitat Analysis; Springer: New York, NY, USA, 2014. [Google Scholar] [CrossRef]
  52. Adjonou, K. Rapport de Collecte des Données Nationales Togo; PARCC-UNEP-UICN-GEF: Lomé, Togo, 2012; p. 62. [Google Scholar]
  53. Houessou, L.G.; Teka, O.; Imorou, I.T.; Lykke, A.M.; Sinsin, B. Land Use and Land-Cover Change at “W” Biosphere Reserve and Its Surroundings Areas in Benin Republic (West Africa). Environ. Nat. Resour. Res. 2013, 3, 87–100. [Google Scholar] [CrossRef]
  54. Lambin, E.F.; Geist, H.J.; Lepers, E. Dynamics of land-use and land-cover change in tropical regions. Annu. Rev. Environ. Resour. 2003, 28, 205–241. [Google Scholar] [CrossRef] [Green Version]
  55. Wood, E.C.; Tappan, G.G.; Hadj, A. Understanding the drivers of agricultural land use change in south-central Senegal. J. Arid Environ. 2004, 59, 565–582. [Google Scholar] [CrossRef]
  56. Badjana, H.M.; Batawila, K.; Wala, K.; Akpagana, K. Évolution des paramètres climatiques dans la plaine de l‘Oti (Nord-Togo): Analyse statistique, perceptions locales et mesures endogènes d’adaptation. Afr. Sociol. Rev. 2011, 15, 77–95. [Google Scholar]
  57. Diwédiga, B.; Batawila, K.; Wala, K.; Hounkpè, K.; Gbogbo, A.K.; Akpavi, S.; Tatoni, T.; Akpagana, K. Exploitation Agricole des Berges: Une Strategie d’Adaptation aux Changements Climatiques Destructrice des Forets Galleries dans la Plaine de l’Oti. Afr. Sociol. Rev. 2013, 16, 77–99. [Google Scholar]
  58. Ojoyi, M.M.; Mwenge Kahinda, J.-M. An analysis of climatic impacts and adaptation strategies in Tanzania. Int. J. Clim. Chang. Strateg. Manag. 2015, 7, 97–115. [Google Scholar] [CrossRef]
  59. Dudley, N.; Jonas, H.; Nelson, F.; Parrish, J.; Pyhälä, A.; Stolton, S.; Watson, J.E.M. The essential role of other effective area-based conservation measures in achieving big bold conservation targets. Global Ecol. Conserv. 2018, 15, e00424. [Google Scholar] [CrossRef]
  60. Direction Générale de la Statistique et de la Comptabilité Nationale (DGSCN). Recensement Général de la Population et de l’Habitat; Ministère de la Planification du Développement et de l’Aménagement du Territoire (MPDAT): Lomé, Togo, 2011; p. 52. [Google Scholar]
  61. International Monetary Fund. République Togolaise. Document Complet de Stratégie de Réduction de la Pauvreté (DSRP-C) 2009–2011; International Monetary Fund: Washington, DC, USA, 2009; p. 117. [Google Scholar]
  62. Konaté, S.; Linsenmair, K.E. Biological diversity of West Africa: Importance, threats and valorisation. In Biodiversity Atlas of West Africa Volume III: Côte d’Ivoire; Konaté, S., Kampmann, D., Eds.; BIOTA: Cotonou, Benin, 2010; Volume III, pp. 14–32. [Google Scholar]
  63. Dimobe, K.; Wala, K.; Dourma, M.; Kiki, M.; Woegan, Y.; Folega, F.; Batawila, K.; Akpagana, K. Disturbance and Population Structure of Plant Communities in theWildlife Reserve of Oti-Mandouri in Togo (West Africa). Annu. Res. Rev. Biol. 2014, 4, 2501–2516. [Google Scholar]
  64. USGS. West Africa Land Use and Land Cover Trends Project. Available online: http://lca.usgs.gov/lca/africalulc/results.php#togo_lulc (accessed on 27 February 2015).
  65. Okoumassou, K.; Durlot, S.; Akpamou, K.; Segniagbeto, H. Impacts humains sur les aires de distribution et couloirs de migration des éléphants au Togo. Pachyderm 2004, 36, 69–79. [Google Scholar]
  66. Arouna, O.; Toko, I.; Djogbénou, C.P.; Sinsin, B. Comparative analysis of local populations’ perceptions of socioconomic determinants of vegetation degradation in sudano-guinean area in Benin (West Africa). Int. J. Biodivers. Conserv. 2011, 3, 327–337. [Google Scholar]
  67. Badjana, H.M.; Hounkpè, K.; Wala, K.; Batawila, K.; Akpagana, K.; Edjamé, K.S. Analyse de la variabilité temporelle et spatiale des séries climatiques du nord du Togo entre 1960 et 2010. Eur. Sci. J. 2014, 10, 257–272. [Google Scholar]
  68. Menotti, F.; O‘Sullivan, A. The Oxford Handbook of Wetland Archaeology; Oxford University Press: Oxford, UK, 2013; p. 976. [Google Scholar]
  69. Whitmore, T.M.; Turner, B.L. Cultivated Landscapes of Middle America on the Eve of Conquest; Oxford University Press: Oxford, UK, 2001; p. 311. [Google Scholar]
  70. Jaeger, J.G. Landscape division, splitting index, and effective mesh size: New measures of landscape fragmentation. Landsc. Ecol. 2000, 15, 115–130. [Google Scholar] [CrossRef]
  71. Laurance, W.F.; Lovejoy, T.E.; Vasconcelos, H.L.; Bruna, E.M.; Didham, R.K.; Stouffer, P.C.; Gascon, C.; Bierregaard, R.O.; Laurance, S.G.; Sampaio, E. Ecosystem Decay of Amazonian Forest Fragments: A 22-Year Investigation. Conserv. Biol. 2002, 16, 605–618. [Google Scholar] [CrossRef] [Green Version]
Figure 1. Study area.
Sci 02 00001 g001
Figure 2. Decision tree procedure to identify transformation processes as outlined by Bogaert, Ceulemans and Salvador-Van Eysenrode [9]. The parameters a1, p1, and n1 refer to the habitat area, perimeter, and number of patches before transformation, respectively, while a2, p2, and n2 are the respective reciprocal values after pattern change. Symbol << means much less than.
Sci 02 00001 g002
Figure 3. Diagrams representing the 10 spatial processes in land transformation by Bogaert, Ceulemans and Salvador-Van Eysenrode [9]. The black areas refer to the land cover of interest and the white areas to the landscape matrix: (a) aggregation: merging of patches; (b) attrition: disappearance of one of the four patches present in the original landscape; (c) creation: landscape transformation by formation of a new patch, increasing the number of patches from two to three; (d) deformation: transformation characterized by a shape change of both patches from a square to a rectangular shape; (e) dissection: subdivision of a continuous area by equal width lines into six parts; (f) enlargement: transformation by size increase of both patches; (g) fragmentation: landscape conversion by breaking up the continuous land cover into five disjunct patches of unequal size and shape; (h) perforation: transformation by the formation of four gaps; (i) shift: translocation of one or both patches; and (j) shrinkage: patches undergoing a decrease in size.
Sci 02 00001 g003
Figure 4. Land cover maps of Oti-Keran-Mandouri for 1987, 2000, and 2013.
Sci 02 00001 g004
Figure 5. Changes in land categories within the Oti-Keran-Mandouri complex in Togo from 1987 to 2013.
Sci 02 00001 g005
Figure 6. Number of patches for different land cover categories within Oti-Keran-Mandouri from 1987 to 2013.
Sci 02 00001 g006
Figure 7. Areas of different land cover categories within Oti-Keran-Mandouri from 1987 to 2013.
Sci 02 00001 g007
Table 1. Landsat image characteristics.
ImagePathRowSensorDate of Acquisition
1193053Landsat 4 Thematic Mapper (TM)1987-10-30
2193052Landsat 4 Thematic Mapper (TM)1987-10-30
3193053Landsat 7 Enhanced Thematic Mapper (ETM) 2000-12-04
4193052Landsat 7 Enhanced Thematic Mapper (ETM)2000-12-30
519353Landsat 8 Operational Land Imager (OLI)2013-10-29
Table 2. Land categories’ definitions.
Land CategoryDefinition
1ForestThis category includes vegetation dominated by trees above 7 m in height and with closed canopy. Shrubs or herbaceous may be present.
2SavannaThis category includes vegetation with a continuous grass cover. Trees and shrubs may be present but scattered.
3WetlandMarshland or areas covered permanently or temporarily by water.
4CroplandThis includes all open lands and pastures exploited to grow crops and raise livestock, including traditional agroforestry systems and parklands.
5SettlementsThis category includes transportation infrastructure, human settlements of any size, and bare soils.
6Water bodiesThis category is reserved for any stretch of water, including rivers and water ponds.
Table 3. Minimum sample size per land category for image 5 (October 2013).
ClassCategoriesArea (ha)%AreaEstimated SampleFinal Sample Size
1Forests4038.212.2360615.5007120
2Savannas33,255.1818.4142545.2990646
3Wetlands57,26731.7102278.0071380
4Croplands62,858.0734.8061485.6230990
5Settlements18,454.8610.2189325.1385727
6Water bodies4721.492.6144116.4314517
Total180,594.8100246270
Table 4. Image classification accuracy.
Land Cover198720002013
PA (%)UA (%)PA (%)UA (%)PA (%)UA (%)
Forests10061.1182.2278.7283.8789.66
Savannas82.4786.0281.82606872.34
Wetlands81.318783.7270.5987.1069.23
Croplands5033.3362.968584.6291.67
Settlements26.3262.5014.291007557.14
Water bodies10036.3616.6710035.7183.33
Overall accuracy79.28%73.33%79.06%
Kappa0.690.650.72
PA = Producer’s accuracyUA = User’s accuracy
Table 5. Net change in each land category within Oti-Keran-Mandouri.
1987 to 20002000 to 20131987 to 2013
Total Net Change (ha)Average Net Change per Year (ha)Annual Net Change in %Total Net Change (ha)Average Net Change per Year (ha)Annual Net Change in %Total Net Change (ha)Average Net Change per Year (ha)Annual Net Change in %
Forests33625.850.16−12,269−943.77−5.79−11,923−917.15−5.74
Savannas−20,548−1580.62−2.32−14,321−1101.62−2.32−34,869−2682.23−3.94
Wetlands−12,186−937.38−1.21−8285−637.31−0.97−20,472−1574.77−2.03
Croplands23,1901783.85108.1338,0192924.5411.7761,2094708.38285.39
Settlements 9894761.085.45−5415−416.54−1.754479344.542.47
Water bodies−685−52.69−1.682272174.777.1415861223.89
Table 6. Change process for different land categories within Oti-Keran-Mandouri from 1987 to 2013.
Change Process
1987–20002000–20131987–2013
ForestsCreationAttritionAttrition
SavannasDissectionAttritionAttrition
WetlandsAttritionDissectionDissection
CroplandsCreationAggregationCreation

