Article

Performance Evaluation of Uncooled UAV Infrared Camera in Detecting Concrete Delamination

1
Department of Civil and Environmental Engineering, University of Delaware, Newark, DE 19716, USA
2
School of Civil Engineering, Chongqing Jiaotong University, Chongqing 400074, China
3
State Key Laboratory of Mountain Bridge and Tunnel Engineering, Chongqing Jiaotong University, Chongqing 400074, China
4
Durham School of Architectural Engineering & Construction, University of Nebraska, Lincoln, NE 68508, USA
*
Author to whom correspondence should be addressed.
Infrastructures 2022, 7(12), 163; https://doi.org/10.3390/infrastructures7120163
Submission received: 1 November 2022 / Revised: 18 November 2022 / Accepted: 25 November 2022 / Published: 30 November 2022

Abstract

:
Concrete delamination detection using unmanned aerial vehicle (UAV)-mounted infrared cameras has proved effective in recent research. However, most studies used expensive research-grade infrared cameras and proprietary software to acquire images, which is hard to implement in state departments of transportation (DOTs) due to the lack of specialty professionals. Some state DOTs started deploying lightweight UAV-based consumer-grade infrared cameras for delamination detection. Quantitative performance evaluation of such a camera in concrete delamination detection is lacking. To fill this gap, this study intends to conduct a comprehensive assessment of the consumer-grade camera benchmarked against the results of a research-grade camera to see the practicality of using the small and low-cost camera in concrete delamination detection. Data was collected for a slab with mimicked delamination and two in-service bridge decks. For the case of the slab, maximum detectability of 70–72% was achieved. A transient numerical simulation was conducted to provide a supplemental and noise-free dataset to explore detectability accuracy peaks throughout the day. The results of the in-service bridge decks indicated that the consumer-grade infrared camera provided adequate detection of the locations of suspected delamination. Results of both the slab and in-service bridge decks were comparable to those of a research-grade infrared camera.

1. Introduction

1.1. Concrete Deck Delamination Detection Using Infrared Thermography (IRT)

The steel reinforcement in concrete bridge decks is susceptible to corrosion due to exposure to environmental elements [1,2]. This could lead to serviceability deterioration of the bridge as it leads to cracking and delamination [3,4]. Concrete delamination occurs when the steel rebar corrodes to the point that causes cracking, which is exaggerated as the corrosion causes the concrete cracks to widen until they connect [3,4]. The cracks that usually occur at the concrete cover level compromise the bridge’s structural integrity, thus decreasing its service life [3]. Therefore, accurate detection of concrete delamination in bridge decks is critical to aid in making the appropriate decisions concerning repairs or replacement of said bridge decks, which is a costly procedure. It was estimated in 2016 that about 25% of bridges in the United States are in either fair, poor, or very poor condition, with about $70.9 billion needed for maintenance [5]. Bridges are susceptible to deterioration problems since they continuously support traffic loads and are exposed to the natural environment. Thus, they constantly need inspections and maintenance.
Traditional methods, such as the chain drag test, are still being applied to detect shallow delamination. The method involves dragging a chain over the concrete surface and attempting to detect hollow sounds in the affected areas [6,7,8]. However, this method is subjective as it depends on the inspector’s judgment, interrupts traffic on the bridge, and is time-consuming. The traditional detection methods, such as hammer-sounding test results, are also considered to be of relatively low accuracy, where the accuracy was estimated to be no more than 30% [5,9]. In recent decades, many non-destructive evaluation (NDE) methods have been adopted in an attempt to dampen the excessive financial losses and increase the accuracy of the results [10,11], such as impact-echo (IE) [12,13,14], ground-penetrating radar (GPR) [10,12,15], ultrasonic tests (UST) [12,16,17], and infrared thermography (IRT) [18,19,20,21,22,23,24,25,26,27,28,29,30,31,32,33,34,35,36,37,38,39,40,41,42].
Mixed results were reported on the performance of using infrared thermography (IRT) in concrete delamination detection since the 1980s [43,44,45,46]. The main issue was its sensitivity to environmental conditions and the difficulty of data collection [32,43,44]. Furthermore, IRT can also be influenced by the properties of the concrete itself. The lower the density and water–cement ratio of the concrete (higher compressive strength), the better the performance of IRT [47]. However, concrete bridge deck design generally follows rigid guidelines on the compressive strength of concrete to be achieved, along with water–cement ratio specification [48]. Therefore, concrete bridge deck delamination detection results would be fairly consistent within the selected region of inspection.
Due to the recent advancements in infrared sensors, image processing, and UAVs, UAV-based IRT has demonstrated promising results in concrete delamination detection in recent studies [19,24,25,26,27,27,28,29,30,31,32,33,34,35,36,37,38,39,40,41,43,47,49,50]. These studies reported comparable or better results compared to other non-destructive evaluation (NDE) methods [23,42,51]. Additionally, while providing comparable results to other NDE methods, IRT offers advantages over other detection methods. The benefits of IRT include lower labor costs and easier handling of equipment [51]. The data collection time can be significantly reduced as there is no need for direct surface contact [18]. Furthermore, thermal and regular RGB images are non-distorted and thus can be easily overlaid to map out the issued areas [19].
However, in most of these recent studies, researchers used sophisticated and expensive research-grade infrared cameras that host infrared sensors in a cooling chamber [19,24,26,27,28,30,31,36,37,41]. Research-grade infrared cameras are both costly and heavy, thus needing customized equipment for handling. In addition, these cameras require specialized technical training to acquire and process the infrared image data, which is a significant technical and financial challenge for state DOTs to implement the new technology.
On the other hand, the utilization of lightweight UAV-based infrared cameras that use uncooled infrared sensors grows fast in many UAV applications [26,27,28,29,30,33,34,38,50]. Many DOTs possessed these UAV-based infrared cameras. These uncooled sensors typically have lower spatial and temperature resolutions/performance than cooled sensors [20,52]. As shown in Table 1, the cooled sensor has a higher spatial resolution, temperature sensitivity, and more accurate temperature readings.
It is tempting to know whether the performance of the uncooled sensors can be comparable to that of the cooled sensors. Currently, there is a lack of comprehensive quantitative studies to answer this question. In this study, the authors conducted a comprehensive study to evaluate and compare the delamination detection performance of the uncooled and cooled infrared image sensor intending to assist state DOTs in assessing their options when selecting the appropriate technology for bridge deck assessments.

1.2. IRT Delamination Detection and Segmentation

IRT-based delamination detection and segmentation rely on differentiating the temperature differences between the delaminated areas and the sound areas caused by their different thermal conductivities of 1.6 W/m °C (sound concrete) and 0.0241 W/m °C (delaminated concrete) [28,54]. Thus, when solar irradiance heats the concrete under passive conditions, the air inside the delaminated area heats up faster than the surrounding concrete, and the areas appear warmer. The opposite would apply during the cooling phase, as the delamination areas would cool faster [28,54].
IRT data collection can be completed under different thermal excitation approaches of either passive or active thermography inspection [55,56]. Passive thermography depends on environmental conditions, ambient temperatures, and solar irradiance to induce thermal contrast for materials of different thermal conductivities. On the other hand, active IRT introduces an external heating source such as halogen lamps [55,56]. The lamps are used to emit radiation to the target element. The emitted radiation would then induce thermal contrasts, same as the passive IRT mechanism. However, while active IRT would produce more consistent detection results, there is a need to incorporate more equipment and other considerations of distance from the object of interest, as well as the time taken to set up the inspection environment [56].
There are many different image processing algorithms to segment the delaminated areas based on the temperature difference between the two, such as thermal contrast [30,38], k-means clustering [33,34], temperature gradient [24,31], and machine learning [37]. Among these methods, the gradient-based method appears to be a robust and more reliable method [19,24], and it is not significantly affected by the temperature accuracy of the sensors.

1.3. Scope of Work

In this paper, the performance comparison between the cooled and uncooled sensors used a gradient-based method to take advantage of the uncooled sensor’s high thermal sensitivity, as shown in Table 1. It takes time for the concrete surface temperature to develop a significant enough contrast under solar irradiance so that the 0.05 K thermal sensitivity of the uncooled sensor can differentiate delamination areas. Therefore, the timing of the filed data collection is an essential factor. We follow the recommended best timing by [19].
This study focuses on the delamination detection of concrete bridge decks using an uncooled thermal sensor camera under passive IRT conditions compared to the results of a research-grade thermal camera. Passive IRT was selected as the source of thermal excitation for the experiment. Passive IRT was selected as the mode of investigation to provide a simplified inspection process while avoiding the need to introduce external heating sources/equipment. Furthermore, while this study focuses on bridge decks as the element of interest for delamination detection, IRT applications can extend to other bridge components or defects. However, that is beyond the scope of this study.

2. Background

Multiple studies and intensive research have been developed in the application of IRT in the delamination detection of concrete bridge decks. Each method used a different approach regarding data collection time, choice of the thermal camera, and post-image processing methods. All the other strategies were aimed at countering the method’s limitations. The following paragraphs investigate different papers, their approach, and their results.

2.1. Cooled vs. Uncooled Infrared Camera

The choice of thermal camera specifications depends on the application type and the purpose of the collected data. Infrared cameras with a cooled detector are typically cooled down to cryogenic temperatures [57,58]. The cooling technique minimizes interference of the detector’s temperature with the recorded temperatures of the target object. Additionally, they tend to have a faster capture rate, allowing for consistent results [57,58]. They also tend to have higher resolutions as well (Table 1). All these advantages enable them to have accurate detection abilities with reduced noise impact from the surrounding environment. Yet, this comes at the expense of higher costs, bulky products, and a short life span.
On the other hand, uncooled thermal cameras’ temperature reading accuracy is significantly reduced compared to cooled thermal cameras [57,58]. However, while they do not have all the listed superior specifications, the assumption stands that if enough sensitivity and resolutions are present for detection, the uncooled thermal camera should be able to provide sufficiently accurate detection of delamination. This allows for more cost-effective alternatives that are easier to handle.
Therefore, the choice of infrared would depend on the scope of the application and the specific purpose the collected data will serve. In the case of an application with the subject of the study or object being relatively small (e.g., microchip), constantly moving, or needing very accurate temperature readings, a cooled thermal camera would be the best choice [58]. However, in the case of delamination detection, the object is usually assumed to be sufficiently large and static, where temperature recording accuracy is not significant. The critical factors would be resolution and sensitivity [27]. Uncooled thermal cameras have a few options with acceptable accuracies and sensitivities, such as the one used in this study (Table 1), that would satisfy the scope of delamination detection in concrete bridges.

2.2. Studies Utilizing a Cooled Sensor Thermal Camera

In a report dedicated to the Nebraska Department of Transportation, thermal images were collected from 33 in-service concrete bridge decks [19]. Significant advances were achieved in countering the limitation of IRT’s sensitivity to noise and surface conditions. Three different methods were applied for image processing, hoping to evaluate the accuracy of the developed methods in detecting delamination, while managing and filtering noise and outliers. In addition, a 3D model was developed using Autodesk CFD 2017 to provide noise-free data, as well as test delamination detectability at different depths and sizes, and anticipate the best time for data collection. The numerical simulation concluded that the best time windows for data collection are 2:00–5:00 p.m. during the summer and 2:00–4:00 p.m. during the fall.
The gray-scale method applies a top-down approach utilizing a decay function to regularize the gray-scale morphological reconstruction for regional maxima extraction. This approach addresses the issue of missing delamination areas within the regional maxima area [31]. Data collection was completed with a FLIR A8300 thermal camera with a cooled sensor. However, there is a limitation where human judgment is needed for selecting the step size and number of iterations required.
Next is a method that utilizes a temperature gradient level-set method instead of typical thermal contrast detection, in which a raw image is taken; a difference image is then used to filter sparking areas caused by surface texture reflection from solar radiation [24]. The camera utilized in this study was a cooled sensor thermal camera (FLIR A8300). The proposed method was superior to the k-means method at almost all time windows and showed higher detection accuracy. The method showed a 68–79% accuracy and can deal with the noise caused by environmental factors [24]. However, there is a limitation in which the threshold value used for detection is based on the subjective opinion of the operator.
The third method is an alternative method applying a deep learning model based on encoder–decoder architecture proposed to segment the delamination areas in thermal images at the pixel level using a supervised learning method [37]. The thermal camera was a cooled sensor camera (FLIR A8300). There are limitations with environmental noise, as the model is sensitive to them, and there is a need for more training data to improve the accuracy [37].
The following method is thermographic Laplacian pyramid filtering, which uses the blob detection method to enhance delamination detection by applying a Laplacian of Gaussian filter to achieve a multiscale detection of abnormal thermal areas [36]. Laplacian of Gaussian (LoG) is used to detect brighter or darker regions from the surroundings, which is applied in the medical field for cell identification [36]. The method utilized a cooled sensor thermal camera (FLIR A8300). Yet, the method showed to still be sensitive to environmental conditions.
A common limitation with studies utilizing cooled thermal cameras is either the subjectivity of the threshold or, more importantly, the camera choice itself. Despite the breakthrough of reducing the noise effect on IRT delamination detection capability, the issue of camera choice is yet to be resolved. Cooled research-grade thermal cameras, as previously elaborated, are expensive, heavy, and impractical for field application.

2.3. Studies Utilizing Uncooled Sensor Thermal Camera

In their research on applying IRT to detect delamination, Tarek Omar and Moncef L. Nehdi collected thermal data using a UAV or a vehicle to expedite the data collection method [33,34]. Both studies utilized uncooled thermal cameras for data collection of two bridges (FLIR T650Sc and FLIR Vue Pro). K-means clustering was used for image processing and identifying the delamination areas illustrated through delamination severity maps. The results were determined to be close and of sufficient accuracy when compared to hammer-sounding results. However, there are a few limitations to be addressed; the accuracies of the research approach of data collection and camera choice were evaluated qualitatively. Furthermore, the appropriate number of clusters needed depends on the subjective expertise of the analyst. Thus, different inputs would lead to different results. Additionally, k-means are sensitive to outliers, which could cause inaccuracies in detection results [33,34].
Ali Sultan and Glenn Washer investigated delamination detection using IRT by collecting data from a mimicked slab and an in-service bridge deck [38]. An uncooled sensor FLIR T620 thermal camera was chosen for data collection. The thermal images were processed by converting them to binary coded values of 0 and 1. Then, the images were analyzed by identifying a threshold of a sound area and delamination areas. The limitations of this method are that it requires subjective interpretation of the best threshold setting for assigning the delamination and sound areas, and it only performs well with shallow delamination detection. In addition, the method is susceptible to boundary conditions and surface noise.
A common limitation among studies utilizing an uncooled consumer-grade thermal camera is the significant sensitivity to noise and surface conditions, as well as the inconsistency of temperature recording of the test subject.

2.4. Studies Utilizing Both Uncooled and Cooled Sensor Thermal Cameras

An automated detection method was investigated and developed to increase the accuracy of delamination detection while eliminating the need to depend on subjectively set thresholds of concrete bridge deck thermal images [41]. A deep learning classification approach was applied, then a training dataset was developed by collecting thermal images from other studies. Two data collection cameras were chosen: a cooled thermal camera (FLIR SC600) and an uncooled thermal camera (FLIR SC660). Yet, the method still has a few limitations, such as the limited data to build a comprehensive training set. Another limitation is that the uncooled thermal camera was deemed an unacceptable choice early in the study. Its application was not further explored or compared to the cooled thermal camera.
A group of researchers conducted several studies on the applicability of IRT as an NDE delamination detection method [26,27,28,29,30,35]. Three thermal cameras were selected for investigation purposes: FLIR T420, FLIR T640, and FLIR SC5600 [27]. The first two cameras have an uncooled detector, while the last one has a cooled detector. Additionally, the SC5600 and T640 had matching resolutions, which are higher than the T420 thermal camera. A MATLAB script was developed to process the collected images where the value of each pixel was read, and a threshold was set based on the temperature data collected from the specimens. Regarding camera specification, the SC5600 detected the shape of delamination most clearly, and the SC5600 and T640 were able to detect delamination faster than the lower-resolution T420. Therefore, the camera specification plays a critical role in the detection, with more attention paid to resolution and thermal sensitivity [27]. Yet, the comparison of the cameras’ detection accuracy was qualitatively based, and no regard was paid to the applicability of the research approach. In addition, the paper presented the issue of environmental noise throughout the study. The method was sensitive to noise despite being conducted in a controlled environment. Furthermore, the image analysis method was highly dependent on a subjectively preset threshold dependent on the analyst’s choice.
In the subsequent study, different camera specifications, along with times and speed of data collection, are investigated [28]. Four concrete specimens were built for the study, with delamination placed at different depths. Data was collected using all three thermal cameras simultaneously from a moving vehicle at varying speeds and other times. The images collected were then analyzed using infrared image processing software [28,59]. The study determined that the thermal-cooled camera (SC5600) consistently showed the highest detection accuracy and data collection speed. In contrast, the uncooled thermal camera (T650) performed better than the other lower-resolution uncooled thermal camera (T420). The developed method for image analysis showed to be significantly affected by environmental conditions and other factors, such as speed of data collection, where accuracy significantly degraded if optimal conditions were not possible for data collection. Additionally, detection capabilities were determined visually rather than utilizing a quantitative measure of detection accuracy.
Despite those studies comparing cooled and uncooled sensor thermal cameras, they depended on visual evaluation of the results without quantitative assessment of the detection accuracy. Furthermore, those studies seemed to neglect the practical part of the application. For instance, the case study in [41] automatically disregarded the uncooled sensor thermal camera for its inability to detect deeper delamination compared to its competitor, the cooled thermal camera. However, this neglected the possible benefits the uncooled thermal camera might add despite the reduced accuracy of detection, which, if inspected, might not have been as severe to disregard it as an option altogether. A possible solution is to explore an image analysis method that can overcome the limitation of an uncooled thermal camera and still maintain an acceptable detection accuracy.

2.5. Purpose of the Research

As mentioned above, researchers of [24] have taken a big step towards more accurate concrete delamination detection using UAV-IRT by employing a gradient-based detection method. However, the results were primarily based on the high-resolution (1280 × 720), high-sensitivity (0.02 K), and significant temperature accuracy (2 °C) of thermal images acquired by an expensive and heavy camera with a cooled-infrared sensor (FLIR A8303sc), as illustrated in Table 1. The camera requires an external power source and collects imagery on an onboard computer, so the UAVs need to be customized to be able to carry the necessary devices. These may limit the widespread use of the developed methodology.
This research aims to explore the practical angle of IRT application while employing the level-set method previously presented in [24]. Through this application, the authors evaluate the effectiveness of IRT in detecting concrete delamination using a consumer-grade thermal camera and the level-set method in [24]. For the purpose of this research, an uncooled camera, Zenmuse XT DJI, was used, with lower specifications of 640 × 512 resolution, sensitivity of 0.05 Kelvin, and temperature accuracy of 20 °C, as highlighted in Table 1.
The goal is to investigate whether a consumer-grade camera can be used whilst still providing acceptable accuracy of delamination detection by applying the proposed level-set method in [24]. The assumption is that when the temperature differences between the delamination and sound areas are greater than 0.1 Kelvin under certain boundary conditions, the delamination can still be segmented by the infrared sensor using the level-set method. Thus, the accuracy of 0.05 Kelvin can provide sufficient sensitivity to the temperature gradient between sound and delimitated areas. If successful, this contributes to making IRT and the level-set method more accessible by allowing the use of more affordable equipment. The camera itself is small, does not require a laptop connection, and is easy to operate.
A new set of field data was collected in Delaware to supplement the Nebraska data in [19,24]. Moreover, a numerical simulation was conducted to determine the local area’s highest detection accuracy achievable during the day. The hypothesis is that, despite the temperature accuracy of the consumer-grade thermal camera being significantly lower than that of the research-grade thermal camera, it does not affect detectability. This is because IRT and the level-set method [24] mainly depend on the temperature gradient between the sound concrete and delamination areas, not their recorded temperatures.

3. The Proposed Approach

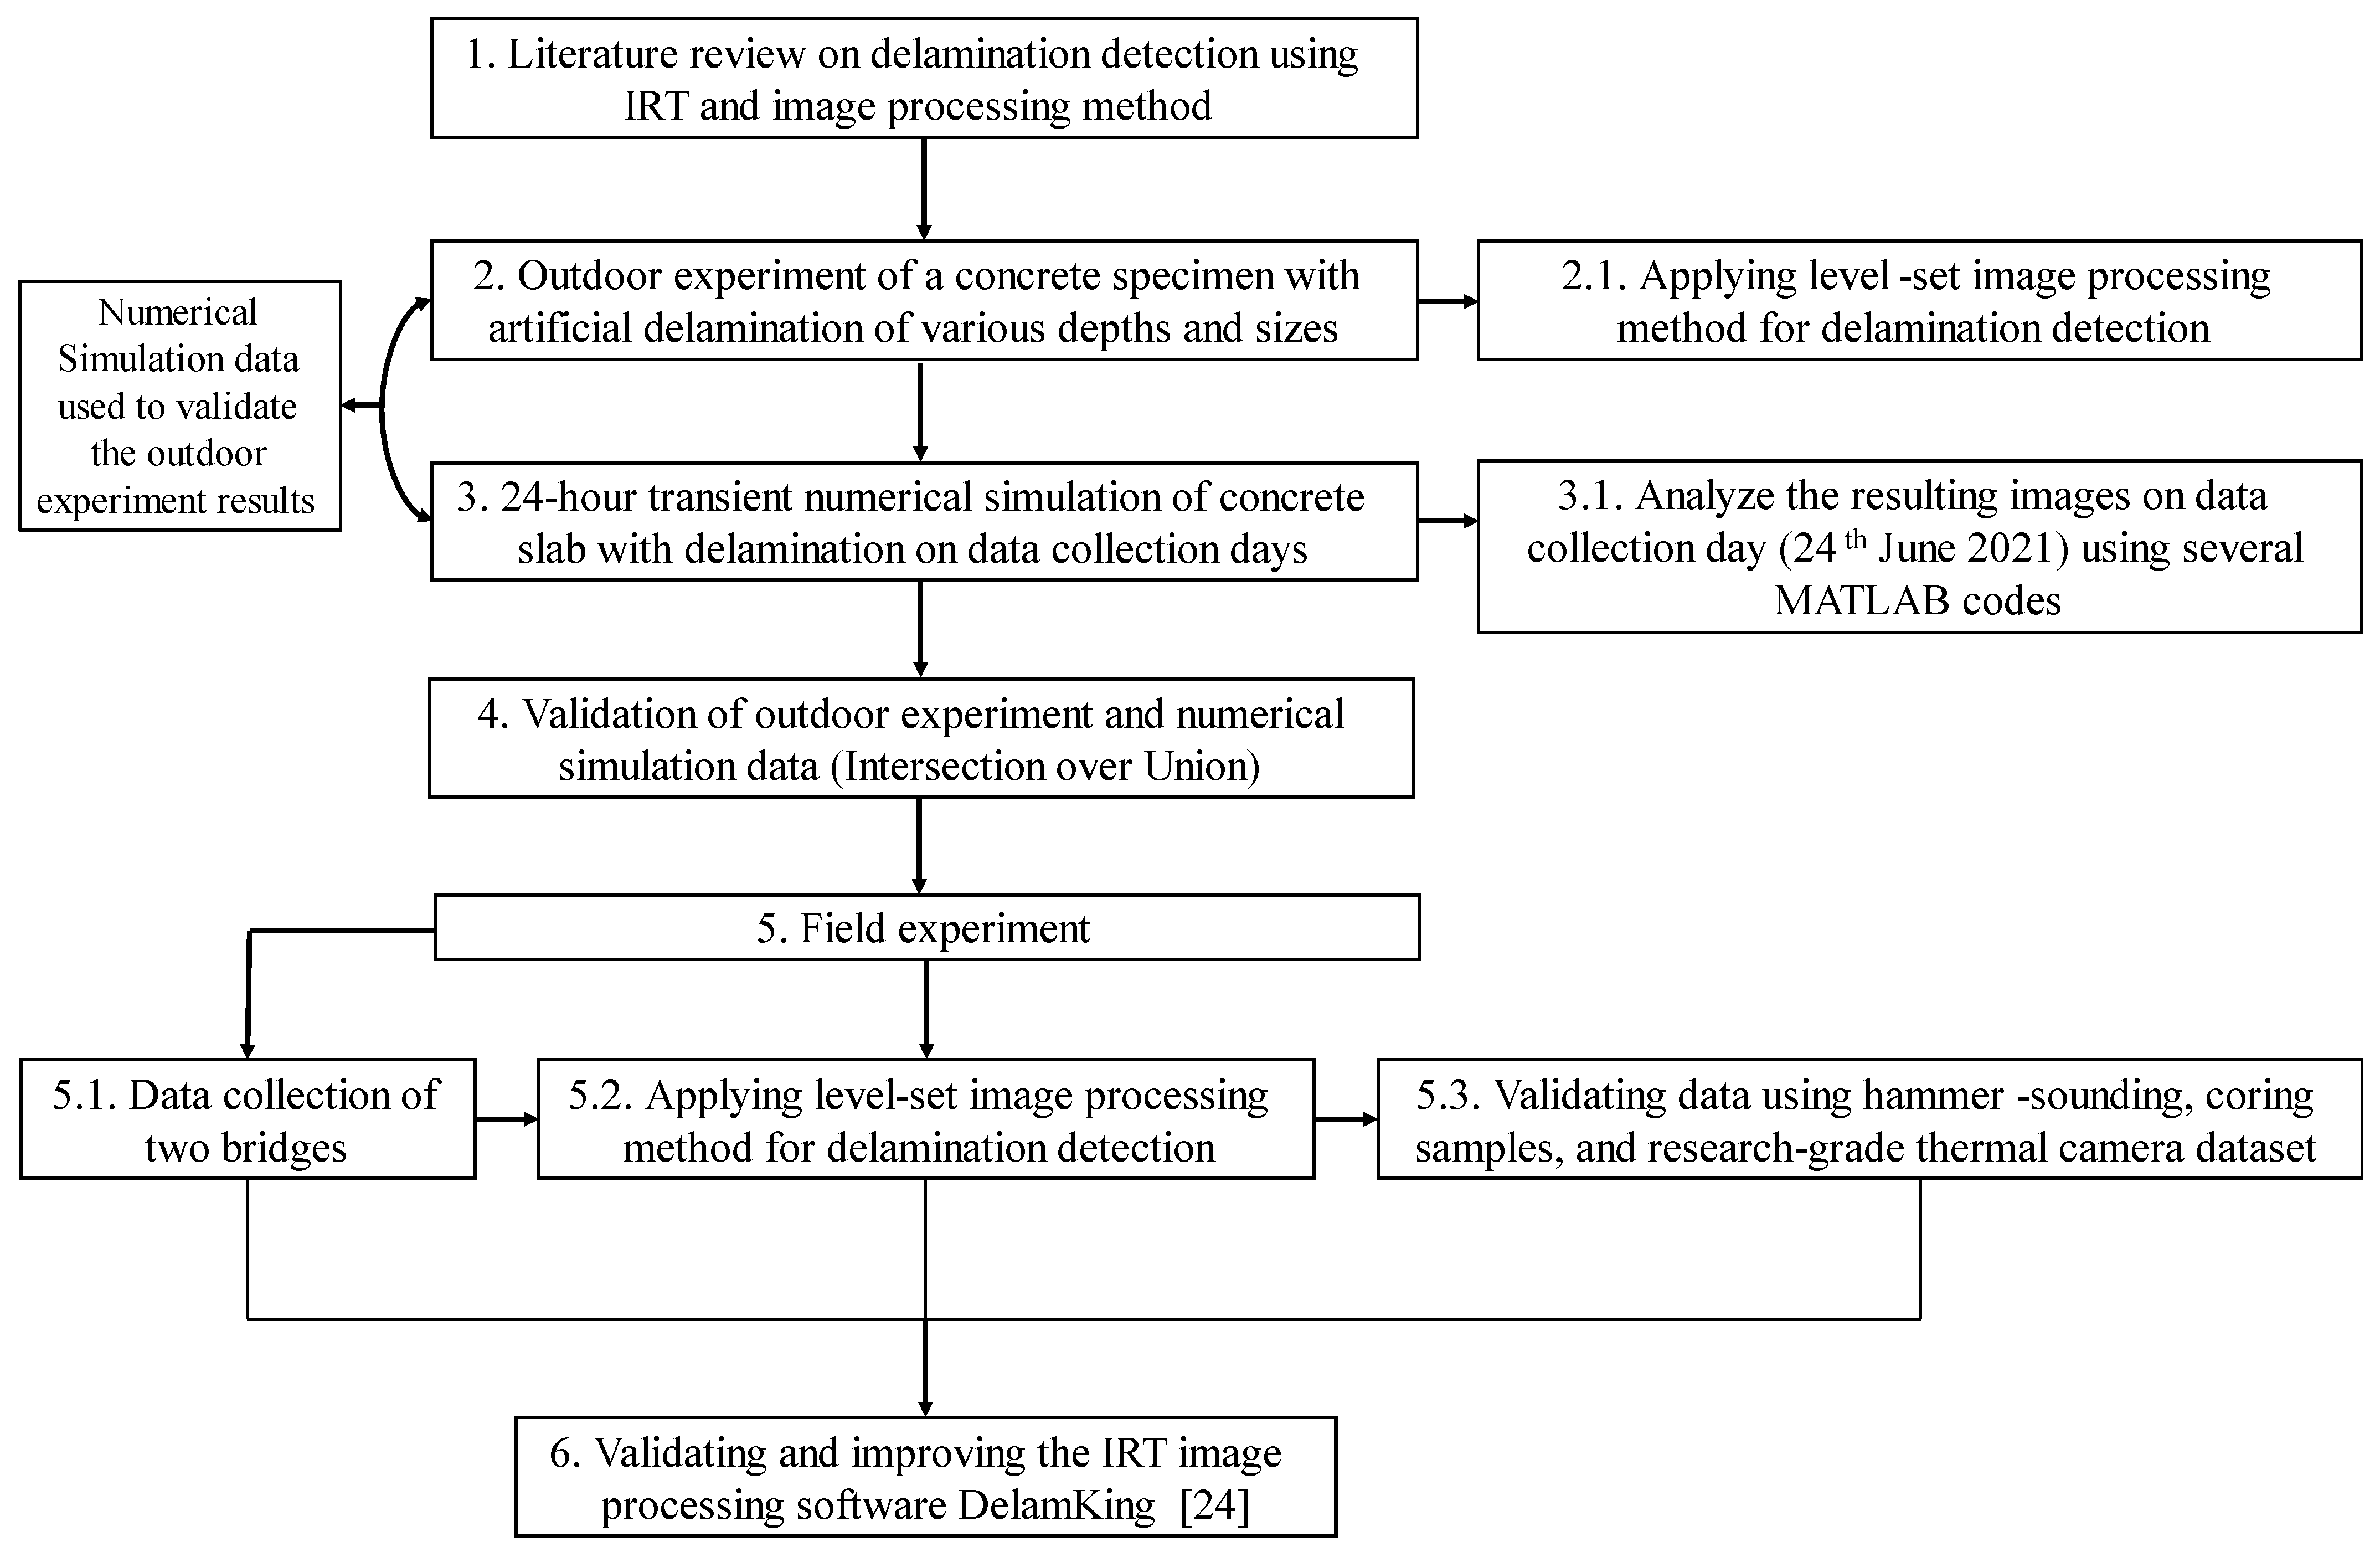
3.1. Research Framework

To complete the research, a framework was adopted, as shown in Figure 1. First, a literature review covering the state-of-the-art methods of thermal image processing with the goal of delamination detection in concrete bridge decks was developed. Then, a mockup slab with mimicked delamination [15] was used for preliminary data collection and analysis. The purpose is that, since the location of delamination within the slab is already known, it would provide a reference for the level-set method accuracy. The data was collected using a UAV on a sunny day between the period of 2:30 p.m. to 5:30 p.m. on the 24 June 2021. The data collection time of a summer afternoon was selected based on the time window recommended in [5]. Intersection over union (IoU), which is discussed in Section 3.6, was utilized to provide a quantitative comparison between detected delamination and the known ground truth location. This is to identify the accuracy of detection acquired using an uncooled consumer-grade thermal camera combined with the level-set method for image analysis.
Next, a numerical transient simulation of 24 h was performed using Autodesk CFD 2021, so as to provide a theoretical basis for the maximum detectability under noise-free conditions and as another means of validating the outdoor experiment results. Then, the data from the mockup slab and simulation were analyzed using IoU (Section 3.6) to compare with the known delamination location as validation of the collected and simulated data, as shown in Step 4.
In addition, data were collected for two in-service bridge decks in Delaware and Nebraska and analyzed using the same method applied in the preliminary test. A consumer-grade thermal camera (DJI Zenmuse XT) was used for data collection in Delaware. In contrast, both consumer-grade (DJI Zenmuse XT) and research-grade (FLIR A8300sc) thermal cameras were used in Nebraska (Table 1). As for the real bridge inspection, hammer-sounding was used for validating IRT results for the Delaware bridge case. Due to the limited resources, the authors did not proceed with further validation through other evaluation methods. For the Nebraska bridge, hammer-sounding and core sampling were used for the validation analysis results. The coring samples were considered as the ground truth as they were more reliable than the hammer-sounding results. For the Nebraska bridge case, a research-grade camera was also used to collect thermal data. Thus, the performance of the consumer-grade infrared camera could be benchmarked by the performance of the research-grade infrared sensor through the same case study. IoU (Section 3.6) was applied to provide a quantitative metric for measuring both thermal cameras’ performance. In this way, the authors were able to assess whether the accuracy of consumer-grade thermal cameras is comparable to that of research thermal cameras.
For the purpose of simplification of collected data, Table 2 summarizes the validation method used for each dataset in this study.

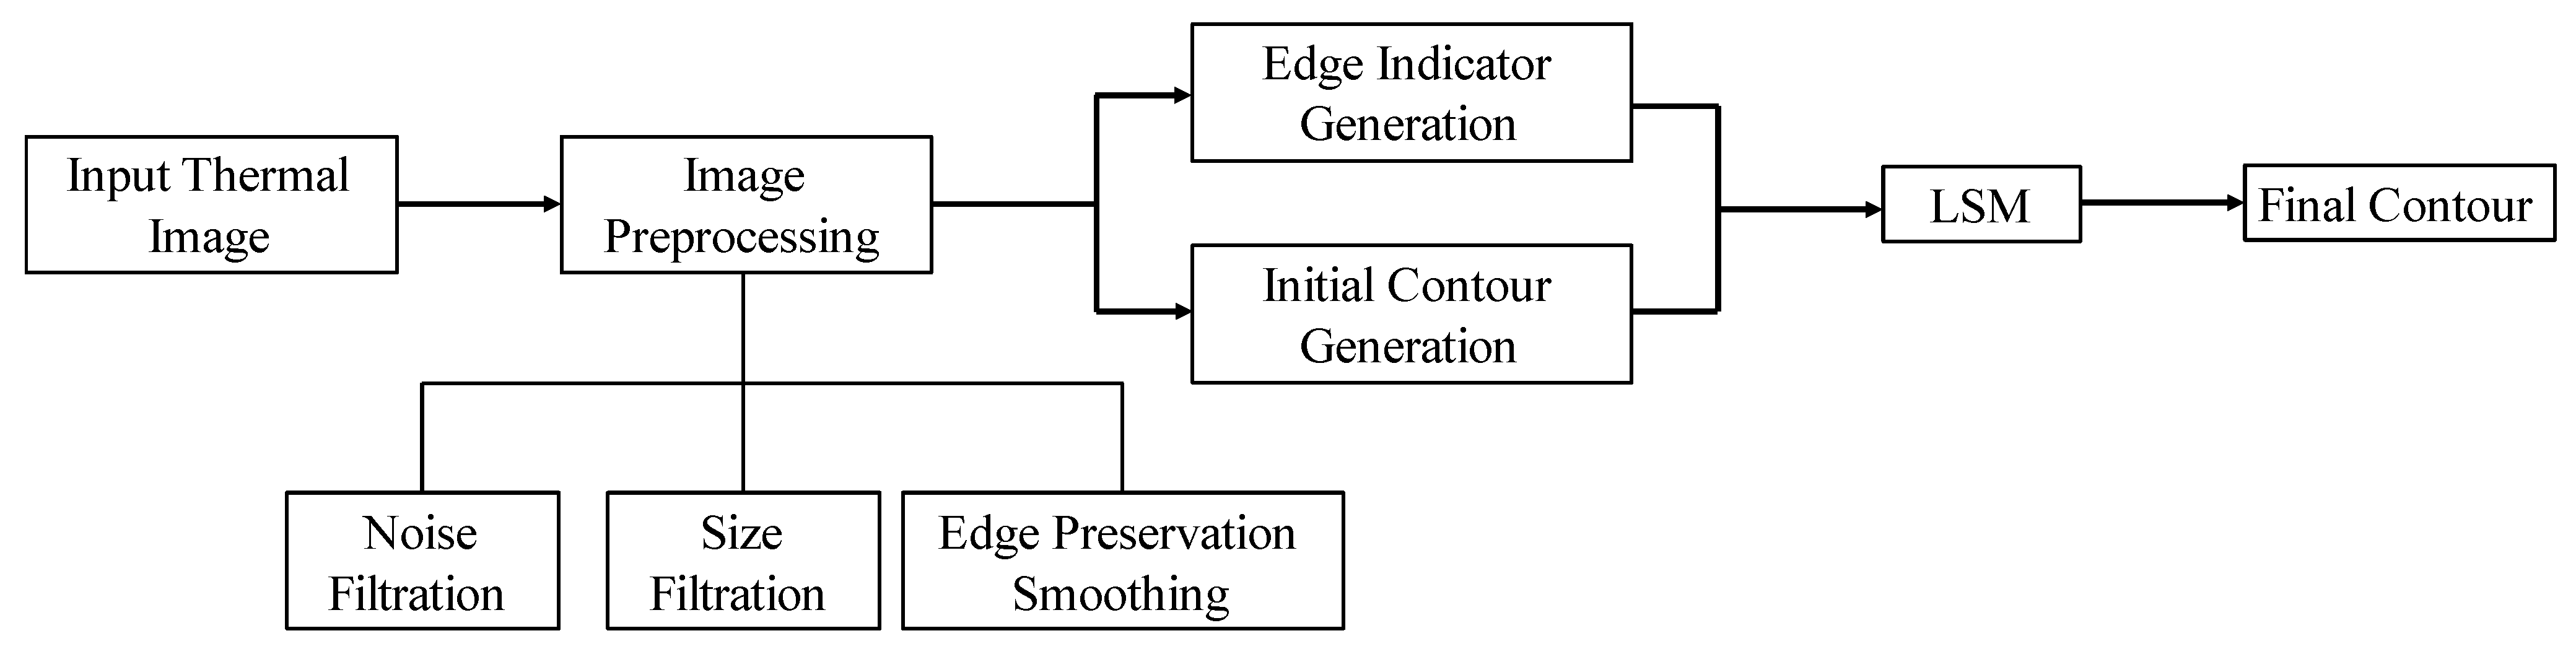
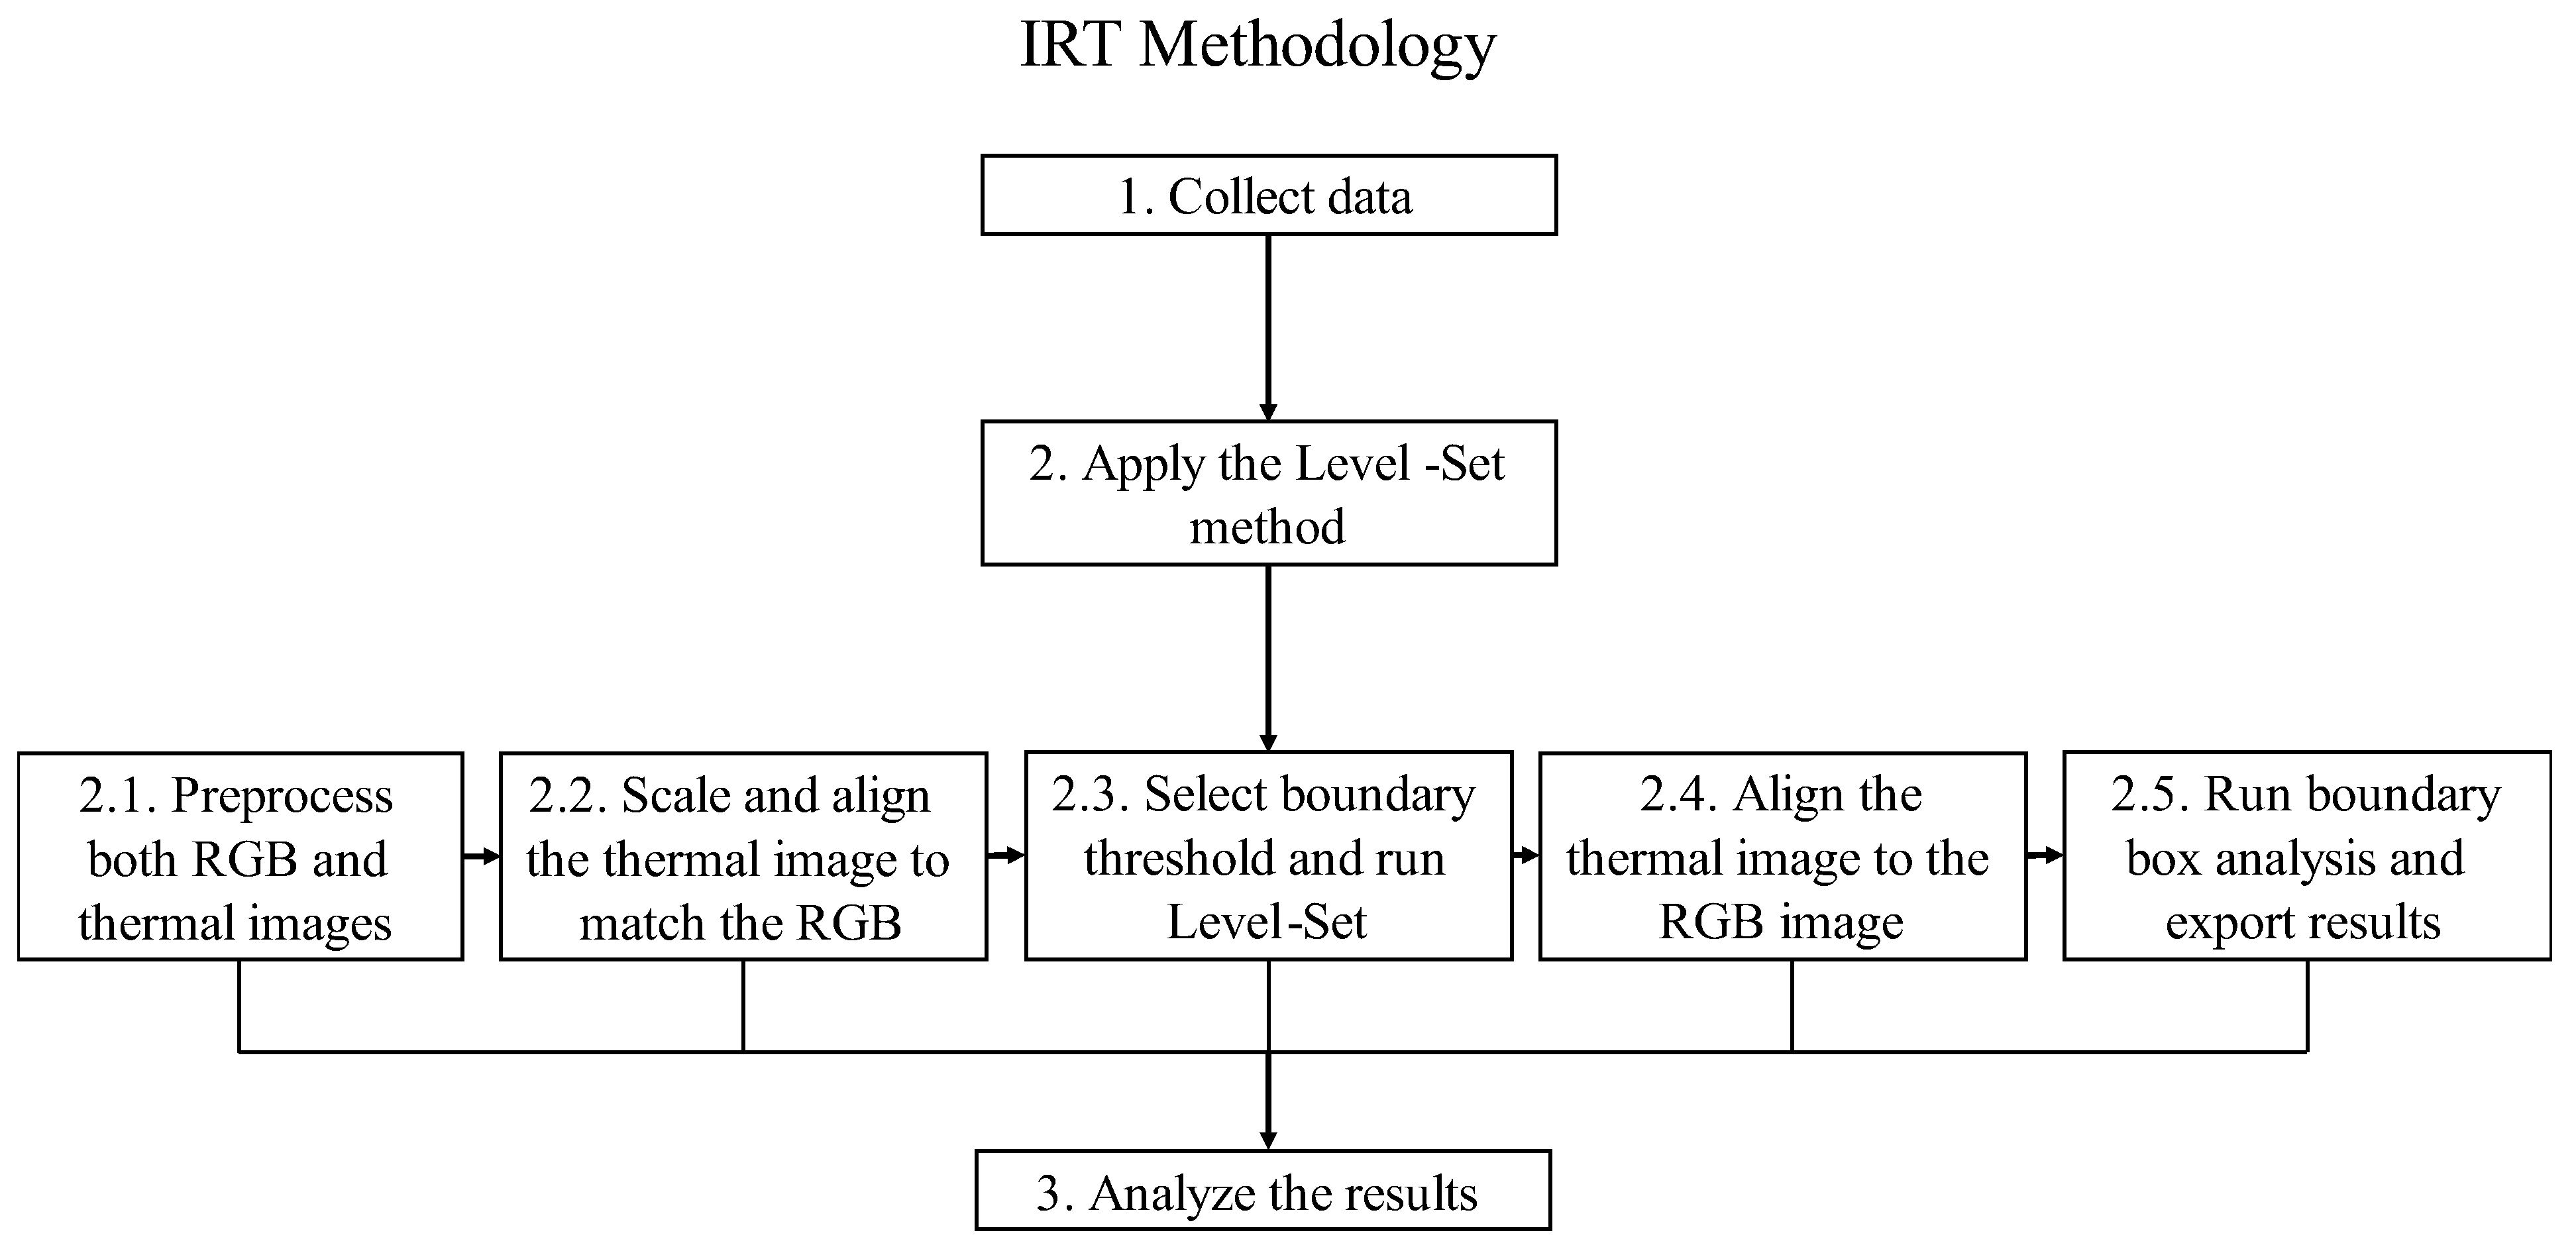
3.2. Level-Set Method (LSM)

The collected data for both the outdoor experiment and bridge were analyzed using DelamKing [60], an image processing software [19,24]. The software was designed for detecting, locating, and quantifying delamination in concrete bridge decks and was developed based on the level-set method. In the case of the outdoor experiment, the size and location of the mimicked delamination are known. Thus, a comparative study between the detection results and the ground truth can be efficiently conducted. In the case of the in-service bridge deck data, both were analyzed in reference to hammer-sounding results. Additionally, coring samples were collected for the Nebraska bridge.
The level-set method was chosen for post-image processing due to its high accuracy and reliability of delamination detection [24]. As shown in Figure 2, the process follows the general framework of first preprocessing the thermal image to filter noise, adjusting the size, and edge-preserving smoothing. Then, the normalized gradient map and the initial contour generation module are generated using the edge indicator generation module to have the initial level set function. Finally, iterations are used to update the level-set function using the edge indicator function to upgrade the initial contour following the PDE-based GAC model [24]. The purpose behind preprocessing the image was to provide better and more accurate results. Thus, a difference image was used to remove outliers which were then replaced by the nearest neighbor. Then, after all the necessary steps were taken, a few evaluation metrics, such as the intersection over union (IoU), were used to determine the accuracy of delamination detection that the level-set method offered [24]. Figure 3 shows the framework applied for collecting and analyzing the data. The outdoor experiment and the in-service bridge decks followed the same methodology and data analysis steps.

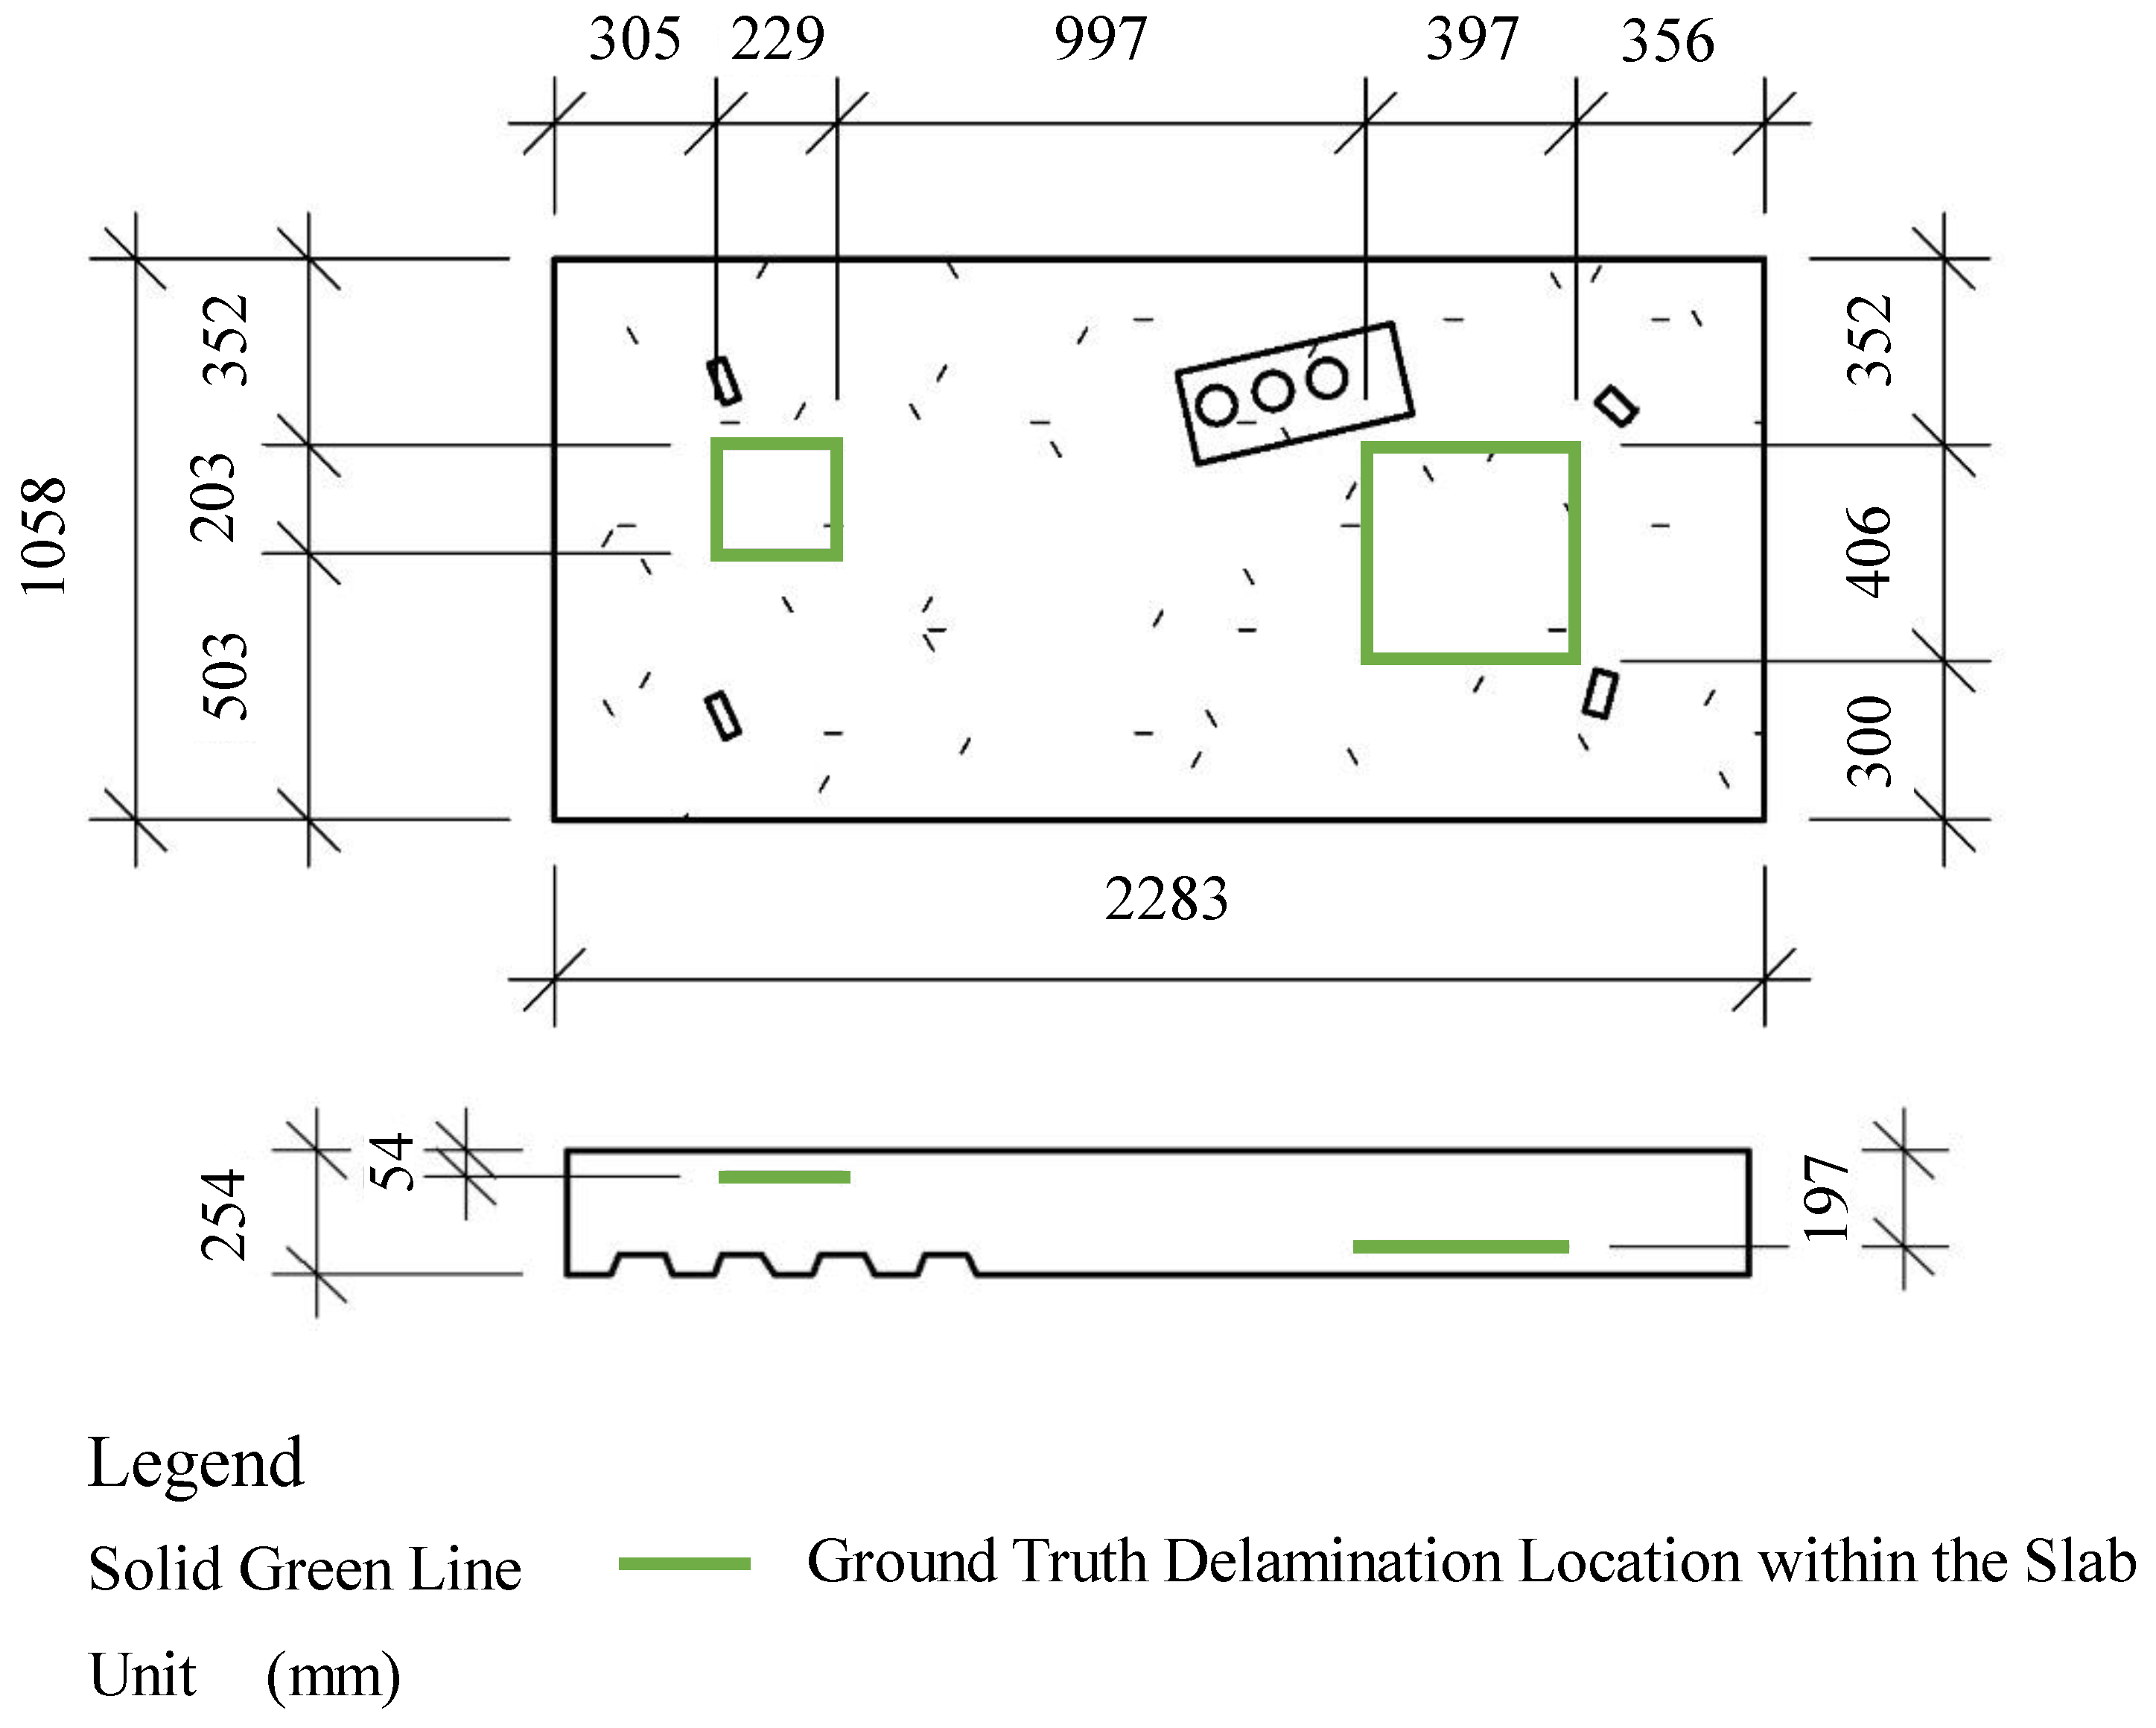
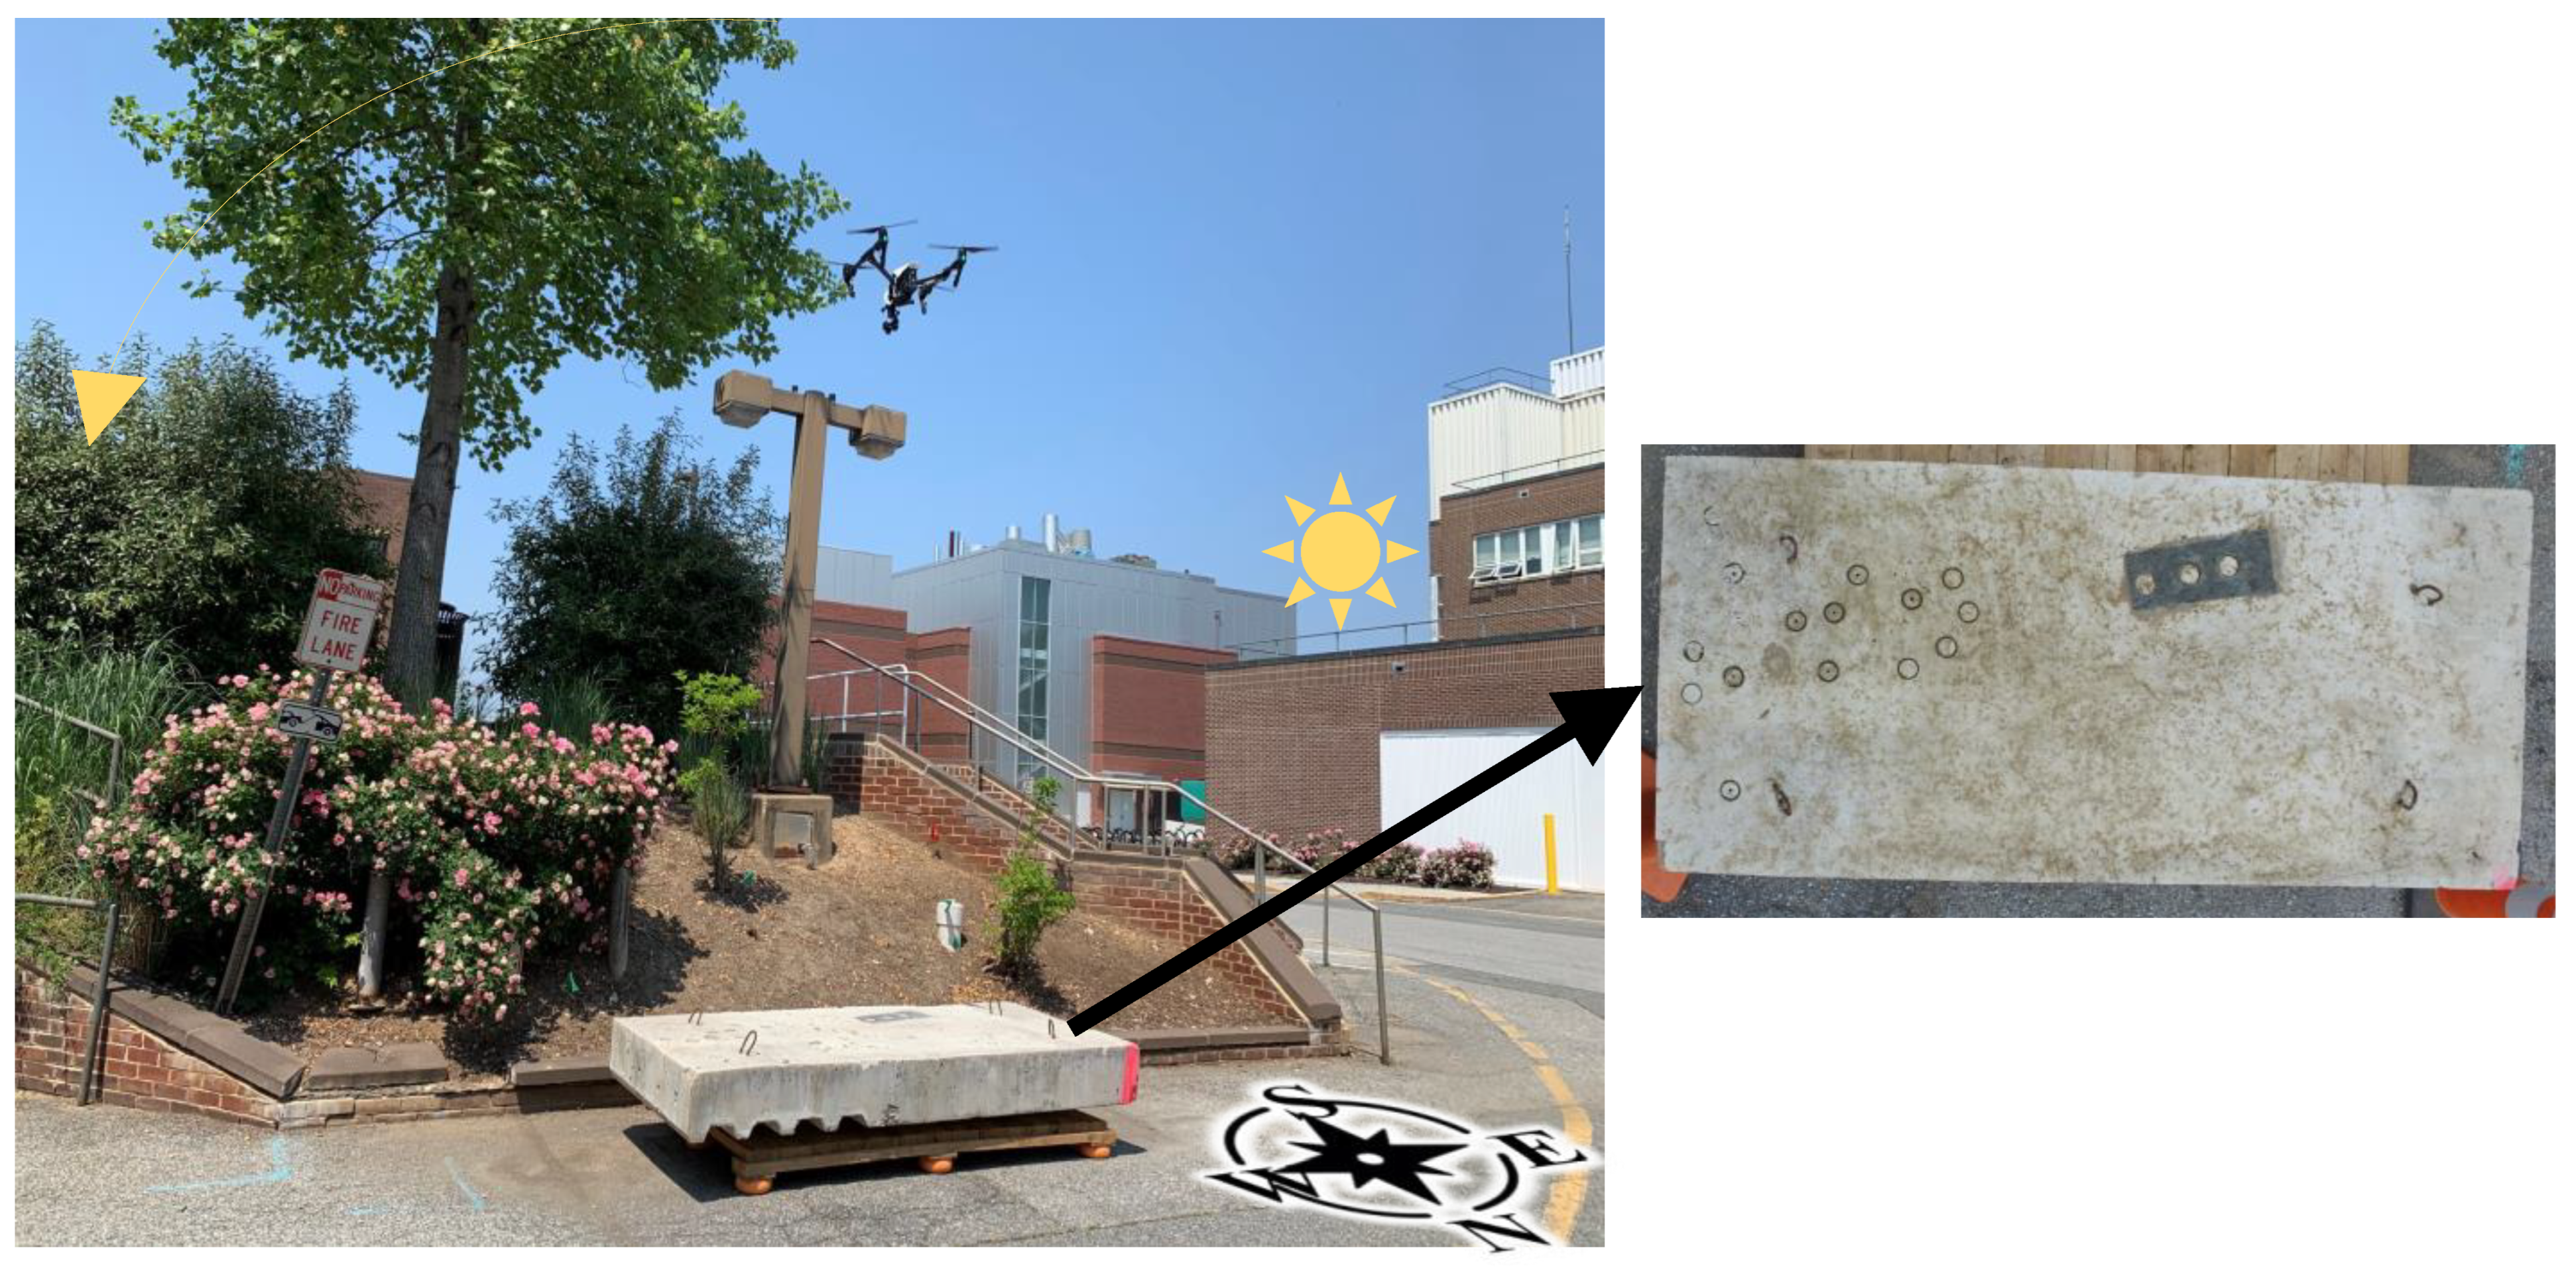
3.3. Experimental Validations of the Mimicked Slab (Outdoor Experiment)

The slab used for the outdoor experiment is a reinforced concrete specimen used in [15]. The slab is a bridge deck specimen with multiple artificial delamination areas that was designed as a normal-weight concrete specimen with a compressive strength of 34.5 MPa. Furthermore, its dimensions are shown in Figure 4. In addition, according to the original research, the slab has two mimicked delamination areas, including a shallow one that is 54 mm (2.13 inches) from the top surface, which is the targeted detection area and is plastic and hollow. Then, the second one is at a depth of 197 mm (7.76 inches) and is plastic and solid.
Figure 5 shows the slab while collecting the data with the sun’s orientation throughout the day (sunrise to sunset). The thermal and RGB pictures of the slab top were collected using a DJI Inspire 1 drone [61] with a FLIR Zenmuse XT camera [62] and Zenmuse X3 camera [63], respectively. The utilized equipment is compared to the equipment used in [16], which included a DJI M600 Pro drone [64], FLIR A8300 camera [65], and Zenmuse X5 camera [66]. Table 1 shows the specifications for the thermal camera; Table 3 shows the RGB cameras’ specifications, while Table 4 shows the drones’ specifications.
The data was collected on the 24 June 2021, a clear summer day, within the time frame of 2:30–5:30 p.m., where each picture was taken at 30 min intervals. A sunny day was picked to provide images with minimal interference from environmental factors such as clouds and rain. The data collection period was selected based on conclusions of previous research that the afternoon period provides the best detectability accuracy [19,24,36]. Furthermore, the camera was set in high gain mode, as this mode has a more effective detection accuracy of thermal contrasts within small ranges [62]. The level-set image analysis results were then compared to the known ground truth location of the delamination through IoU values.

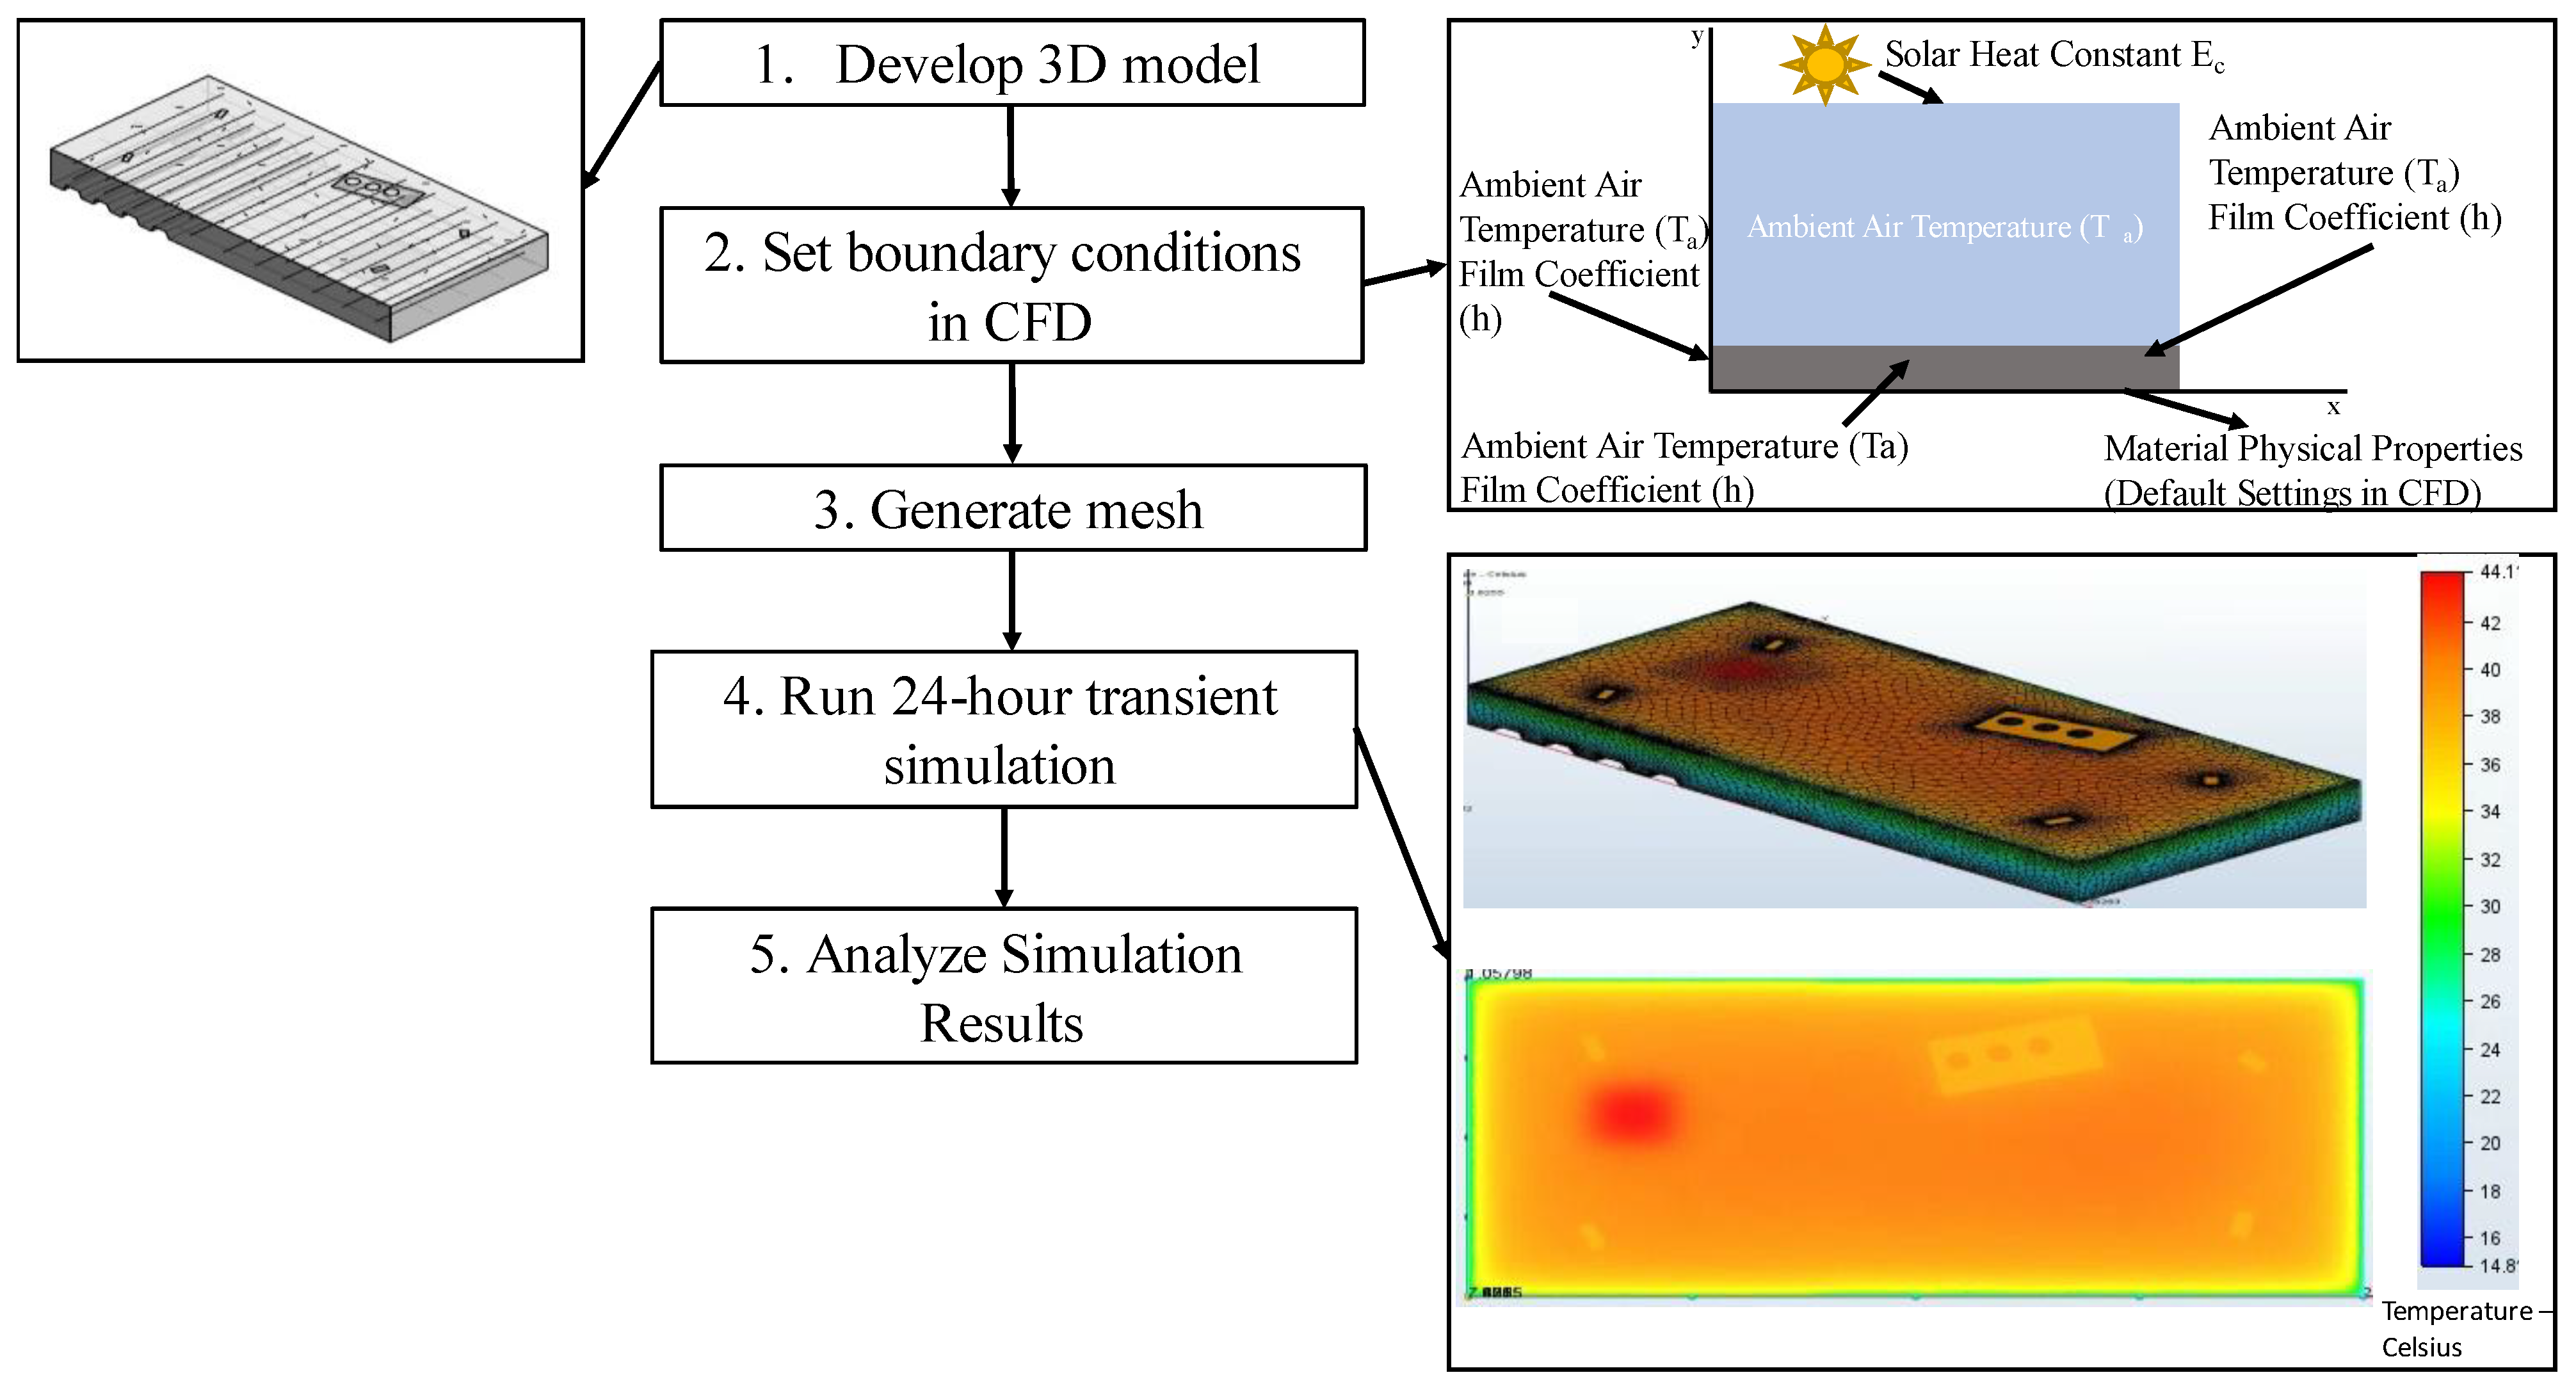
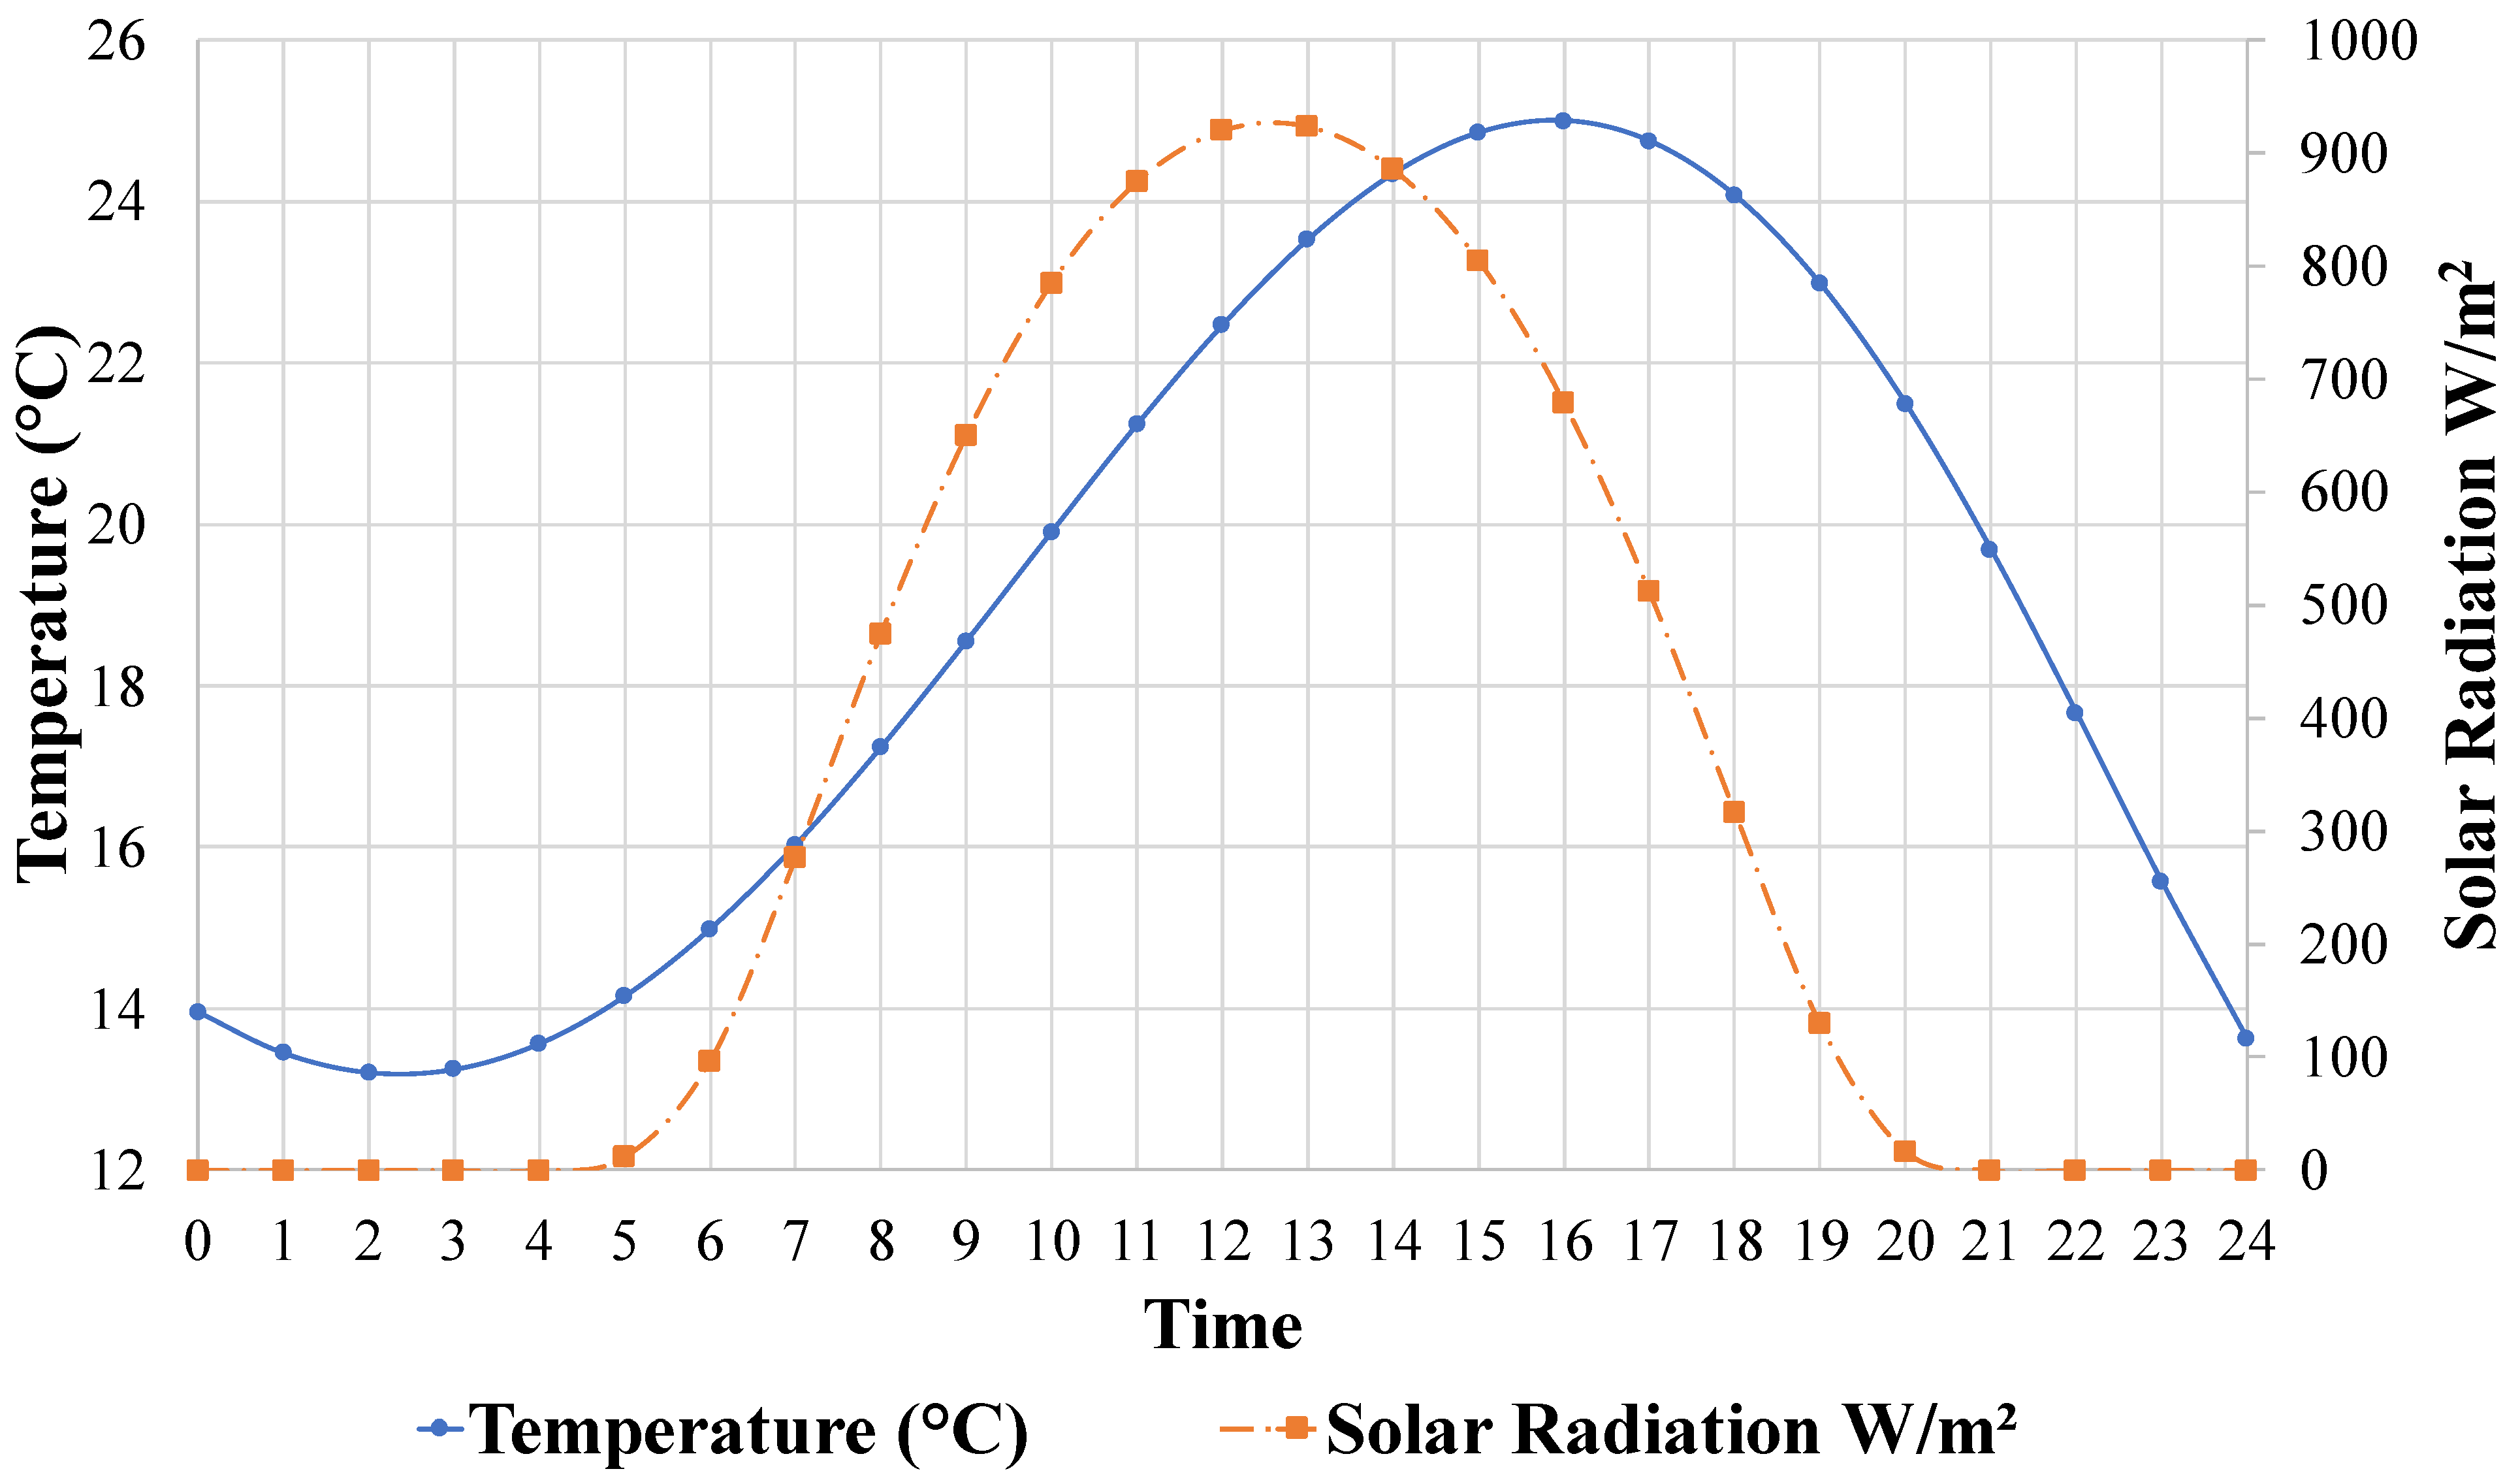
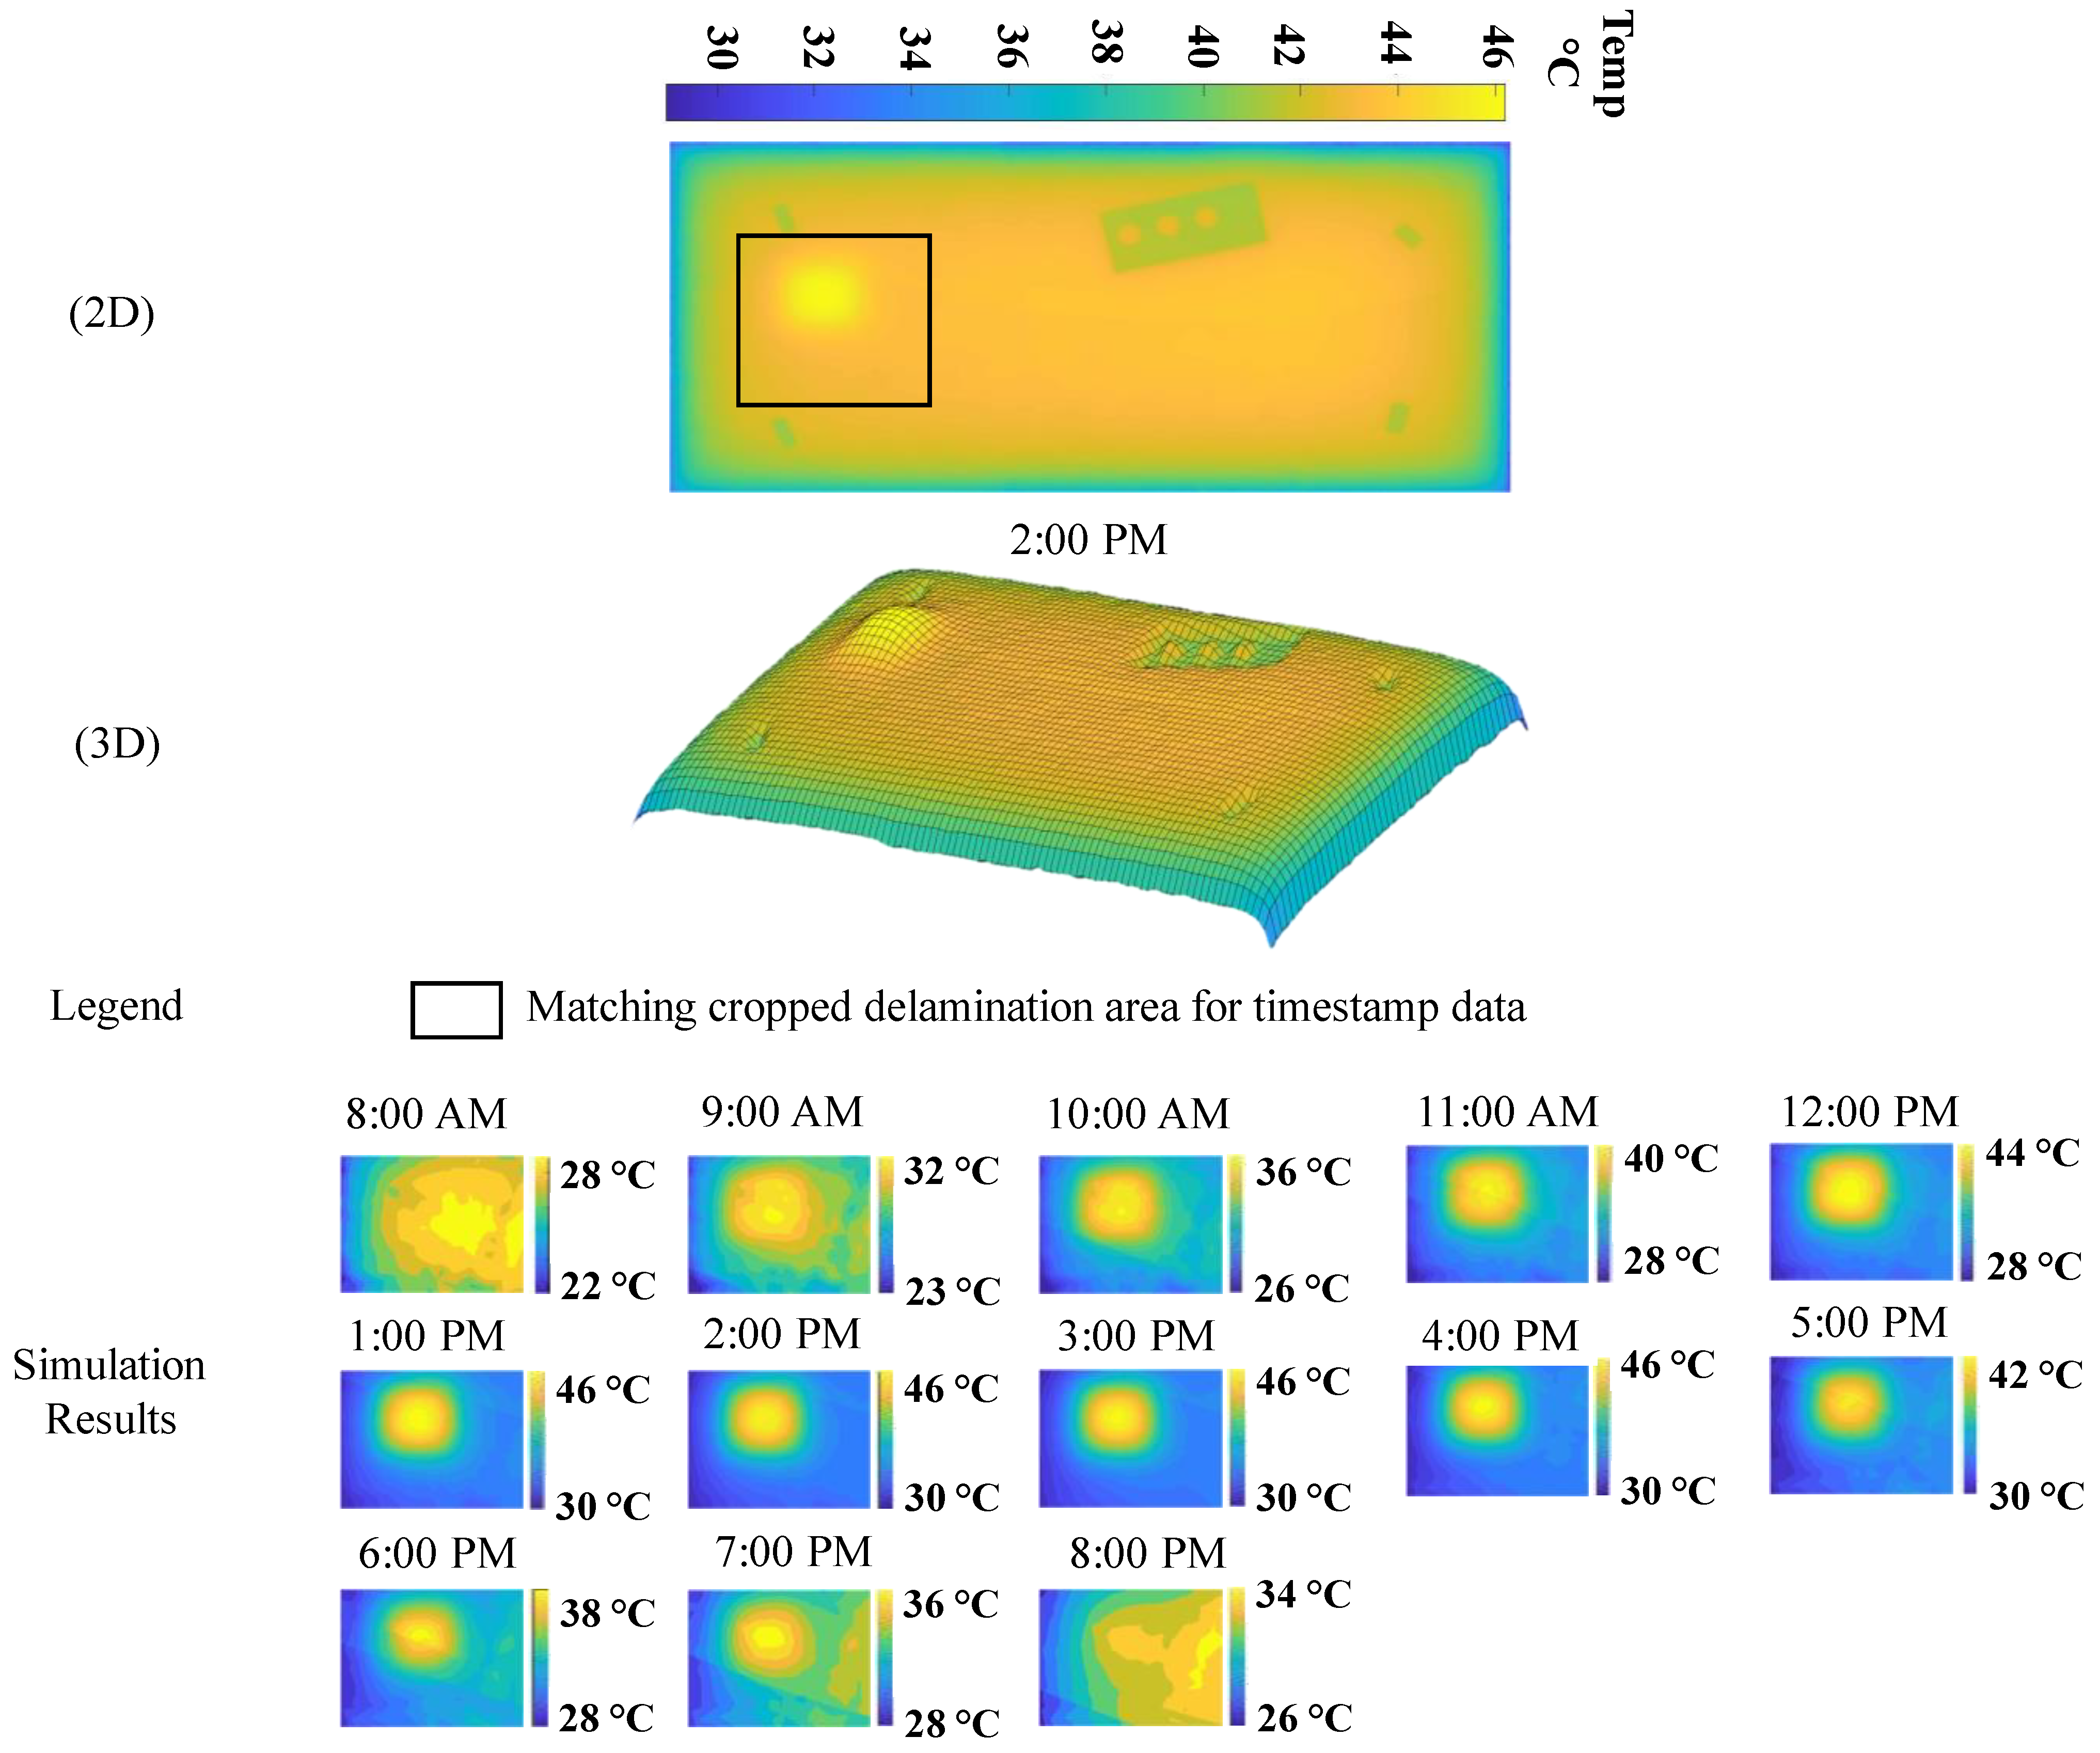
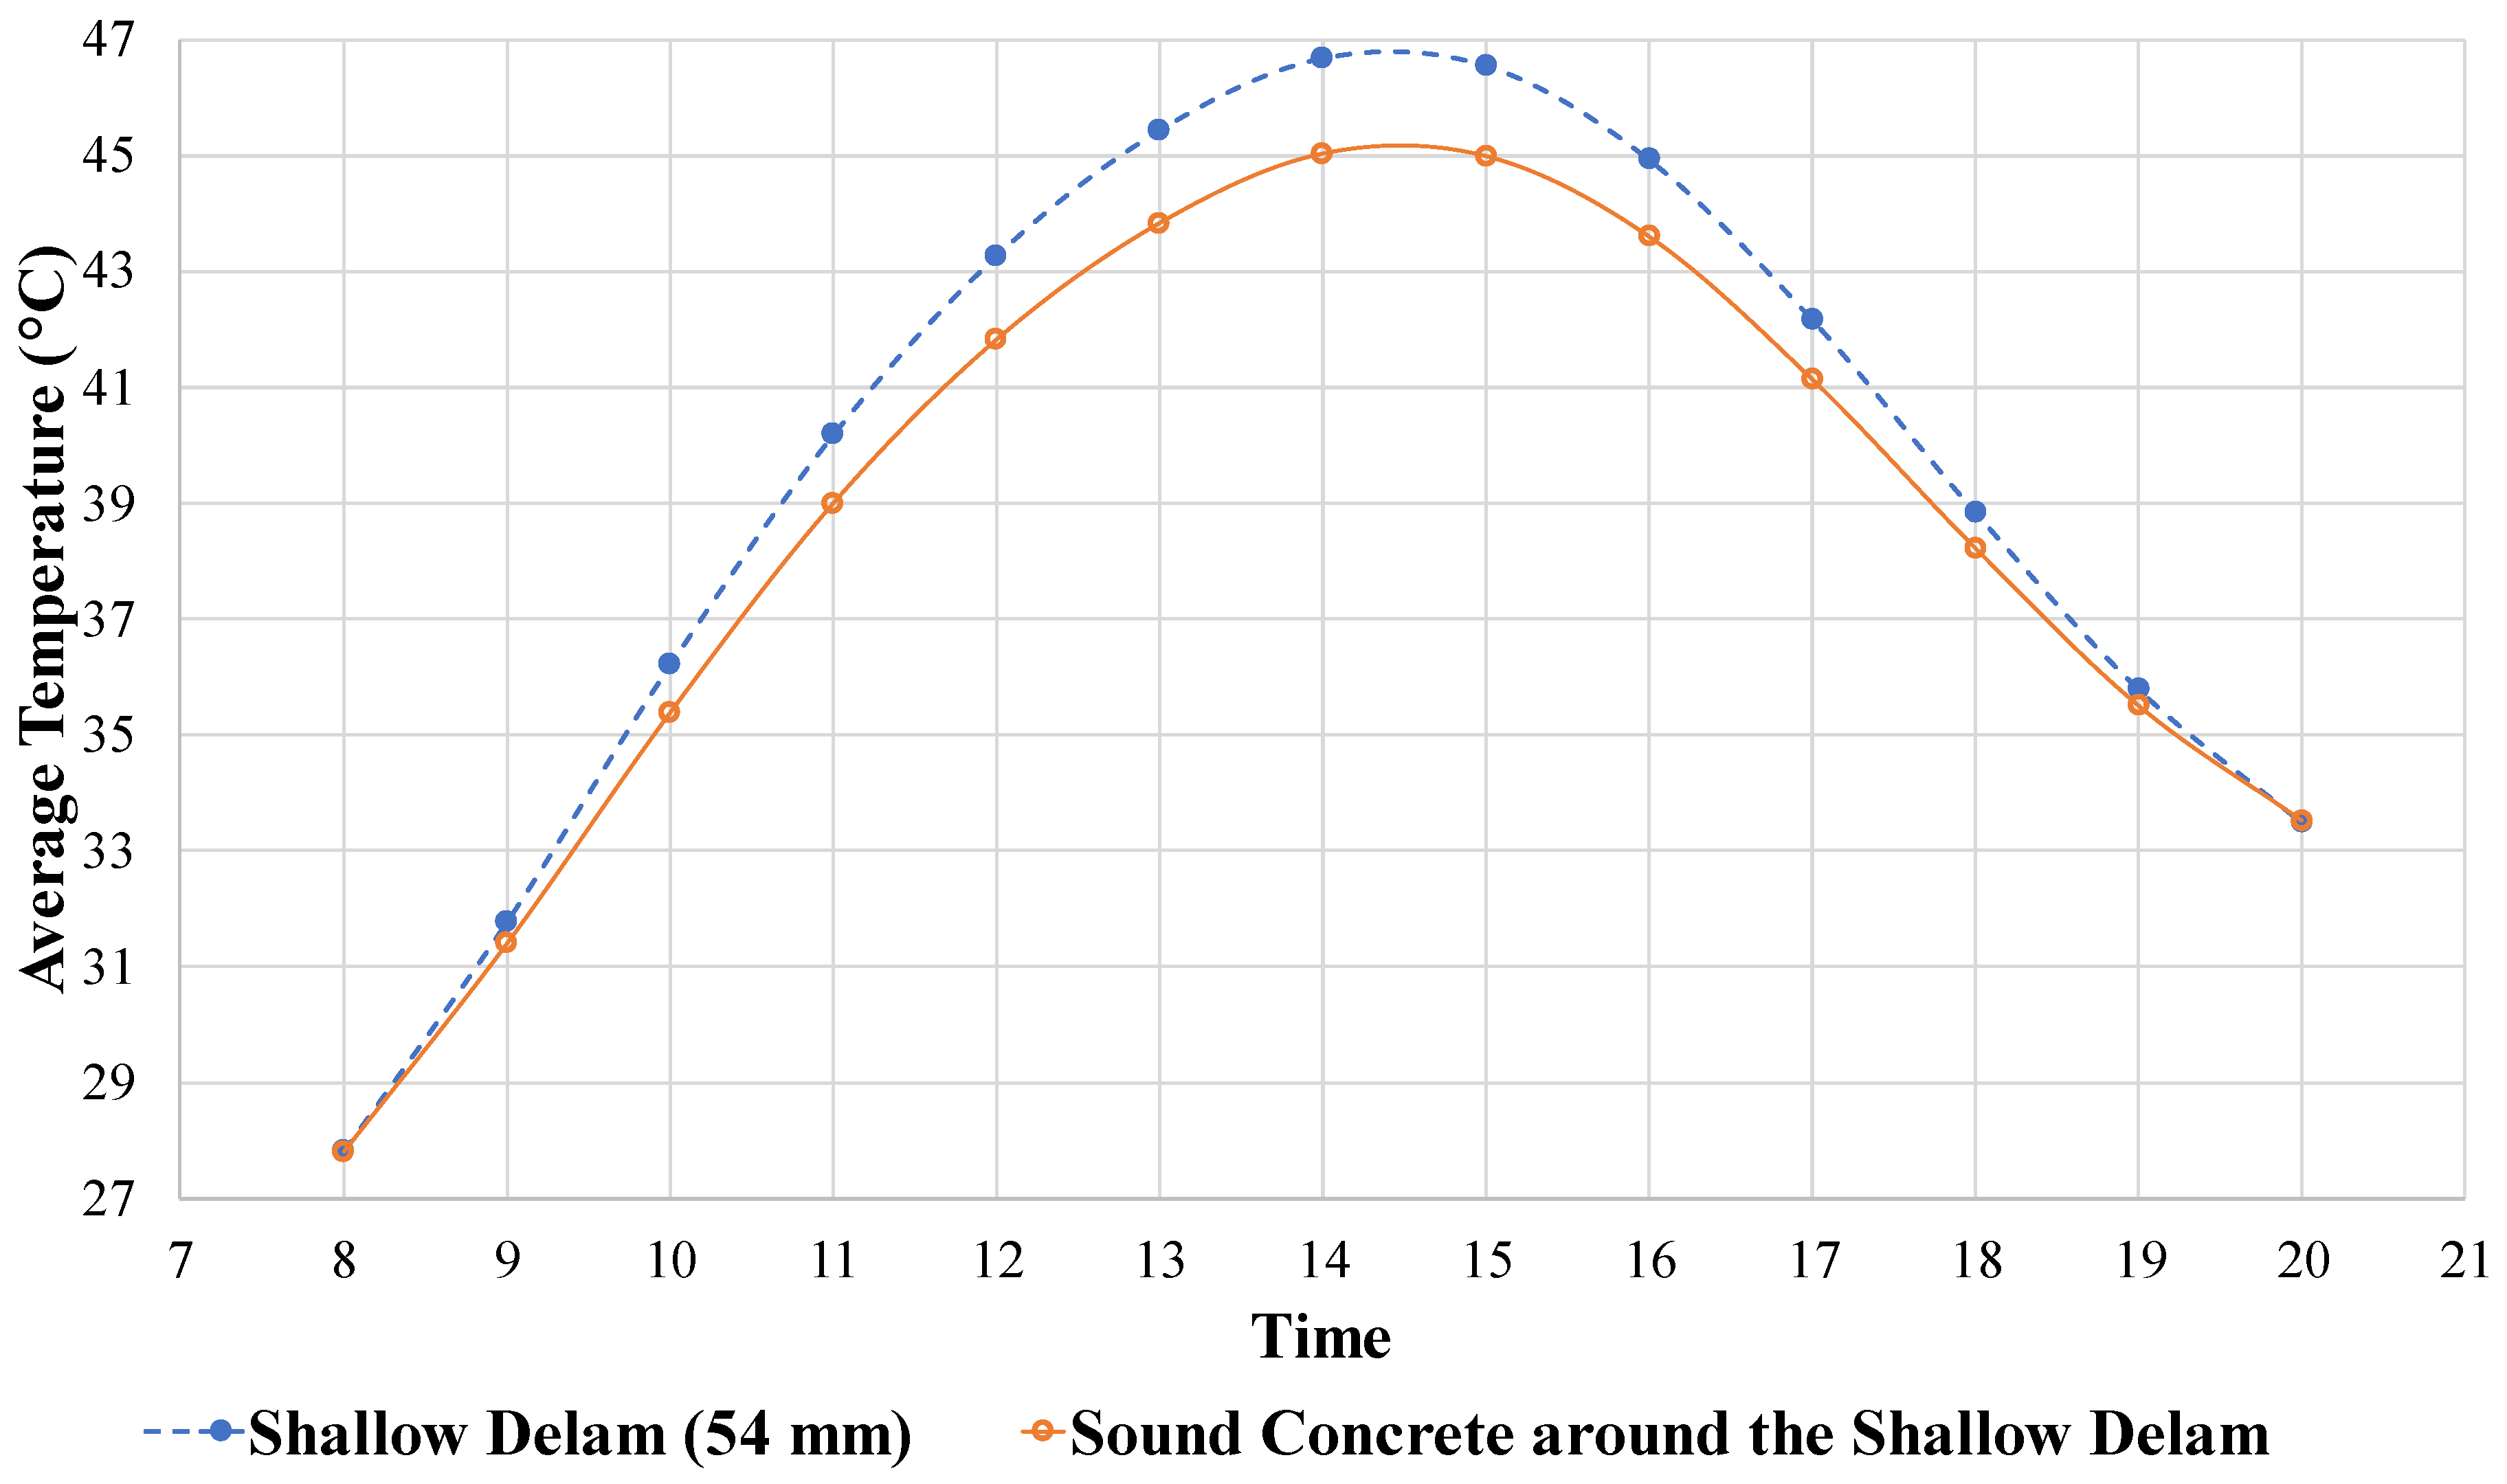
3.4. Numerical Simulation

A transient numerical simulation was conducted on the data collection day for the mimicked slab to evaluate the theoretical highest achievable detection accuracy during the day within the study region (Newark, Delaware) under ideal conditions as a supplement to the field dataset. The numerical simulation provides a dataset with minimal noise, unlike field data, as it is not affected by wind, shade, or other possible errors arising during field data collection [19,36]. The numerical simulation results will be analyzed in reference to the collected data for the slab on the same date, the 24 June 2021. The analysis was conducted to compare and validate the results from the outdoor experiment.
Figure 6 summarizes the steps followed for developing the numerical simulation. A virtual model of the slab and mock delamination placed within it were modeled using Autodesk Revit 2021. The model was then imported to Autodesk CFD 2021, where the materials and boundary conditions were set up to represent real-life conditions most closely, as shown in Table 5. The model requires the assignment of both emissivity and transmissivity values, which all were assumed to be the default values assigned by Autodesk CFD 2021.
In a study by Hiasa, Birgul, Matsumoto, and Catbas, they applied a similar concept of developing a finite element model simulation for detecting favorable time windows for delamination detection [35]. In their simulations, the ambient temperature was given a specific value, and the simulation was assumed to be in a steady state. As opposed to the steady-state simulations, a 24-h transient model was developed in this study. The selection of a transient simulation was to provide more accurate simulations of realistic conditions considering the dynamic change of the environment, thus giving more accurate results compared to field data. The hourly temperature and solar radiance data were retrieved from the Delaware Environmental Observing System database [67] and are shown in Figure 7. The simulation was conducted for a period of 24 h with a time step size of 60 s and ten iterations within each time step. Additionally, a surface mesh was assigned and refined in Autodesk CFD 2021, which applies a pyramidal mesh. This resulted in a mesh with a total of 208,409 nodes. This was determined to be a sufficient number of nodes, as a mesh sensitivity was conducted compared to the model with 10,000 and 100,000 nodes [36]. It was found that there were negligible differences in results when the number of nodes was changed, thus concluding that the generated mesh is of acceptable size.
Then, the slab top temperature data were exported from the simulations to determine the period in which the delamination seemed most visible. A MATLAB script was applied to further process the results of the CFD simulation. The script consists of cropping the thermal image, identifying its color scale, and resetting the temperature range. The script produces images with a temperature gradient showing the contrast between sound areas and delamination areas.
After the images were processed to highlight the contrast in temperatures, the images were processed through another MATLAB code with the purpose of producing a boundary around what was assumed to be the delaminated area based on the simulation results. The boundary was designed to threshold pixels that were lighter in color in contrast to the remaining surface of the slab. Then, a box is placed around the identified delaminated area, and the intersection over union value is calculated in relevance to the ground truth location of delamination, as shown in Figure 4. Finally, to further illustrate the contrast in temperature of the delaminated area compared to the sound areas, the temperature of each pixel across the centerline of the mimicked delamination along the length of the slab was exported. Then, the temperatures of said pixels were plotted in reference to their location on the cross-section of the slab, as well as highlighting the contrast between the delaminated area and the sound areas.

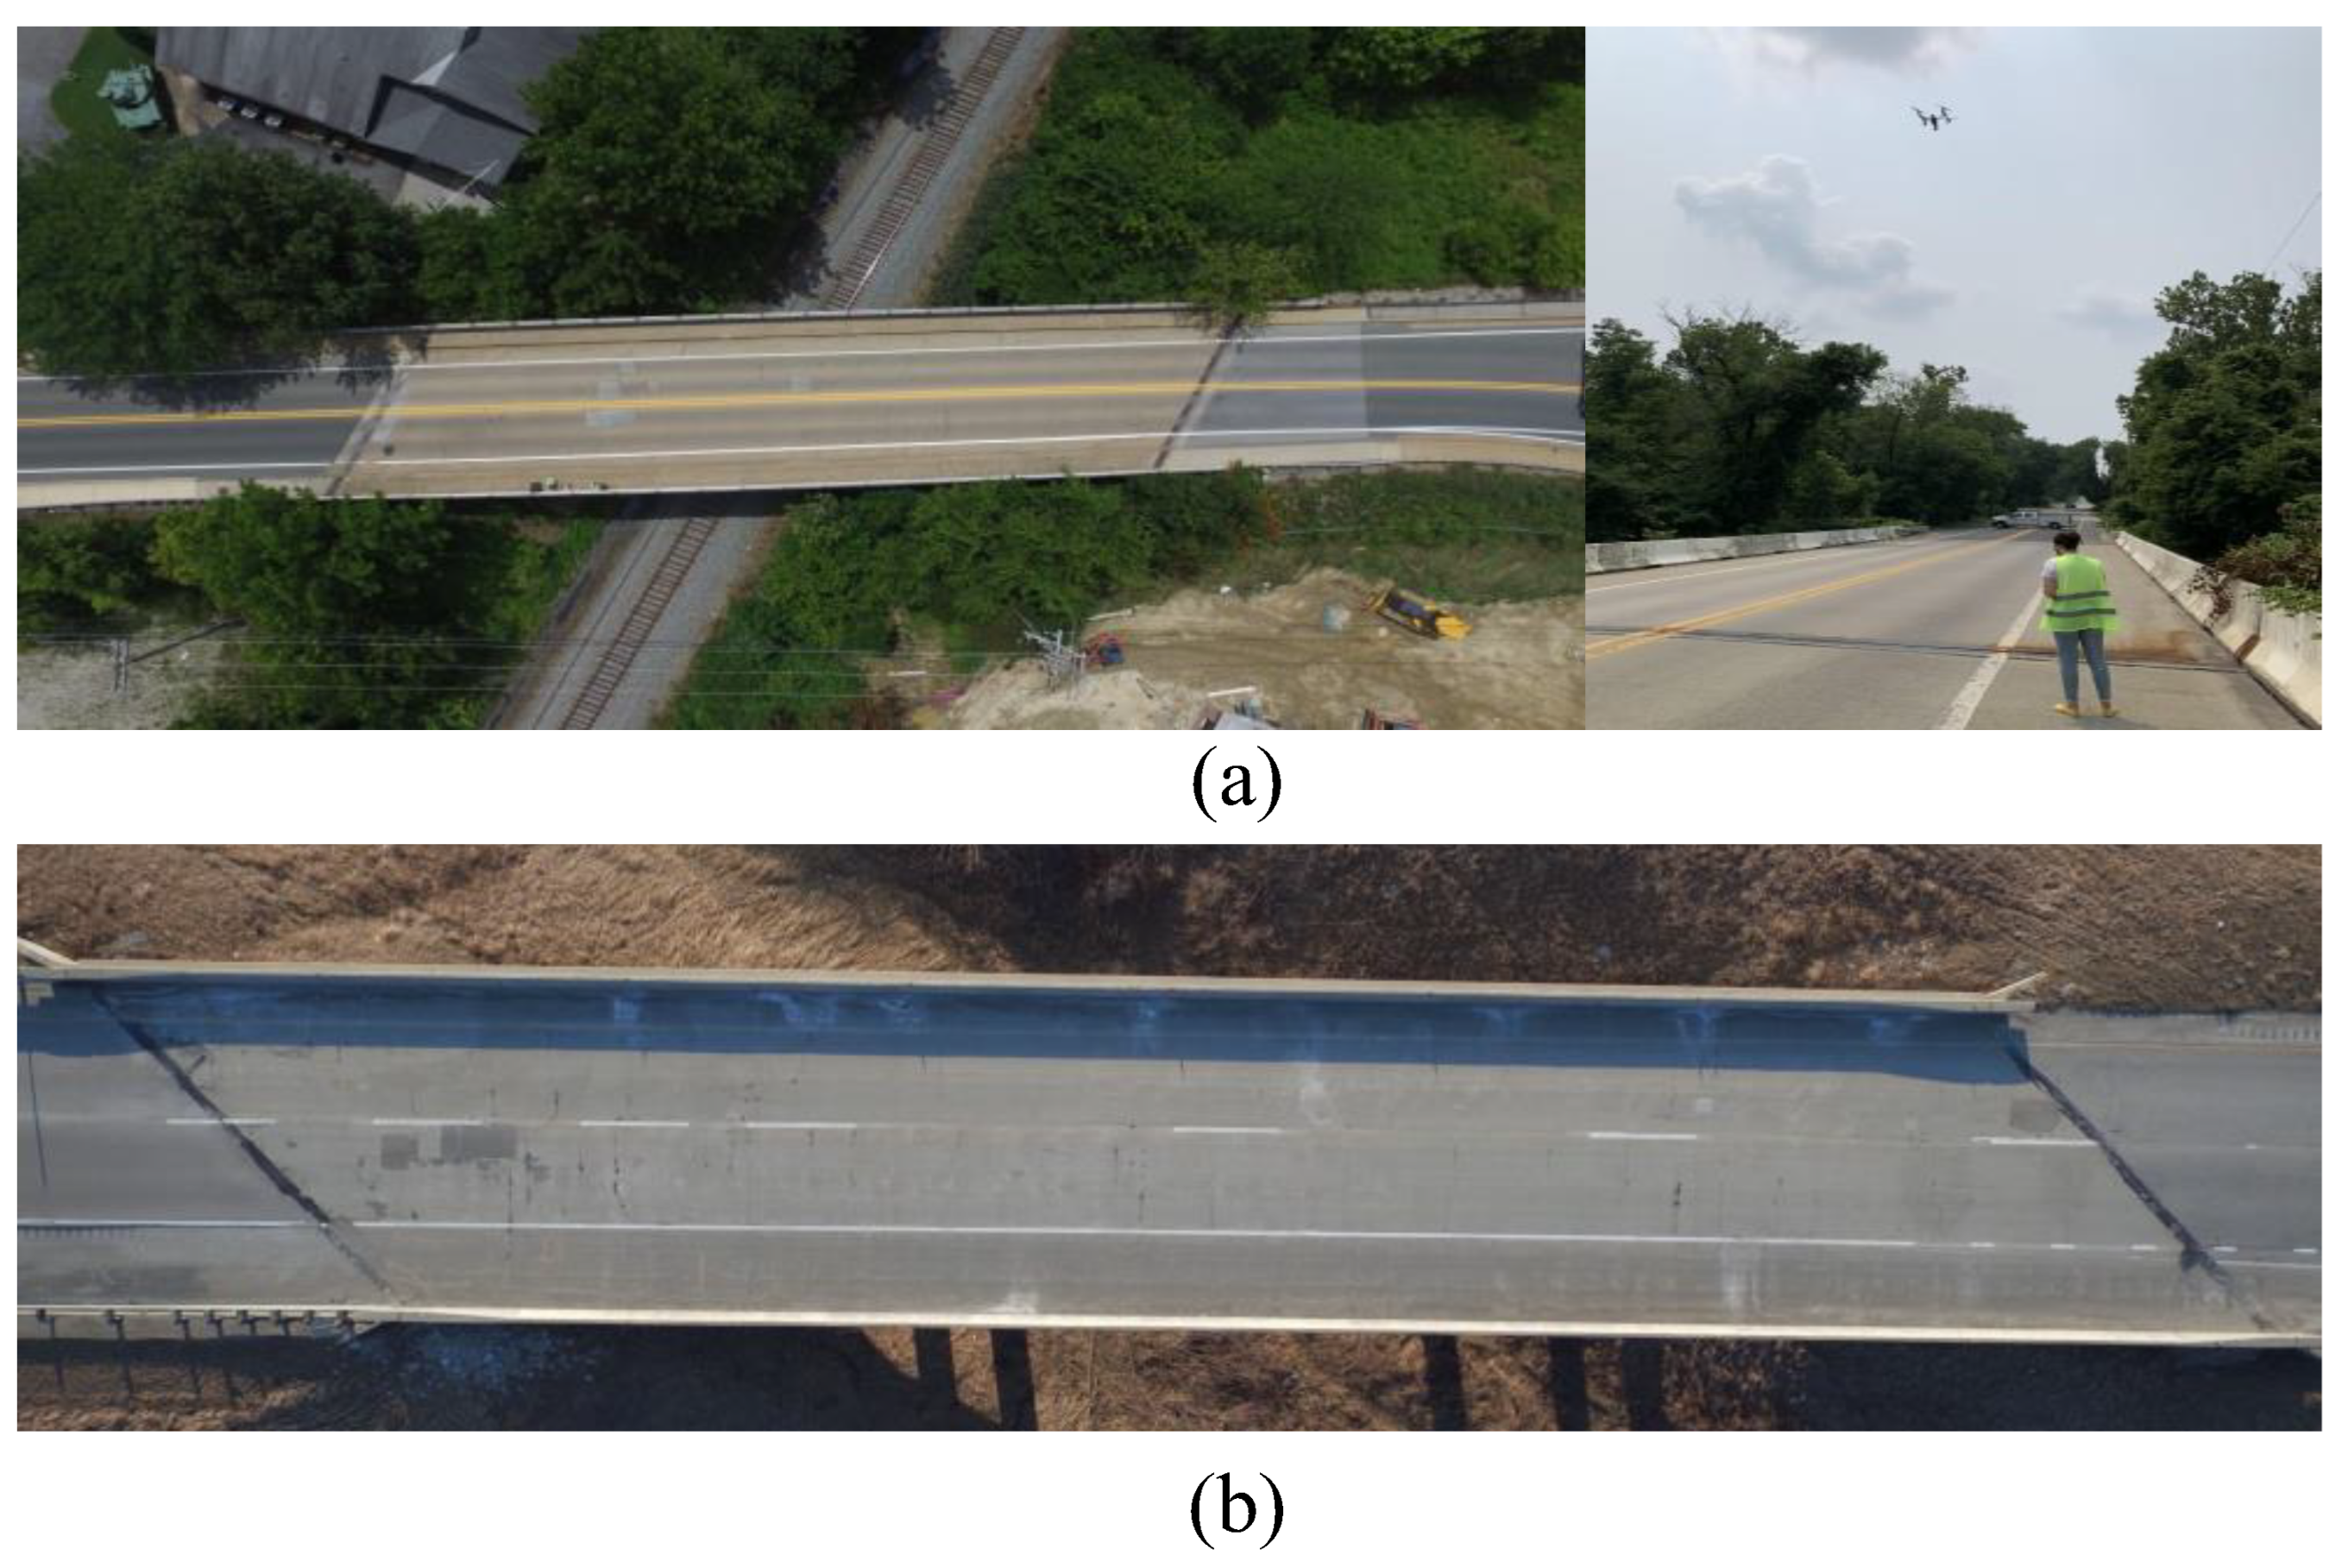
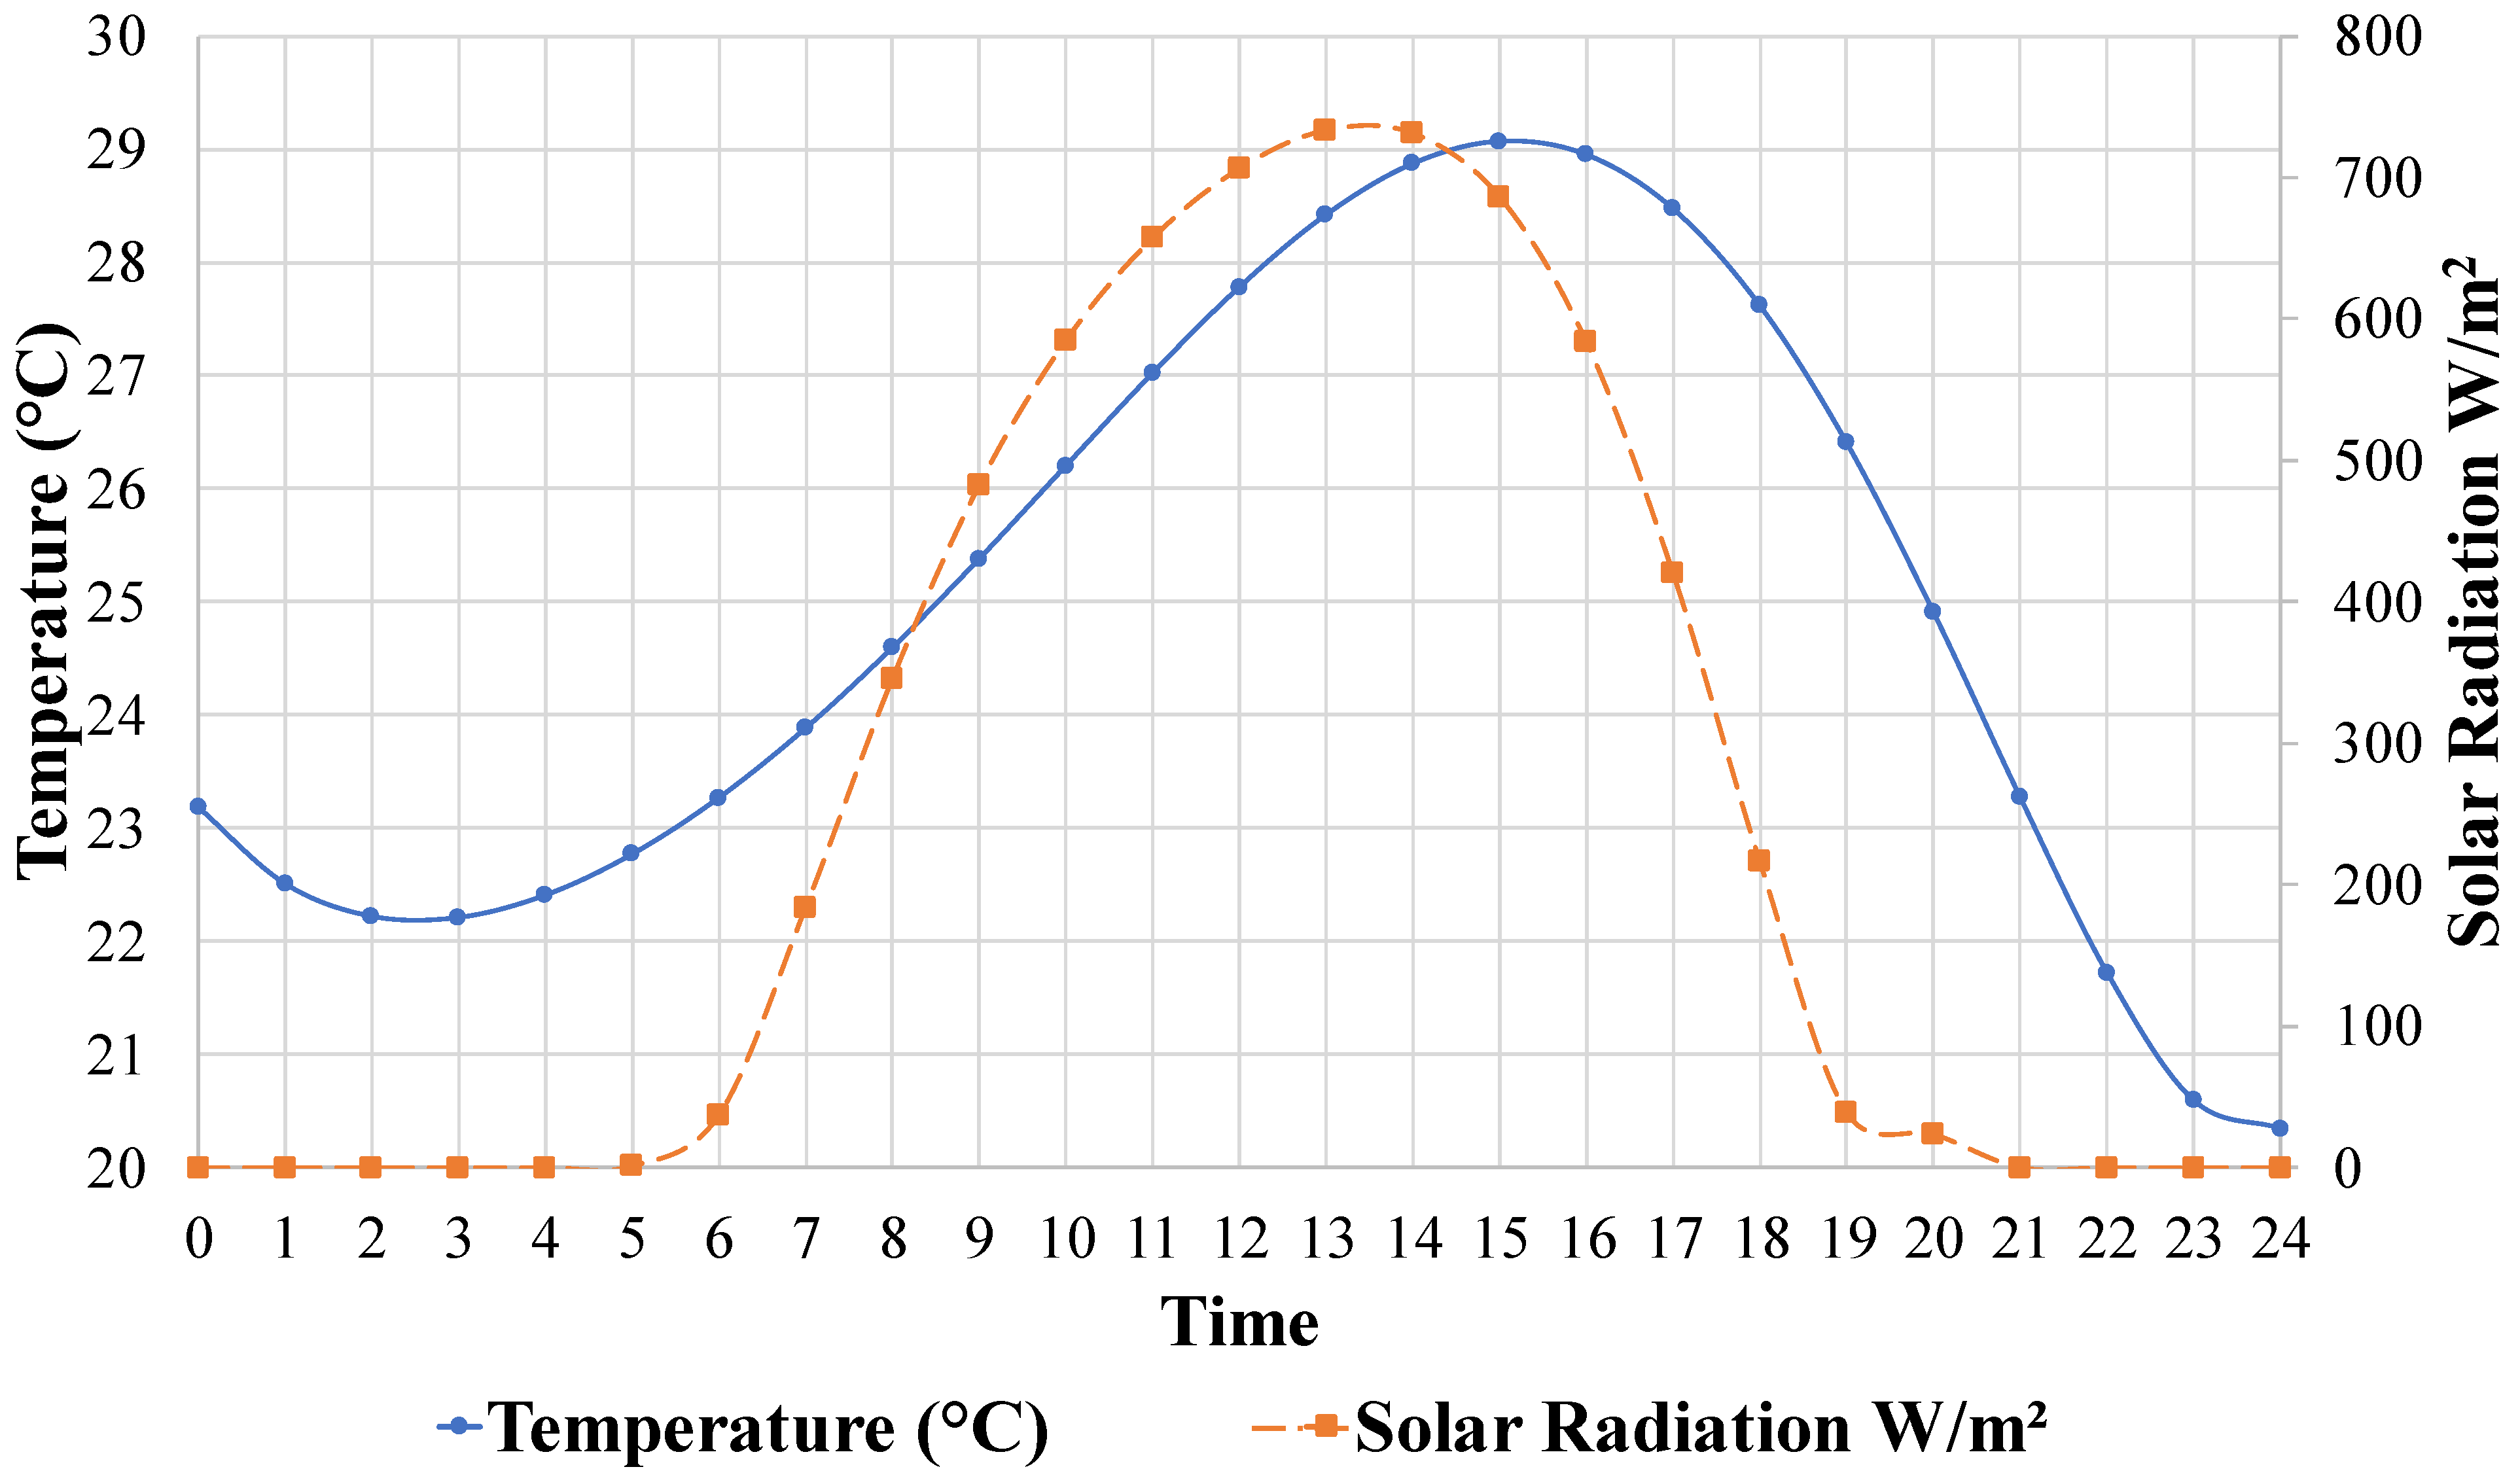
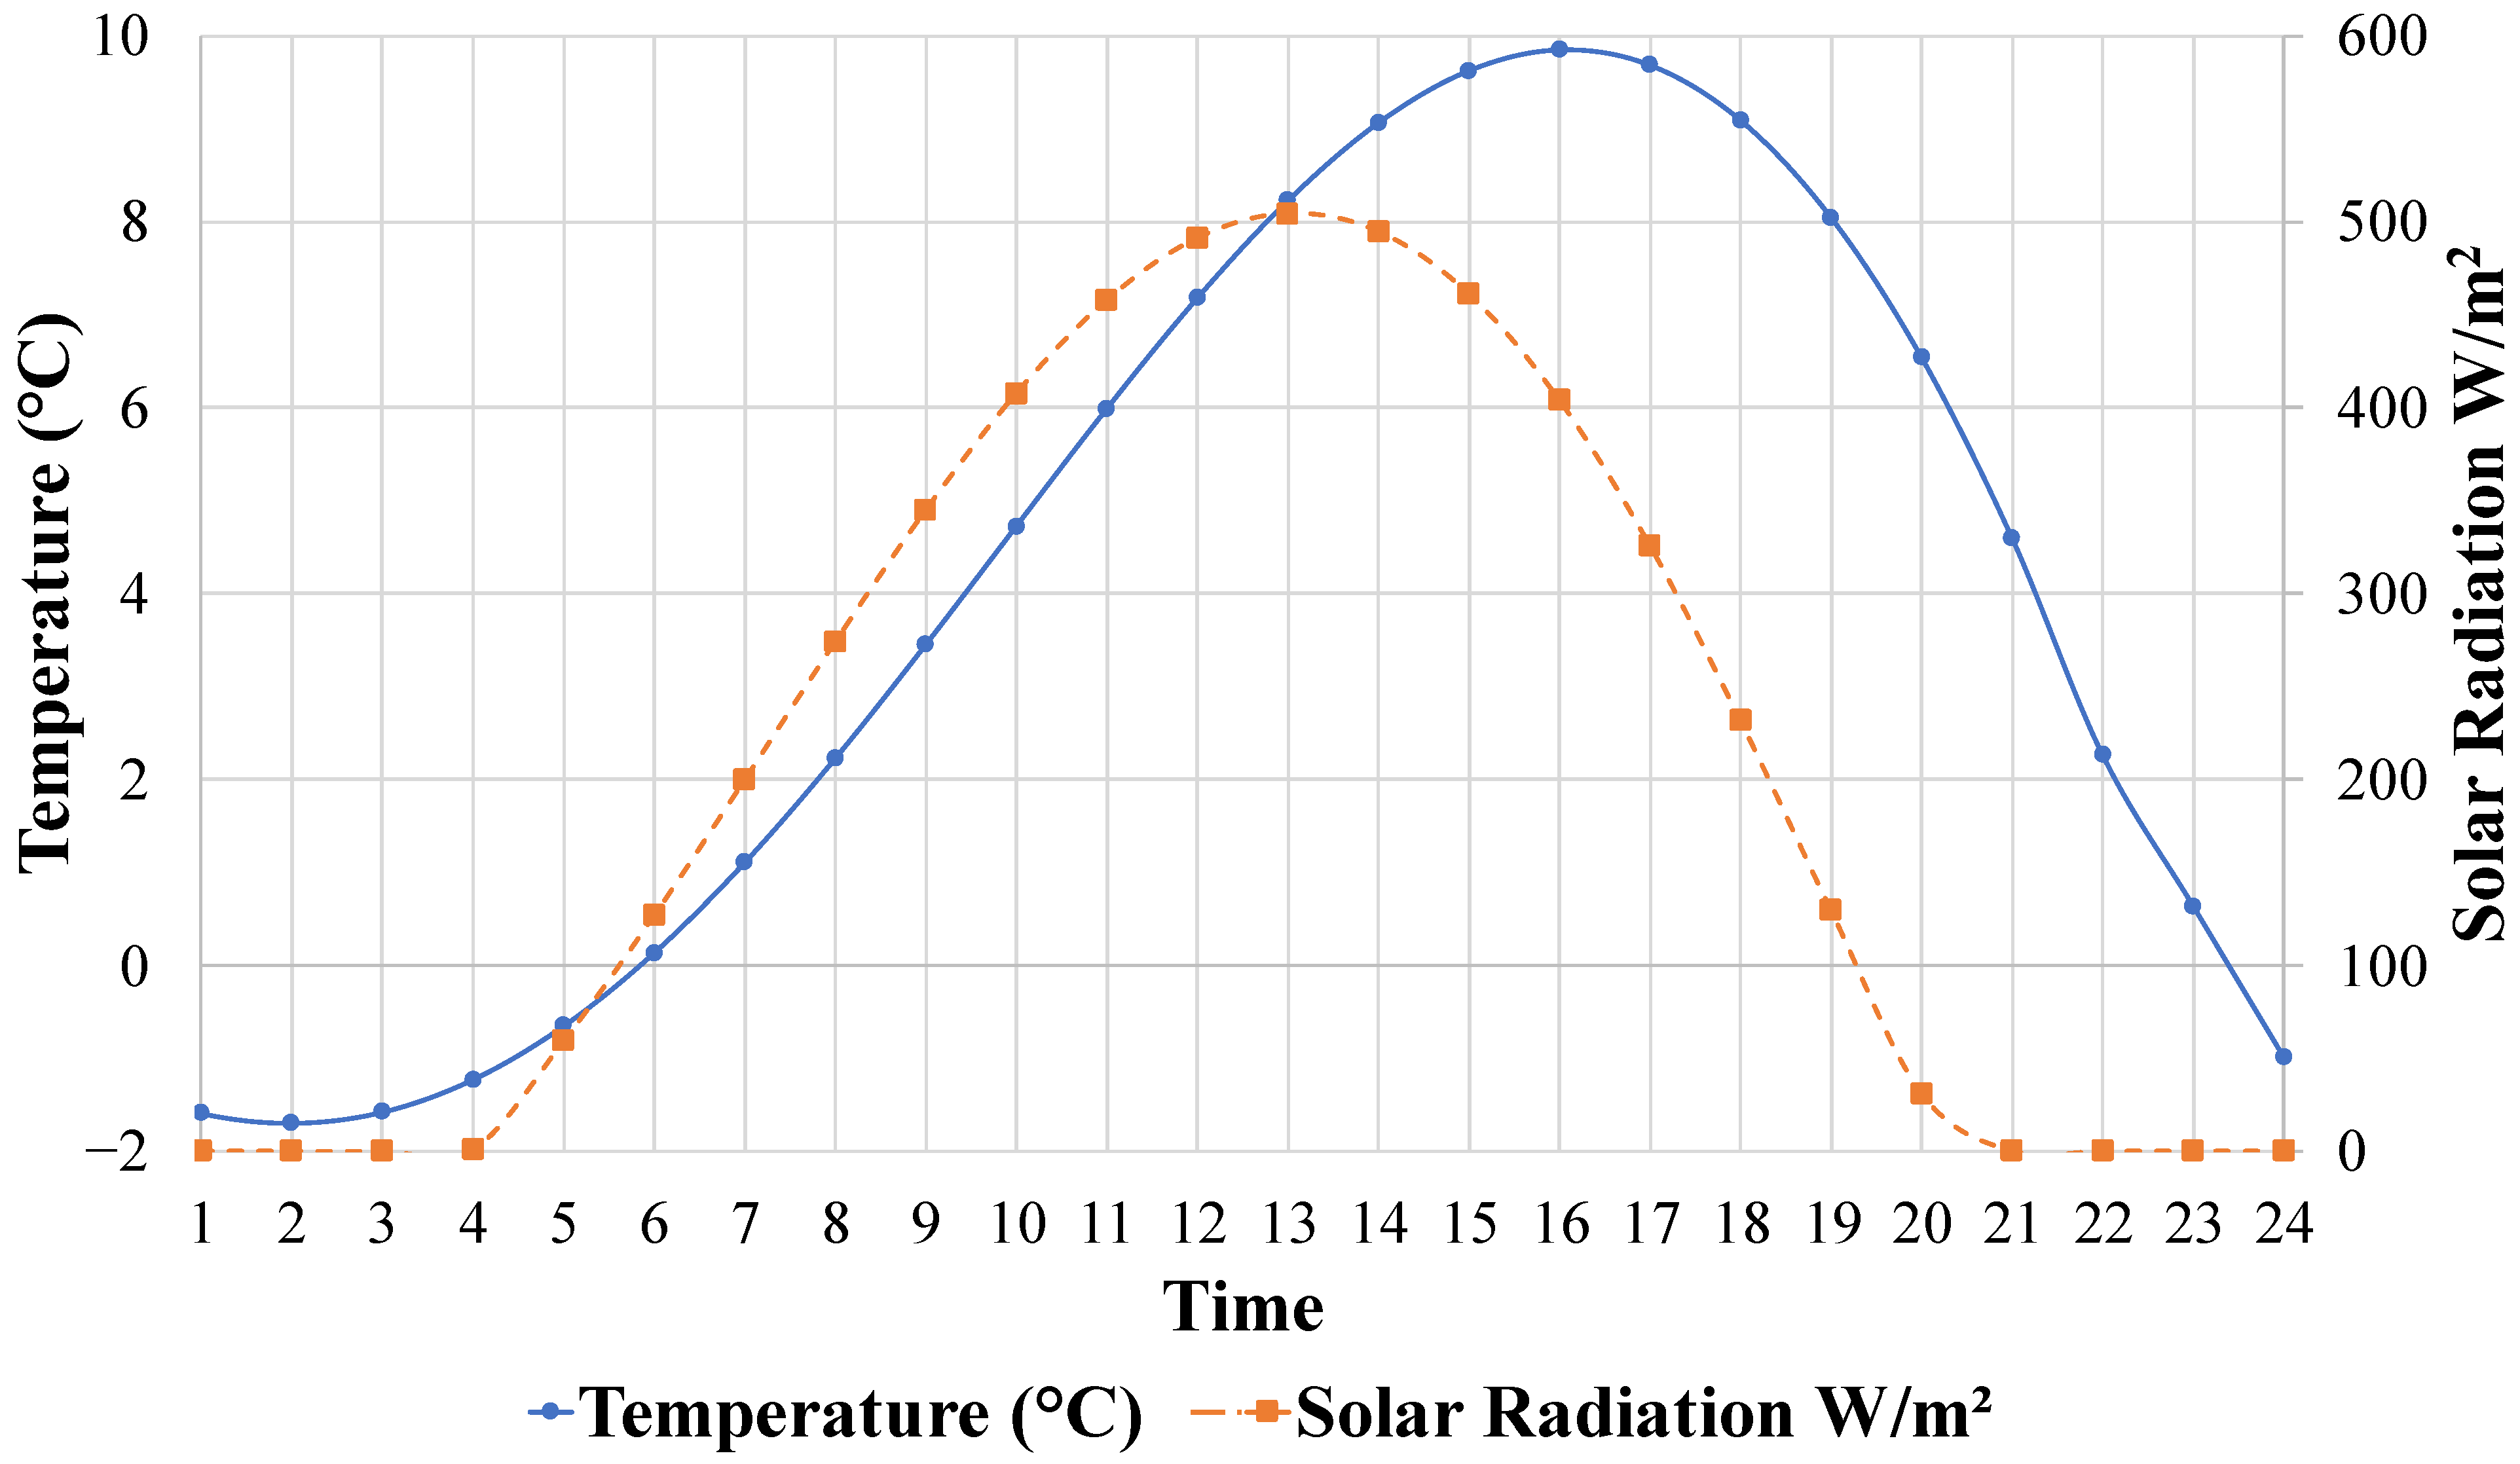
3.5. In-Service Bridge Data Collection Dates, Times, and Framework

Once a satisfactory result was obtained in Section 3.3 and Section 3.5, the research group proceeded to the next phase to detect delamination of the in-service bridge decks. Data were collected for two in-service bridge decks, one located on Apple Road, Newark, Delaware, and the other on US-77 Lincoln, Nebraska, as shown in Figure 8. The field data for the Apple Road bridge was collected on the 30 July 2021. As for the US-77 bridge, data was collected on the 9 March 2018. For both bridges, a sunny, clear day was selected, and the data analysis followed the same framework presented in Figure 3. The environmental conditions of temperature and solar data are highlighted in Figure 9 and Figure 10 for both bridge cases.
For the case of the bridge in Delaware, data was overlaid on known delamination areas’ locations provided by the Delaware Department of Transportation (DelDOT) using the hammer-sounding method for validation [68]. As for the Nebraska bridge, the data were compared to both hammer-sounding and coring samples. The coring samples were intended to validate the hammer-sounding dataset. That is because they are more reliable than the hammer-sounding, where it is not dependent on the subjective opinion of the inspector. Data was also collected using a research-grade thermal camera (Table 1). The research-grade cooled thermal camera dataset was demonstrated to highlight the detectability abilities of an uncooled consumer-grade thermal camera by comparing IoU values of both cameras’ detectability. Both cameras’ results were compared to the hammer-sounding dataset as the ground truth. The goal of the comparison is to benchmark the consumer-grade thermal camera performance with respect to delamination detection against that of the research-grade thermal camera. The comparison was completed to evaluate if the consumer-grade camera will produce detection accuracy that matches or is close to the research-grade thermal camera as proof of its applicability for delamination detection.
Figure 10. Temperature and solar radiance data for data collection day of US-77 bridge (9 March 2018) Lincoln, Nebraska [69].
Infrastructures 07 00163 g010

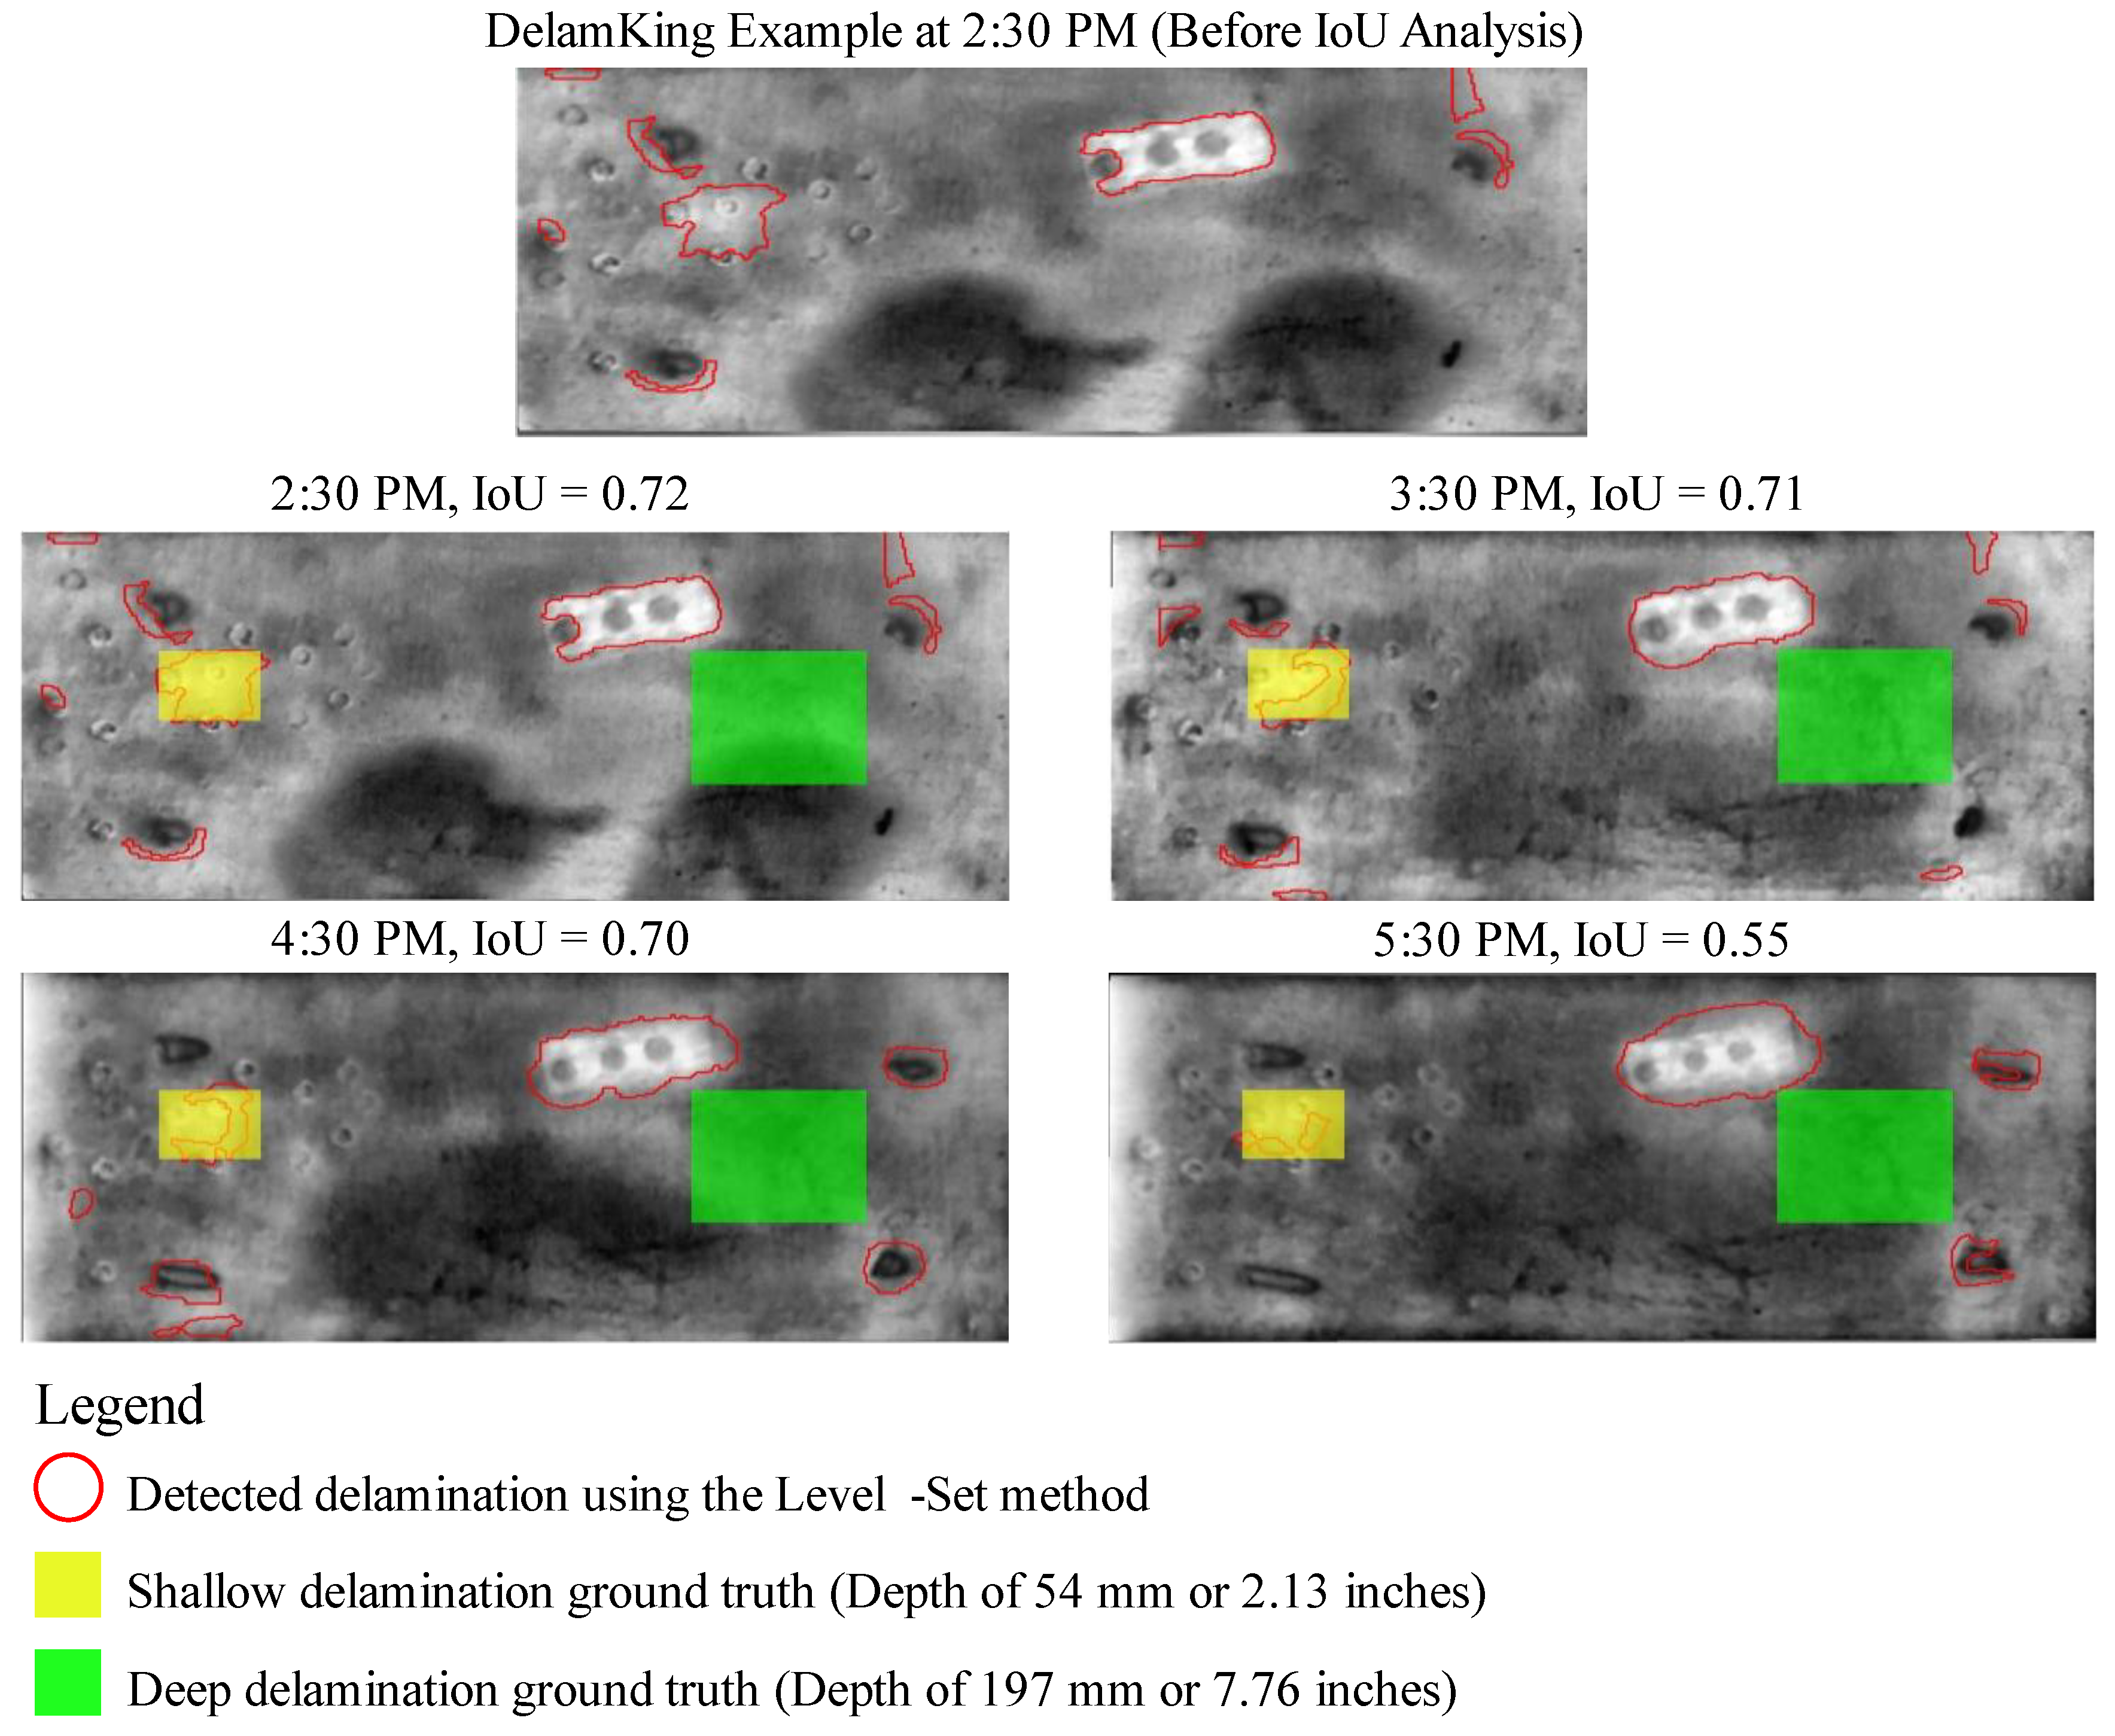
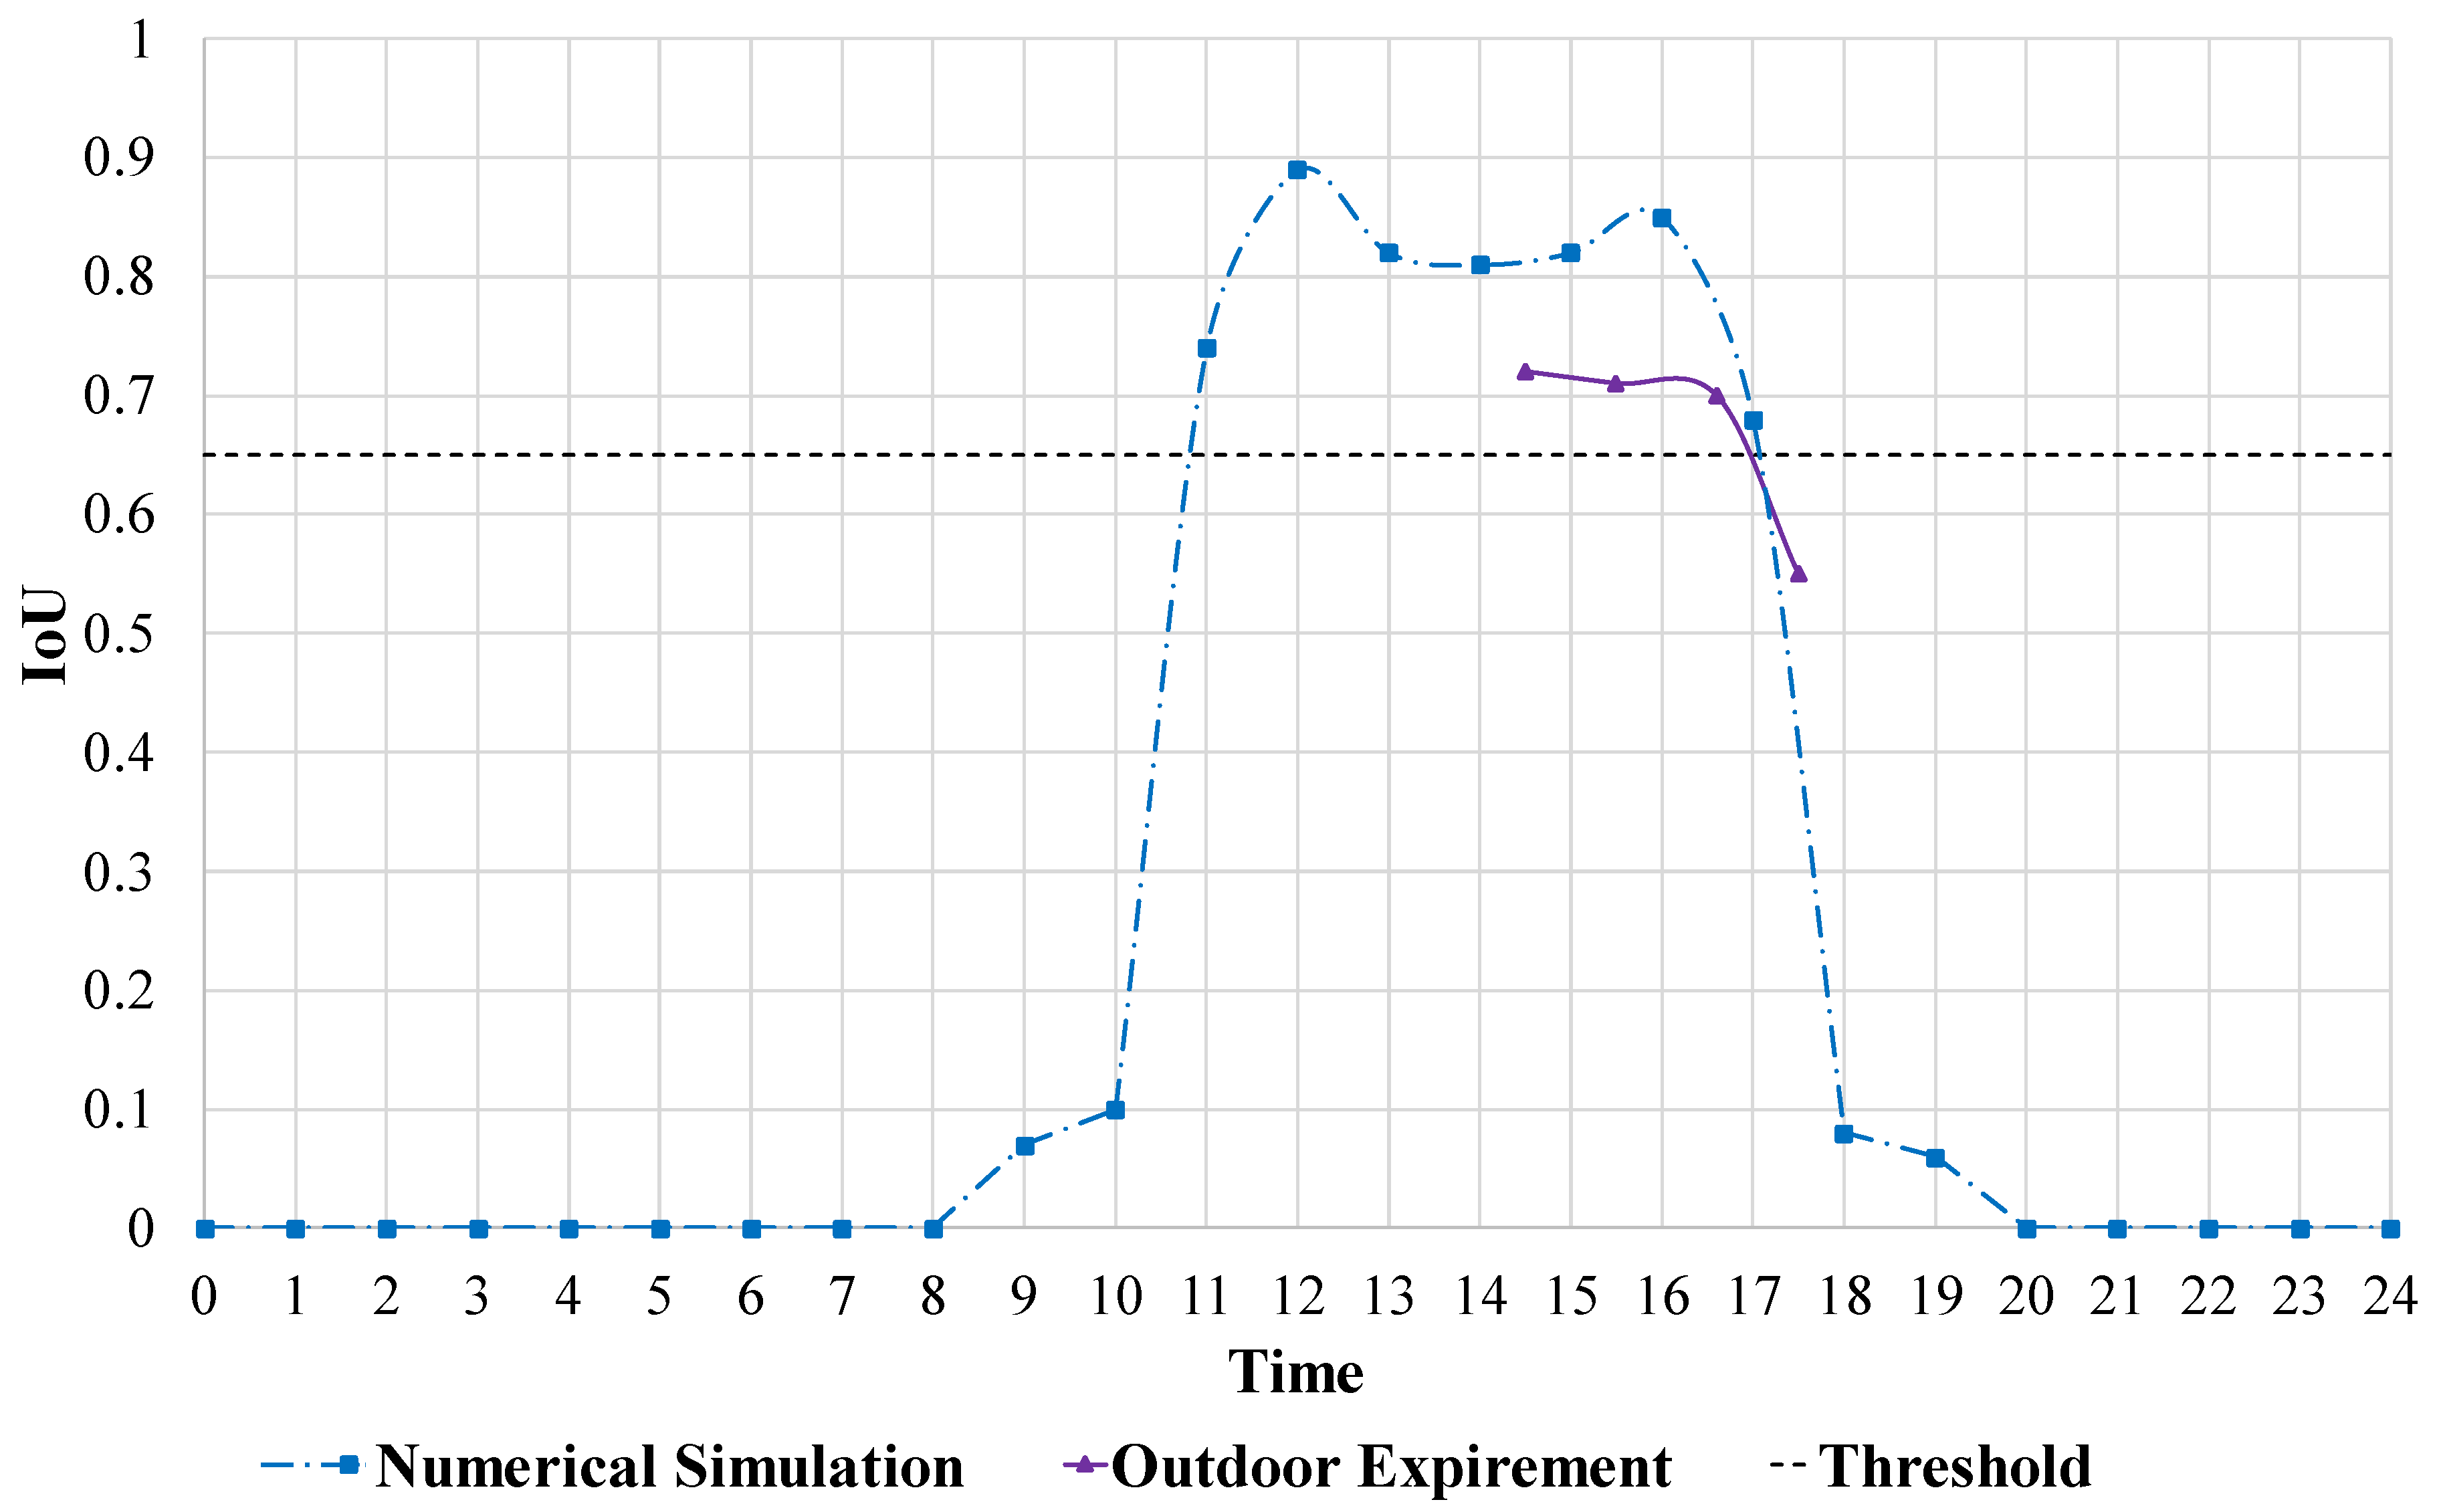
3.6. Evaluation Method: Intersection over Union (IoU)

To provide a quantitative comparison of the applied level-set method, IoU detailed in Equation (1) is used to evaluate segmentation accuracy. IoU is a commonly used metric for comparing similarities between two shapes by looking into the shape’s properties, such as width, height, and location [70]. It will return a value of 0 if the images do not overlap and a 1 if there is complete overlap [24]. Therefore, the higher the value of IoU, the higher the detection accuracy. An IoU threshold of 0.65 falls within the acceptable ranges of 0.5–0.95 [71,72]. Thus, it was selected for the purpose of this research to indicate acceptable detectability and accuracy.
IoU = | A P     A g | | A P     A g | ,
where Ap is the predicted delamination area, and Ag is the ground truth delamination area.

4. Results and Discussion

4.1. Outdoor Experiment Results

Figure 11 shows the IRT results for the specified period on the 24 June 2021, utilizing the level-set method [24]. The detected delamination using the IRT method is shown in red boundary lines, which result from applying the level-set method using the software DelamKing. The ground truth box highlighted in yellow was produced using a MATLAB code to calculate intersection over union values. Only the shallow delamination at a depth of 54 mm (2.13 inches) was found, and the deep delamination at a depth of 197 mm (7.76 inches) was not detectable at any time during the data collection window. In this specific case, the slab contains a considerable amount of noise on the surface, which consists of a metal bar and hooks, as shown in Figure 11. When calculating the IoU, the metal bars on the slab were ignored, as they were known conditions and could be easily identified as noise. The results of the IoU analysis were used to provide quantitative comparison rather than approximate qualitative evaluation.
As shown in Figure 11, the detectability (IoU) of the IRT method using a consumer-grade camera peaked at a value of 0.72 at 2:30 p.m., which then decreased to a value of 0.71 at 3:30 p.m. Then, the detectability was relatively maintained at a value of 0.70 at 4:30 p.m., which then reduced to a value of 0.55 around 5:30 p.m. The acquired detection accuracies for the shallow delamination of 54 mm ranged from 55–72% while utilizing a consumer-grade thermal camera with an uncooled sensor (FLIR Zenmuse XT), combined with the level-set image analysis method. If the data were to be collected during the period of 2:30–4:30 p.m., accuracies of 70–72% could be observed. The achieved accuracies are considered of adequate accuracy because the IoU values are above 0.65, which is regarded as above the adequate level of accuracy achievable [71,72]. Those values are comparable to those acquired in similar research studies using a research-grade cooled thermal camera and level-set method [24], where the detectability for the shallow delamination of 44 mm (1.73 in) ranged between 68–79% [24].

4.2. Numerical Simulation Results

As previously discussed, a 24-h transient simulation of concrete delamination was run on the same day as the outdoor experiment in Newark, Delaware. First, the numerical simulation is used to validate the results of the data collected from the outside experiment with the mimicked slab. Second, once the simulation result is validated, it can also supplement the conducted investigation, as the 24-h transient simulation extends beyond the limited data collection time between 2:30 and 5:30 p.m. This way, the simulation results can provide a general idea of the detectability during different times of the day. In addition to the discussed utilizations of the numerical simulation dataset, it also serves as a noise-free case under ideal conditions as a theoretical basis for delamination detection accuracy. This is because the numerical simulation is unaffected by the environmental conditions usually faced during field data collection, such as clouds, wind, debris on the surface, or shade.
It was found that the simulation results closely matched those of the outdoor experiment. The similarities appear with matching size and shape of delamination in both datasets, as shown in Figure 11 and Figure 12. In addition, the deep delamination was also undetectable in the simulation as it was indistinguishable from the source of noise on the slab’s surface, the same as the level-set result.
Figure 12 shows the slab layout with the delamination location highlighted as a cropped image to match the cropped areas of delamination illustrated. Hence, it is visually possible to locate the most appropriate detection times while avoiding the noise elements on the slab’s surface. In addition, since the deep delamination (depth of 197 mm) was not detectable, that side of the slab was ignored, and the focus was directed to show the detectable shallow delamination (depth of 54 mm), as illustrated in Figure 12.
The figure also shows the simulation results from 8 a.m. to 8 p.m. during the day. The images were reproduced using MATLAB to highlight the thermal contrast. The time window displayed was selected to highlight times that demonstrated detectability above zero. After a quick visual inspection of the cropped images, it can be deduced that the earlier hours of the day either have low detectability or high noise as the image appears more pixelated. Then, as time progressed, the contrast of the delamination became more visible and closer in size and shape to that of the ground truth, until it again reduced in size at the later hours of the day, when noise increased again.
Figure 7 illustrates the air temperature and solar radiance trends of the 24 June 2021, where the ambient temperature peaks at 4:00 p.m., while solar radiance peaks at 1:00 p.m. MATLAB was used to maximize the thermal contrast, highlight the location of the delamination with a boundary, and then IoU analysis was conducted to investigate the simulation results further. Figure 13 shows the IoU over time for the numerical simulation and outdoor experiment. The threshold for an acceptable IoU value was determined to be 0.65, which was comparable to or higher than the acceptable ranges in [71,72]. Thus, any values that fall above that line will be considered adequate detection accuracy. For the case of the numerical simulation, IoU reaches acceptable values around 11 a.m. to 5 p.m. (10:50 a.m.–5:10 p.m.), with accuracies ranging from 0.65 to 0.89, as shown in Figure 13. There are two peaks of IoU based on the simulation result. The assumption behind this phenomenon was that those surges of detectability were influenced by the peaks in solar radiance and temperature, respectively.
As for the outdoor experiment results, both Figure 11 and Figure 13 indicate that detectability was acceptable within the observation period of 2:30–5:00 p.m. Those conclusions overlap with the numerical simulation results, where detectability was above the threshold. It was also found that the results of the numerical simulation and outdoor experiment of the 24th of June follow a similar trend, while the actual detectability is lower than the simulated detectability. The reduced accuracy in the slab case compared to the numerical simulation is because the latter is under the noise-free ideal case scenario.
A regression analysis of the data was conducted to investigate further the effects of temperature and solar radiance over detectability throughout the day. Therefore, the numerical simulation results were analyzed in reference to ambient temperature and solar radiance, as shown in Table 6. The R-squared value for temperature and solar radiance were 0.56 and 0.84, respectively. Thus, the temperature and solar radiance models explain about 55.9% and 70.5% of the data variance, respectively, indicating that the model has adequate prediction accuracy [73,74,75]. Additionally, the p-value of temperature and solar radiance in relation to IoU were 1.74 × 10⁻⁵ and 1.54 × 10⁻⁷, respectively. The p-values indicate that temperature and solar radiance significantly impact IoU values when considering a significance level of 0.05 [73,74,75]. However, the effect of solar radiance is more significant than that of temperature. Indicating that solar radiance values directly influence IoU, as they have the dominant impact on detectability. Therefore, this validates the results where the peak in detectability occurred around the maximum temperature and solar radiance values throughout the day.
The thermal images generated in MATLAB were further analyzed. The average delamination temperature was compared to the average sound concrete temperature within the bounds of the previously identified cropped region from Figure 12. The intention was to represent the thermal contrast of the delamination area vs. the sound concrete area throughout the period of interest 8:00 a.m.–8:00 p.m., as shown in Figure 14. In general, the period of 12:00–4:00 p.m. shows higher thermal contrast, which is correlated to the solar radiance and air temperature peaking at 1:00 p.m. and 4:00 p.m. Those results align with the outcomes of Figure 13, where the peak of detectability was during the period of 12:00 p.m.–4:00 p.m.
The recommended contrast between sound and delamination areas for accurate detection varies according to the researcher’s or inspector’s subjective opinion [20,76]. The recommended contrast values ranged from as low as 0.2 °C [26,29,50] to as high as 1 °C [77,78]. These values are used to determine the lower bound of whether the detected area is considered as delamination or sound concrete, depending on the thermal contrast with surrounding areas. In this case study, the contrasts in the numerical simulation varied from 0.01 °C–1.65 °C, as shown in Figure 14. The 11:00 a.m.–5:00 p.m. window shows a thermal contrast that is higher than 1 °C compared to other timings with lower contrasts. Furthermore, the 12:00–4:00 p.m. timings display contrast values higher than 1.3 °C. The higher contrast led to relatively increased detectability, as highlighted in Figure 13. On the other hand, the morning period, 9:00–10:00 a.m., and the evening period, 6:00–8:00 p.m., show thermal contrast lower than 1 °C. The reduced contrast values are reflected in the IoU results, which showed almost minimal detectability. The thermal contrasts acquired within the window of accurate detection of 11:00 a.m.–5:00 p.m. have a contrast that is sufficiently above the contrast recommended by the literature [77,78].
However, despite thermal contrast being a variable of detectability, the temperature gradient can more accurately explain the detectability. For instance, the timings 1:00 p.m.–3:00 p.m. show the highest contrast (Figure 14) but do not have the highest accuracy in detectability for this specific case (Figure 13). The temperature gradient explains the discrepancy, as it is a better identifier of IoU values. This is because the temperature gradient considers the area of the detectable object and its location vs. that of the ground truth. Thus, even when the delamination records the highest thermal contrasts, its area and position might not perfectly align with the ground truth using LSM.

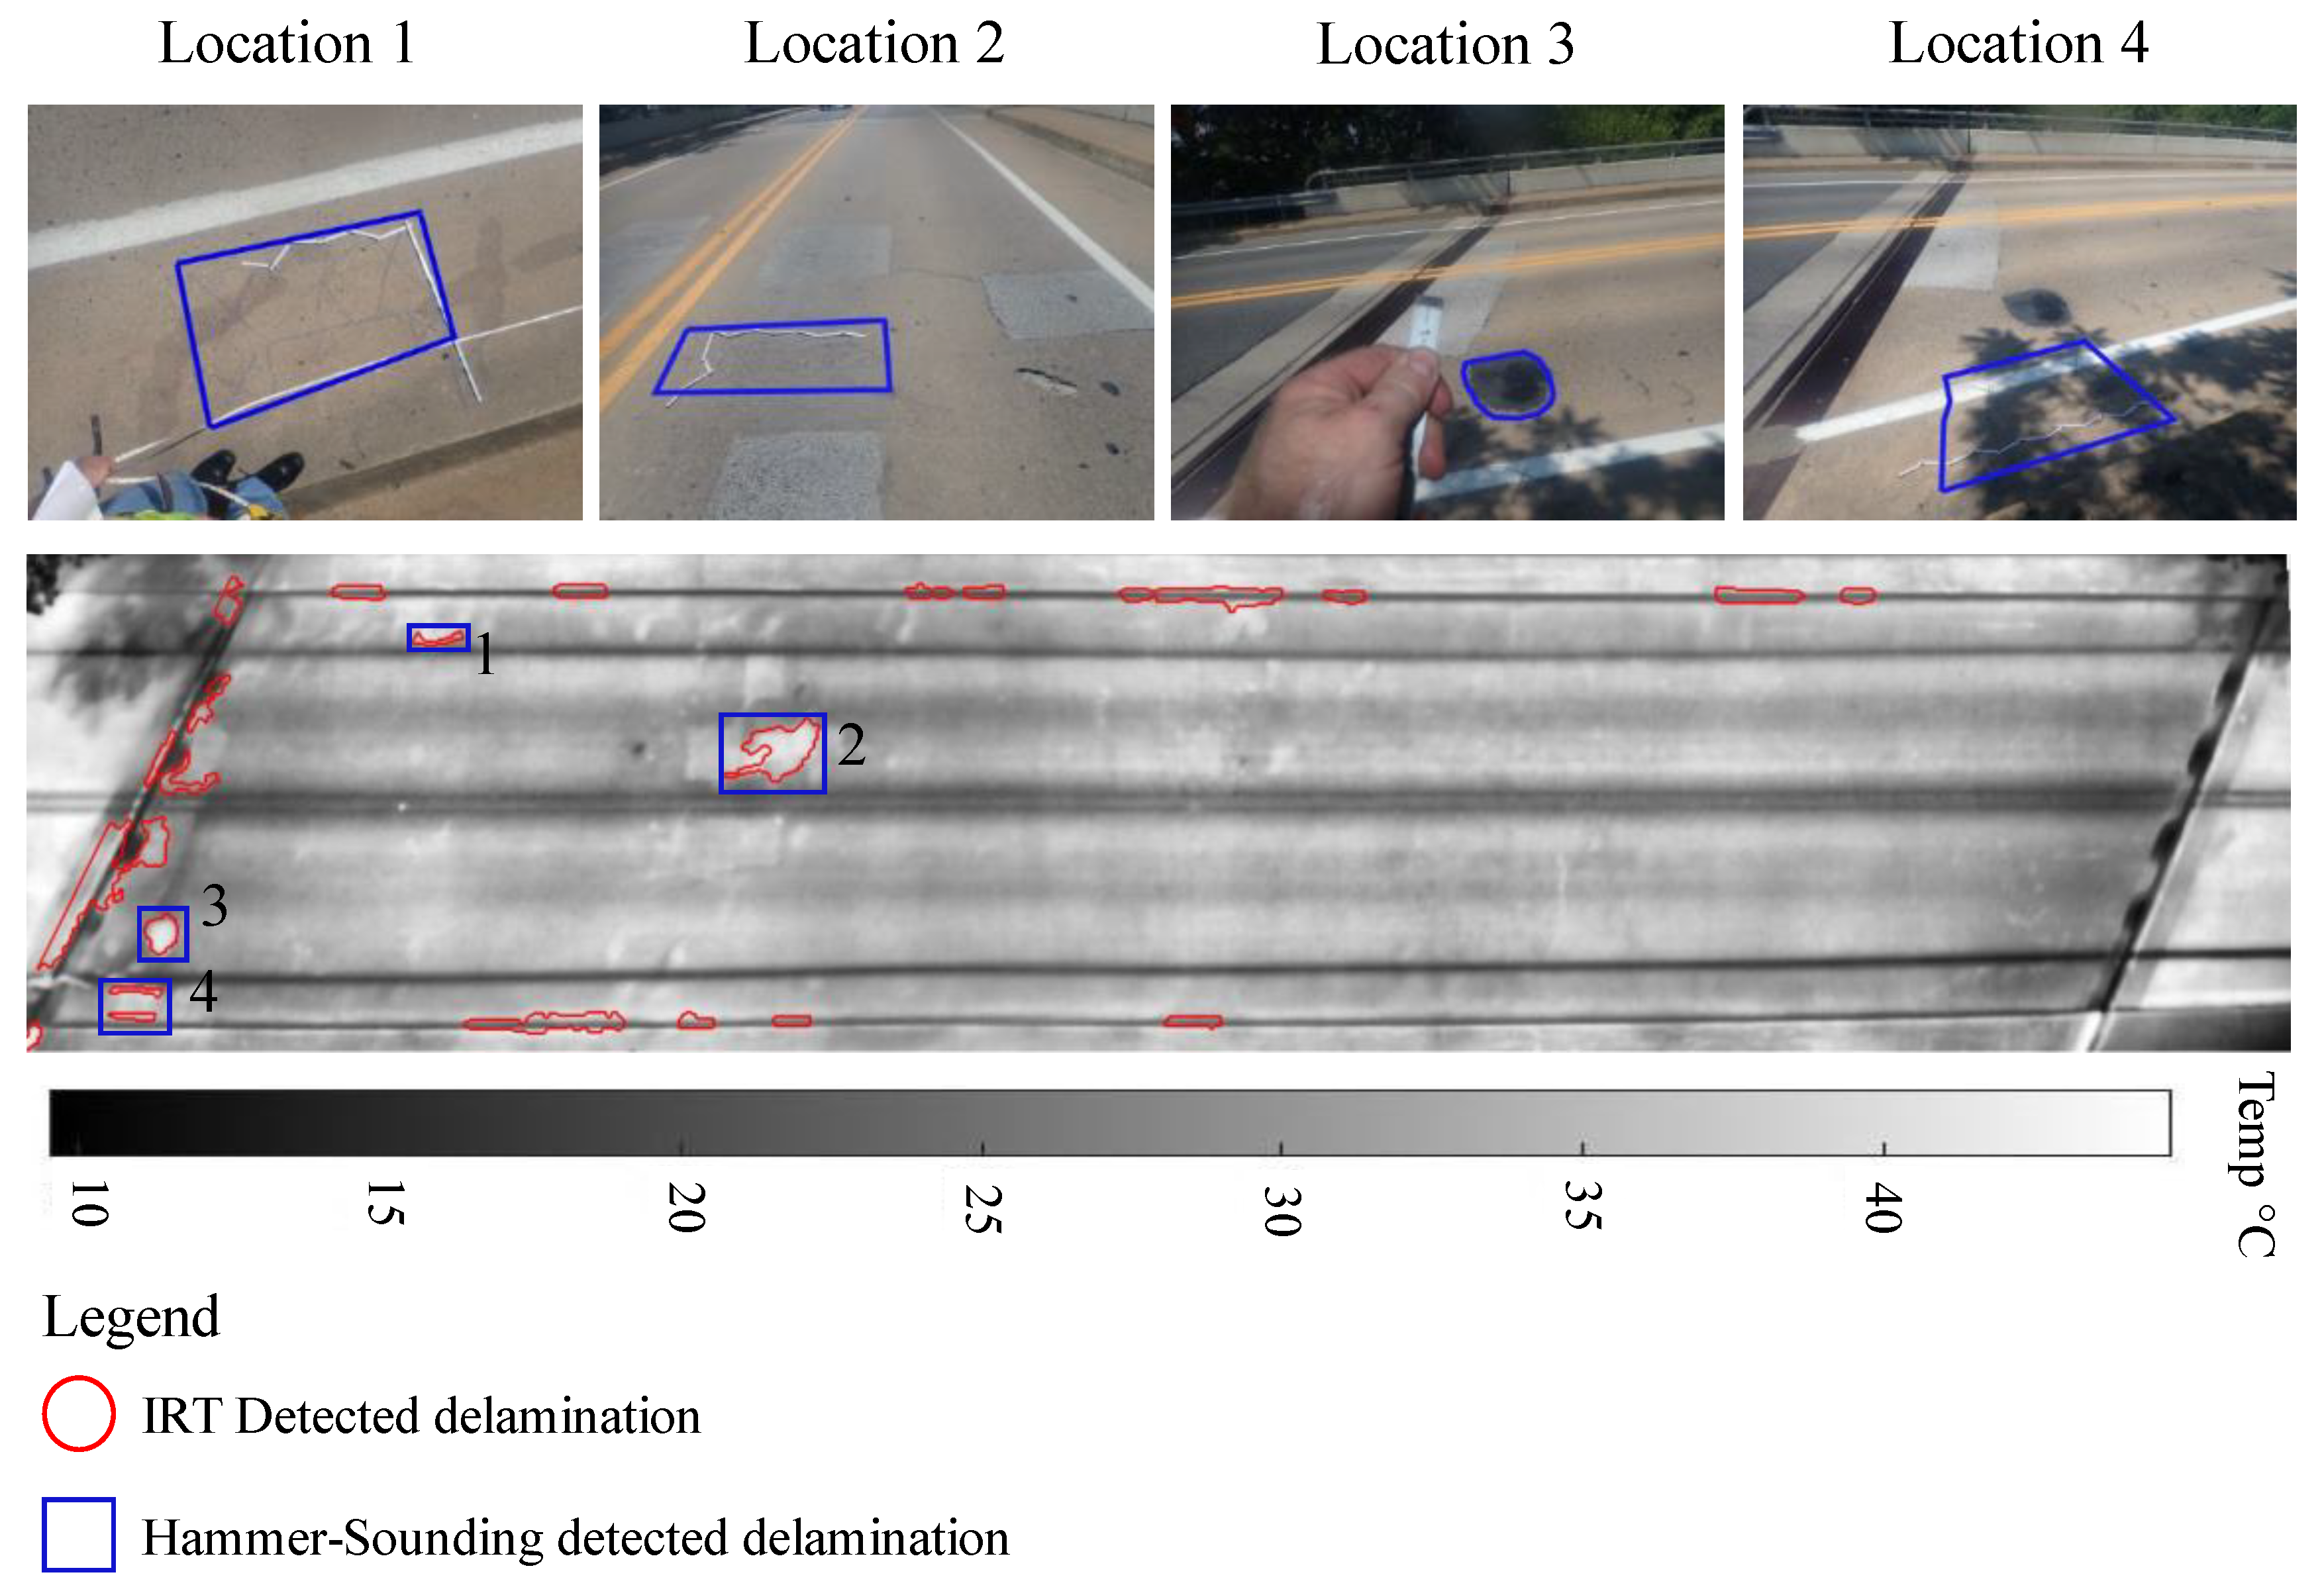
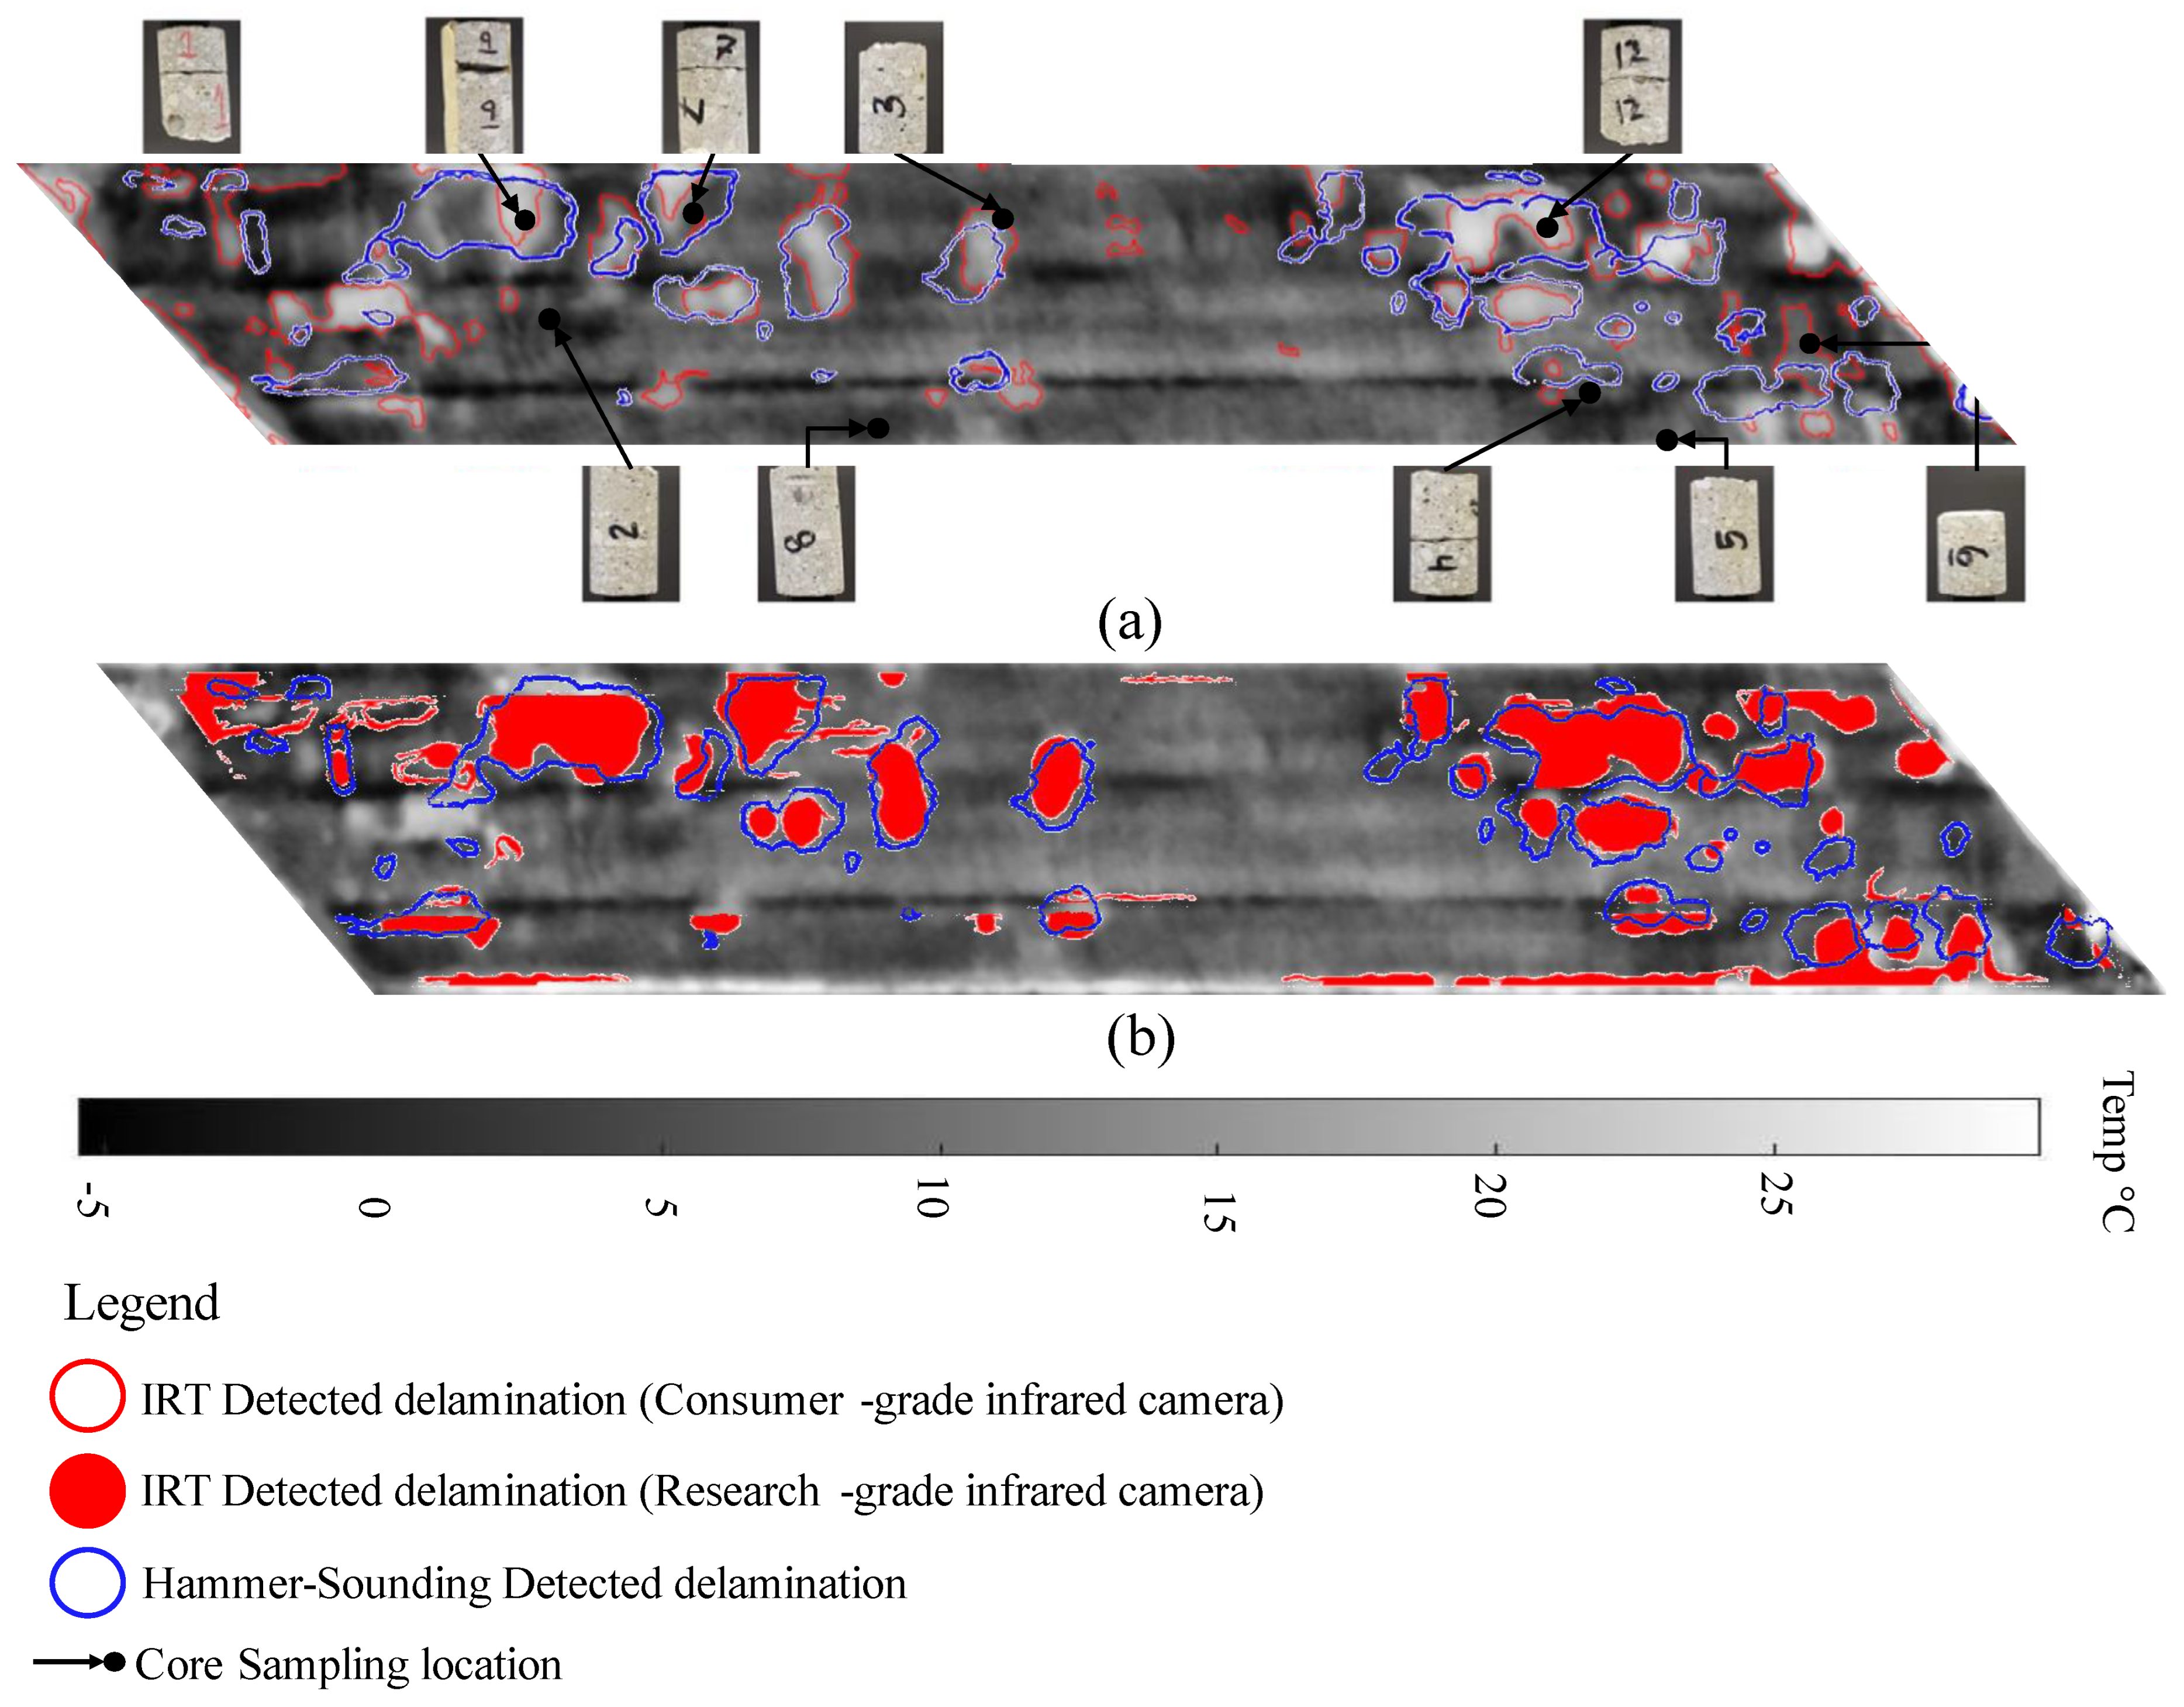
4.3. In-Service Bridge Results

Field data were collected for two bridges; the first is located on Apple Rd (tag: 1696-360) in Newark, Delaware, on the 30 July 2021, between 1:00–1:30 p.m. [68]. The second bridge is located on US-77 (tag: S077-05693R) in Lincoln, Nebraska, and data was collected on the 9 March 2018, between 4:30–5:00 p.m. Data collection days were chosen because they had adequate environmental conditions for data collection, as it was sunny and warm, with no clouds or rain. Then, the level-set method was applied (Figure 2), using different boundary thresholds iteratively until an adequate threshold was determined.
For the case of the Delaware bridge, the threshold was adjusted multiple times until a final value of 0.4 was determined to provide the most satisfactory results, as shown in Figure 15. According to level-set method results, there is a 1% delamination with an area of 10 m2 (108 ft2) of the total bridge area, which is indicated with red lines. Furthermore, a hammer-sounding inspection was performed by DelDOT after the IRT inspection was completed to verify the results of the level-set method, which are highlighted as blue boxes; locations of hammer-sounding delamination are highlighted in Figure 15. There is a clear overlap between the level-set and hammer-sounding results as to the approximate location and size of the delamination areas, as shown in Figure 15.
The threshold for the Nebraska bridge was selected iteratively, same as the case for the Delaware bridge, and a final value of 0.3 was chosen. The results of the level-set analysis are shown in Figure 16a with the resulting thermal image. The analysis indicated that there is 16% delamination with an area of 109 m2 (1173 ft2) of the total bridge area highlighted in red lines. The hammer-sounding test and core sampling were performed to validate the results of the IRT method. The hammer-sounding results are shown as blue areas, and the core samples, considered as the ground truth of delamination locations, are indicated in black arrows to their locations on the bridge. After inspecting the overlap between the results of hammer-sounding and coring samples tests against the level-set method, there is a clear overlap of delamination locations between all detection methods, as illustrated in Figure 16a. In the case of both bridges, some areas were not detected by hammer-sounding. They are either delamination that is not identifiable by hammer-sounding or outliers. Further investigation, such as collecting and analyzing more core samples, is needed.
In order to investigate the accuracy a consumer-grade thermal camera provides, it was compared to a research-grade thermal camera level-set analysis result of the same bridge (Nebraska), which are illustrated in 16b. The IoU values were calculated for both the consumer and research-grade thermal cameras to provide a quantitative comparative measure, as highlighted in Table 7. The IoU of the cooled research-grade thermal camera, as calculated in [24], was 0.4462. On the other hand, the uncooled consumer-grade thermal camera was estimated to be 0.3923. There is a slight decline in the detection accuracy of about 12.1% when utilizing the uncooled consumer-grade thermal camera. However, this decline in accuracy is of little significance when comparing the prices and ease of use of the uncooled consumer-grade thermal camera compared to its competitor, the cooled research-grade thermal camera. This indicates that a consumer-grade thermal camera is able to detect delamination in concrete bridges with an accuracy that can match that of the research-grade camera when employing the level-set method for image analysis. Therefore, this increases the feasibility and applicability of IRT as an NDE method for delamination detection of concrete bridge decks delamination.

4.4. Consumer-Grade Thermal Camera Performance Evaluation

According to the selected evaluation metrics, acceptable results were obtained from a field experiment of a concrete slab with mimicked delamination of 54 mm deep (2.13 inches). Satisfactory results were obtained from the transient numerical simulation of the slab and both concrete bridge decks. The deeper delamination of 197 mm (7.76 inches) was ignored, as it was not detected by IRT or the numerical simulation.
Overall, the results of the outdoor experiment and numerical simulation data coincide and show agreement on the trend of detectability during the data collection time window of 2:30–5:30 p.m. The theoretical detection accuracy attained from the numerical simulation, which is under a noise-free ideal condition, is also acceptable. Both datasets are comparable, where the detectability accuracy was higher during the beginning of the data collection period rather than at the end. If this time window of the simulation were to extend to cover periods before the start of the data collection period (noon) and stopped at a reasonable detectability value occurring at 4:00 p.m., accuracies of 65–89% would be achieved at the location of the experiment. Those accuracies are similar to the field data, where the accuracy of detection (IoU) is 70–72% during that same period. The increased detectability range of the numerical simulation is due to the numerical simulation being a theoretical dataset unaffected by environmental conditions such as the field data. Thus, the detectability accuracy of the consumer-grade thermal camera from the experiment is comparable to the accuracies achieved with a research-grade camera, which ranged from 68–79% from existing literature when utilizing the level-set method for analysis [12].
Moreover, after analyzing the results of the Delaware bridge, it was found that delamination locations identified using a consumer-grade thermal camera adequately matched the locations of suspected delamination areas found by the hammer-sounding method provided by DelDOT. The results of the Nebraska bridge, when compared to both hammer-sounding results and core samples, were found to provide acceptable detectability. In addition, the uncooled consumer-grade thermal camera was quantitively benchmarked against results from a cooled research-grade thermal camera using IoU and showed comparable delamination detectability. The consumer-grade thermal camera recorded an IoU of 39.23% compared to the research-grade thermal camera of 44.62%. These values are comparatively much lower than the case of the outdoor experiment. The reduction is because the delaminations were artificially placed in the outdoor experiment, and thus their exact location was known. On the other hand, hammer-sounding results were used as the ground truth for detection accuracy evaluation in the case of the bridges. As previously discussed, hammer-sounding has a relatively low detection accuracy [5,9]. Hence, the IRT being compared to hammer-sounding is not a comprehensive indicator of its detection accuracy, which might be much higher if compared to a more accurate method. But these IoU values can still be indicators to compare the accuracy between the different cameras.

5. Conclusions

The study aimed to allow the application of the level-set method to become more accessible by enabling the use of more cost-effective and lighter consumer-grade thermal sensors. The accuracy of a lower-resolution uncooled consumer-grade infrared camera for delamination detection was assessed quantitatively through field data from a slab with mimicked delamination and two in-service bridge decks, respectively.
When inspecting the results of the outdoor experiment, the maximum accuracies of detection were 70–72%. The achieved accuracies indicate that the uncooled consumer-grade thermal camera can produce accuracies comparable to cooled research-grade thermal cameras in literature. Additionally, when the results were cross-referenced to a transient numerical simulation, accuracies of 65–89% were acquired, and the trends matched those of the outdoor experiment. Furthermore, the results for the Delaware bridge were comparable to the hammer-sounding dataset collected for the same bridge. As for the case of the Nebraska bridge, the consumer-grade thermal camera was able to detect delamination with accuracies comparable to that of hammer-sounding and core sampling. In addition, the uncooled consumer-grade thermal camera results were compared to a cooled research-grade thermal camera, where the detected delamination areas adequately matched in location, size, and shape. Additionally, quantitative analysis utilizing IoU showed that the consumer-grade thermal camera could provide an accuracy of 39.23%, which is comparable to that of the research-grade thermal camera of 44.62%. The detection accuracy is relatively low because IoU was based on the hammer-sounding test as the ground truth, which has low detection accuracy.
This case study made several conclusions after investigating the results of the outdoor experiment, numerical simulation, and two in-service bridge decks. First, the uncooled consumer-grade camera provided accuracies that are on par with those of a cooled research-grade thermal camera when utilizing the level-set method. The comparable results are due to delaminations being detectable when the camera’s sensitivity is sufficient. Second, the contrasts obtained in the numerical simulation within the period of accurate detection were above 1 °C. The camera sensitivity of the utilized uncooled consumer-grade camera (DJI Zenmuse XT) is 0.05 °C at 25 °C, which indicates that it is more than capable of detecting temperature differences of 1 °C. Yet, thermal contrast is not the only variable in delamination detection, and the temperature gradient presents a more accurate predictor of detection accuracy. This is because the temperature gradient considers the detectable area and its location versus that of the ground truth. Third, solar radiance has a dominant effect on detectability. As for temperature, while it impacts detection, it has marginally less of an impact. Those conclusions allow for the level-set method to be accessible and affordable. Thus, it can be applied by different entities and departments of transportation for rapid and efficient delamination detection of concrete bridge decks with significantly lowered costs and efforts compared to the research-grade camera.
In the future study, more data collection is needed for different seasons for more extended periods along with numerical simulations, as it would allow for better data analysis and validation of temperature and solar radiance effect on detectability. As for the data collection interval, the interval will be reduced from 30 min to a more appropriate interval to further account for the environmental conditions’ effect on detection. In addition, a more in-depth benchmark study of uncooled consumer-grade thermal cameras vs. cooled research-grade thermal cameras must be investigated. Finally, there is ongoing research on improving the detection accuracy of the software (DelamKing) utilized in this study.

Author Contributions

Conceptualization, D.A. and R.N.; Data curation, D.A., C.C. and Z.S.; Formal analysis, D.A.; Funding acquisition, R.N. and Z.S.; Investigation, D.A., R.N., C.C. and Z.S.; Methodology, D.A., R.N., C.C. and Z.S.; Project administration, R.N. and Z.S.; Resources, R.N.; Software, D.A., C.C. and Z.S.; Supervision, R.N. and Z.S.; Validation, R.N., C.C. and Z.S.; Visualization, D.A., R.N., C.C. and Z.S.; Writing—original draft, D.A.; Writing—review and editing, R.N., C.C. and Z.S. All authors have read and agreed to the published version of the manuscript.

Funding

The S077-05693R bridge data collection was supported by the Nebraska Department of Transportation (NDOT). Grant # SPRP1(20) M109.

Data Availability Statement

The data presented in this study are available on request from the corresponding author. The data are not publicly available due to the data being sensitive and connected to ongoing research, so it will only be provided with valid reasoning for the request.

Acknowledgments

The efforts, assistance, and data provided by the Delaware Department of Transportation (DelDOT), especially the assistance provided by Jason Arndt, Matthew Mortensen, Darren Sobota, Siarhei Komar, Dwayne Day, and many others, are all greatly appreciated, and we extend our deepest regards and gratitude to them. The support of the Nebraska Department of Transportation is deeply appreciated. Additionally, the previous work of Daniel J, Clem, Thomas Schumacher, and Jordan P. Deshon was of tremendous help, as their mimicked slab was used for data collection, and their research was of instrumental help to our work, and we would like to extend our gratefulness to them as well. Finally, the support provided by both Ryan Webber and Andrew Ahlborn with the collection of data and aid in the development of MATLAB codes is deeply valued, and we would like to extend our gratitude for all their instrumental assistance in completing this research.

Conflicts of Interest

The authors declare no conflict of interest. The funders had no role in the design of the study; in the collection, analyses, or interpretation of data; in the writing of the manuscript, or in the decision to publish the results.

References

  1. Broomfield, J. Corrosion of Steel in Concrete: Understanding, Investigation and Repair, 2nd ed.; CRC Press: London, UK; New York, NY, USA, 2006; ISBN 978-0-415-33404-4. [Google Scholar]
  2. Portland Cement Association. Types and Causes of Deterioration in Concrete; Portland Cement Association: Skokie, IL, USA, 2002. [Google Scholar]
  3. Alonso, C.; Andrade, C.; Rodriguez, J.; Diez, J.M. Factors Controlling Cracking of Concrete Affected by Reinforcement Corrosion. Mater. Struct. 1998, 31, 435–441. [Google Scholar] [CrossRef]
  4. Cady, P.D.; Weyers, R.E. Deterioration Rates of Concrete Bridge Decks. J. Transp. Eng. 1984, 110, 34–44. [Google Scholar] [CrossRef]
  5. Omar, T.; Nehdi, M.L. Condition Assessment of Reinforced Concrete Bridges: Current Practice and Research Challenges. Infrastructures 2018, 3, 36. [Google Scholar] [CrossRef] [Green Version]
  6. Sun, H.; Zhu, J.; Ham, S. Acoustic Evaluation of Concrete Delaminations Using Ball-Chain Impact Excitation. J. Acoust. Soc. Am. 2017, 141, EL477–EL481. [Google Scholar] [CrossRef] [PubMed] [Green Version]
  7. ASTM D4580/D4580M-12; Standard Practice for Measuring Delaminations in Concrete Bridge Decks by Sounding. ASTM: West Conshohocken, PA, USA, 2018.
  8. Krauss, P.D.; Lawler, J.S.; Steiner, K.A. Guidelines for Selection of Bridge Deck Overlays, Sealers and Treatments; National Cooperative Highway Research Program (NCHRP); FHWA: Washington, DC, USA, 2009; p. 111.
  9. Brencich, A.; Cassini, G.; Pera, D.; Riotto, G. Calibration and Reliability of the Rebound (Schmidt) Hammer Test. Civ. Eng. Archit. 2013, 1, 66–78. [Google Scholar] [CrossRef]
  10. Sun, H.; Pashoutani, S.; Zhu, J. Nondestructive Evaluation of Concrete Bridge Decks with Automated Acoustic Scanning System and Ground Penetrating Radar. Sensors 2018, 18, 1955. [Google Scholar] [CrossRef] [Green Version]
  11. Scott, M.; Rezaizadeh, A.; Delahaza, A.; Santos, C.G.; Moore, M.; Graybeal, B.; Washer, G. A Comparison of Nondestructive Evaluation Methods for Bridge Deck Assessment. NDT E Int. 2003, 36, 245–255. [Google Scholar] [CrossRef]
  12. Gucunski, N.; Kee, S.-H.; La, H.; Basily, B.; Maher, A. Delamination and Concrete Quality Assessment of Concrete Bridge Decks Using a Fully Autonomous RABIT Platform. Struct. Monit. Maint. 2015, 2, 19–34. [Google Scholar] [CrossRef] [Green Version]
  13. Zhu, J.; Popovics, J. Imaging Concrete Structures Using Air-Coupled Impact-Echo. J. Eng. Mech. 2007, 133.6, 628–640. [Google Scholar] [CrossRef]
  14. Zhang, G.; Harichandran, R.S.; Ramuhalli, P. An Automatic Impact-Based Delamination Detection System for Concrete Bridge Decks. NDT E Int. 2012, 45, 120–127. [Google Scholar] [CrossRef]
  15. Clem, D.J.; Schumacher, T.; Deshon, J.P. A Consistent Approach for Processing and Interpretation of Data from Concrete Bridge Members Collected with a Hand-Held GPR Device. Constr. Build. Mater. 2015, 86, 140–148. [Google Scholar] [CrossRef]
  16. Azari, H.; Yuan, D.; Nazarian, S.; Gucunski, N. Sonic Methods to Detect Delamination in Concrete Bridge Decks: Impact of Testing Configuration and Data Analysis Approach. Transp. Res. Rec. 2012, 2292, 113–124. [Google Scholar] [CrossRef]
  17. Shokouhi, P.; Wolf, J.; Wiggenhauser, H. Detection of Delamination in Concrete Bridge Decks by Joint Amplitude and Phase Analysis of Ultrasonic Array Measurements. J. Bridge Eng. 2014, 19, 04013005. [Google Scholar] [CrossRef]
  18. Garrido, I.; Lagüela, S.; Otero, R.; Arias, P. Thermographic Methodologies Used in Infrastructure Inspection: A Review—Post-Processing Procedures. Appl. Energy 2020, 266, 114857. [Google Scholar] [CrossRef]
  19. Shen, Z.; Cheng, C.; Na, R.; Shang, Z.; Charles, W. To Automate Detecting, Quantifying and Mapping of Delamination via Arial Thermography; Nebraska Department of Transportation: Lincoln, NE, USA, 2020; p. 44.
  20. Tomita, K.; Chew, M.Y.L. A Review of Infrared Thermography for Delamination Detection on Infrastructures and Buildings. Sensors 2022, 22, 423. [Google Scholar] [CrossRef]
  21. Sultan, A.A.; Washer, G.A. Comparison of Two Nondestructive Evaluation Technologies for the Condition Assessment of Bridge Decks. Transp. Res. Rec. 2018, 2672, 113–122. [Google Scholar] [CrossRef]
  22. Gucunski, N. National Research Council. Nondestructive Testing to Identify Concrete Bridge Deck Deterioration; Transportation Research Board: Washington, DC, USA, 2013.
  23. Janků, M.; Cikrle, P.; Grošek, J.; Anton, O.; Stryk, J. Comparison of Infrared Thermography, Ground-Penetrating Radar and Ultrasonic Pulse Echo for Detecting Delaminations in Concrete Bridges. Constr. Build. Mater. 2019, 225, 1098–1111. [Google Scholar] [CrossRef]
  24. Cheng, C.; Shen, Z. The Application of Gray-Scale Level-Set Method in Segmentation of Concrete Deck Delamination Using Infrared Images. Constr. Build. Mater. 2020, 240, 117974. [Google Scholar] [CrossRef]
  25. Walker, N. Infrared Thermography Handbook–Volume 1. Principles and Practice; The British Institute of Non-Destructive Testing: Northampton, UK, 2004; Volume 1, ISBN 0 903 132 338. [Google Scholar]
  26. Hiasa, S.; Birgul, R.; Catbas, F.N. Investigation of Effective Utilization of Infrared Thermography (IRT) through Advanced Finite Element Modeling. Constr. Build. Mater. 2017, 150, 295–309. [Google Scholar] [CrossRef]
  27. Hiasa, S.; Birgul, R.; Catbas, F.N. Infrared Thermography for Civil Structural Assessment: Demonstrations with Laboratory and Field Studies. J. Civ. Struct. Health Monit. 2016, 6, 619–636. [Google Scholar] [CrossRef]
  28. Hiasa, S.; Catbas, F.N.; Matsumoto, M.; Mitani, K. Monitoring Concrete Bridge Decks Using Infrared Thermography with High Speed Vehicles. Struct. Monit. Maint. 2016, 3, 277–296. [Google Scholar] [CrossRef]
  29. Hiasa, S.; Birgul, R.; Catbas, F.N. Effect of Defect Size on Subsurface Defect Detectability and Defect Depth Estimation for Concrete Structures by Infrared Thermography. J. Nondestruct. Eval. 2017, 36, 57. [Google Scholar] [CrossRef]
  30. Hiasa, S.; Birgul, R.; Necati Catbas, F. A Data Processing Methodology for Infrared Thermography Images of Concrete Bridges. Comput. Struct. 2017, 190, 205–218. [Google Scholar] [CrossRef]
  31. Cheng, C.; Shang, Z.; Shen, Z. Bridge Deck Delamination Segmentation Based on Aerial Thermography Through Regularized Grayscale Morphological Reconstruction and Gradient Statistics. Infrared Phys. Technol. 2019, 98, 240–249. [Google Scholar] [CrossRef] [Green Version]
  32. Raja, B.N.K.; Miramini, S.; Duffield, C.; Sofi, M.; Mendis, P.; Zhang, L. The Influence of Ambient Environmental Conditions in Detecting Bridge Concrete Deck Delamination Using Infrared Thermography (IRT). Struct. Control Health Monit. 2020, 27, e2506. [Google Scholar] [CrossRef]
  33. Omar, T.; Nehdi, M.L. Remote Sensing of Concrete Bridge Decks Using Unmanned Aerial Vehicle Infrared Thermography. Autom. Constr. 2017, 83, 360–371. [Google Scholar] [CrossRef]
  34. Omar, T.; Nehdi, M.L.; Zayed, T. Infrared Thermography Model for Automated Detection of Delamination in RC Bridge Decks. Constr. Build. Mater. 2018, 168, 313–327. [Google Scholar] [CrossRef]
  35. Hiasa, S.; Birgul, R.; Matsumoto, M.; Necati Catbas, F. Experimental and Numerical Studies for Suitable Infrared Thermography Implementation on Concrete Bridge Decks. Measurement 2018, 121, 144–159. [Google Scholar] [CrossRef]
  36. Cheng, C.; Na, R.; Shen, Z. Thermographic Laplacian-Pyramid Filtering to Enhance Delamination Detection in Concrete Structure. Infrared Phys. Technol. 2019, 97, 162–176. [Google Scholar] [CrossRef] [Green Version]
  37. Cheng, C.; Shang, Z.; Shen, Z. Automatic Delamination Segmentation for Bridge Deck Based on Encoder-Decoder Deep Learning through UAV-Based Thermography. NDT E Int. 2020, 116, 102341. [Google Scholar] [CrossRef]
  38. Sultan, A.A.; Washer, G. A Pixel-by-Pixel Reliability Analysis of Infrared Thermography (IRT) for the Detection of Subsurface Delamination. NDT E Int. 2017, 92, 177–186. [Google Scholar] [CrossRef]
  39. Abu Dabous, S.; Yaghi, S.; Alkass, S.; Moselhi, O. Concrete Bridge Deck Condition Assessment Using IR Thermography and Ground Penetrating Radar Technologies. Autom. Constr. 2017, 81, 340–354. [Google Scholar] [CrossRef]
  40. Pozzer, S.; Dalla Rosa, F.; Pravia, Z.M.C.; Rezazadeh Azar, E.; Maldague, X. Long-Term Numerical Analysis of Subsurface Delamination Detection in Concrete Slabs via Infrared Thermography. Appl. Sci. 2021, 11, 4323. [Google Scholar] [CrossRef]
  41. Chun, P.; Hayashi, S. Development of a Concrete Floating and Delamination Detection System Using Infrared Thermography. IEEEASME Trans. Mechatron. 2021, 26, 2835–2844. [Google Scholar] [CrossRef]
  42. Kee, S.-H.; Oh, T.; Popovics, J.S.; Arndt, R.W.; Zhu, J. Nondestructive Bridge Deck Testing with Air-Coupled Impact-Echo and Infrared Thermography. J. Bridge Eng. 2012, 17, 928–939. [Google Scholar] [CrossRef]
  43. Knorr, R.E.; Buba, J.M.; Kogut, G.P. Bridge Rehabilitation Programming by Using Infrared Techniques (Abridgment). Transp. Res. Rec. 1983, 899, 32–34. [Google Scholar]
  44. Detection of Concrete Delamination by Infrared Thermography; HR-244; National Academies of Sciences, Engineering, and Medicine: Washington, DC, USA, 1986.
  45. Moore, M.; Rolander, D.; Benjamin, G.; Phares, B. Highway Bridge Inspection: State-of-the-Practice Survey; FHWA, U.S. Department of Transportation: Atlanta, GA, USA, 2001; p. 81.
  46. Rolander, D.D.; Phares, B.M.; Graybeal, B.A.; Moore, M.E.; Washer, G.A. Highway Bridge Inspection: State-of-the-Practice Survey. Transp. Res. Rec. 2001, 1749, 73–81. [Google Scholar] [CrossRef]
  47. Rocha, J.H.A.; Póvoas, Y.V.; Santos, C.F. Detection of Delaminations in Sunlight-Unexposed Concrete Elements of Bridges Using Infrared Thermography. J. Nondestruct. Eval. 2018, 38, 8. [Google Scholar] [CrossRef]
  48. DelDOT. Standard Specifications for Road and Bridge Construction; The State of Delaware Department of Transportation: Dover, DE, USA, 2022; p. 731.
  49. Khan, F.; Ellenberg, A.; Mazzotti, M.; Kontsos, A.; Moon, F.; Pradhan, A.; Bartoli, I. Investigation on Bridge Assessment Using Unmanned Aerial Systems. Struct. Congr. 2015, 2015, 404–413. [Google Scholar] [CrossRef]
  50. Watase, A.; Birgul, R.; Hiasa, S.; Matsumoto, M.; Mitani, K.; Catbas, F.N. Practical Identification of Favorable Time Windows for Infrared Thermography for Concrete Bridge Evaluation. Constr. Build. Mater. 2015, 101, 1016–1030. [Google Scholar] [CrossRef]
  51. Oh, T.; Kee, S.-H.; Arndt, R.W.; Popovics, J.S.; Zhu, J. Comparison of NDT Methods for Assessment of a Concrete Bridge Deck. J. Eng. Mech. 2013, 139, 305–314. [Google Scholar] [CrossRef]
  52. Hiasa, S.; Necati Catbas, F.; Matsumoto, M.; Mitani, K. Considerations and Issues in the Utilization of Infrared Thermography for Concrete Bridge Inspection at Normal Driving Speeds. J. Bridge Eng. 2017, 22, 04017101. [Google Scholar] [CrossRef]
  53. FLIR. A8300sc User’s Manual; FLIR systems, Inc.: Wilsonville, OR, USA, 2015. [Google Scholar]
  54. Domaneschi, M.; Casciati, S.; Catbas, N.; Cimellaro, G.P.; Inaudi, D.; Marano, G.C. Structural Health Monitoring of In-Service Tunnels. Int. J. Sustain. Mater. Struct. Syst. 2020, 4, 268–291. [Google Scholar] [CrossRef]
  55. Deane, S.; Avdelidis, N.P.; Ibarra-Castanedo, C.; Williamson, A.A.; Withers, S.; Zolotas, A.; Maldague, X.P.V.; Ahmadi, M.; Pant, S.; Genest, M.; et al. Development of a Thermal Excitation Source Used in an Active Thermographic UAV Platform. Quant. InfraRed Thermogr. J. 2022, 1–32. [Google Scholar] [CrossRef]
  56. Tran, Q.H. Passive and Active Infrared Thermography Techniques in Nondestructive Evaluation for Concrete Bridge. AIP Conf. Proc. 2021, 2420, 050008. [Google Scholar] [CrossRef]
  57. Deane, S.; Avdelidis, N.P.; Ibarra-Castanedo, C.; Zhang, H.; Nezhad, H.Y.; Williamson, A.A.; Mackley, T.; Maldague, X.; Tsourdos, A.; Nooralishahi, P. Comparison of Cooled and Uncooled IR Sensors by Means of Signal-to-Noise Ratio for NDT Diagnostics of Aerospace Grade Composites. Sensors 2020, 20, 3381. [Google Scholar] [CrossRef]
  58. Cooled or Uncooled? Available online: https://www.flir.com/discover/rd-science/cooled-or-uncooled/ (accessed on 26 October 2022).
  59. Matsumoto, M.; Mitani, K.; Catbas, F.N. Bridge Assessment Methods Using Image Processing and Infrared Thermography Technology: On-Site Pilot Application in Florida; National Academies of Sciences, Engineering, and Medicine: Washington, DC, USA, 2013. [Google Scholar]
  60. Cheng, C.; Shen, Z. DelamKing; 2021. [Google Scholar]
  61. DJI. Inspire 1 User Manual; DJI: Shenzhen, China, 2017; p. 64. [Google Scholar]
  62. DJI. ZENMUSE XT User Manual; DJI: Shenzhen, China, 2016; p. 19. [Google Scholar]
  63. Zenmuse X3-Product Information-DJI. Available online: https://www.dji.com/zenmuse-x3/info (accessed on 5 June 2022).
  64. DJI. Matrice 600 Pro User Manual; DJI: Shenzhen, China, 2018; p. 64. [Google Scholar]
  65. MoviTHERM FLIR A8300sc MWIR. Available online: https://movitherm.com/products/infrared-cameras/science-research/flir-a8300sc-mwir/ (accessed on 5 June 2022).
  66. DJI. ZENMUSE X5 User Manual; DJI: Shenzhen, China, 2016; p. 18. [Google Scholar]
  67. DEOS DEOS Daily Data. Available online: http://www.deos.udel.edu/data/daily_retrieval.php (accessed on 14 June 2021).
  68. DelDOT. Bridge Deck Evaluation Report–Bare Concrete Bridge Deck Evaluations New Castle County, Delaware; Delaware Department of Transportation: Dover, DE, USA, 2016.
  69. Visual Crossing Corporation Weather Data Services | Visual Crossing. Available online: https://www.visualcrossing.com/weather/weather-data-services# (accessed on 26 May 2022).
  70. Rezatofighi, H.; Tsoi, N.; Gwak, J.; Sadeghian, A.; Reid, I.; Savarese, S. Generalized Intersection over Union: A Metric and A Loss for Bounding Box Regression. arXiv 2019, arXiv:190209630 Cs. [Google Scholar]
  71. Wu, Y.; Lin, Y.; Zhou, Z.; Bolton, D.C.; Liu, J.; Johnson, P. DeepDetect: A Cascaded Region-Based Densely Connected Network for Seismic Event Detection. IEEE Trans. Geosci. Remote Sens. 2019, 57, 62–75. [Google Scholar] [CrossRef] [Green Version]
  72. He, J.; Erfani, S.; Ma, X.; Bailey, J.; Chi, Y.; Hua, X.-S. Alpha-IoU: A Family of Power Intersection over Union Losses for Bounding Box Regression. arXiv 2022, arXiv:211013675 Cs. [Google Scholar]
  73. Montgomery, D.C. Design and Analysis of Experiments, 10th ed.; Wiley: Hoboken, NJ, USA, 2019; ISBN 978-1-119-49244-3. [Google Scholar]
  74. Moore, D.S.; Notz, W.I.; Flinger, M. The Basic Practice of Statistics, 9th ed; Macmillan Learning for Instructors, 2021; ISBN 978-1-319-34463-4. Available online: http://web.ntpu.edu.tw/~hlw/Notes/bps3ed/bps_ch17.pdf (accessed on 26 May 2022).
  75. Ott, R.L.; Longnecker, M.T. An Introduction to Statistical Methods and Data Analysis, 7th ed.; Cengage Learning: South Melbourne, Australia, 2015; ISBN 978-1-305-26947-7. [Google Scholar]
  76. ASTM D4788-03; Standard Test Method for Detecting Delaminations in Bridge Decks Using Infrared Thermography. ASTM: West Conshohocken, PA, USA, 2022.
  77. Washer, G.; Fenwick, R.; Nelson, S.; Rumbayan, R. Guidelines for Thermographic Inspection of Concrete Bridge Components in Shaded Conditions. Transp. Res. Rec. 2013, 2360, 13–20. [Google Scholar] [CrossRef]
  78. Washer, G.; Fenwick, R.; Bolleni, N. Effects of Solar Loading on Infrared Imaging of Subsurface Features in Concrete. J. Bridge Eng. 2010, 15, 384–390. [Google Scholar] [CrossRef]
Figure 1. Research framework.
Infrastructures 07 00163 g001
Figure 2. Level-set method mechanism. Modified from [24].
Infrastructures 07 00163 g002
Figure 3. Level-set method application framework.
Infrastructures 07 00163 g003
Figure 4. Slab dimensions.
Infrastructures 07 00163 g004
Figure 5. Mimicked slab during the data collection process.
Infrastructures 07 00163 g005
Figure 6. Numerical simulation framework.
Infrastructures 07 00163 g006
Figure 7. Temperature and solar radiance trends for the 24 June 2021, in Newark, Delaware [67].
Infrastructures 07 00163 g007
Figure 8. Field data collection location: (a) Apple Rd bridge; Bridge ID: 1696-360; GPS location: 39°40′44.1″ N 75°45′50.5″ W, (b) US-77 Bridge, Bridge ID: S077-05693R; GPS location: 40°44′23.9″ N 96°43′00″ W.
Infrastructures 07 00163 g008
Figure 9. Temperature and solar radiance data for data collection day of Apple Rd bridge (30 July 2021) Newark, Delaware [67].
Infrastructures 07 00163 g009
Figure 11. IoU analysis IRT results of data collected on the 24 June 2021.
Infrastructures 07 00163 g011
Figure 12. Highlighted simulation results of the slab experiment.
Infrastructures 07 00163 g012
Figure 13. The slab case IoU vs. time.
Infrastructures 07 00163 g013
Figure 14. Thermal contrast during a day.
Infrastructures 07 00163 g014
Figure 15. Delaware bridge level-set thermal image results with a boundary threshold of 0.4.
Infrastructures 07 00163 g015
Figure 16. Nebraska bridge level-set thermal image result. (a) results of the consumer-grade camera with a boundary threshold of 0.3 (Partially adopted and modified from [31]), (b) results of the research-grade camera (Adopted and modified from [24]).
Infrastructures 07 00163 g016
Table 1. Specification comparison between cooled and uncooled thermal cameras.
Thermal CameraDetector TypeThermal Sensitivity (K)Resolution (Pixels)Spectral Range (µm)Scene Range (°C)Temperature Accuracy (°C)Weight (kg)Cost
DJI Zenmuse XTVOx Microbolometer±0.05640 × 5127.5–13.5−25 to 135±200.27Low–Medium
FLIR A8300Indium Antimonide (InSb)±0.021280 × 7203.0–5.0−20 to 350±2 [53]4.54 [19]High
Table 2. Datasets and validation methods.
DatasetValidation Method
Outdoor experiment *Current literature accuracies and numerical simulation [24]
Transient numerical simulation *Current literature accuracies [24]
Apple Rd bridge (Delaware)Hammer-sounding
US-77 bridge (Nebraska) *Hammer-sounding, core sampling,
and research-grade thermal camera dataset
* Intersection over union (IoU) was calculated (see Section 3.6).
Table 3. RGB cameras specifications.
RGB CameraSize (mm)Imaging
Sensor (mm)
Image Resolution (pixels)Focal Range (mm)ISO RangeSpectral BandsWeight (kg)
Zenmuse X375 × 95 × 105CMOS 6.17 × 4.54000 × 30003.6100~3200RGB or
Converted-NIR
0.215
Zenmuse X5120 × 135 × 140CMOS 18 × 13.54608 × 3456Variable100~25,600RGB or
Converted-NIR
0.530
Table 4. Drone specifications.
DroneSize (mm)Hovering Accuracy (m) *Max Flight Time (min)Maximum Weight
of Payload (kg)
Weight (kg)
DJI Inspire 1438 × 451 × 301V: ±0.5, H: ±2.5183.53.06
M600 Pro1668 × 1518 × 727V: ±0.5, H: ±1.5165.510
* V: Vertical, H: Horizontal.
Table 5. Boundary conditions of the model.
ParameterUnitValue
Ambient Air Temperature°CDEOS [67]
Film CoefficientW/m2/K5
Latitude and Longitude-39°40′ N, 75°45′ W
Solar Flux ConstantW/m2350
Table 6. Model summary of IoU vs. temperature and solar radiance.
VariableTemperature (°C)Solar Radiance (W·m−2)
R2 (coefficient of determination)0.5590.705
p-Value1.74 × 10−51.54 × 10⁻⁷
Table 7. The Nebraska bridge inspection result: IoU values of both consumer and research-grade thermal cameras.
Thermal CameraIoU
Cooled research-grade thermal camera (FLIR A8300sc)0.4462 [24]
Uncooled consumer-grade thermal camera (DJI Zenmuse XT)0.3923
Publisher’s Note: MDPI stays neutral with regard to jurisdictional claims in published maps and institutional affiliations.

