Article

Field Experiment for a Prequalification Scheme for a Distribution System Operator on Distributed Energy Resource Aggregations

1
Research Institute, Korea Electric Power Corporation, Daejeon 305-760, Republic of Korea
2
Electronic and Electrical Engineering, Hongik University, 94, Wausan-ro, Mapo-gu, Seoul 04066, Republic of Korea
*
Author to whom correspondence should be addressed.
Designs 2023, 7(6), 134; https://doi.org/10.3390/designs7060134
Submission received: 6 November 2023 / Revised: 13 November 2023 / Accepted: 15 November 2023 / Published: 17 November 2023

Abstract

:
The purpose of this paper is to summarize and share the field experiment results of KEPCO’s project consortium to create a TSO-DSO-DERA interaction scheme. The field experiment was conducted based on the prequalification algorithm proposed in previous research from the same consortium, and was designed to verify the validity of the algorithm under realistic grid conditions. In addition, during the course of the field experiment, it was found that points that were missed or not given much importance in the existing prequalification algorithm could affect the completeness of the overall system, and then practical improvements were made to improve this. The demonstration results confirm that the proposed algorithm is effective in real-world grid environments and can help DSOs to ensure the reliability of the distribution system while supporting DERA’s participation in the wholesale market using the proposed prequalification scheme.

1. Introduction

In order to drive cost-effective investment in distribution grids while increasing shares of renewable energy, authorities and utilities are exploring ways to increase hosting capacities using connect-and-manage connection arrangements or non-wire alternatives with battery storage [1]. In the past, traditional connect-and-forget connection arrangements have been based on a worst-case scenario, with limited hosting capacities that would not cause a problem without any operational action. However, recent changes in grid connection policy have led to a situation in which distribution system operators (DSOs) are forced to actively take operational measures in the event of distribution constraints, even though this allows for more renewable energy to be accommodated in the same line capacity.
Meanwhile, regulators around the world are considering ways to increase the visibility of distributed energy resources (DERs) and integrate them into the governance of wholesale markets by providing higher levels of economic compensation to DERs that contribute to the grid and improve system reliability [2,3,4]. This work contains ideas for institutionalizing participation in wholesale electricity markets by aggregating many small DERs that physically connect the distribution grid through new market participants such as distributed energy resource aggregators (DERAs) or virtual power plants (VPPs). This research was motivated by the fact that the space in which DERAs are financially re-warded is the wholesale market at the transmission level, but the resources they manage are widely physically distributed throughout the distribution grid. If enough DERs are connected to the grid to potentially cause distribution constraints, and there is interest in participating in the wholesale market through a DERA, the DSO needs to prequalify the DERA’s bidding actions. The prequalification process allows for DSOs to receive DERA’s day-ahead and real-time market bids in advance, review them for potential grid constraint events, and implement a system where only bids that pass the process are forwarded to the wholesale market. In the absence of such a system, DERA may act only to maximize revenue in the wholesale market, without considering distribution constraints, causing a situation where the reliability of the distribution grid is significantly threatened.
Previous studies have implemented and studied various forms of such schemes. In one study, the DSO calculated power flows based on the VPP’s bids and responded by performing grid reconfiguration if it anticipated a constraint problem. If there was still a problem, it calculated the sensitivity of each VPP’s resources and the scale of the violation and delivered it to the VPP. The VPP would then adjust their scheduling and submit it to the DSO. This case is characterized by the utilization of a periodic rolling horizon update method to respond to future uncertainties [5]. Another study proposed a scheme in which the DSO and transmission system operator (TSO) each operated their own balancing market. DER bids went directly to the TSO market bids if they did not cause problems on the distribution grid, and if they did, they were cleared within the DSO’s balancing market first and the adjusted bids went to the TSO market [6]. On the other hand, refs. [7,8] pro-posed a system for DSOs to verify the bids of DERAs based on robust optimization to handle uncertainties in generation and load. These two papers are unique in that they pro-pose an interaction scheme with a design based on the legal authority of each entity in the real world, and they present the idea of converting robust optimization based on chance-constrained optimization into a cooperative solution based on linearized information exchange between entities. In the most recent work, the DSO calculates and communicates the expected distribution system constraints according to the VPP’s bidding plan, and the VPP also estimates its own distribution system constraints based on multiple scenario forecasts, and utilizes them in actual operations. In this paper, the process of the DSO communicating distribution system constraints to the VPP occurs only once and does not include an iteration process [9].
In addition to the above theoretical research, field experiments are also being con-ducted in various countries. The EU’s SmartNet project sought to design an optimized interaction scheme between TSO-DSOs and proposed five representative TSO-DSO coordination schemes: a centralized AS market model, local AS market model, shared balancing responsibility model, common TSO-DSO AS market model, and integrated flexibility market model [10]. OMI Polo Español S.A., an electricity market operator in Iberia, con-ducted the IREMEL project to define the operating model for the regional electricity market and to design and demonstrate mechanisms to address distribution system constraints that arise from the participation of distributed resources in the wholesale market [11]. The COOIDINET project in Spain, Sweden, and Greece is a demonstration of DSOs and TSOs working together to implement a cooperative system in a reliable and efficient manner. In the project, a TSO-DSO cooperation system was designed in which congestion management in the distribution system was first addressed at the local DSO level, with priority access to local flexibility resources, and only unused bids were forwarded to the higher-level system operator [12]. These demonstration projects took into account the market rules and power industry structure in each jurisdiction in which the demonstration was conducted.
In Korea, a demonstration study of the TSO-DSO-DERA coordination scheme was conducted from August 2019 to August 2023, led by KEPCO, considering the current Korean power industry structure and market rules. In particular, this project focused on the interaction between DSO and DERAs who want to participate in the TSO market, and demonstrated a prequalification scheme for two distribution lines of KEPCO. The references [7,8] are the deliverables from this demonstration project. In addition to the day-ahead prequalification, this project also included a demonstration of the direct control scheme of the DSO in a real-time situation, which is beyond the scope of this paper and is not described. This paper aims to summarize and share practical algorithm improvements and the lessons learned based on the algorithm in the previous study in [7], as well as validation through real-world demonstration sites.
In Section 2, the roles and responsibilities of relevant actors in the proposed scheme are presented. Section 3 and Section 4 describe the overall scheme of the proposed prequalification process and details of the internal prequalification algorithm of DSO, respectively. Section 5 provides the results of the field experiment of the prequalification scheme on the real demonstration sites in Korea. Section 6 presents the concluding remarks of this study.

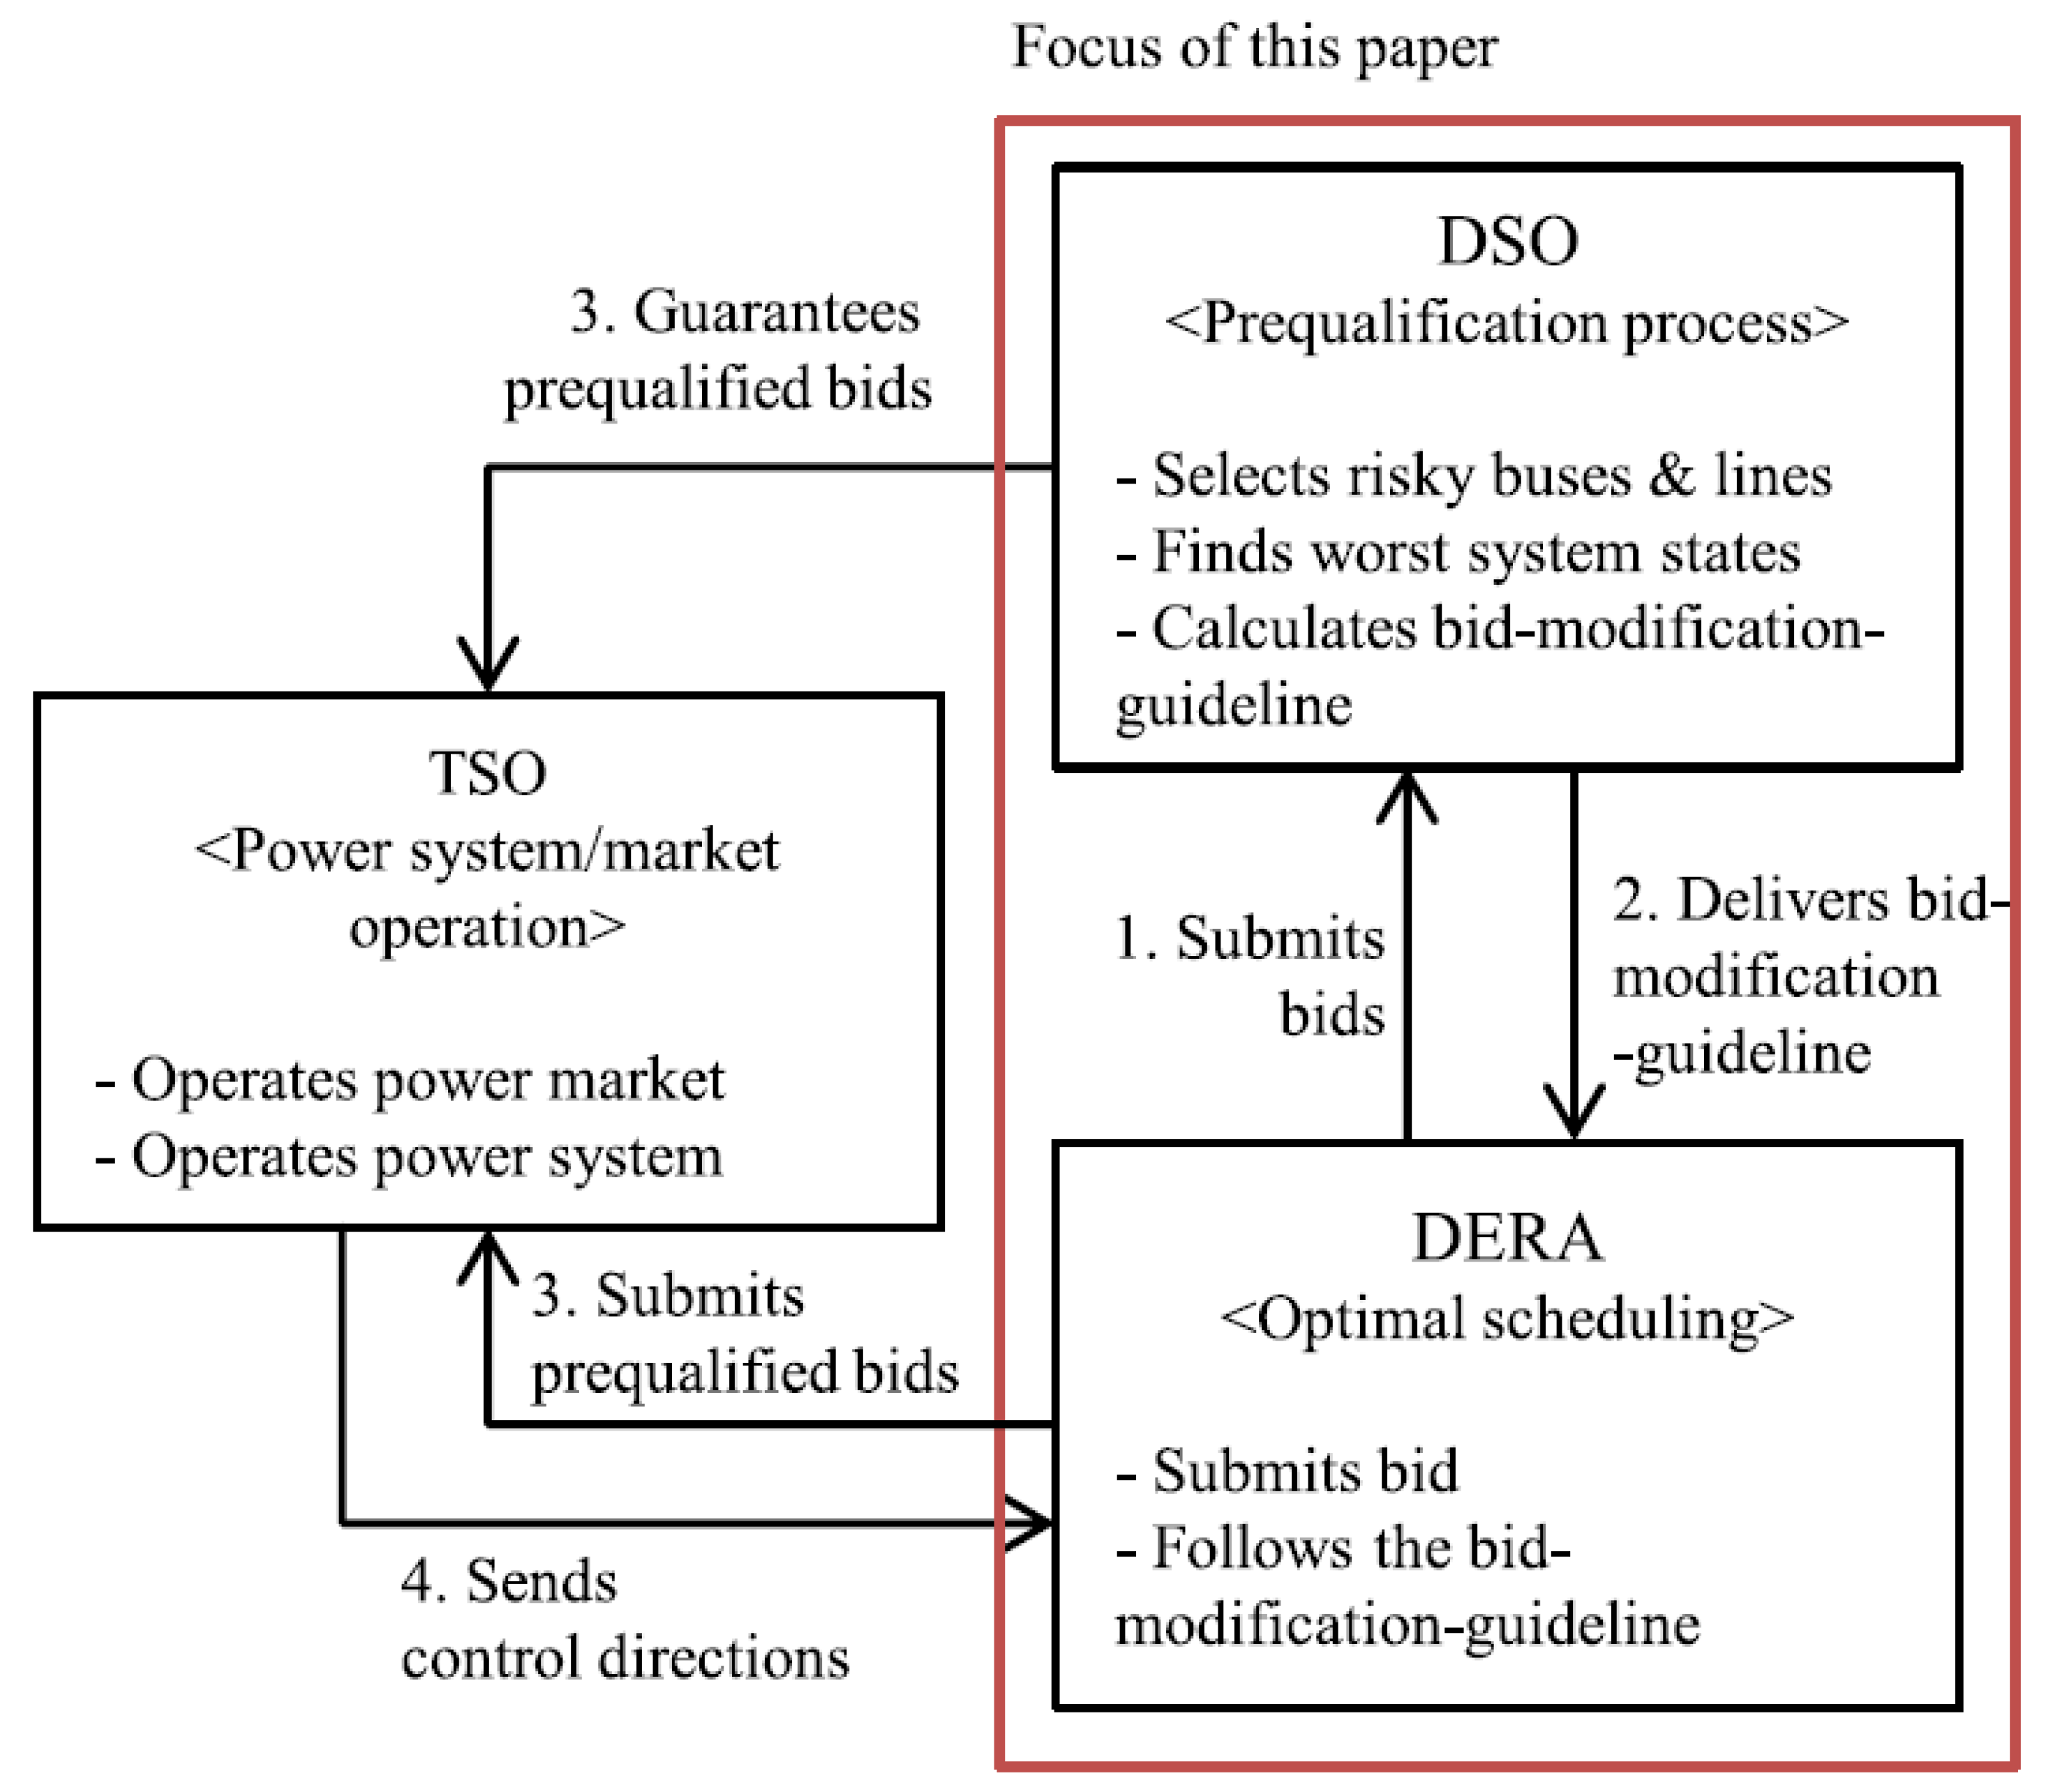
2. Roles and Responsibilities of Relevant Actors

In this section, we describe the roles and responsibilities of each actor involved in the DSO prequalification scheme assumed in this study. This can be depicted as shown in Figure 1.
The governance and actor-specific roles and responsibilities assumed in this study are not based on an exploration of all the theoretically possible cases, as in other previous studies, but rather on the premise of minimal effort to remain as much as possible within the current structure and the recently revised laws and regulations.
In Korea, the DSO, the entity that actually implements and operates the prequalification scheme, is the state-owned power company, KEPCO. It directly operates transmission, distribution, and sales businesses and has six power generation companies as subsidiaries with a portfolio of large traditional power generation sources [13].
Individual arrangements for output control between the DERs or DERAs representing them and DSOs are needed to resolve the potential distribution constraints caused by DERs.
Because DERA is a private entity that recruits DERs to directly participate in the wholesale market and earn revenue, it is not responsible for the reliability of the distribution or transmission grid; however, through the national grid code and the network access agreement with KEPCO, it can be disconnected due to the decision of a certain TSO or DSO if it threatens the reliability of the network. From DERA’s perspective, it has a motivation to coordinate with DSOs to trade-off the risk of total disconnection for the bounded risk of partial curtailment.
In South Korea, the Korea Power Exchange (KPX) operates the wholesale market and transmission system, similar to independent system operators in the United States. They are not directly responsible for coordinating and managing the distribution system constraints caused by DERs unless the constraints extend to transmission system issues, as the Electricity Business Act delegates operational responsibility for power systems below 154 kV to KEPCO. This situation in Korea can be seen in Table 1.

3. The DSO’s Overall Prequalification Scheme for the Market Participation of DERA

The DSO prequalification module designed in the demonstration project interacts with DERA’s bidding module, as shown in Figure 2. Before the DERA submits a bid to the wholesale market, it requests a prequalification procedure for the bid to the DSO, and the DSO’s prequalification module uses an internal algorithm to review the potential constraints of the distribution system based on the expected generation of the DER under the DERA’s bid.
Here is a breakdown of the entire process, as shown in the figure above.
(1) 
Submission of initial bids to DSO by DERA
The DERA submits bids to the DSO prior to its participation in the wholesale market between 00:00 and 09:00 on D-1. The DERA determines and submits initial energy and reserve bids based on the generation forecast of the DERs managed by itself and its bidding strategy. It is allowed to continuously modify the bids during these hours.
(2) 
Execution of the internal prequalification algorithm of DSO
The proposed day-ahead prequalification algorithm is executed as a module of the DSO’s internal distribution operation system. The algorithm is completed within 15 min, between 09:00 and 09:15 on D-1. The algorithm performs a robust optimization by considering the initial bids submitted by DERAs, the load of each distribution node predicted by the DSO itself, and the forecast error range of each node. The DSO performs the optimization with the goal of maximizing the sum of the DERAs’ 24 h generation in order to minimize the output curtailment of the DERAs. The result of the algorithm is the maxi-mum biddable capacity of the DERs at each node and the upper and lower bounds of the biddable output for storage resources. The resulting bid modification guideline values are passed to the DERA. The DERA is obliged to comply with the modification guidelines for bids that are determined to threaten the reliability of the distribution system according to the grid access agreement with the DSO.
(3) 
Iteration of DERA’s bid modification and DSO’s re-prequalification under the bid modification guidelines
The DERA will modify the output setpoints of each resource in light of the bid modification guidelines received from the DSO and resubmit them to the DSO. The first modified bid submission will take place during D-1 09:15–09:30, and the corresponding prequalification algorithm will take place between 09:30 and 09:45. The second modified bid submission will take place between D-1 09:45 and 10:00, and the corresponding prequalification algorithm will take place between D-1 10:00 and 10:15. Since the second modified bid submission is the third bid submitted by the DERA, if it does not pass prequalification by this time, the DSO will be forced to apply the last provided bid modification guidelines to end the process. This is because, due to time constraints in real-world systems’ operation, it is not possible to provide an infinite number of chances, so in this demonstration study, we set a total of three chances, including the initial bidding after trial and error. This can be customized according to the market operation timeline of each jurisdiction applying prequalification.
(4) 
Qualified DERA bids enter the existing transmission-level wholesale market
Qualified bids will be delivered to the transmission-level wholesale market as the one of the bids from conventional market participants.

4. Efficient DSO Prequalification Algorithm Based on Robust Optimization

In this section, we detail the formulation of the prequalification and the algorithm to solve it efficiently, based on a robust optimization approach, so that the DSO can support the market participation of DERAs while maintaining the reliability of the distribution system. For this purpose, we use the following nomenclature in Table 2.

4.1. Original Formulation for Prequalification

We assumed that the distribution grid had the following three properties:
  • DSOs are regulated entities and strive to be neutral, and as public entities, they strive to maximize social welfare;
  • The load is inflexible and is supplied with electricity at a fixed tariff. It is important to note that this is not very different from the actual empirical environment in Korea;
  • Only DERs based on renewable energy sources with zero-marginal-cost characteristics are connected to the distribution grid, and they are also price-takers.
According to the first property, the basic objective function of DSO can be formulated as social welfare maximization. If we restrict a region of the distribution system under the DSO’s jurisdiction to one ecosystem, the social welfare of this ecosystem can be expressed as the sum of the surplus of customers and producers. In this environment, consumer surplus is invariant with respect to the amount of electricity generation because the second property assumes that customers are price-takers and not price-responsive. Producers’ surplus is constrained by the physical environment of the distribution grid, and their sur-plus can be maximized by generating as much as possible under these constraints. Considering the uncertainty inherent in the output of DERs, the social welfare maximization problem in this environment can be formulated as a chance-constrained problem with the following equations, as has already been presented in [7]:
max X E i G p ~ g , i
subject to
p ~ g , i = p g , i · ξ g , i ,   i G
q ~ g , i = q g , i · ξ g , i ,   i G
P ~ d , i = P ¯ d , i · ξ d , i ,   i N
Q ~ d , i = Q ¯ d , i · ξ d , i ,   i N
P r v i ( ξ ) V ¯ 1 ϵ ,   i N 1
P r s f , l ( ξ ) 2 S ¯ 2 f , l 1 ϵ ,    i L
G p g , q g , v i ξ , s f , l ξ , x ξ , ξ 0
H p g , q g , v i ξ , s f , l ξ , x ξ , ξ = 0
Assume that p g and q g are the optimal solution of Equation (1); then, we can obtain ξ , i and ξ , l , which can maximize v i ξ and s f , l ξ , respectively. p g and q g will satisfy the chance-constraints Equation (1f,g). Then, in this optimal case, the chance constraints can be rewritten into a deterministic form, which can be presented in Equation (2):
v i ( ξ ) V ¯ ,   i N 1
s f , l ( ξ ) 2 S ¯ 2 f , l ,   i L
The essence of the algorithm proposed in reference [7] is that a simple examination of the overvoltage and overflow cases is sufficient to find a solution that is close to the optimal solution of Equation (1). The bus voltages in the grid are positively correlated with each other, and so are the line flows on each line. This has been proven in section V-D of [7]. Applying this tendency, we can find the worst overvoltage case ξ v ,   r s k by finding the scenario that maximizes the sum of the voltages of each risky bus for N r s k , the set of buses that are likely to exceed the constraint, and the worst overflow case ξ f ,   r s k by finding the scenario that maximizes the sum of the usage rates for L r s k . The same principle can be applied to the undervoltage. Once the power generation vectors of each node corresponding to ξ v ,   r s k and ξ f ,   r s k have been determined, the effect of the change in the active and reactive power of each node on the voltage of each node, the change in the line flow of each line around these values can be formulated as a linear approximation using the sensitivity matrix from the power flow equation, and this approximation can be substituted into Equation (2) to find the bid-modification guideline, which is the active and reactive power setpoint for each node that does not exceed the constraints of the distribution system. This idea is the main finding of reference [7]. Using this idea, Ref. [7] tackles a complex full robotization problem like Equation (1), but instead of solving a complex problem, they propose an efficient algorithm that consists of a series of simple computations to obtain the desired solution.

4.2. Efficient Prequalification Algorithm Implemented in the Field Experiment

In this paper, we adapted the algorithm from reference [7] for the field experiment and summarized it using step-by-step formulas. The specific differences from the previous paper are summarized in the Section 4.3.
  • Step 1: Selection of risky nodes and lines
The DSO conducts a power flow calculation of the distribution system under its jurisdiction, based on the bidding information submitted by DERA and the own-load forecast of the DSO. From the results of the power flow calculation, the risky set is determined by determining which lines exceed the overvoltage/undervoltage risk threshold or the reverse/forward overflow risk threshold.
θ 1 s = 0 ,   v 1 s = 1
p i s = v i s j N v j s G i j cos θ i j s + B i j sin θ i j s ,    i N
q i s = v i s j N v j s G i j sin θ i j s B i j cos θ i j s ,    i N
p f , l s = v i s v j s G i j cos θ i j s + B i j sin θ i j s G i j v i s 2 ,    i , j = l L
q f , l s = v i s v j s G i j sin θ i j s B i j cos θ i j s + B i j v i s 2 ,    i , j = l L
s f , l s 2 = p f , l s 2 + q f , l s 2 ,    l L
p i s = t G i p g , t s P ¯ d , i ,    i N
q i s = t G i q g , t s Q ¯ d , i ,    i N
N r s k _ o v v s = b r s k s | b r s k s = arg max b N v b s v ¯ ,    v b s v s X P F s ,   s s
( N r s k _ u d v s = b r s k s | b r s k s = arg min b N v b s v ¯ ,    v b s v s X P F s ,   s s
L r s k _ u o f s = l r s k s | l r s k s = arg max l L s f , l s S ¯ f , l S ¯ f , l ,    s f , l s s s X P F s ,   s s , p f , l s R  
L r s k _ d o f s = l r s k s | l r s k s = arg max l L s f , l s S ¯ f , l S ¯ f , l ,    s f , l s s s X P F s ,   s s , p f , l s R +  
  • Step 2: Exploration of the worst-case scenario considering uncertainty ranges
The DSO considers the forecast error of DERs and loads, and the amount each DER responds to the frequency control signal from the TSO. For each of the four cases, overvoltage, undervoltage, reverse overflow, and forward overflow, the worst-case scenario is explored, in which each value of the risky nodes and lines within the considered uncertainty ranges causes the greatest violation of grid constraints.
max X V _ OV s i N r s k _ o v v s v i s
subject to
(3a–3c)
1 σ d , i l o w ξ d , i s 1 + σ d , i h i g h ,    i N
1 t G i R i p g , t s σ g , i l o w + t R i r d , t s t G i p g , t s ξ g , i s 1 + t G i R i p g , t s σ g , i h i g h + t R i r u , t s t G i p g , t s ,    i N
p i s = ξ g , i s t G i p g , t s P ¯ d , i ξ d , i s ,    i N
q i s = ξ g , i s t G i q g , t s Q ¯ d , i ξ d , i s ,    i N
min X V _ UV s i N r s k _ u d v s v i s
subject to
(3a–3c, 5b–5e)
max X F _ UF s l L r s k _ u o f s s f , l s 2 / S ¯ f , l 2
subject to
(3a–3f, 5b–5e)
max X F _ DF s l L r s k _ d o f s s f , l s 2 / S ¯ f , l 2
subject to
(3a–3f, 5b–5e)
  • Step 3: Check of grid constraint violation
The DSO verifies that no grid constraints are violated in all worst-case scenarios found in Step 2. If any violations have occurred, go to Step 4; if none exist, go directly to Step 6.
O V i s = v i s v ¯ ,    i N , v i s v s X V O V s
U V i s = v _ v i s ,    i N , v i s v s X V _ U V s
U F l s = s f , l s s S ¯ f , l 2 ,    l L , s f , l s s f s X F _ U F s
D F l s = s f , l s s S ¯ f , l 2 ,    l L , s f , l s s f s X F _ D F s
max O V s ϵ V
max U V s ϵ V
max U F s ϵ F
max D F S ϵ F
  • Step 4: Calculation of the sensitivity matrix of each DERA and allocation of violation information
The DSO calculates the sensitivity matrix regarding the impacts of DERs on each node and line for each worst-case scenario. Based on this information, the DSO allocates the violation information to each DERA.
θ 1 s v 1 s = J p θ s x J p v s x J q θ s x J q v s x 1 x = X V _ O V s p 1 s q 1 s = S n o θ p s x S n o v p s x S n o θ q s x S n o v q s x p 1 s q 1 s
θ 1 s v 1 s = J p θ s x J p v s x J q θ s x J q v s x 1 x = X V _ U V s p 1 s q 1 s = S n o θ p s x S n o v p s x S n o θ q s x S n o v q s x p 1 s q 1 s
S n u s p , l , k s = s f , l 2 p k = 2 p f , l s p f , l p k + q f , l s q f , l p k x = X F _ U F s ,    l L
S n u s q , l , k s = s f , l 2 q k = 2 p f , l s p f , l q k + q f , l s q f , l q k x = X F _ U F s ,    l L
S n d s p , l , k s = s f , l 2 p k = 2 p f , l s p f , l p k + q f , l s q f , l p k x = X F _ D F s ,    l L
S n d s q , l , k s = s f , l 2 q k = 2 p f , l s p f , l q k + q f , l s q f , l q k x = X F _ D F s ,    l L
O V i s = a A O V i , a s ,    i N
U V i s = a A U V i , a s ,    i N
U F l s = a A U F l , a s ,    l L
D F l s = a A D F l , a s ,    l L
O V i , a s = O V i s A l l c o v , i , a s a A A l l c o v , i , a s ,    i N
U V i , a s = U V i s A l l c u v , i , a s a A A l l c u v , i , a s ,    i N
U F l , a s = U F l s A l l c u f , l , a s a A A l l c u f , l , a s ,    l L
D F l , a s = D F l s A l l c d f , l , a s a A A l l c d f , l , a s ,    l L
A l l c o v , i , a s = j N S n o v p , i , j s t G j a p g , t s ,    i N , a A
A l l c u v , i , a s = j N S n u v p , i , j s t G j a p g , t s ,    i N , a A
A l l c u f , l , a s = j N S n u s p , l , k s t G k a p g , t s ,    l L , a A
A l l c d f , l , a s = k N S n d s p , l , k s t G k a p g , t s ,    l L , a A
  • Step 5: Calculation of maximum allowable bids based on sensitivity matrix and constraints violations
This step calculates the maximum allowable bids for each DERA, taking into account the sensitivity of the DERs calculated in Step 4 and the scale of the constraint violations distributed among the DERAs. The objective function of the DERA is set to minimize the difference between the initial bid and the revised bid based on the iterative process.
O V i , a s j N S n o v p , i , j s t G j a p g , t s ¯ + S n o v q , i , j s t G j a q g , t s ,    i N
O V i , a s j N S n o v p , i , j s t G j a p g , t s _ + S n o v q , i , j s t G j a q g , t s ,    i N
U V i , a s j N S n u v p , i , j s t G j a p g , t s ¯ + S n u v q , i , j s t G j a q g , t s ,    i N
U V i , a s j N S n u v p , i , j s t G j a p g , t s _ + S n u v q , i , j s t G j a q g , t s ,    i N
U F l , a s k N S n u s p , l , k s t G k a p g , t s ¯ + S n u s q , l , k s t G k a q g , t s ,    l L
U F l , a s k N S n u s p , l , k s t G k a p g , t s _ + S n u s q , l , k s t G k a q g , t s ,    l L
D F l , a s k N S n d s p , l , k s t G k a p g , t s ¯ + S n d s q , l , k s t G k a q g , t s ,    l L
D F l , a s k N S n d s p , l , k s t G k a p g , t s _ + S n d s q , l , k s t G k a q g , t s ,    l L
min X bm s t G a S a p g , t i n i p g , t s + q g , t i n i q g , t s + m t S a p g , t i n i p g , t s + q g , t i n i q g , t s + t R a r u , t i n i r u , t s + r d , t i n i r d , t s
subject to
(16)
p g , t s ¯ = p g , t s + r u , t s , t R a p g , t s , t G a R a
p g , t s _ = p g , t s r u , t s , t R a p g , t s , t G a R a
p g , t s ¯ = p g , t s 1 ¯ + p g , t s ¯ ,    t G a
p g , t s _ = p g , t s 1 _ + p g , t s _ ,    t G a
p g , t i n i ¯ P _ g , t u g , t s p g , t s ¯ p g , t i n i ¯ + P ¯ g , t u g , t s ,    t G a
p g , t i n i ¯ P _ g , t u g , t s p g , t t _ p g , t i n i ¯ + P ¯ g , t u g , t s ,    t G a
q g , t i n i Q _ g , t u g , t s q g , t s q g , t i n i + Q ¯ g , t u g , t s ,    t G a
max p g , t s ¯ , p g , t s _ 2 + q g , t s 2 P ¯ g , t 2 ,    t G a
q g , t s p g , t s tan cos 1 p f _ ,    t G a
p g , t s , a b p g , t i n i p g , t s ,    t G a
p g , t s , a b p g , t i n i + p g , t s ,    t G a
q g , t s , a b q g , t i n i q g , t s ,    t G a
q g , t s , a b q g , t i n i + q g , t s ,    t G a
r u , t s , a b r u , t i n i r u , t s ,    t R a
r u , t s , a b r u , t i n i + r u , t s ,    t R a
r d , t s , a b r d , t i n i r d , t s ,    t R a
r d , t s , a b r d , t i n i + r d , t s ,    t R a
q g , t s tan cos 1 p f _ tan cos 1 p f _ 2 + 1 1 p g , t s ¯ P ¯ g , t ,    t G a
q g , t s tan cos 1 p f _ tan cos 1 p f _ 2 + 1 1 p g , i s _ + P ¯ g , t ,    t G a
q g , t s p g , t s tan cos 1 p f _ , i f   p g , t s 0 p g , t s tan cos 1 p f _ , o t h e r w i s e ,    t G a
q g , t s p g , t s tan cos 1 p f _ ,    t G a S a
p g , t s = p s t , t s , d c h p s t , t s , c h ,    t S a
q g , t s = q s t , t s , d c h q s t , t s , c h ,    t S a
p s t , t s , d c h P ¯ g , t v s t , t s ,    t S a
p s t , t s , c h P ¯ g , t 1 v s t , t s ,    t S a
q s t , t s , d c h p s t , t s , d c h tan cos 1 p f _ ,    t S a
q s t , t s , c h p s t , t s , c h tan cos 1 p f _ ,    t S a
min X bid s t G a S a p g , t s , a b + q g , t s , a b + m t S a p g , t s , a b + q g , t s , a b + t G a r u , t s , a b + r d , t s , a b
subject to
(16, 17b–17h, 18, 19, 21–23)
  • Step 6: Check the convergence of modified bids
This step checks that the bid value is not too different from the bid value of the previous iteration if it passed the criteria in Step 3. Since the power flow equation is nonlinear and we consider it by linearizing it in the form of sensitivity, there may be an error from the actual optimal value. To reduce this, the following iteration step is performed:
max p g , t s ¯ p g , t s 1 ¯ | t G a ϵ B i d
max p g , t s _ p g , t s 1 _ | t G a ϵ B i d
max q g , t s q g , t s 1 | t G a ϵ B i d
  • Step 7: Additional calculation of upper and lower bounds for outputs of storage resources
In this step, the DSO calculates and communicates to DERAs the upper and lower bounds of storage output that will not affect the reliability of the grid.
max p st ,   q st p st ,   q st t S a p s t , t
subject to
p s t , t = p g , t e n d + p s t , t ,    t S a
q s t , t = q g , t e n d + q s t , t ,    t S a
p g , t i n i ¯ P _ g , t + r d , t e n d p s t , t p g , t i n i ¯ + P ¯ g , t r u , t e n d ,    t S a
q g , t i n i Q _ g , t q s t , t q g , t i n i + Q ¯ g , t ,    t S a
O V i , a e n d j N S n o v p , i , j e n d t S j a p s t , t + S n o v q , i , j e n d t S j a q s t , t ,    i N
U V i , a e n d j N S n u v p , i , j e n d t S j a p s t , t + S n u v q , i , j e n d t S j a q s t , t ,    i N
U F l , a e n d k N S n u s p , l , k e n d t S k a p s t , t + S n u s q , l , k e n d t S k a q s t , t ,    l L
D F l , a e n d k N S n d s p , l , k e n d t S k a p s t , t + S n d s q , l , k e n d t S k a q s t , t ,    l L
max p s t , t + r u , t e n d 2 , p s t , t r d , t e n d 2   + q s t , t 2 P ¯ g , t 2 ,    t S a
q s t , t p s t , t tan cos 1 p f _ ,    t S a
q s t , t tan cos 1 p f _ tan cos 1 p f _ 2 + 1 1 p s t , t + r u , t e n d P ¯ g , t ,    t S a
q s t , t tan cos 1 p f _ tan cos 1 p f _ 2 + 1 1 p s t , t r d , t e n d + P ¯ g , t ,    t S a
p s t , t = p s t , t d c h p s t , t c h ,    t S a
q s t , t = q s t , t d c h q s t , t c h ,    t S a
p s t , t d c h P ¯ g , t v s t , t ,    t S a
p s t , t c h P ¯ g , t 1 v s t , t ,    t S a
q s t , t d c h p s t , t d c h tan cos 1 p f _ ,    t S a
q s t , t c h p s t , t c h tan cos 1 p f _ ,    t S a
A flow chart representation of the entire algorithm from step 1 to step 6 is shown in Figure 3.

4.3. Improvements in the Implemented Algorithm Compared to Previous Work

This demonstration study tried to improve some settings and shorten the execution time of the proposed algorithm in the previous theoretical studies through trial and error in the practical implementation. In this section, we will express and explain the meaning of the additions for each group of formulas in the previous section compared to that of the algorithm in [7].
  • Equations (4b,d), (6), (8), (9b,d) and (10b,d)
When selecting cases that exceed the risk criteria, overvoltage, undervoltage, reverse overcurrent, and forward overcurrent are all checked by adding Equation (4b,d).
  • Equation (5c)
While the previous algorithm in [7] treated the participation of DERs in ancillary services as an uncertainty for the DSO, this study changes the formula to consider the reserve bidding as well as the uncertainty of DERs.
  • Equations (13a–d), (14a–d), (15a–d) and (16a–h)
During the course of the demonstration project, the DERAs participating in the demonstration claimed that if too much discretion is given to them, this will entail high costs and project management uncertainty in the project’s early stages, and that they preferred a bid-modification guideline in the form of a range of absolute output values provided by the DSO. This allowed for the iteration process to proceed but limited the information exchanged by modifying the initial algorithm to a range of absolute output values in a matrix. In addition, while the original study only considered a single DERA, we added formulas to distribute the information in the case of multiple DERAs by calculating their contribution to the number of violations.
  • Equation (17a–j)
When the DERA has storage and strategically intends to reduce its output at a certain time and increase its sales at another time, the DSO makes a decision regardless of the DERA’s intention. This was a violation of the DERA’s free-will and discretion, so we added the above equations to modify the prequalification to best honor the DERA’s strategy in the original bid.
  • Equations (18a–h), (19a–d), (20a,b), (21a,b), (22a–d), (23a–d) and (24)
In this paper, auxiliary variables were used to linearize the objective function and conditional constraints in absolute value form in the DSO control procedure, and the power factor operating ranges of the DERs were linearized to avoid considering regions that cannot be solved in the first place. These measures were taken to improve the speed of the algorithm during the validation process.
  • Equation (25a–c)
In addition, the real-world demonstration results showed that the process of calculating corrective bids in the algorithm did not converge and oscillated, with large deviations in value, so we added a function that finds a corrective bid that does not cause a violation and terminates itself when this happens.
  • Equations (26a–k), (27a–d), (28a–d) and (29a–d)
We devised a method that allows for the DERA to schedule storage resources for its own benefit but allows for DSOs to calculate and communicate the upper and lower biddable output limits in a contextualized manner that does not threaten the grid.

5. Results of Field Experiment

We conducted a demonstration using a real distribution line as the target site to verify the validity of the proposed prequalification scheme. In this section, we describe the configuration of the demonstration site and show that the proposed scheme works well in the real world through the demonstration results.

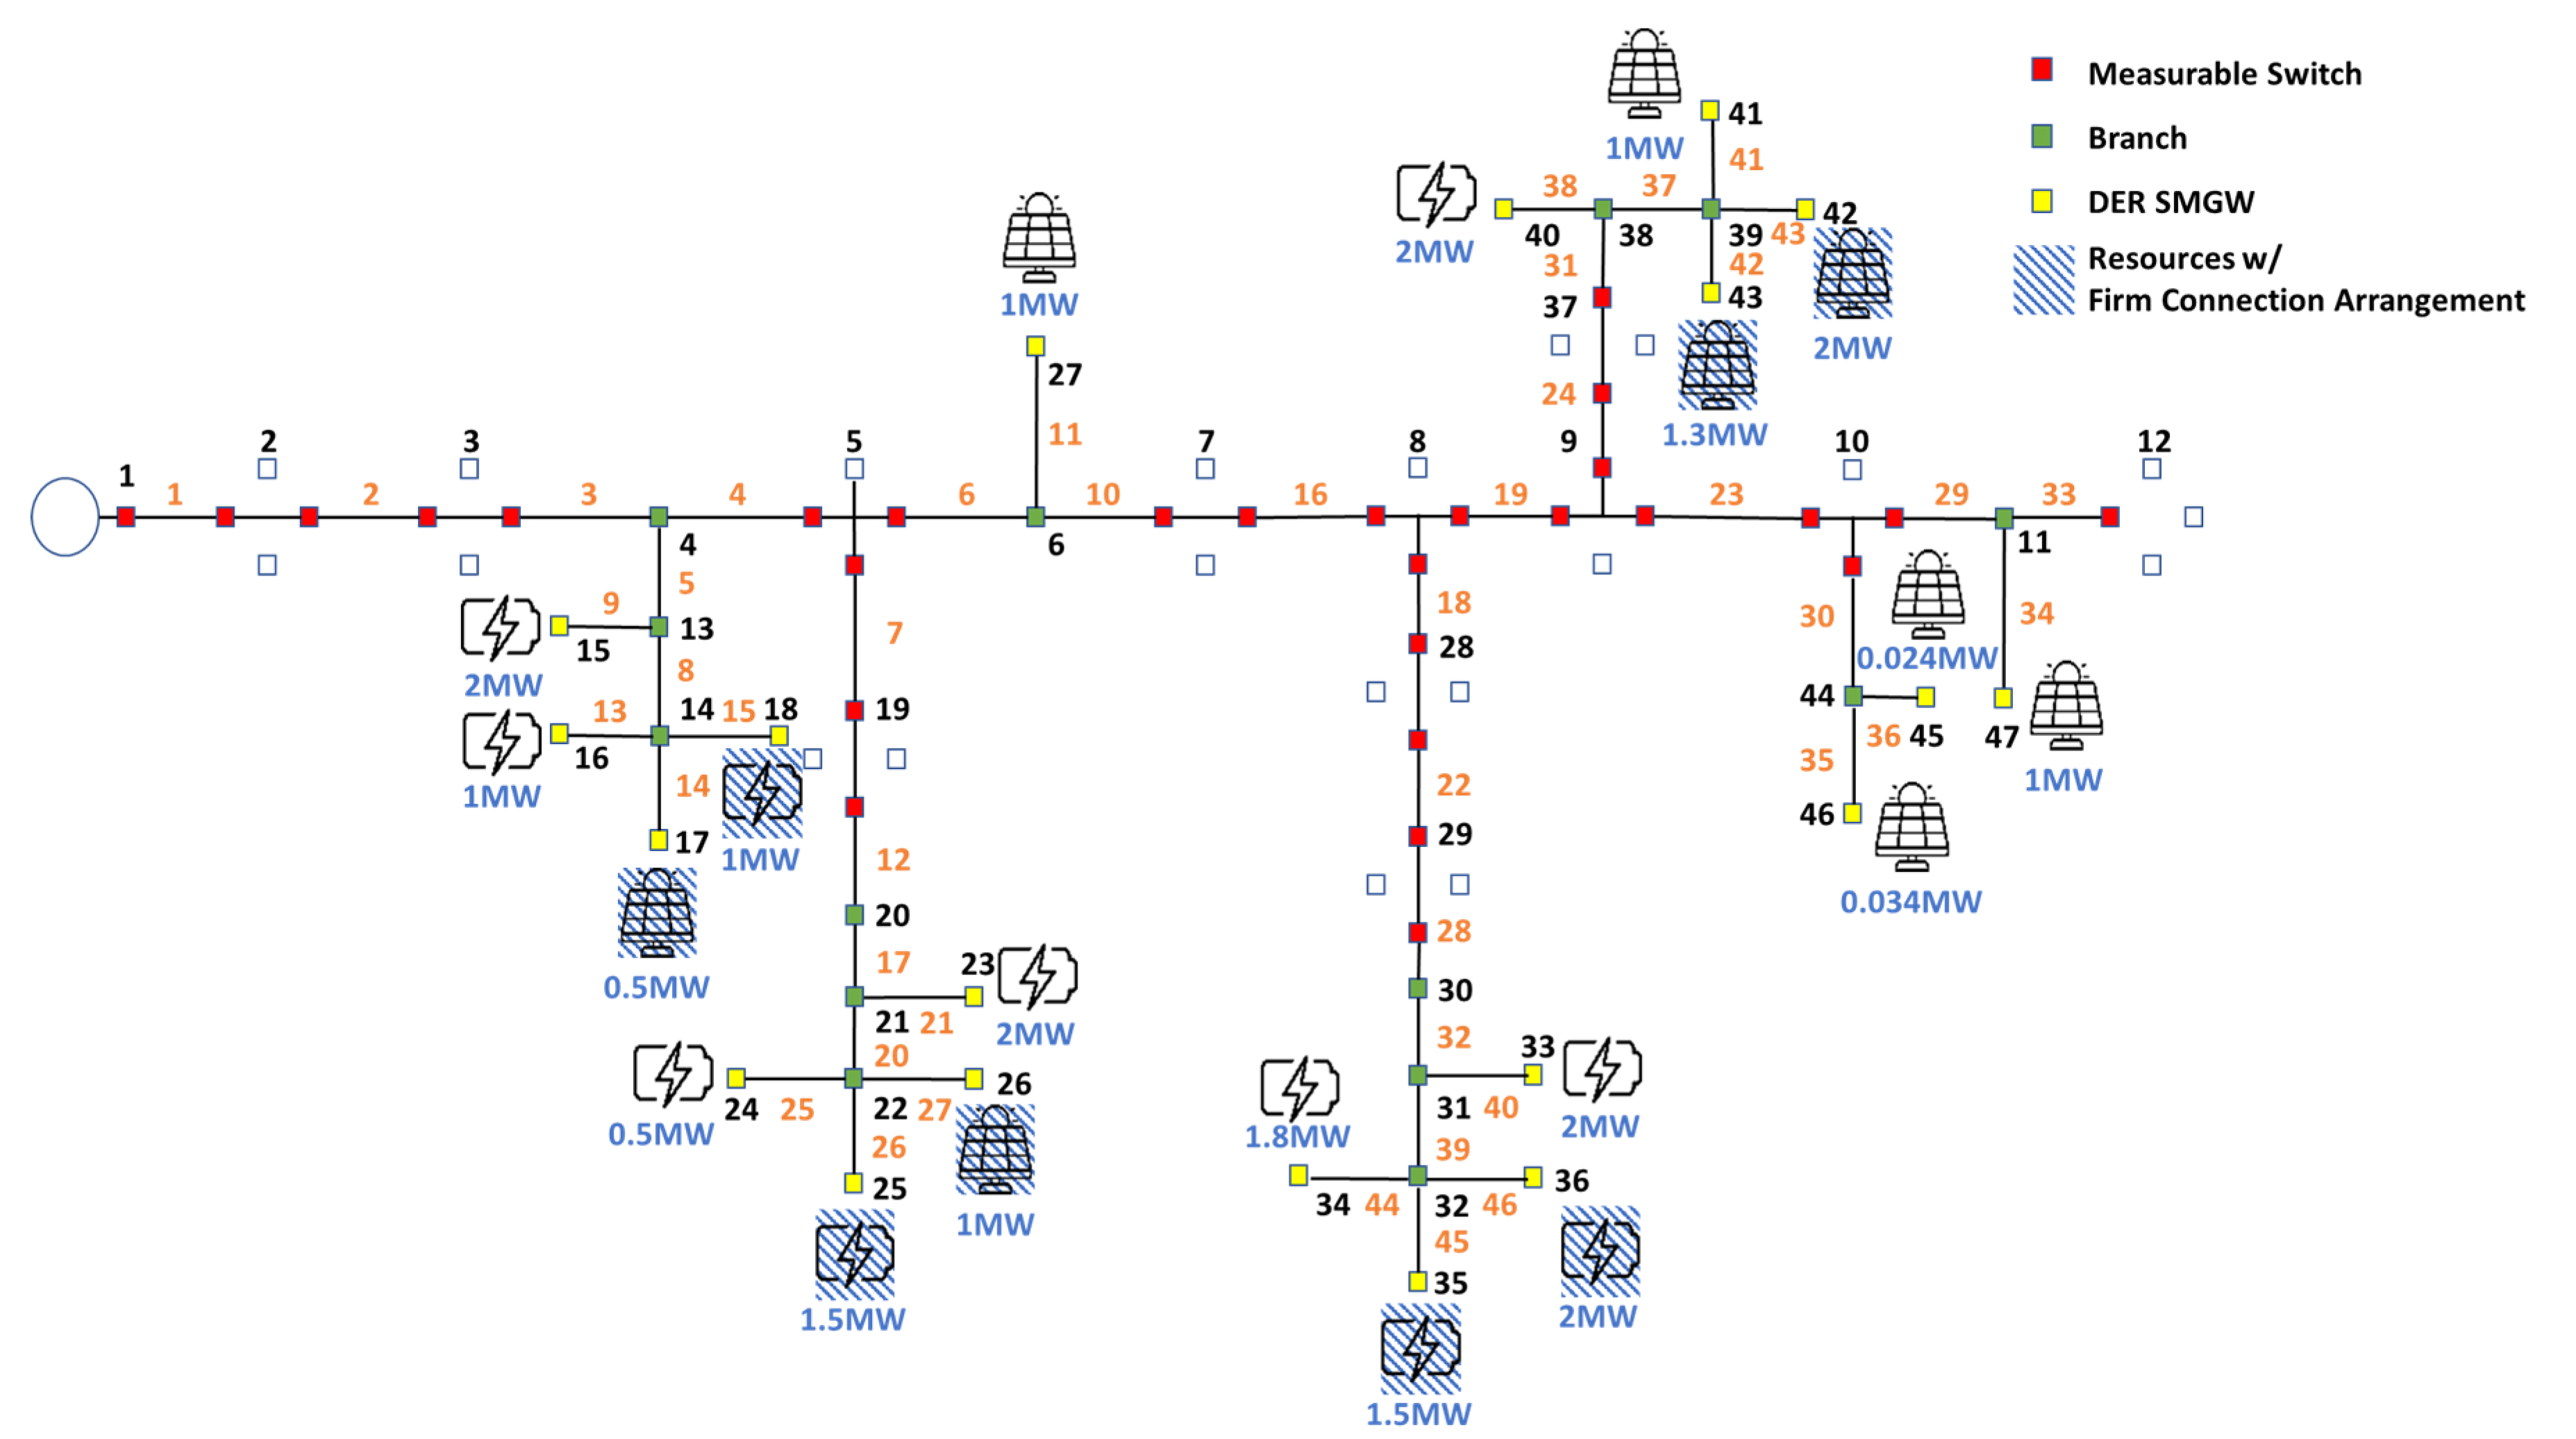
5.1. System Configurations

The demonstration was conducted on 22.9 kV lines named Oh-ryong D/L and Cheong-sa D/L in the city of Gwangju, Korea. The grid diagrams of these D/L are shown in Figure 4 and Figure 5. There are 7.858 MW of photovoltaic system (PV) connected to Oh-ryong D/L, of which 4.8 MW are already under firm-connection arrangements with KEPCO and cannot be contractually controlled. These resources are shown in the grid diagram with a dotted line. In addition, a total of 17.3 MW/69.2 MWh of energy storage system (ESS) is connected, of which 6 MW/24 MWh are not participating in the demonstration, and have existing contractual charge and discharge scheduling arrangements with the utility.
There is 2.117 MW of the photovoltaic system (PV) connected to Cheong–sa D/L, of which 2.5 MW is already under firm-connection arrangements with KEPCO and cannot be contractually controlled. These resources are shown in the grid diagram with a dotted line. In addition, a total of 18.2 MW/73 MWh of energy storage system (ESS) is connected, of which 2.5 MW/10 MWh does not participate in the demonstration and has existing contractual charge and discharge scheduling arrangements with the utility.
These resources are also shown on the grid map with oblique lines on the item. If all the connected PV and ESS were to fully output, the total generation of D/L would exceed the capacity of 10 MW, which could potentially result in a grid constraint violation. This situation is not allowed under KEPCO’s existing connection regulations, but we temporarily set it up like this for the demonstration purposes. As there was no device to measure the output of each DER, the voltage of the point, and the phase angle, or to deliver the information to the operating system, this project installed smart meter gateway devices in the yellow-colored part of the grid map and collected the information.

5.2. Scenario Configuration

First, it was assumed that only one DERA was participating in the prequalification that took place the day before. This was necessary because only one entity was involved in the project as the DERA. This DERA wanted to bid on the wholesale market using its contracted DERs, and before doing so, it submitted its bid information to the DSO for prequalification to ensure that this did not cause problems with the reliability of the distribution system. The missed resources, which are marked in the oblique lines in Figure 4 and Figure 5, and are not included in this scheme, are recognized as negative loads.
In this study, we show the operation results for 24 h on a sunny day in the winter season during the demonstration period. On that day, the net-load of the entire D/L had the following pattern when measured at node 1 in the network shown in the following Figure 6, and the solar power generation had the pattern shown in the following Figure 7.
In this situation, the DERA, which wanted to participate in the wholesale market by aggregating the resources existing in this system, acted according to the procedure described in Section 3 of this paper.
The scheme proposed in this study takes a robust approach to manage the uncertainty of load and generation, with 5% uncertainty from the day-ahead forecast values, and the robustness of the scheme is verified by the actual load and generation realized in the real-time operation stage. As a constraint of the distribution system, we set criteria to keep the voltage between 0.95 p.u. and 1.05 p.u. Additionally, in step 1 of Section 4, which selects the risky bus and risky line, the voltage was less than or equal to 0.96; more than 1.04 was needed to select the risky bus, and the voltage was more than 60% of the line capacity before selecting the risky line. These appropriate criteria were established after a significant amount of trial and error.

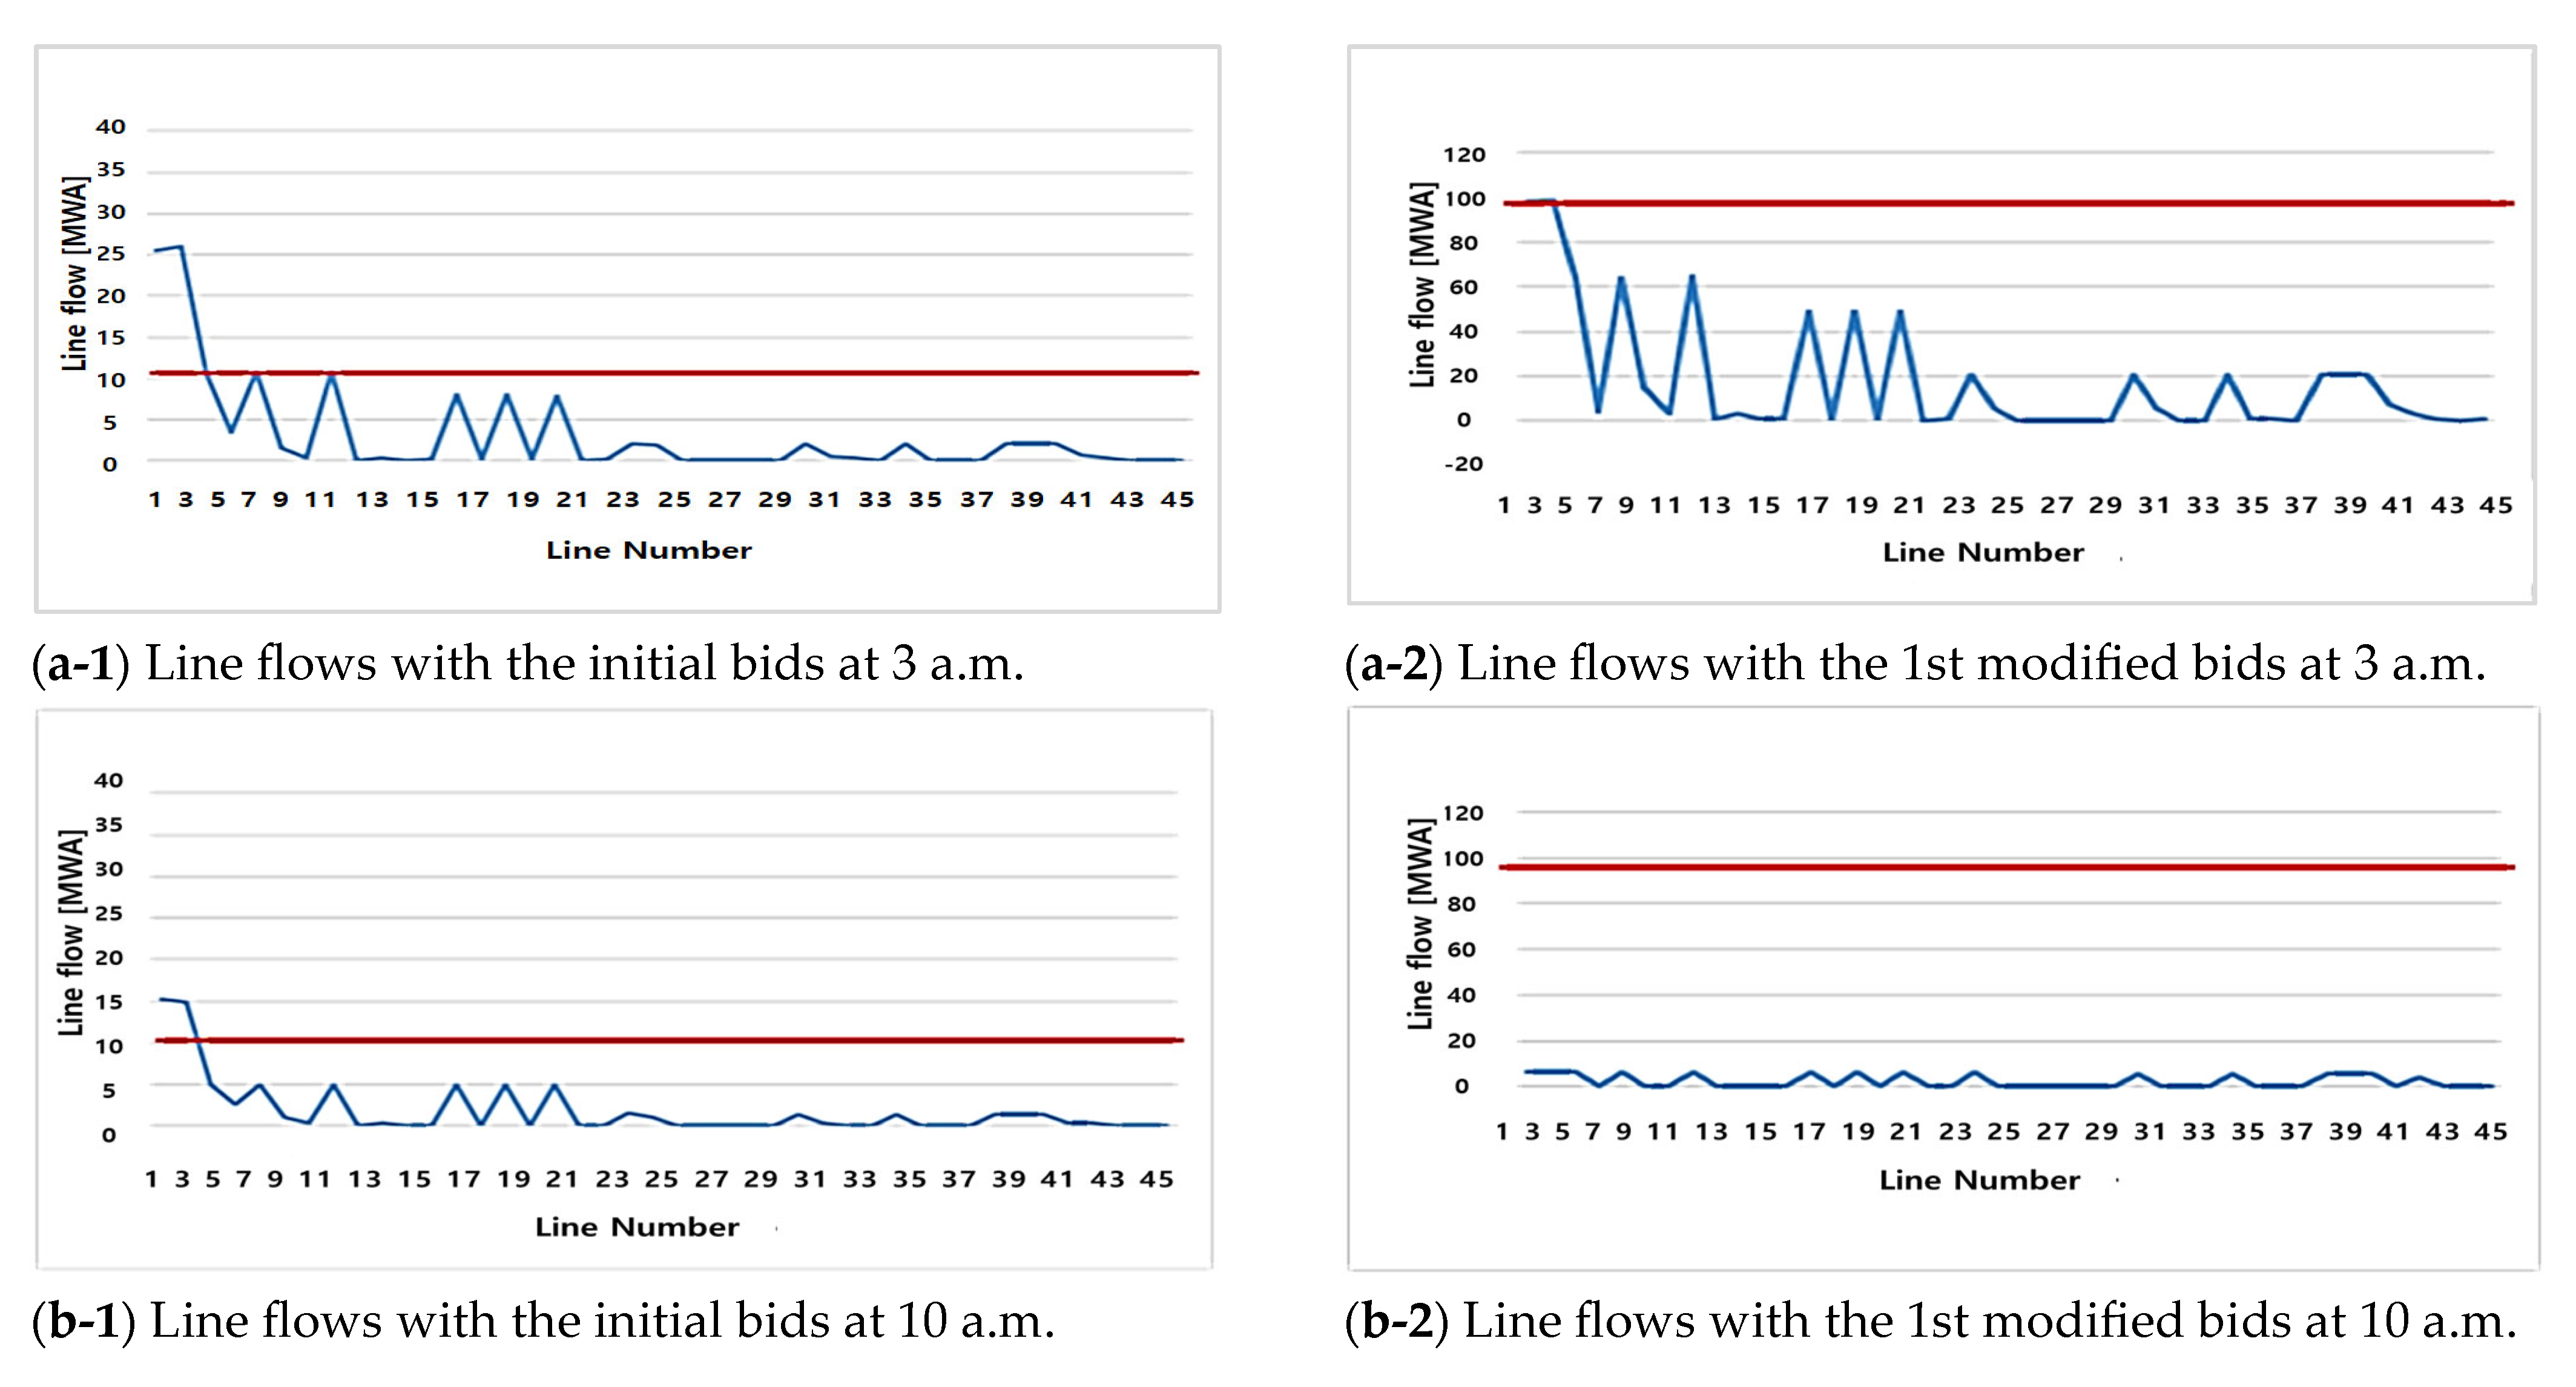
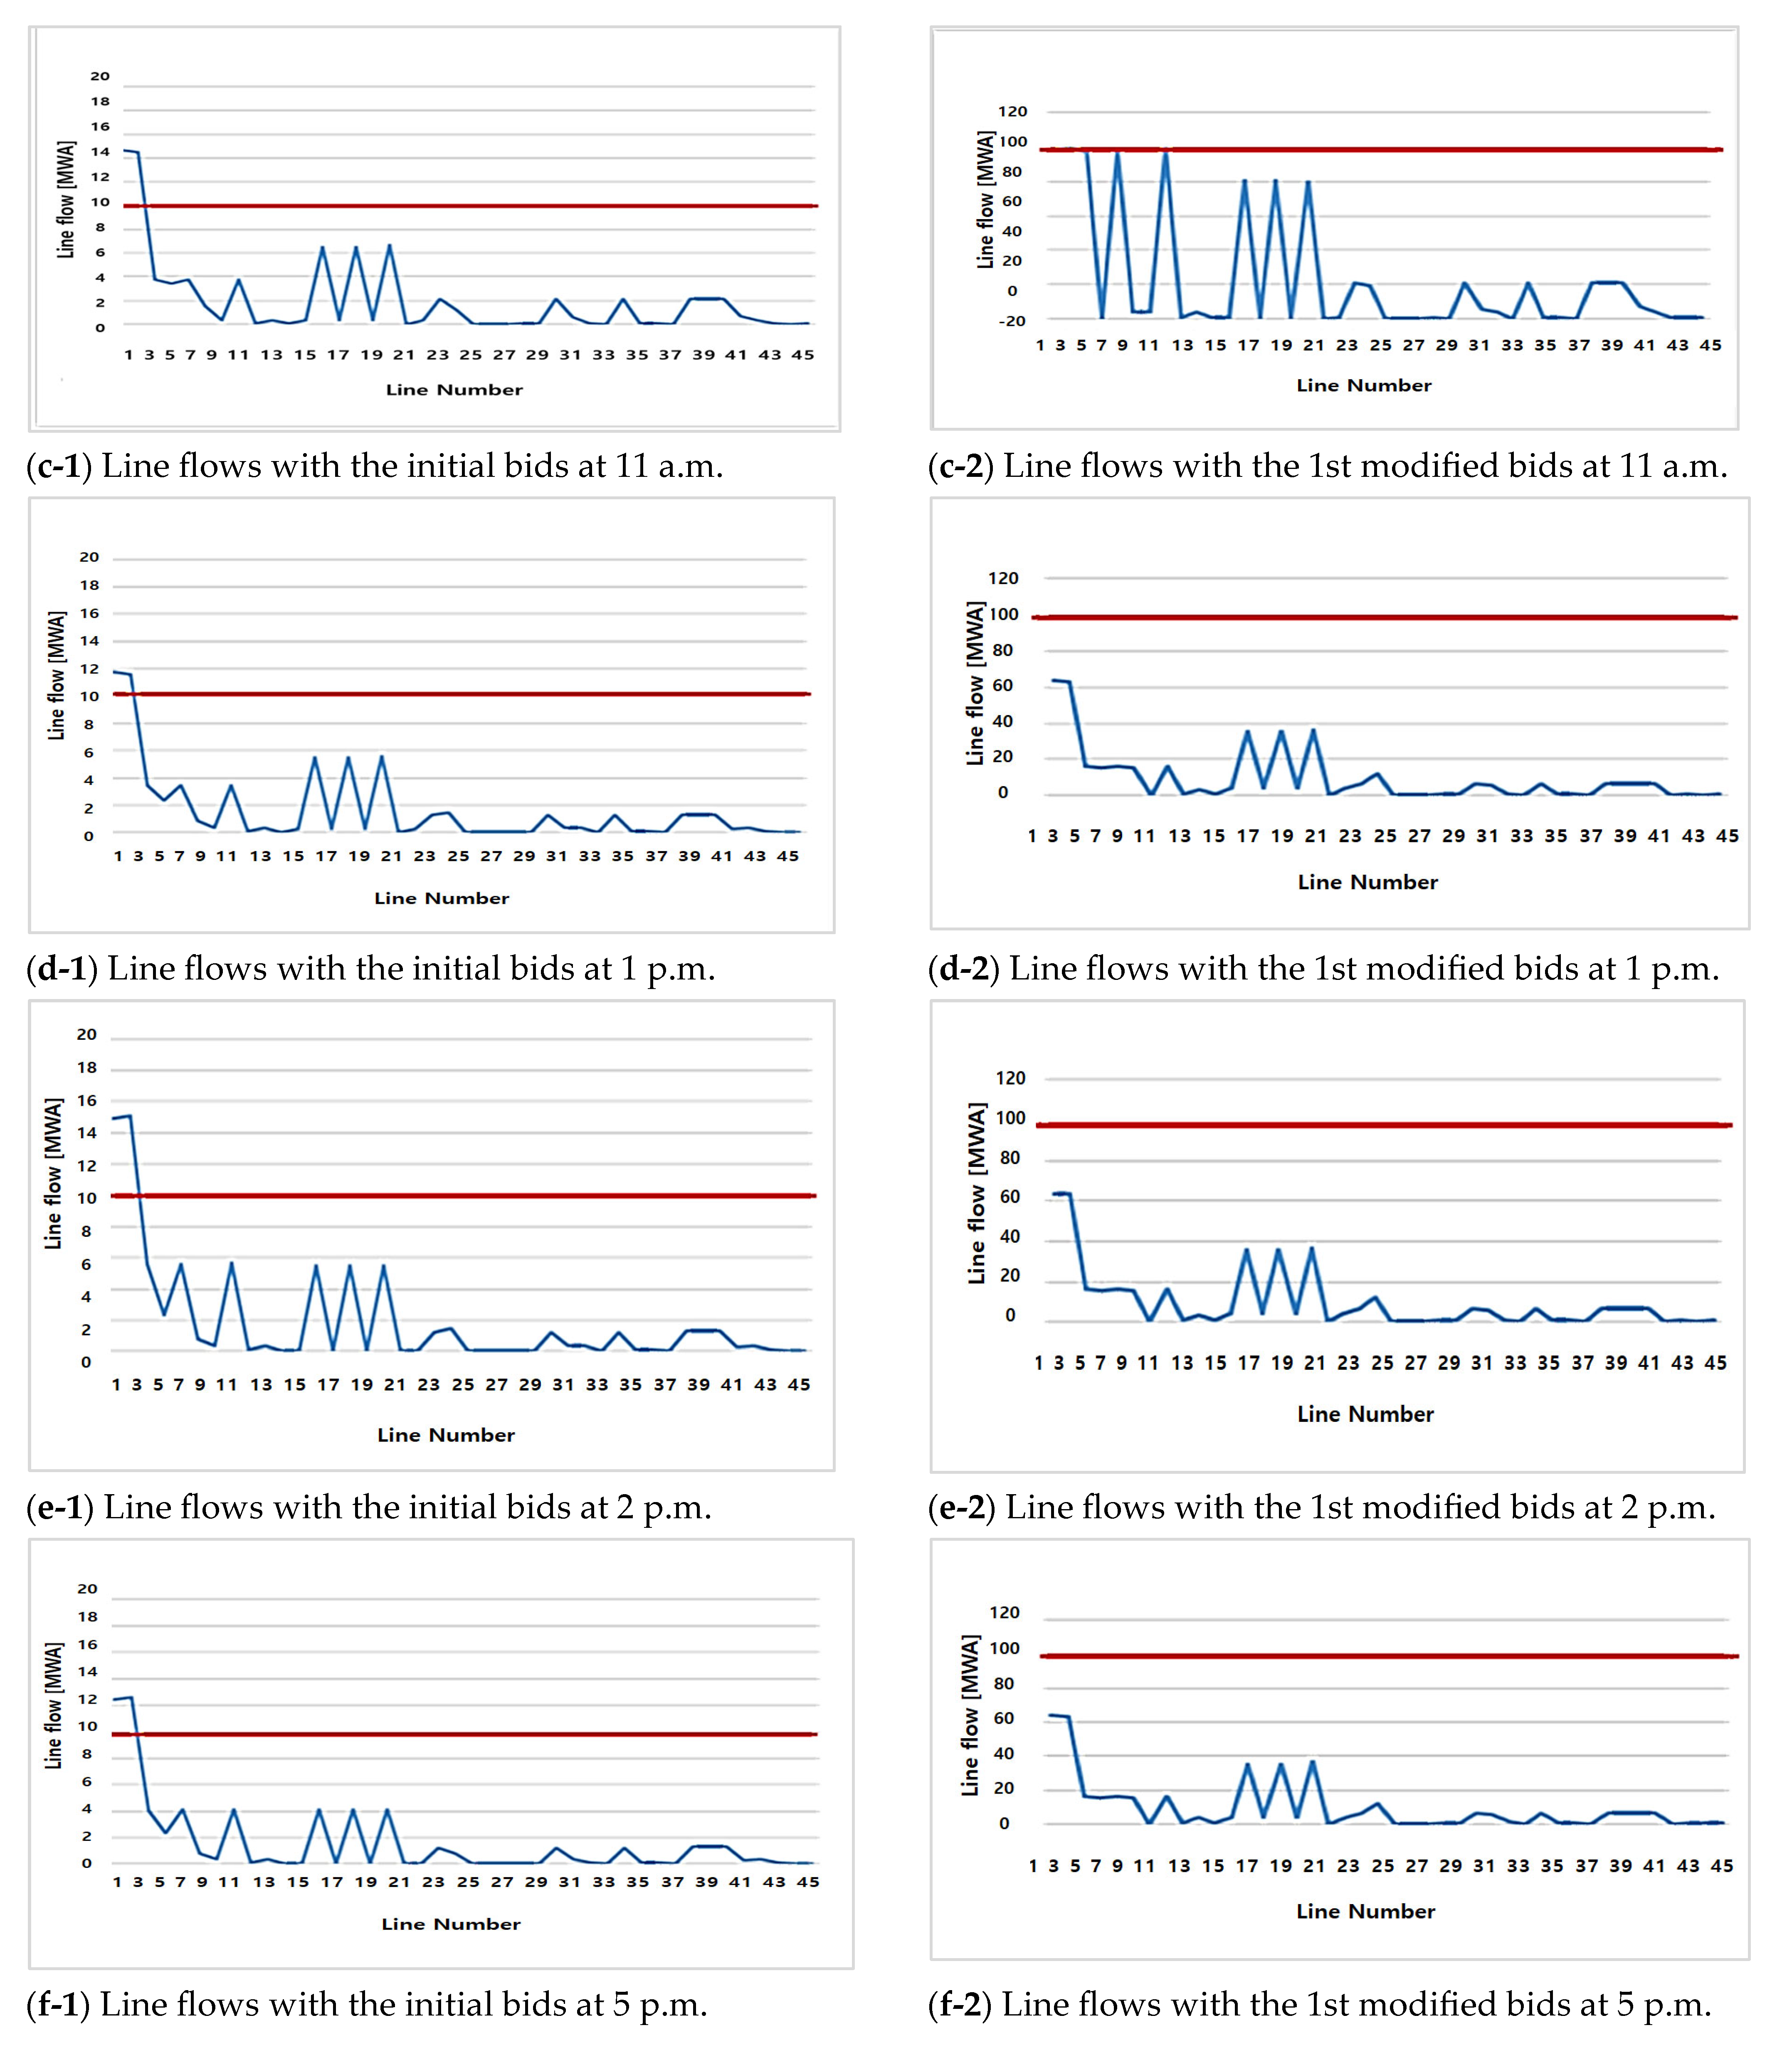
5.3. Verification of the Proposed Scheme

For the Oh–ryong D/L, out of the total 24 h of the prequalification scheme operation, we show the results for 3 a.m., 10 a.m., 11 a.m. and 5 p.m., when constraint violations occurred due to DERA’s initial bids, for voltages or line flows, respectively.
It can be seen from Figure 8 that the site did not experience any explicit voltage violations from the initial bids for these four time slots, guidelines were communicated to resolve possible constraints on line flows, and the DERA responded with modified bids, resulting in a margin on the voltage side. The red line in Figure 8 is the voltage limit range, and the blue line is the voltage of each node.
However, as shown in Figure 9, the initial bids of the DERA were analyzed to cause line flow violations in all four time slots. The result at 3 a.m. was a forward overflow and all other time slots showed reverse overflows. The DSO predicted this situation in advance through the prequalification algorithm proposed in this paper and provided bid modification guidelines to DERA. This information was provided to the DERA in the form of the guidelines shown in Table 3, and the DERA modified its bid within the ranges presented in the guidelines and resubmitted it to the DSO. The result was that all constraints were resolved in the next iteration, as shown in Figure 9. The red line in Figure 9 is the distribution line flow limit range, and the blue line is the line flow of each node.
In the Cheong–sa D/L, out of the total 24 h of the prequalification scheme operation, we will show the results for 3 a.m., 10 a.m., 11 a.m., 1 p.m., 2 p.m., 5 p.m. and 6 p.m., when constraint violations occurred due to DERA’s initial bids, for voltages or line flows, respectively.
It can be seen from Figure 10 that the site did not experience any explicit voltage violations from the initial bids for these four time slots, that guidelines were communicated to resolve possible constraints on line flows, and the DERA responded with modified bids, resulting in a margin on the voltage side. The red line in Figure 10 is the voltage limit range, and the blue line is the voltage of each node.
However, as shown in Figure 11, the initial bids of the DERA were analyzed to cause line flow violations in all seven time slots. The result was that all constraints were resolved in the next iteration, as shown in Figure 11. The red line in Figure 11 is the distribution line flow limit range, and the blue line is the line flow of each node.
Through this process, the DERA was validated by the DSO so that its bid did not threaten the reliability of the distribution grid. What we wanted to verify through this demonstration was whether the overall algorithm results could ensure the reliability of the distribution system in a real system, and whether the interaction process between DSO and DERA could be completed within a limited time. It can be concluded that satisfactory results were obtained for the above situations.

6. Conclusions

This paper aims to summarize and share the demonstration result of KEPCO’s project consortium to create a TSO-DSO-DERA interaction system. It describes the process of improving the theoretical algorithm proposed in papers [7,8] to apply to the actual demonstration site and verification through actual field experiments.
In the process of the demonstration project, the roles and responsibilities of each assumed actor, in theory, did not change, but unlike the premise of the existing algorithm, which emphasizes DERA’s discretion, in reality, the DERA, which participated in the demonstration project, did not welcome too much discretion and information-sharing, which is an impressive lesson learned. Of course, this tendency is obviously due to the fact that such a system does not exist at present, and the relevant knowledge is in its infancy. In addition, it was not easy to achieve the same algorithm performance as in the lab test environment in the field environment, as expected, and to solve this problem, mathematically relaxing the non-linear components as much as possible and applying computational techniques for parallel processing according to time index played an important role.
Based on the results of the mentioned demonstration project, a new government-funded project has been launched to expand the application of D/L across Jeju-island in Korea and will utilize the lessons learned and research results derived from this study.

Author Contributions

J.-S.P. and B.-H.K. conceived and designed the experiments; J.-S.P. and B.-H.K. performed the simulation and the experiments; J.-S.P. analyzed the data; J.-S.P. and B.-H.K. wrote the paper. All authors have read and agreed to the published version of the manuscript.

Funding

This research was funded by Energy Technology Evaluation and Planning (KETEP) (grant number: RS-2023-00237679) in 2023.

Data Availability Statement

The authors hereby declares that the data presented in this study will be presented upon request from the corresponding author.

Acknowledgments

This work was supported by a Korea Institute of Energy Technology Evaluation and Planning (KETEP) grant funded by the Korean government (MOTIE) (No. RS-2023-00237679, Development of Demonstration Zone for New Electricity Service Model).

Conflicts of Interest

One of the authors comes from Research Institute, Korea Electric Power Corporation.

References

  1. Ismael, S.M.; Abdel Aleem, S.H.E.; Abdelaziz, A.Y.; Zobaa, A.F. State-of-the-ort of hosting capacity in modern power systems with distributed generation. Renew. Energy 2019, 130, 1002–1020. [Google Scholar] [CrossRef]
  2. US Federal Energy Regulatory Commission. FERC Order No. 2222: Participation of Distributed Energy Resource Aggregations in Markets Operated by Regional Transmission Organizations and Independent System Operators; US Federal Energy Regulatory Commission: Washington, DC, USA, 2020.
  3. The European Parliament and The Council of The European Union. Regulation (EU) 2019/943 of the European Parliament and of the Council of 5 June 2019 on the Internal Market for Electricity. Off. J. Eur. Union 2019, 158, 54–124. [Google Scholar]
  4. The European Parliament and The Council of The European Union. Directive (EU) 2019/944 of the European Parliament and of the Council of 5 June 2019 on common rules for the internal market for electricity and amending Directive 2012/27/EU. Off. J. Eur. Union 2019, 158, 125–199. [Google Scholar]
  5. Koraki, D.; Strunz, K. Wind and solar power integration in electricity markets and distribution networks through service-centric virtual power plants. IEEE Trans. Power Syst. 2018, 33, 473–485. [Google Scholar] [CrossRef]
  6. Edmunds, C.; Galloway, S.; Elders, I.; Bukhsh, W.; Telford, R. Design of a DSO-TSO balancing market coordination scheme for decentralised energy. IET Gener. Transm. Distrib. 2020, 14, 707–718. [Google Scholar] [CrossRef]
  7. Moon, H.S.; Jin, Y.G.; Yoon, Y.T.; Kim, S.W. Prequalification Scheme of a Distribution System Operator for Supporting Wholesale Market Participation of a Distributed Energy Resource Aggregator. IEEE Access 2021, 9, 80434–80450. [Google Scholar] [CrossRef]
  8. Jeong, C.M.; Kim, S.W.; Park, J.S.; Yoon, Y.T.; Moon, H.S. Robust prequalification process of a distributed system operator considering N-1 contingency. IET Renew. Power Gener. 2022, 16, 2694–2710. [Google Scholar] [CrossRef]
  9. Park, S.-Y.; Park, S.W.; Son, S.-Y. Optimal VPP operation considering network constraints uncertainty of DSO. IEEE Access 2023, 11, 8523–8530. [Google Scholar] [CrossRef]
  10. Gerard, H.; Rivero, E.; Six, D. Basic Schemes for TSO-DSO Coordination and Ancillary Services Provision—D 1.3. (Version 1.1). Available online: https://smartnet-project.eu/publications/index.html#tab-id-2 (accessed on 19 January 2017).
  11. Omie. Modelo de Funcionamiento de los Mercados Locales de Electricidad: Proyecto IREMEL. 2019. Available online: https://www.omie.es/sites/default/files/2019-12/modelo_de_funcionamiento_mercados_locales_electricidad_v2_0.pdf (accessed on 25 June 2019).
  12. Stevens, N.; Merckx, K.; Crucifix, P.; Gómez, I.; Santos-Mugica, M.; Díaz, Á.; Sanjab, A.; Kessels, K.; Rivero, E.; Mou, Y.; et al. D2.1—Markets for DSO and TSO Procurement of Innovative Grid Services: Specification of the Architecture, Operation and Clearing Algorithms. (Version 1.0). 2021. Available online: https://private.coordinet-project.eu/files/documentos/6033b5fe475cdCoordiNet_WP2_D2.1_Markets%20for%20DSO%20and%20TSO%20procurement%20of%20innovative%20grid%20services_V1.0_20.02.2021.pdf (accessed on 20 February 2021).
  13. Küfeoğlu, S.; Kim, S.W.; Jin, Y.G. History of electric power sector restructuring in South Korea and Turkey. Electr. J. 2019, 32, 106666. [Google Scholar] [CrossRef]
Figure 1. Roles and responsibilities of each relevant actor.
Designs 07 00134 g001
Figure 2. Overall interaction process of DSO and DEAR in the proposed prequalification scheme.
Designs 07 00134 g002
Figure 3. Flow chart of internal prequalification algorithm.
Designs 07 00134 g003
Figure 4. Network configuration of demonstration site: Oh–ryong D/L.
Designs 07 00134 g004
Figure 5. Network configuration of demonstration site: Cheong–sa D/L.
Designs 07 00134 g005
Figure 6. (a) Net–load pattern of the Oh–ryong and (b) net–load pattern of the Cheong–sa D/L.
Designs 07 00134 g006
Figure 7. PV utilization rate pattern on a sunny day in the winter season.
Designs 07 00134 g007
Figure 8. Node voltages with the initial bids (-1) and the 1st modified bids (-2) (Oh–ryong D/L).
Designs 07 00134 g008
Figure 9. Line flows with the initial bids (-1) and the 1st modified bids (-2) (Oh–ryong D/L).
Designs 07 00134 g009aDesigns 07 00134 g009b
Figure 10. Node voltage with the initial bids (-1) and the 1st modified bids (-2) (Cheong–sa D/L).
Designs 07 00134 g010aDesigns 07 00134 g010bDesigns 07 00134 g010c
Figure 11. Line flows with the initial bids (-1) and the 1st modified bids (-2) (Cheong–sa D/L).
Designs 07 00134 g011aDesigns 07 00134 g011bDesigns 07 00134 g011c
Table 1. Operator in power system by voltage levels in Korea.
Voltage LevelOperator
≥154 kVISO (KPX)
70 kV and 22.9 kV
Dedicated transmission line
TO (KEPCO)
≤22.9 kV distribution lineDSO (KEPCO)
Table 2. Sets, indices, parameters and variables.
Sets and Indices
b , i ,   j ,   k Subscripts for buses
l Subscripts for lines
b r s k ,   l r s k Subscripts for risky buses and lines
t ,   a Subscripts for DER and DERA
s ,   s Subscripts for iterations
N , L Set of buses and lines
N r s k _ o v v ,   N r s k _ u d v ,   L r s k _ u o f ,   L r s k _ d o f Set of overvoltage, undervoltage risky buses and upper overflow, down overflow risky lines
G i a S i a , R i a Set of DER, storage, and DER with reserve of DERA a on bus i
A Set of DERA
X P F s ,   X V _ O V s ,   X V _ U V s ,   X F _ U F s ,   X F _ D F s ,   X b i d s Set of result of power flow, worst overvoltage state, worst undervoltage state, worst upper overflow state, worst down overflow state and revised bidding in iteration s
Parameters
G i j ,   B i j Conductance and susceptance of the line between bus i and j [p.u.]
V ¯ ,   V _ Upper and lower limit of the voltage magnitude [p.u.]
S ¯ f , l Upper rate capacity of line l [p.u.]
P ¯ g , t Rate capacity of DER t [p.u.]
P ¯ g , t , P _ g , t Increase and decrease controllable amount of DRES t [p.u.]
p g , t i n i , q g , t i n i Active and reactive power of DRES t in initial bidding of CVPP [p.u.]
r u , t i n i , r d , t i n i Ramp up and down reserve power of DRES t in initial bidding of CVPP [p.u.]
p g , t i n i ¯ , p g , t i n i _ Upper and lower active power of DRES t in initial bidding of CVPP [p.u.]
P ¯ d , i , Q ¯ d , i Demand forecast of bus i [p.u.]
p f _ A lower limit of the power factor
σ g , t h i g h ,   σ g , t l o w Upper and lower uncertainty range of output of DER t [p.u.]
σ d , t h i g h ,   σ d , i l o w Upper and lower uncertainty range of demand forecast of bus i [p.u.]
O V i , a s ,   U V i , a s Overvoltage and Undervoltage violation on bus i of DERA a in iteration s [p.u.]
U F l , a s ,   D F l , a s Upper overflow and down overflow violation on line l of DERA a in iteration s [p.u.]
S n o v p , i , j s , S n o v q , i , j s Overvoltage magnitude sensitivity of active and reactive power on bus j to bus i to in iteration s at overvoltage worst case
S n u v p , i , j s , S n u v q , i , j s Undervoltage magnitude sensitivity of active and reactive power on bus j to bus i to in iteration s at undervoltage worst case
S n u s p , l , k s , S n u s q , l , k s Squared complex flow sensitivity of active and reactive power on bus k to line l to in iteration s at upper overflow worst case
S n d s p , l , k s , S n d s q , l , k s Squared complex flow sensitivity of active and reactive power on bus k to line l to in iteration s at down overflow worst case
A l l c o v , i , a s , A l l c u v , i , a s Allocation factor of overvoltage and undervoltage violation on bus i of DERA a in iteration s
A l l c u f , l , a s , A l l c d f , l , a s Allocation factor of upper and down overflow violation on line l of DERA a in iteration s
ϵ V ,   ϵ F ,   ϵ B i d Criteria of overvoltage security, overflow security and convergence of bid revision
Decision Variables
p g , t s ,   q g , t s Active and reactive power of DER t in iteration s [p.u.]
r u , t s ,   r d , t s Ramp up and ramp down reserve power of DER t in iteration s [p.u.]
p g , t s ¯ , p g , t s _ Upper and lower active power of DER t in iteration s [p.u.]
p g , t s ,   q g , t s Adjustment of active and reactive power of DER t in iteration s [p.u.]
p g , t s ¯ ,   p g , t s _ Adjustment of Upper and lower active power of DER t in iteration s [p.u.]
p i s ,   q i s Active and reactive injected power on bus i in iteration s [p.u.]
v i s ,   θ i s Magnitude and angle of voltage on bus i in iteration s [p.u.]
ξ g , i s ,   ξ d , i s Forecast error rate of the DER output and demand on bus i in iteration s
s f , l s ,   p f , l s ,   q f , l s Complex, active and reactive power flow on line l in iteration s [p.u.]
θ i j s , θ l s Angle of voltage between bus i and bus j or on line l in iteration s [p.u.]
u g , t s Dropout binary variable of DER t in iteration s
Auxiliary Variables
p g , t s , a b ,   q g , t s , a b Absolute value of active and reactive power difference of DER t between initial bid and iteration s [p.u.]
r u , t s , a b ,   r d , t s , a b Absolute value of Ramp up and ramp down reserve power difference of DER t between initial bid and iteration s [p.u.]
p s t , t s , d c h ,   q s t , t s , d c h Active and reactive discharging power of storage DER t in iteration s [p.u.]
p s t , t s , c h ,   q s t , t s , c h Active and reactive charging power of storage DER t in iteration s [p.u.]
v s t , t s Charging state binary variable of storage DER t in iteration s
Binary Variables
ξ g , i s ,   ξ d , i s Forecast error rate of the DER output and demand on bus i in iteration s
Table 3. Example of bid modification guidelines for DERA from the prequalification algorithm of DSO at 11 a.m.
DER
Index
DER
Type
Hour
Index
Max. Allowable
Generation Power [kW]
Max. Allowable
Discharging Power [kW]
Max. Allowable
Charging Power [kW]
15ESS11-−1909.22−1940.00
16ESS11-970.00−970.00
23ESS11-−1940.00−1940.00
24ESS11-−43.71−485.00
27PV118.77-0
33ESS11-1940.00−1940.00
34ESS11-1746.00−1746.00
40ESS11-0−1940.00
41PV11746.1000
45PV1117.9100
46PV1125.3700
47PV11454.2600
Disclaimer/Publisher’s Note: The statements, opinions and data contained in all publications are solely those of the individual author(s) and contributor(s) and not of MDPI and/or the editor(s). MDPI and/or the editor(s) disclaim responsibility for any injury to people or property resulting from any ideas, methods, instructions or products referred to in the content.

