1. Introduction
The term “Lean” was first used by John Krafcik in 1988. However, the emergence of Lean foundations dates to the forties of the 20th century. Lean management is the culmination of years of continuous improvement in the field of industrial engineering and management on a global scale [
1,
2].
The Lean philosophy is a system of continuous improvement that emerged predominantly from methodologies adopted by Toyota that generated high levels of quality and sustained corporate profits [
3]. This philosophy admits that there are activities that add value, i.e., that transform a product or service, for which customers or users are willing to pay, and activities that do not add value.
The fundamental theory of Lean can be summarized in two words: “removing waste”, meaning “waste” is anything unnecessary to produce a product or service [
4]. The principles and practices of Lean management provide high levels of efficiency and quality in business processes, through the minimization of waste, and aim to achieve the maximum in terms of output with the minimum of inputs [
5,
6].
One of the LT application’s main objectives is eliminating waste that does not add value to a product or service [
7]. The application of this philosophy can be beneficial both in a laboratory environment [
4] and in the education sector [
8], through the elimination of waste in the organization, and in the preparation and execution of educational laboratory activities, making the learning process more effective and efficient.
The term “Lean Laboratory” was used for the first time by Herasuta [
4], referring to the application of Lean Thinking (LT) in a laboratory focused on the provision of health care. Since then, the use of the term “Lean Laboratory” has continued fundamentally in the health field [
3,
9,
10,
11,
12,
13,
14,
15], although the use of the same concept was identified in an article about an analytical chemistry laboratory [
16], and also in the educational context, to refer to an exercise that consisted in simulating the assembly of physical parts made in the laboratory, using Lean tools, with a focus on training efficiency [
17].
For a better understanding of the “Lean Laboratory” concept and the relevance of its application in research and teaching laboratories,
Table 1 addresses the principles of the Lean philosophy from the perspective of a laboratory context.
Many researchers who have tried to identify different types of waste in the higher education sector have argued that the main types of waste in education are waiting times and inventories [
18]. Waiting times in the education sector can be waiting for an exercise’s start while the teacher prepares the class or material needed for teaching or waiting for equipment that needs to be moved. Waste in education regarding stocks can be related to stocking items and raw materials more than necessary or required [
19].
According to Isack et al. [
20], using the 5S methodology, Visual Management, and Kanban in (medical) laboratories is common. In compliance with Chibaira et al. [
21], the 5S methodology can be successfully applied to teaching processes. In the study by Hachmoud et al. [
17], conducted in an industrial environment simulation laboratory using Lean tools, the use of the Single Minute Exchange of Die (SMED) tool is proposed, as a future investigation, in laboratory simulations.
Additionally, when analyzing studies on the application of the Lean philosophy, it was possible to verify that the 5S and value stream mapping (VSM) methodologies are among the most used in teaching laboratories. It was also found that the implementation of Lean tools and practices resulted in benefits, with a reduction in waiting times being the commonly eliminated waste in studies conducted in an education sector laboratory [
8,
22,
23,
24,
25]. In addition, the study by Deranek et al. [
26] reported that Lean method implementation in a healthcare teaching laboratory contributed to a reduction in procedure cycle times without compromising quality and an improvement in course procedure time effectiveness.
The study by Jiménez et al. [
25] was dedicated to the analysis of the implementation of the 5S methodology in engineering teaching laboratories. Although the laboratory typology is not specified, the study by Sremcev et al. [
8] also focused on the application of the 5S methodology in a university laboratory. The remaining studies concern health and energy laboratories.
Although there are few studies on the application of Lean in laboratories of the educational engineering sector, the benefits reported in the studies mentioned earlier suggest there is potential to reduce waste and improve processes in the educational sector through LT.
In addition to the fact that few studies have applied Lean tools to reduce waste in teaching and learning processes [
8], references are scarce in the literature about the description of decision support systems (DSSs) based on the Lean philosophy [
27] and particularly about systems suitable for stock management that can be applied in teaching and research laboratories.
The study by Agostinho et al. [
27] presented a DSS based on the Lean philosophy facilitating stock management. In this study, the proposed DSS consisted of e-Kanban that signals the moment to place an order as well as the optimal order quantity. The DSS proposed by Agostinho et al. [
27] resorted to the mathematical formulas proposed by Castro et al. [
28] and Labuhn et al. [
29].
The study by Castro et al. [
28] provided a method to determine the optimal time and quantity order. The proposed mathematical models were applied in the management of hospital stocks along with a Kanban system and other optimization techniques. The case study carried out revealed that this approach resulted in improved productivity, increased quality of service to patients, and reduced costs, and, the most valuable impact, increased quality of health services for the population. In addition, it allowed a reduction in stocks, possible stockouts, and associated costs.
Additionally, Labuhn et al. [
29] described a successful supply chain optimization project designed for an academic medical center and presented mathematical formulas for calculating optimal stock levels. The implementation of Labuhn et al.’s [
29] proposal resulted in a reduction in the number of stockouts per month and an inventory cost saving of 220,500 USD.
Given the seasonality of demand for items in academic environments, it would be useful to create a DSS that uses information about the demand forecast to signal the moment and quantity of an order. Therefore, articles were reviewed on mathematical models that allow the calculation of the safety stock, considering demand forecasts [
30,
31,
32,
33].
Beutel et al. [
30] used two distinct approaches to stock management. The first approach used regression models to forecast demand and illustrated how the estimation errors can be used to define the necessary safety stocks. The second approach followed linear programming methodology under different objectives and service-level constraints to optimize stock levels.
Additionally, Chen et al. [
31] used mixed-integer linear programming (MILP) in a computational simulation optimization framework to determine the appropriate level of safety stock levels.
According to Trapero et al. [
32], the variability in forecast errors is used to calculate the safety stock and to reduce the risk of rupture, while ensuring a reasonable investment in stocks. The authors proposed empirical methods based on (nonparametric) Kernel density estimators and generalized autoregressive conditional heteroscedasticity (GARCH) parametric models to calculate the safety stock.
The investigation by Conceição et al. [
33] aimed to implement a new stock management in a footwear company through the analysis of indicators obtained from stock data collection. The authors applied the ABC analysis method, demand forecast, safety stock, order point, and optimal order quantity for this.
Regarding methodologies that can be used to obtain predicted demand values, the study by Xu et al. [
34], about the demand forecast after the occurrence of natural disasters, as well as the study by Conceição et al. [
33] reported linear regression as one of the widely used methods for forecasting demand.
Given the aforementioned gaps in the literature, this study aims to add knowledge about the application of LT in teaching and research laboratories to provide improvements in terms of space organization, setup times for laboratory activities, and stock control through a case study. The case of the Automation and Robotics Laboratory (ARL) of the Faculty of Engineering of the University of Beira Interior (UBI) was selected, since research is scarce about Lean tool implementation in engineering teaching laboratories and the improvement objectives of this laboratory (improve space organization, reduce setup times, and design a stock control system) are aligned with the objective of the investigation.
Thus, this study has as its general objective the recommendation and implementation of Lean tools in the ARL of the Faculty of Engineering of the UBI to verify whether the application of LT can reduce the run time of an experimental procedure. Additionally, the study aims to provide a DSS that allows determining the quantity and timing of an order and ensuring the availability of necessary materials, considering common characteristics of many teaching and research laboratories that influence the management of stocks, namely the fluctuation in demand throughout the academic year, the different levels of demand, the possibility of items being reused, and the deterioration to which fragile components are subject.
After examining the literature review about the “Lean Laboratory” concept and DSSs for Lean stock management,
Section 2 aims to present the selected Lean methodologies to improve workplace organization and mathematical formulas to design the e-Kanban DSS. The results of Lean tool implementation in the case study’s laboratory are displayed in
Section 3 and discussed in
Section 4. Finally,
Section 5 shows the main conclusions, theoretical and practical implications, limitations, and future studies.
2. Materials and Methods
In this section, the selected methodology to improve the organization of the workplace and to design a DSS for stock management using Lean practices is described.
2.1. Workplace Organization
To eliminate waste in the workplace organization, the 5S methodology was applied. As the name of this tool suggests, there are five phases involved in its implementation, which are represented by five Japanese words:
Seiri,
Seiton,
Seiso,
Seiketsu, and
Shitsuke [
35]. The application of the five steps is characterized next.
Seiri (sort): All tools, parts, and/or materials must be examined, and only essential items must be kept [
25]. First, empty boxes and everything that was not needed were removed from the place intended for storing materials.
Seiton (set in order): Necessary items must be kept in designated places for easy and timely replacement. For this, it is necessary to establish adequate criteria for the organization based on the frequency of use, placing the more highly demanded compounds within arm’s reach and those less required in more distant locations [
35].
To apply the second step of the 5S methodology, the cabinet items were identified, including the identification of the manufacturer product number in the description of the items for their faster identification, either when they are needed for laboratory activities or to place an order.
The items were also classified into the following categories: tools, drones, communication, drugstore and hardware, housing and wiring, energy, sensors, electronics, and microcontrollers. Items were ranked according to their level of demand (high or low) to ensure that the more highly demanded items were in more accessible locations. Additionally, to plan the purchase of storage materials, the items were classified according to their size. Following the information gathered, a specific location was appointed for each category and item.
Seiso (shine): The work area and all equipment must be kept clean and tidy, ready for the next use [
25].
After selecting and sorting the materials, the storage place was cleaned to prompt the order in the workplace through waste disposal.
Seiketsu (standardize): Visible and simple rules must be established to allow the distinction between normal and abnormal situations [
25]. This step guarantees compliance with the standards established in the previous steps so that there is a well-articulated and consistently organized work procedure [
35]. In this sense, Visual Management techniques were used. Visual Management is a Lean tool that aims to provide visual information or display requirements to define instructions [
36]. This tool can include the use of warning regulatory and guidance signs [
20], labels, or color coding [
36].
In the laboratory, color labels were assigned to each of the different categories for more expeditious and easier identification of the components, contributing to a reduction in setup times and, simultaneously, establishing rules for the location of materials. The rules established through Visual Management allowed standardization.
Shitsuke (sustain): The previously defined standards should be applied regularly [
37] to maintain the previous stages and promote the effort to seek continuous improvement in each one of them, which requires commitment and discipline [
25,
35].
Thus, the method of organization applied was transmitted to the laboratory’s main responsible to encourage the discipline necessary for the consolidation of the applied stages of the 5S methodology and maintenance of the results achieved.
Furthermore, the SMED tool was applied through a reduction in setup times for laboratory activities, the elimination of non-essential operations, and the creation of standardized instructions for the location of components.
The SMED tool consists of a system to reduce setup time [
38] and changeover times by simplifying processes, eliminating unnecessary procedures, and standardizing work [
39]. This tool aims to reduce waste in the production system by preparing equipment and/or tasks and performing quick changeovers, i.e., with a duration of 9 min or less (corresponding to a number of minutes of only one digit) [
40].
In this case study, the application of the SMED tool was combined with other tools and methodologies, namely 5S and Visual Management, according to what [
41] defended.
2.2. Decision Support System for Stock Management
According to the information available, since there was no efficient organization of space and given the fragility of some materials, namely microcontrollers, many materials were easily damaged and their scarcity was frequent. Therefore, an additional improvement aim was to create a system that allows stock control and ensures that materials are available whenever necessary, considering their demand over time.
In Japanese, the word “Kanban” means a visual frame or visual presentation. The original concept of Kanban uses cards as communication signals. Kanban cards have the function of indicating when more goods or items are needed [
42,
43]. In other words, according to this system, the consumption of an item generates a replacement order, which is signaled by the Kanban cards [
27].
e-Kanban systems essentially replace the card or physical recipient with an electronic notification [
44]. e-Kanban results from the combination of the Kanban tool with digital and software tools, with more efficient and faster application potential [
45].
To provide information about the need to place an order, an e-Kanban system was selected as the base methodology of the developed DSS in Microsoft Excel.
A DSS was developed with two objectives: to help manage stocks at the beginning of each semester according to the planning of laboratory classes and, using different mathematical formulas, to allow the management of stocks throughout the semester of articles used in teaching and research activities. The mathematical formulas incorporated in the DSS are described hereafter.
To ensure the availability of materials needed for practical laboratory classes, it is proposed that at the beginning of each semester, planning of the number of materials needed must be carried out according to the number of laboratory classes to be taught during the semester, the number of groups of work per class, and the information contained in the protocols of laboratory activities. This planning will allow the number of materials needed to be determined in advance and ensure their availability.
The developed DSS is an e-Kanban system that signals the need to place an order when the condition is verified:
where Q is the number of items needed for each semester’s laboratory classes and S is the existing stock. The fact that there are fragile components that are easily damaged must also be reflected in the calculation of the quantity to be ordered indicated in the DSS. Thus, the quantity to be ordered (Q
o) at the beginning of each semester is given by the following expression:
where p represents the expected proportion of ordered items that deteriorate or become otherwise unusable.
The calculation of Q must be different depending on two possible situations. If the materials can be reused, i.e., if they can be used by different groups in different laboratory classes, Q is calculated according to Equation (3). When this is not possible, Equation (4) is used.
where AL is the number of laboratory classes per semester, G corresponds to the number of work groups per laboratory class, and N is the number of items needed in the laboratory activity for each article.
Regarding stock management throughout the semester, the DSS also indicates when an order should be placed and in which quantity. However, the signage of the need to place an order is different for items, depending on their level of demand. For articles with low demand, the condition of Equation (5) must be verified so that an order is necessary. For articles with high demand, the condition of Equation (6) is considered [
28].
where S
min is the minimum stock and EOQ is the economic order quantity. The EOQ can be calculated through Equation (7) [
46].
where C
p is the ordering set-up cost; C
h is the holding cost—the cost of the spare part × (interest rate + insurance rate (per month)); and D
am is the average monthly demand.
The quantity to be ordered (Q
o) calculation also varies according to demand. For low demand, the order quantity is given by Equation (8). For items with high demand, Equation (9) is considered [
28]:
where Q
p is the pending quantity, i.e., the quantity that remains to be delivered from the previous order.
Equations (5) and (8) proposed by Castro et al. [
28] use the maximum and minimum stock levels. The DSS uses an adaptation of the formulas proposed by Labuhn et al. [
29], corresponding to Equations (10) and (11).
where D
am is the average monthly demand; σ
d is the standard deviation of the monthly demand; f
r corresponds to the frequency of replacement per month, or how often we want to visit the stocking location per month; and Z
p is the inverse of the standard cumulative distribution for probability p, i.e., it represents what the fill rate should be (how often will inventory be present when needed). SS corresponds to the safety stock, and L is the lead time, i.e., the time between the act of ordering and the actual delivery.
According to Conceição et al. [
33], demand fluctuation is a relevant problem that must be considered when managing stocks. Thus, to calculate the safety stock, mathematical models were used that consider the demand forecast.
Trapero et al. [
32] reported that the safety stock can be calculated using the following expression under the assumption that the demand forecasting error is an independent and identically distributed (i.i.d.) Gaussian with zero mean and constant variance:
where K is the safety factor obtained by Equation (13) and σ
L is the standard deviation of the forecast error for a given lead time.
In Equation (13), Φ(·) denotes the standard normal cumulative distribution function and CSL is the customer service level, which, according to Chen et al. [
31], corresponds to the quotient between the sum of satisfied demands and the total demand.
Additionally, the calculation of σ
L presented in Equation (12) is based on Equation (14).
where L is the lead time and σ
1 is given by Equation (15):
In compliance with [
32], σ
1 can be estimated by calculating the mean-square error (MSE) for period t and for period t+1, which are given, respectively, by Equations (16) and (17):
where n is the sample size, y
t is the actual value of demand in period t, F
t is the forecast value for the same period t, and α′ is a smoothing constant that varies between 0 and 1, although small values between 0.01 and 0.1 are commonly used.
The F
t value is obtained through linear regression. Linear regression is a measurement tool used to determine whether a relationship exists between variables. In forecasting demand, the variables used are time as an independent variable (x) and quantity demanded as a dependent variable (y) [
47].
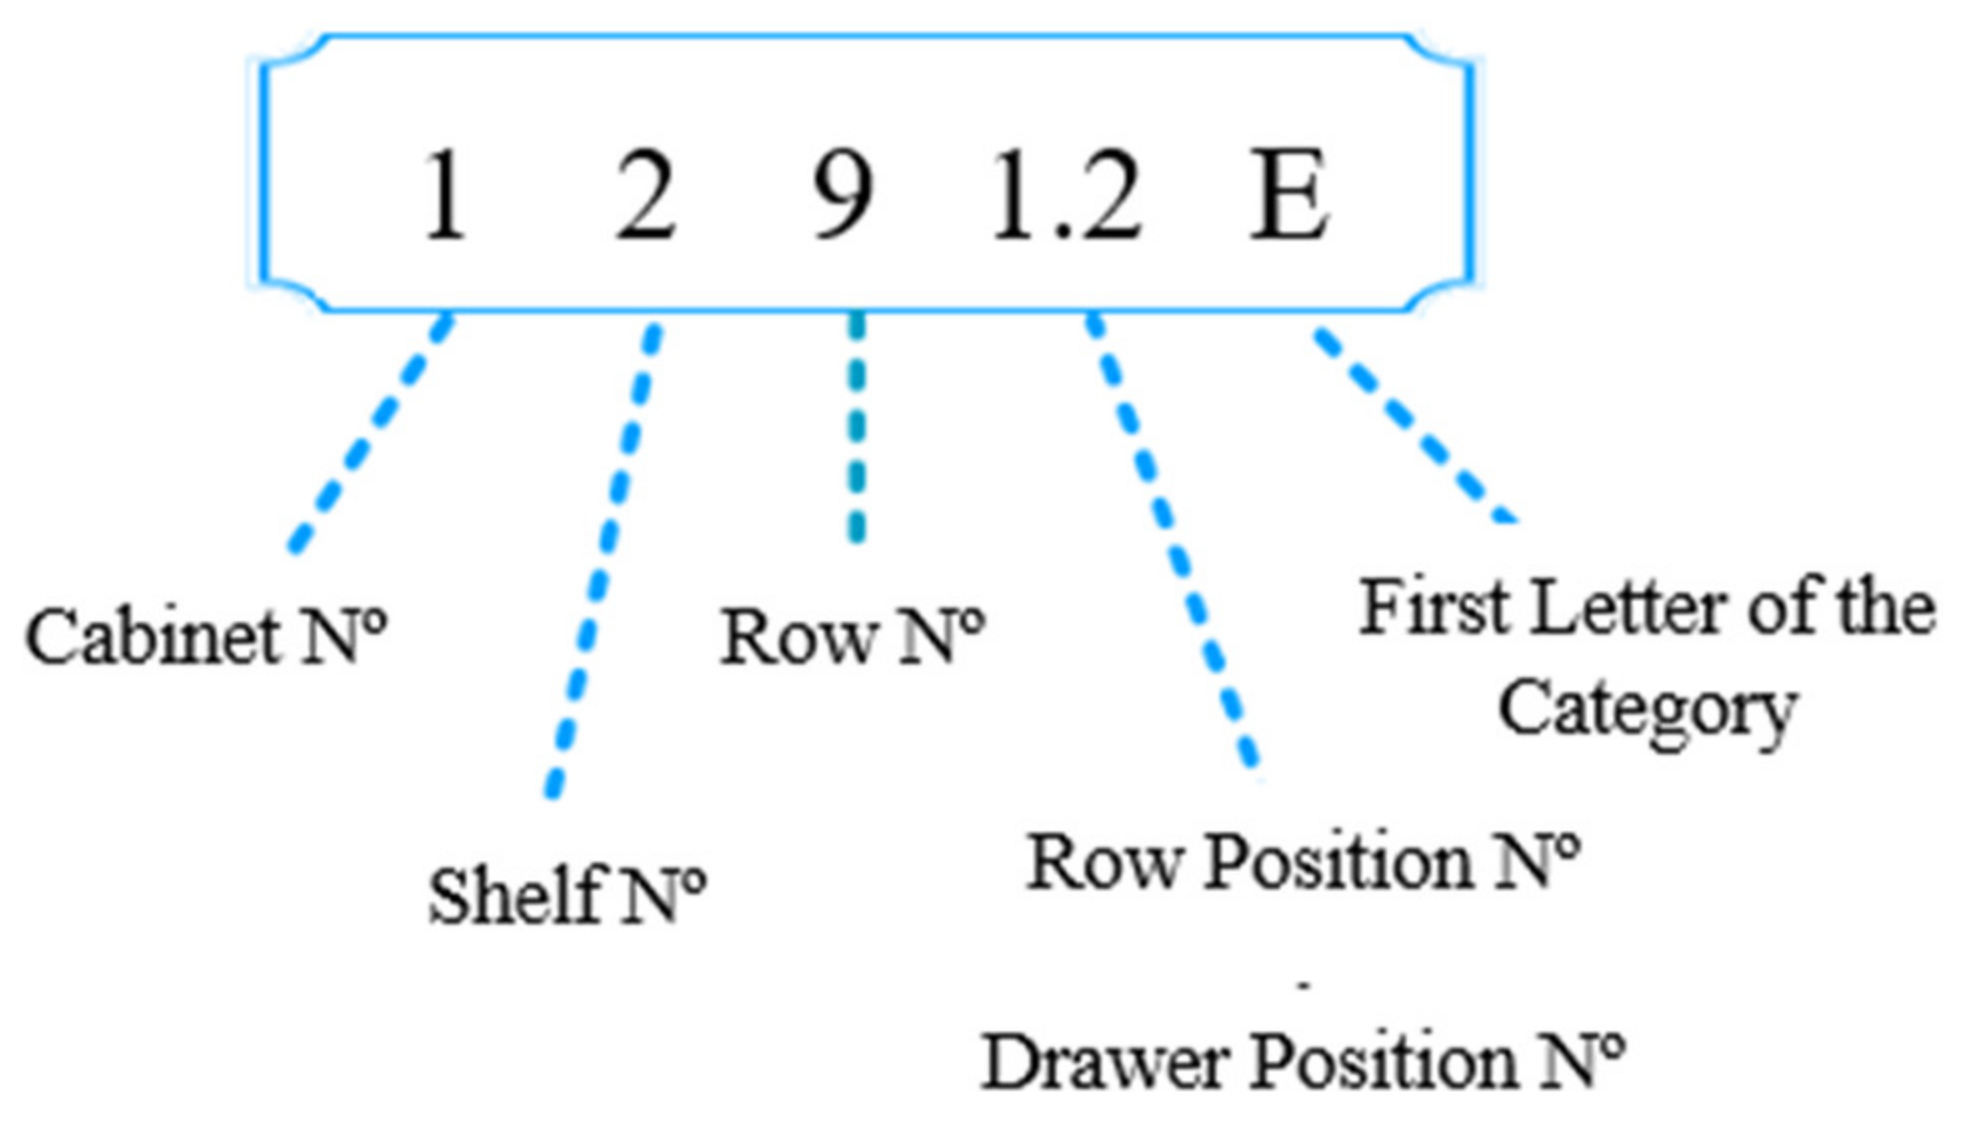
The DSS not only indicates the quantity and time for placing an order but also includes, for each item, a specific coding considering the item’s location in the ARL and the category to which it belongs. In
Figure 1, the code corresponding to “Transistor TIP 120” is shown to exemplify the meaning of the characters assigned to the items.
The proposed coding aims to allow faster identification of articles, being associated with their location. Since there is more than one compartment in the drawer in which Transistor TIP 120 is located, a number is assigned to the corresponding position.
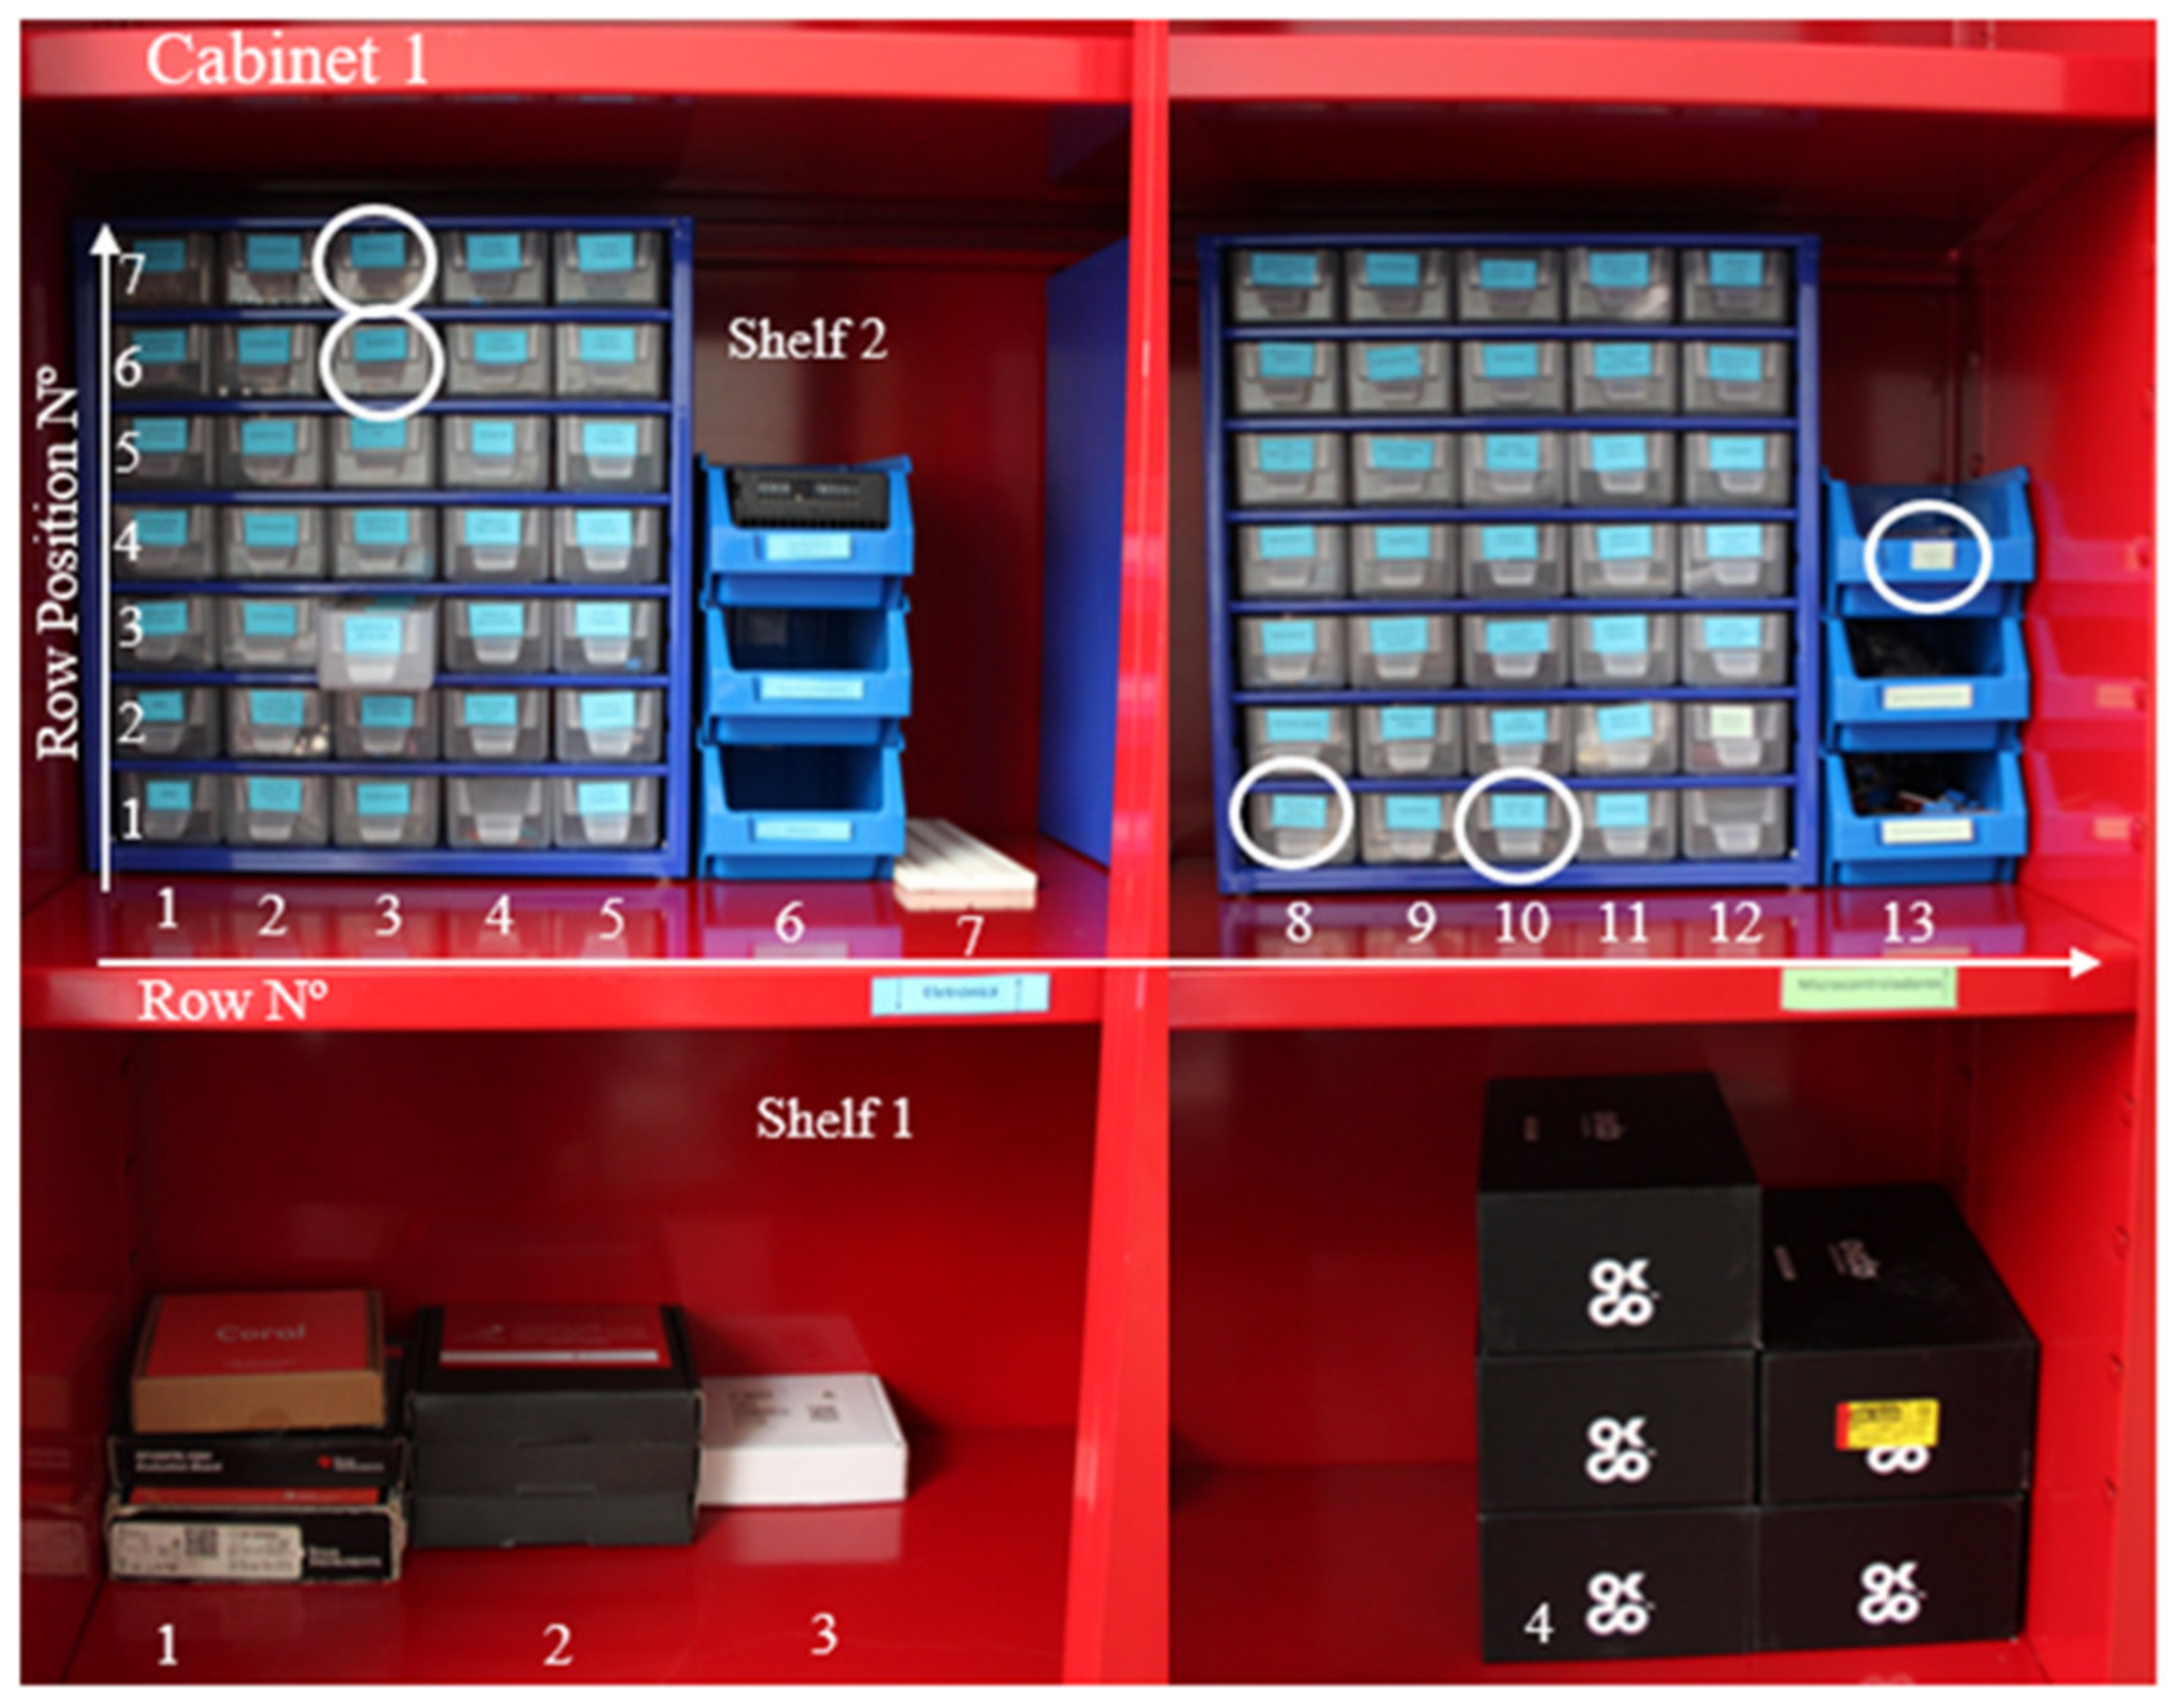
Figure 2 associates the numbers assigned in the coding with the location of the respective articles. The articles that are circled in white are the articles used as an example of the DSS application shown in the next section.
3. Results
This section presents the results obtained before and after implementing the 5S, Visual Management, and SMED methodologies to improve the organization of space and presents the results of the simulation of the DSS described earlier.
3.1. Organization of the Workplace
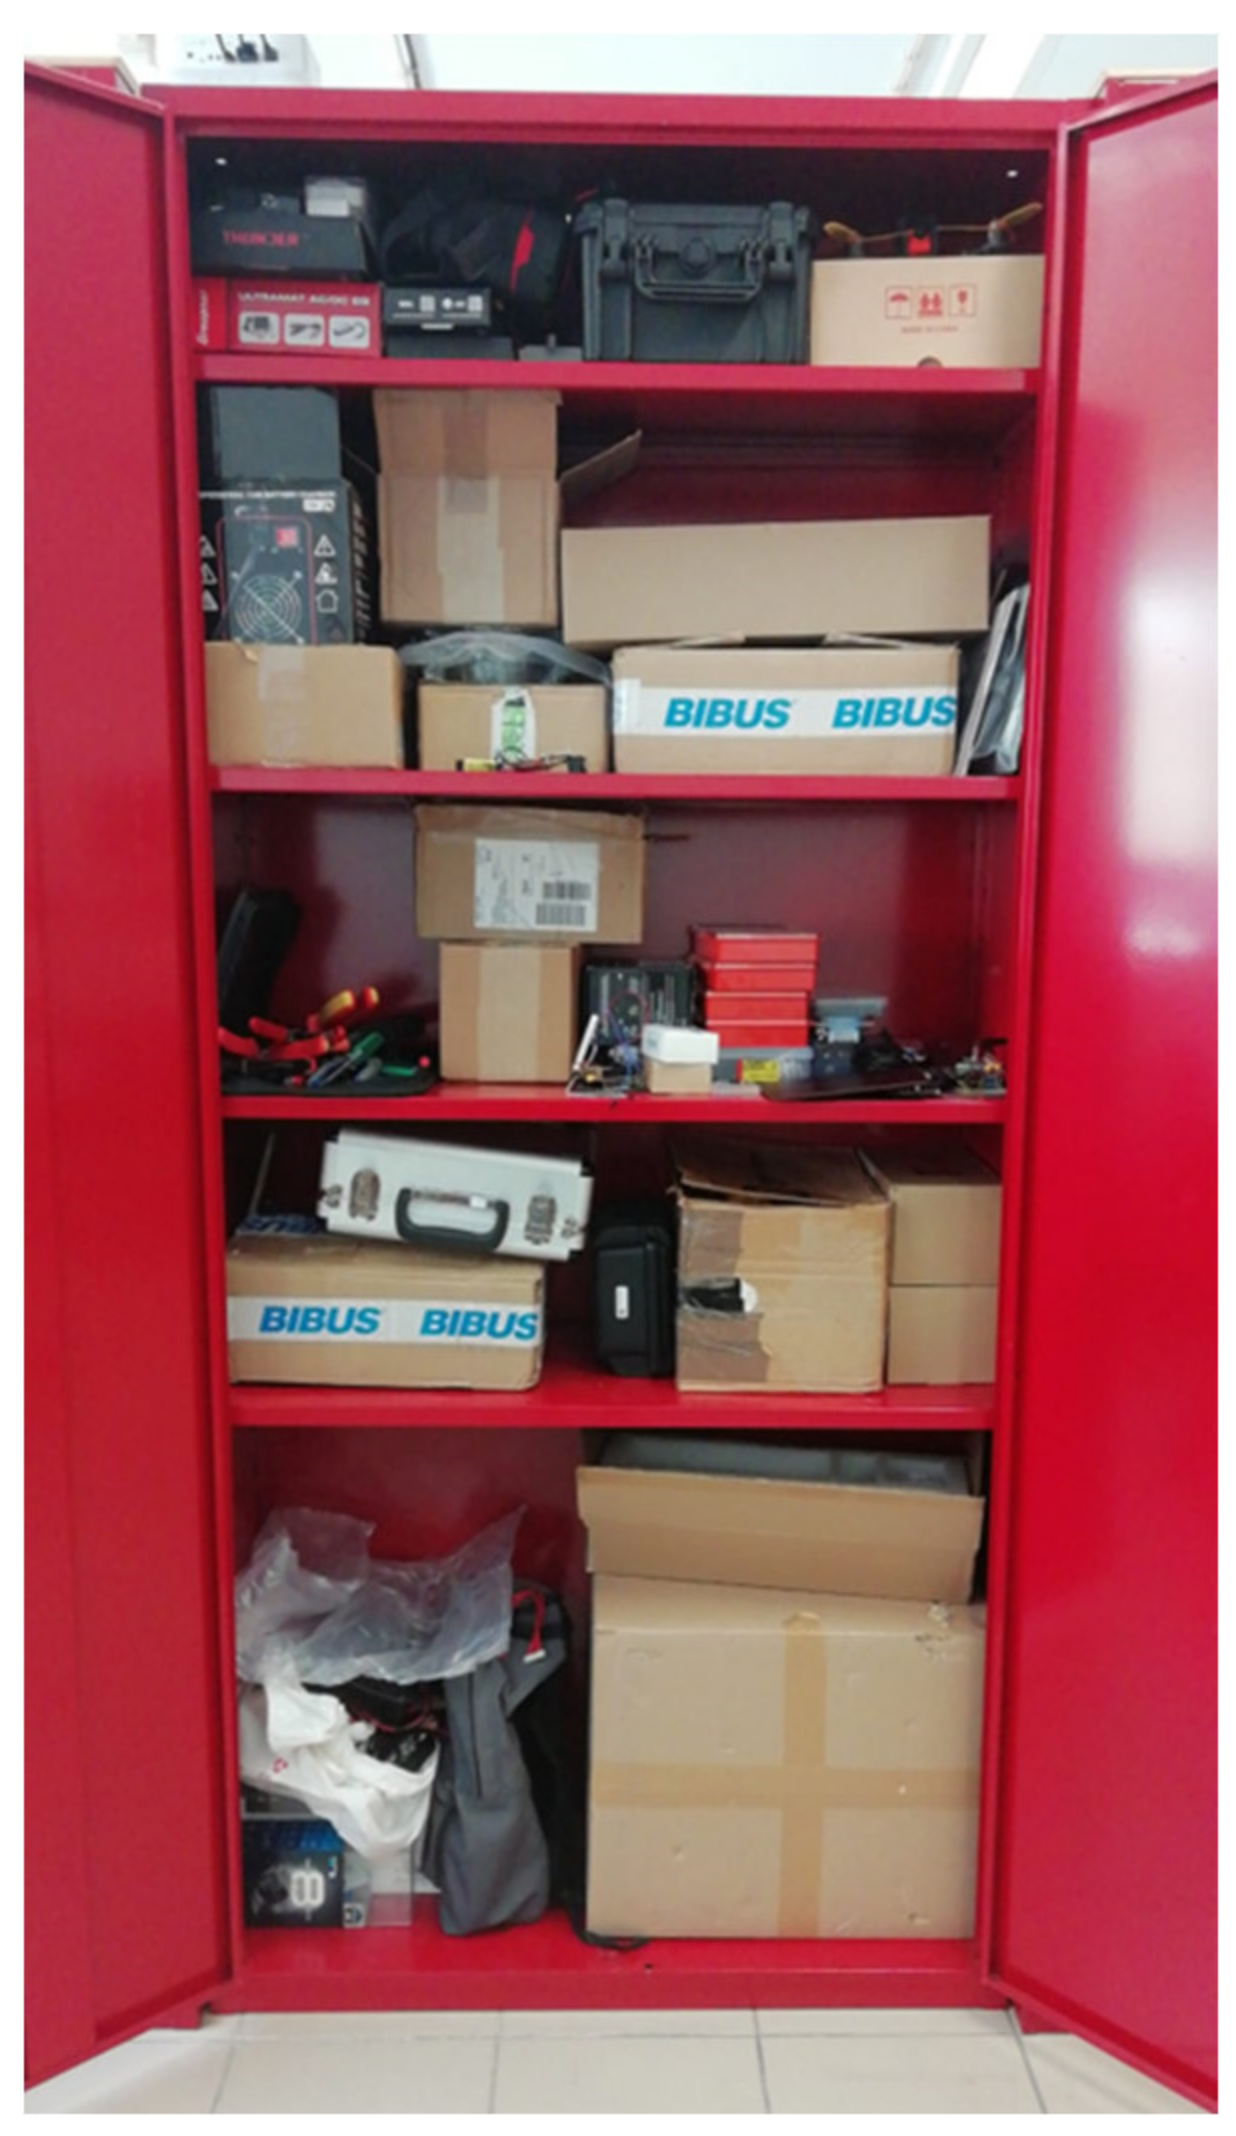
Regarding the laboratory spatial organization, it was found, by observation and according to the information provided by those in charge of the laboratory, that due to the acquisition of new equipment and materials, the available storage space was not enough, and these materials started to be stored randomly inside the laboratory cabinets according to the arrival of the orders, i.e., most of the materials were stored in the boxes and packages sent by the suppliers and were not organized in a specific order.
Figure 3 illustrates the space where some of the ARL components were stored.
As there was no specific order for storing a wide variety of materials, it was difficult to find materials needed for practical activities, whether teaching or research.
To make the time spent searching for materials measurable, the times involved in performing an experimental procedure by three individuals familiar with the workplace were collected.
The experimental procedure consisted of four main tasks corresponding to temperature measurement, as can be seen in
Table 2. The times associated with each task, which were measured once, and the total time that each participant took to complete the laboratory activity can be observed in the same table.
According to the information presented in
Table 2, the time associated with searching for materials represented, on average, 79% of the total time for performing the experimental procedure. Since there was no specific place for each item, the search for the materials needed to take the temperature measurement required removing and replacing boxes from the cabinet, which represents unnecessary movement. Thereby, this experience exposed the main waste identified in the ARL—waiting times and movements.
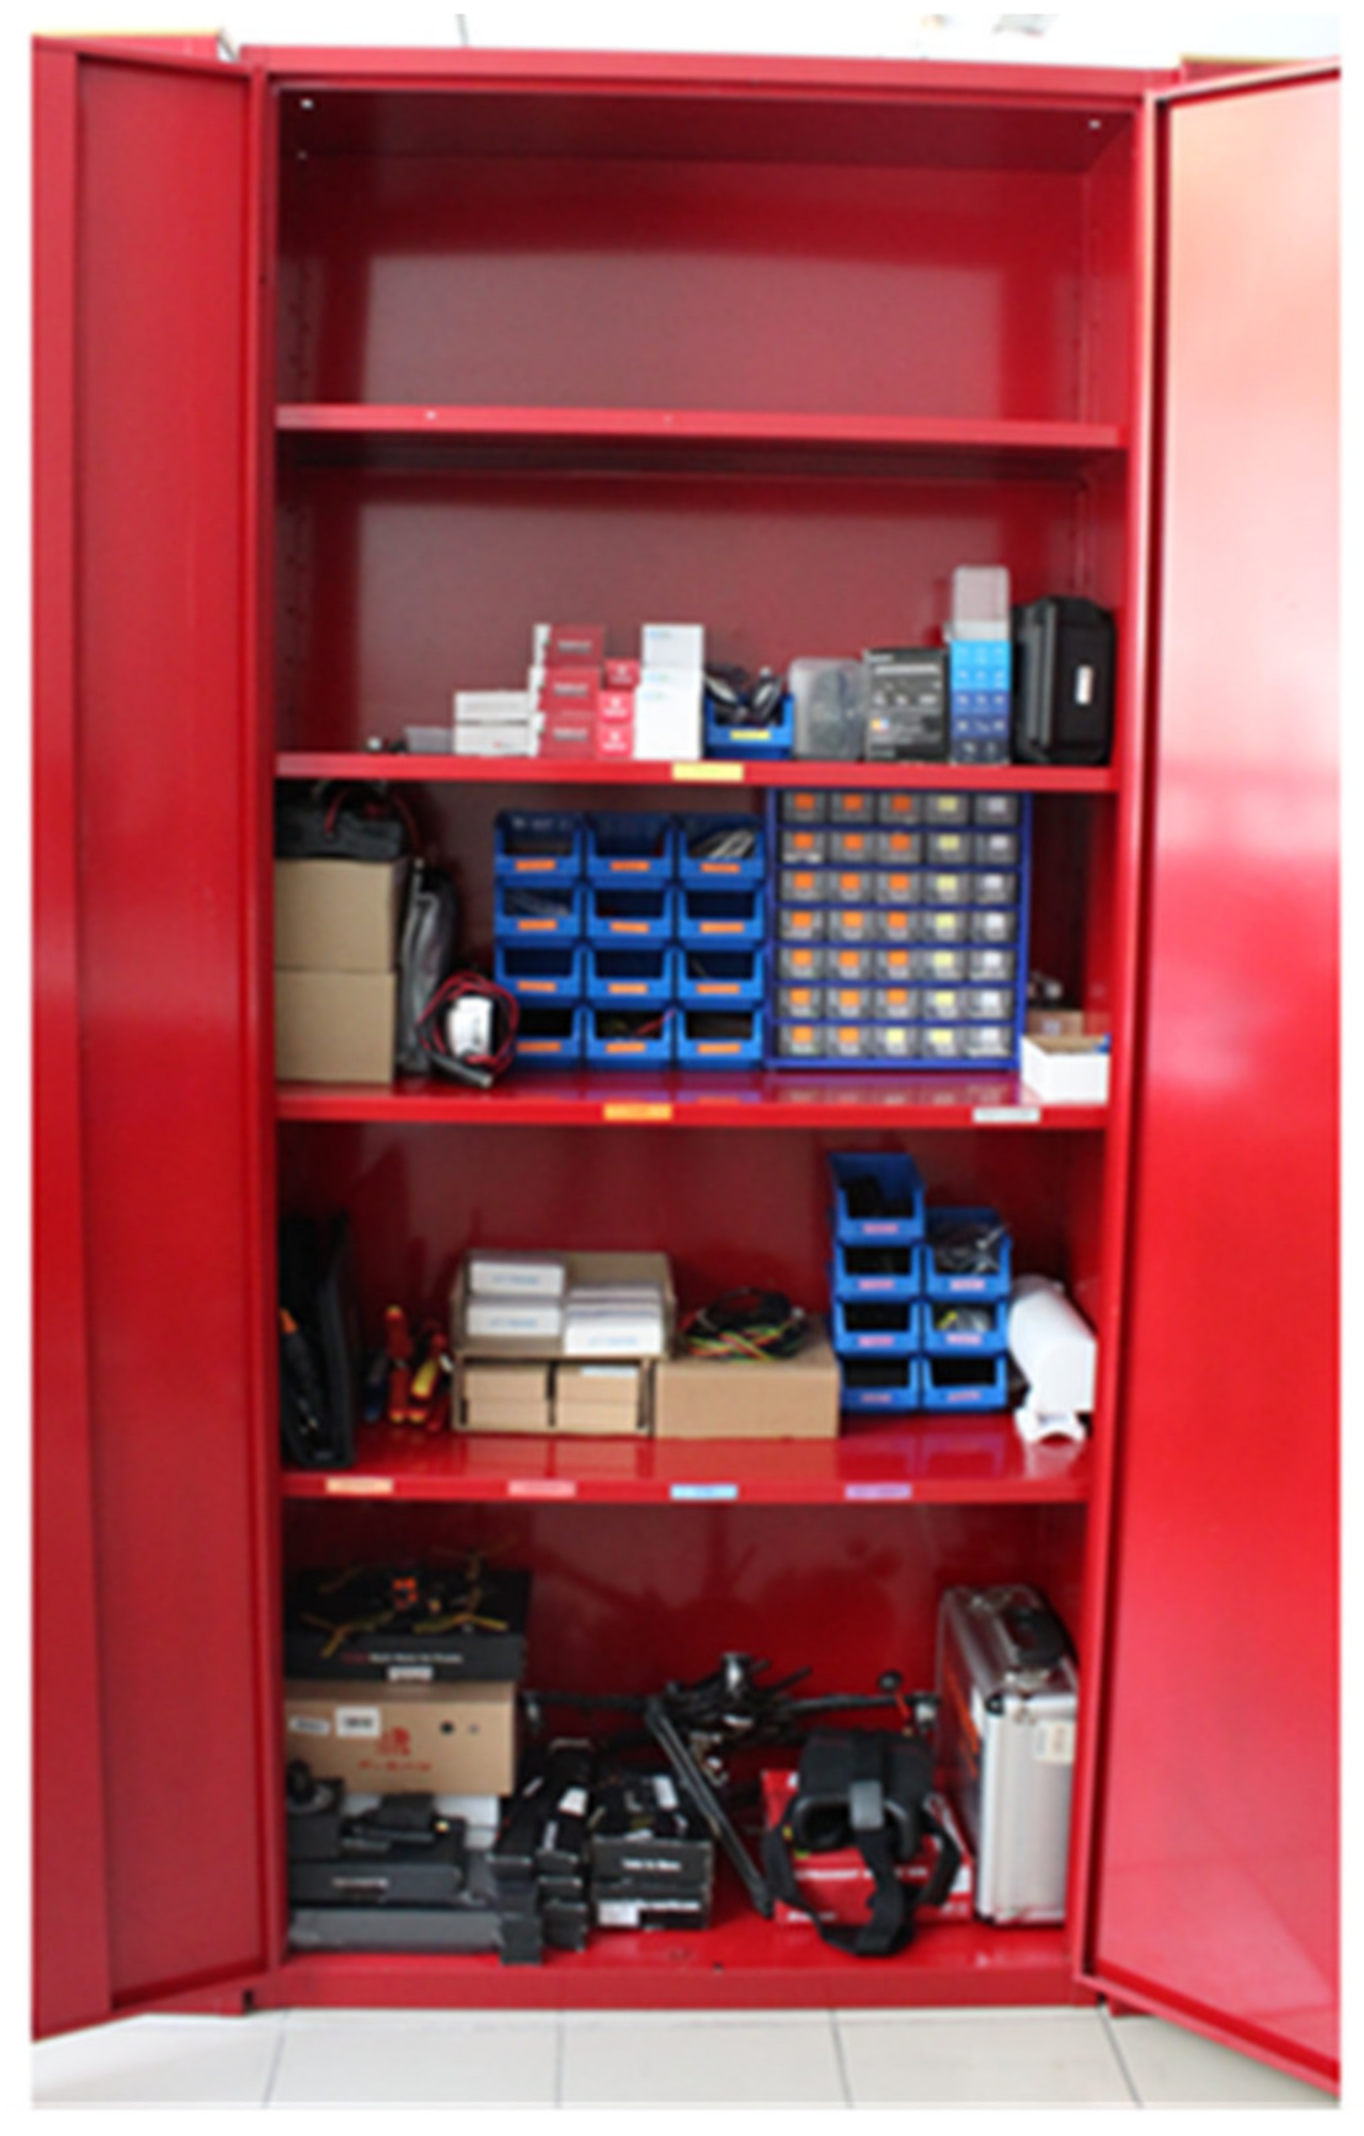
To minimize these wastes, the 5S, Visual Management, and SMED methodologies were applied. After the application of the referred Lean tools, the materials that were previously stored in the cabinet in
Figure 3 started to be stored in the cabinets in
Figure 2 and
Figure 4.
To verify whether the implementation of the 5S, Visual Management, and SMED methodologies effectively resulted in a reduction in setup times, the temperature measurement experimental procedure was repeated.
Table 3 summarizes the recorded times.
The results suggest that the implementation of the 5S, Visual Management, and SMED methodologies contributes to a significant reduction in the average time associated with the search for materials.
3.2. Decision Support Systems for Stock Management
A possible scenario for the use of the DSS described earlier is presented next, with the materials indicated in a protocol corresponding to the assembly of an electrical circuit. In this section, the sheets that compose the DSS are displayed to facilitate its replication.
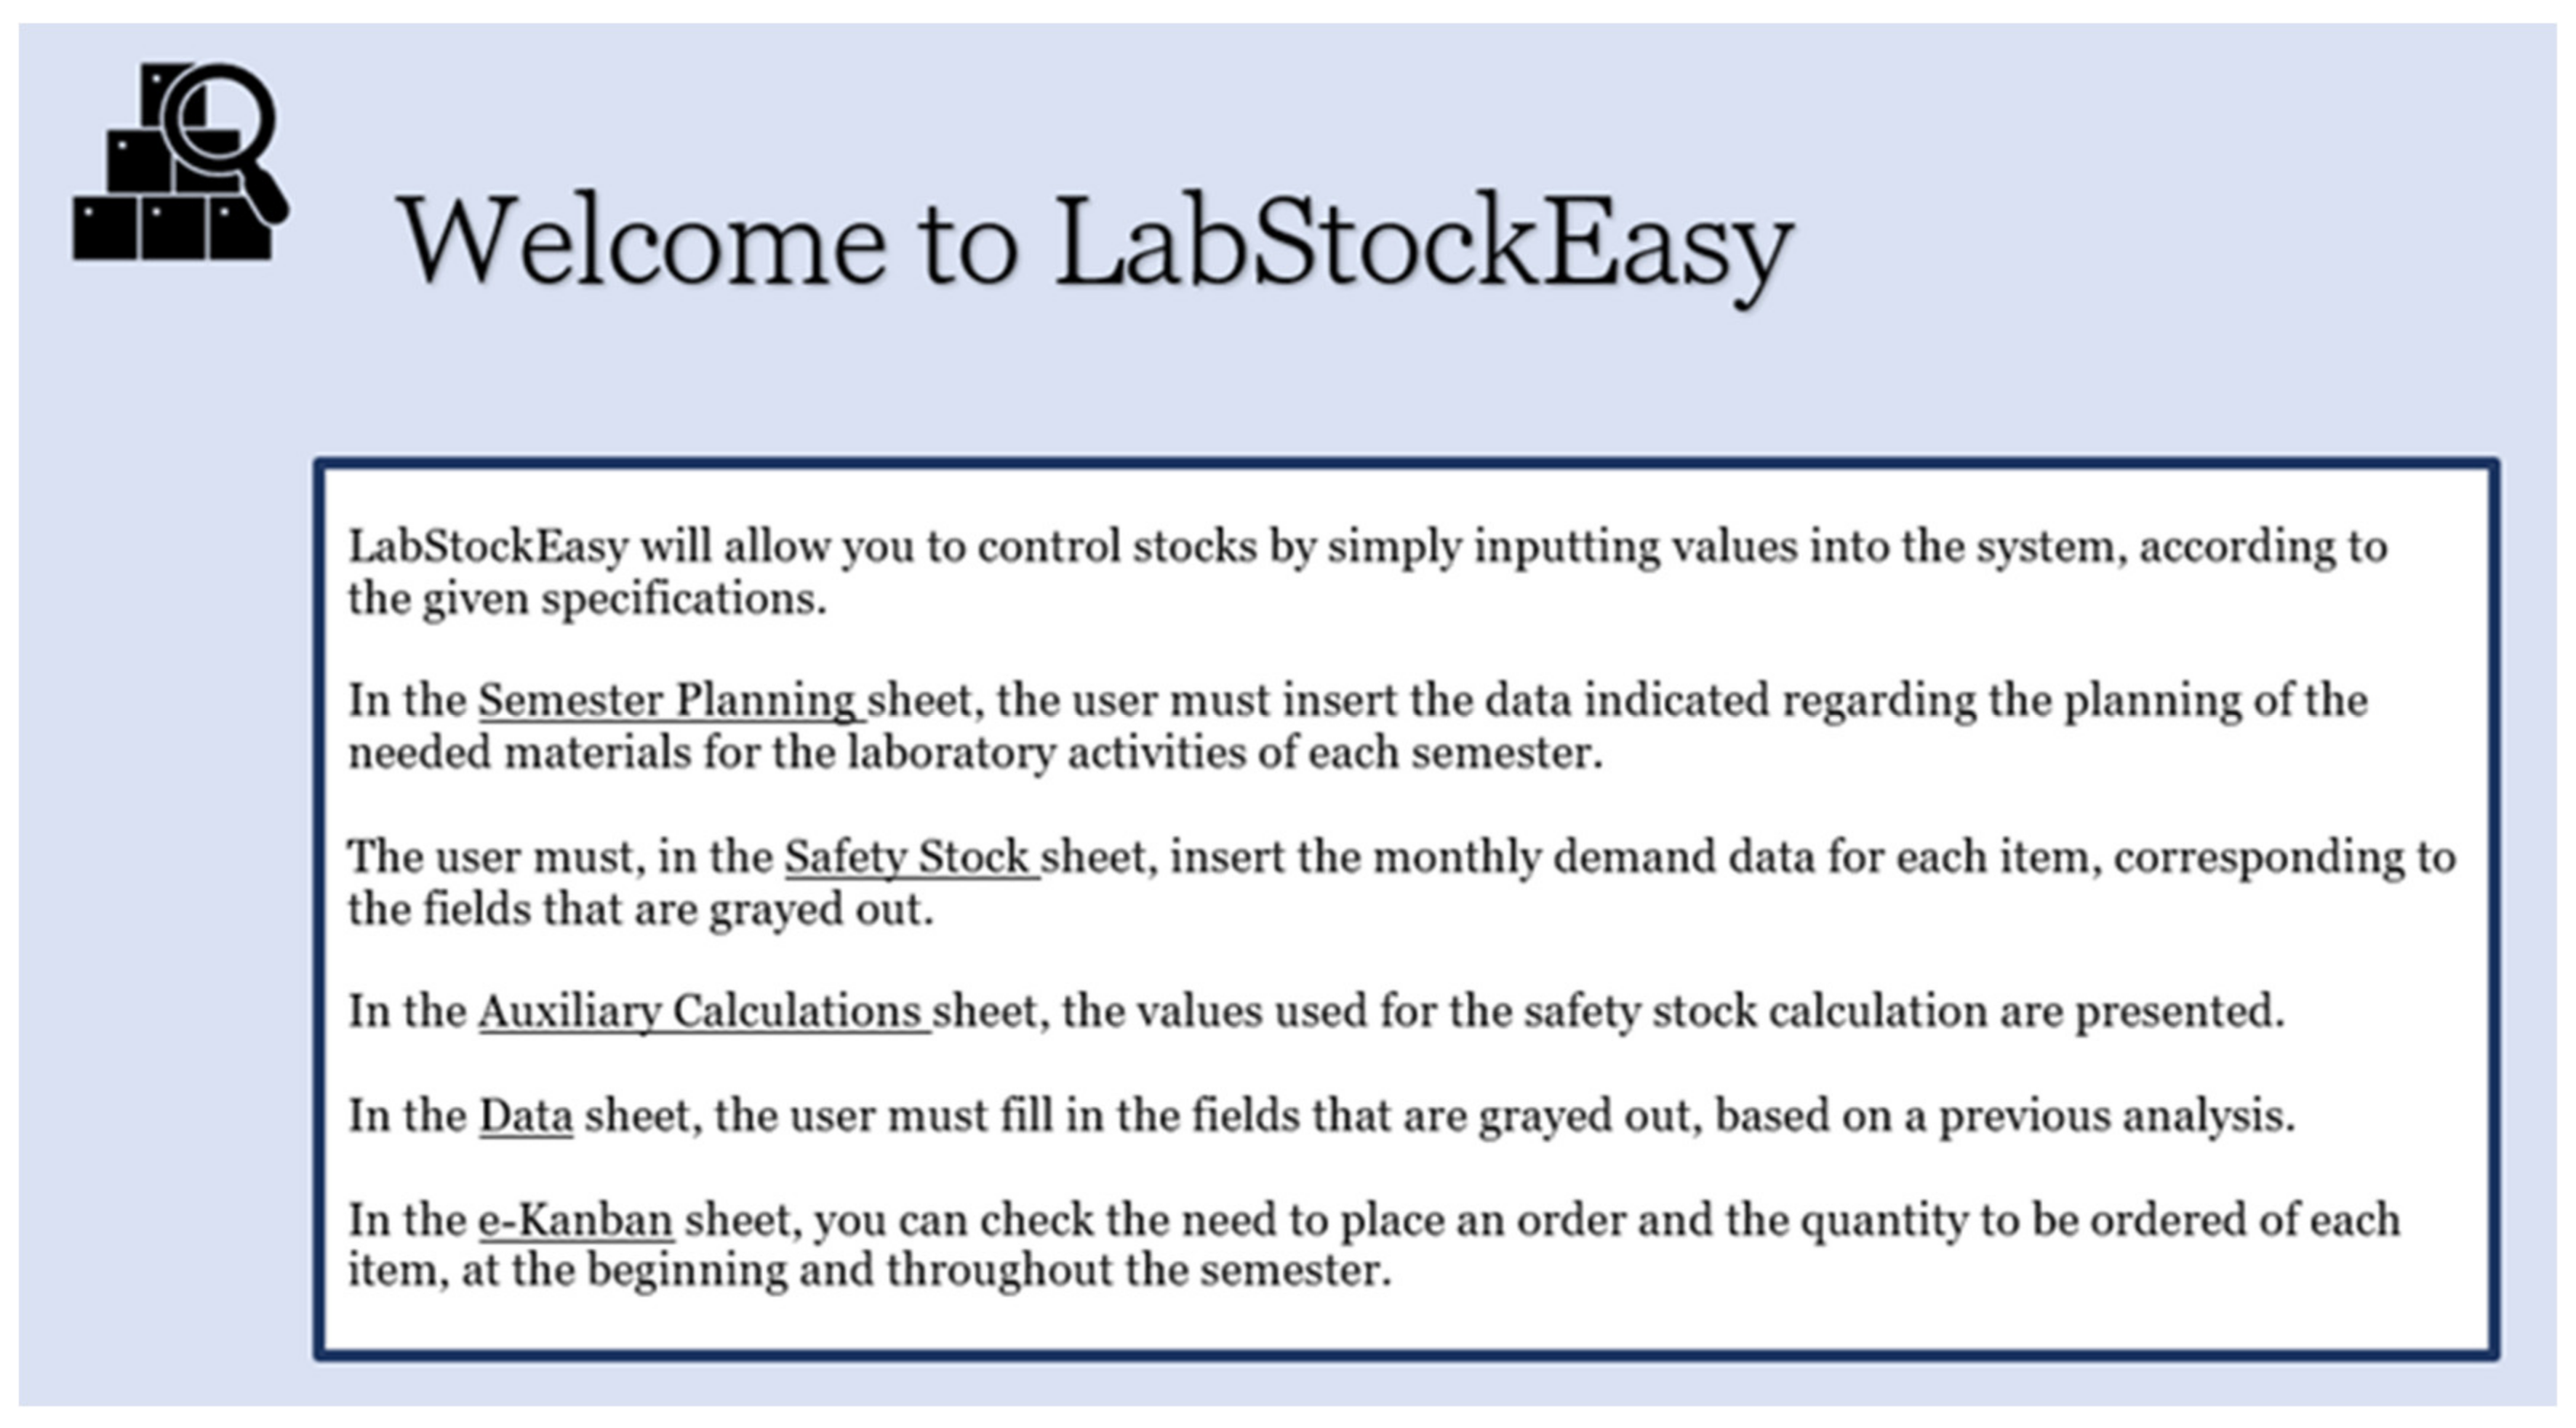
Figure 5 shows the DSS home page, which contains information that informs the user about how the system works.
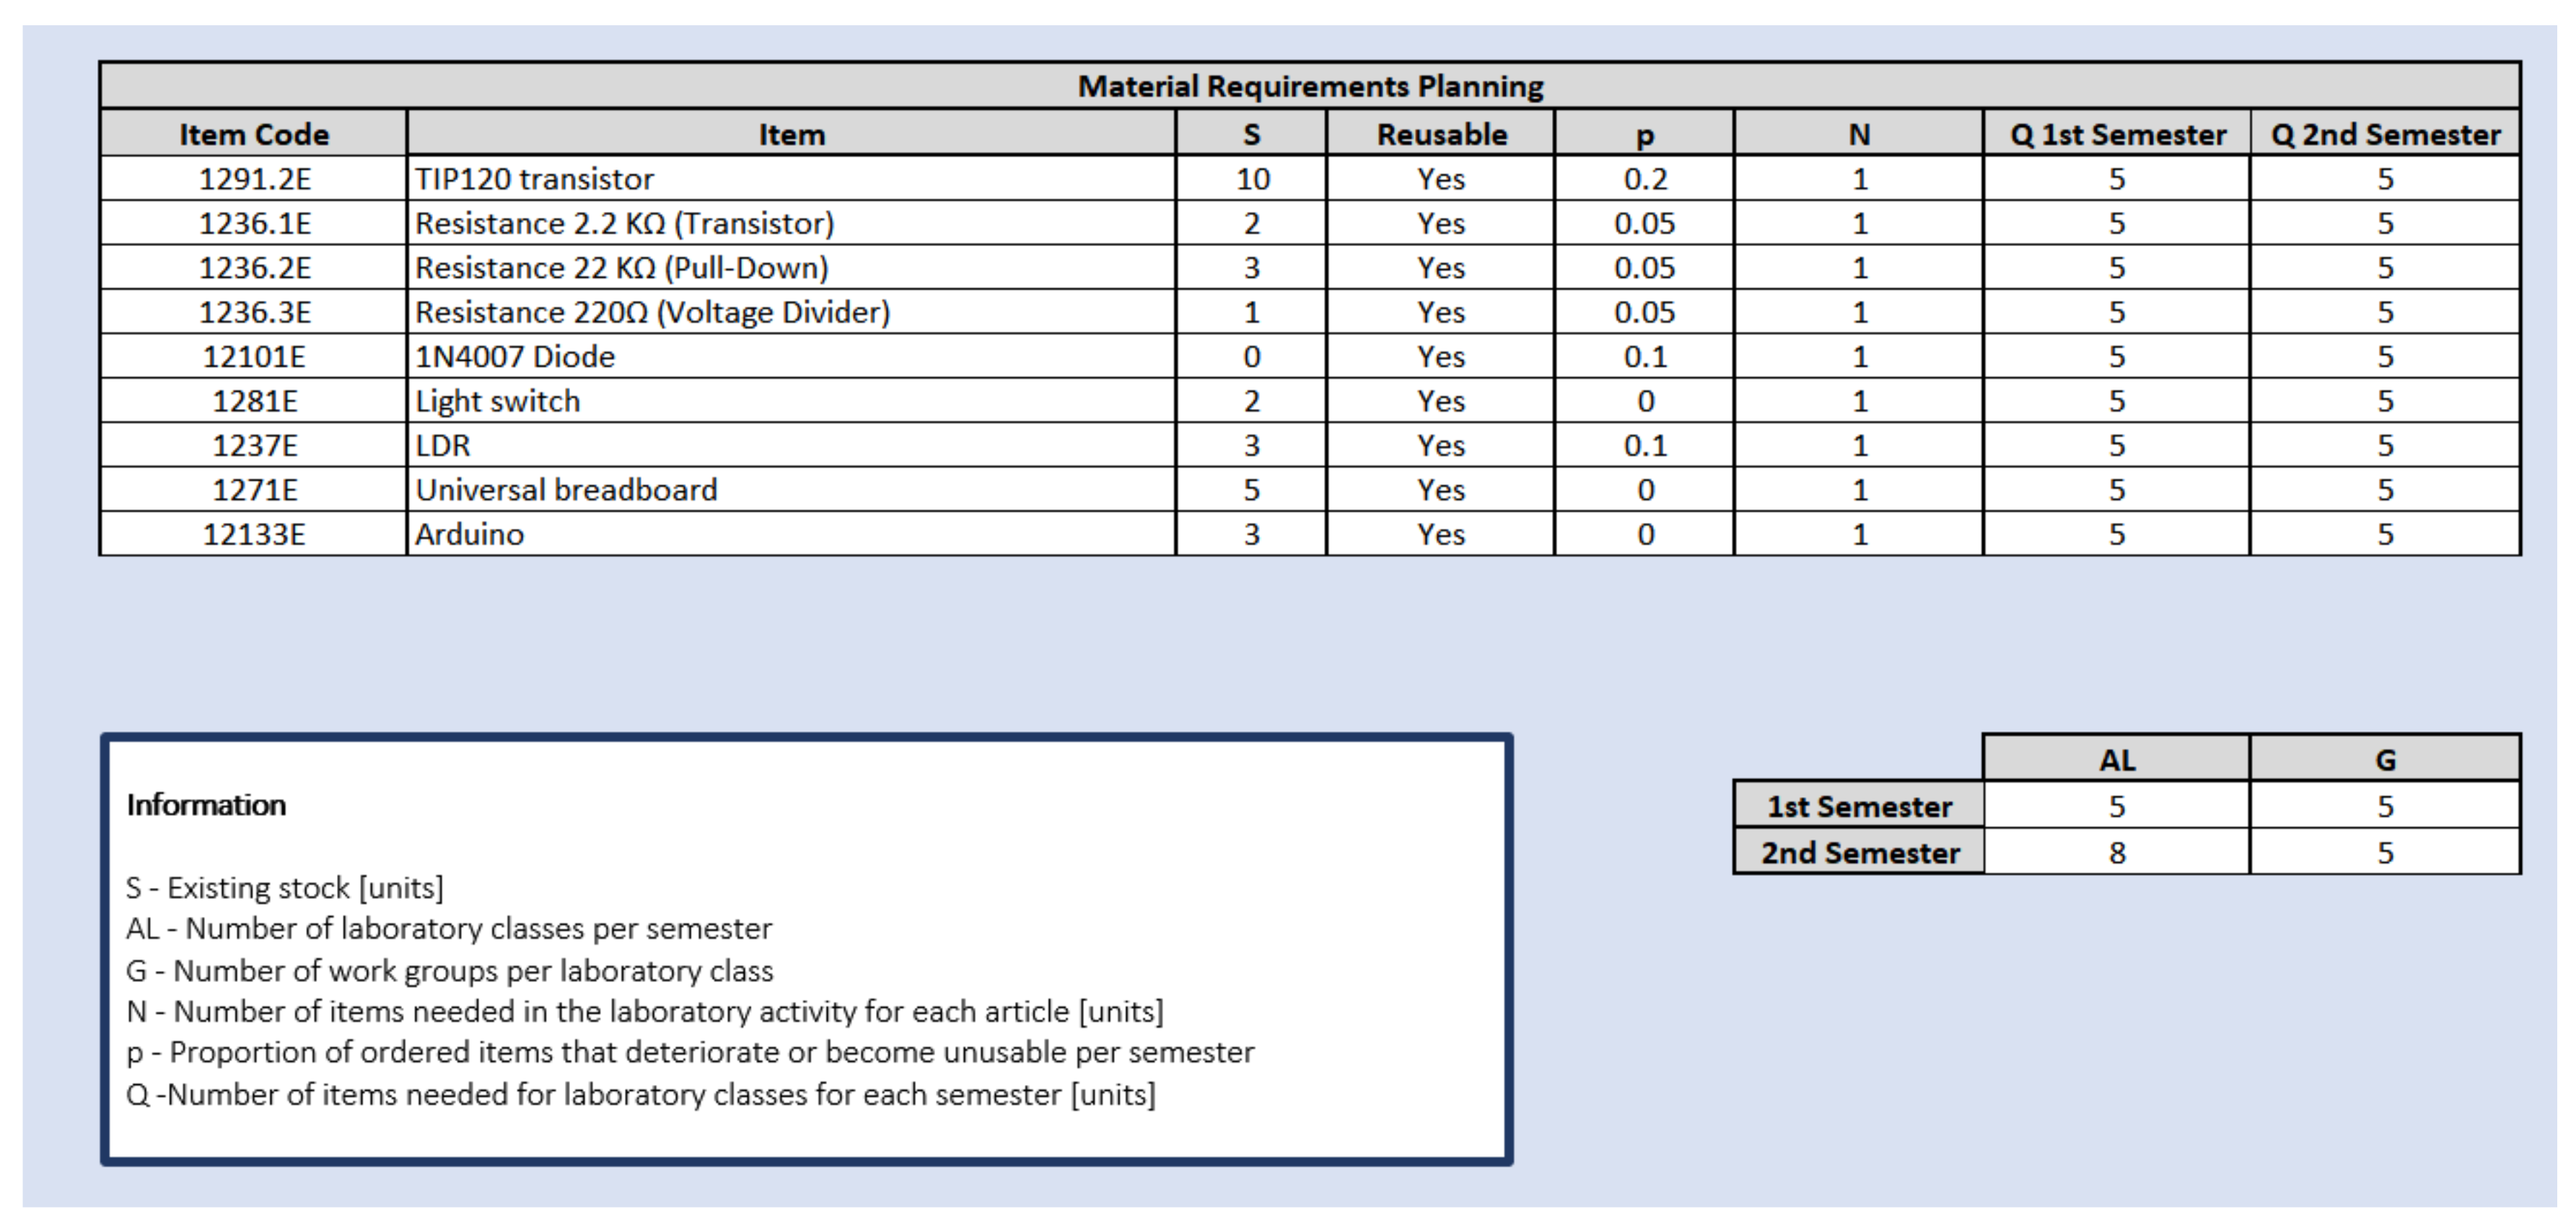
The following sheet, entitled “Semester Planning,” must be completed at the beginning of each semester, after surveying the number of laboratory classes to be taught and the materials needed for each of these classes. In this simulation, the values accepted for each of the parameters are those observed in
Figure 6.
The next three sheets contain the necessary data for stock management throughout the semester.
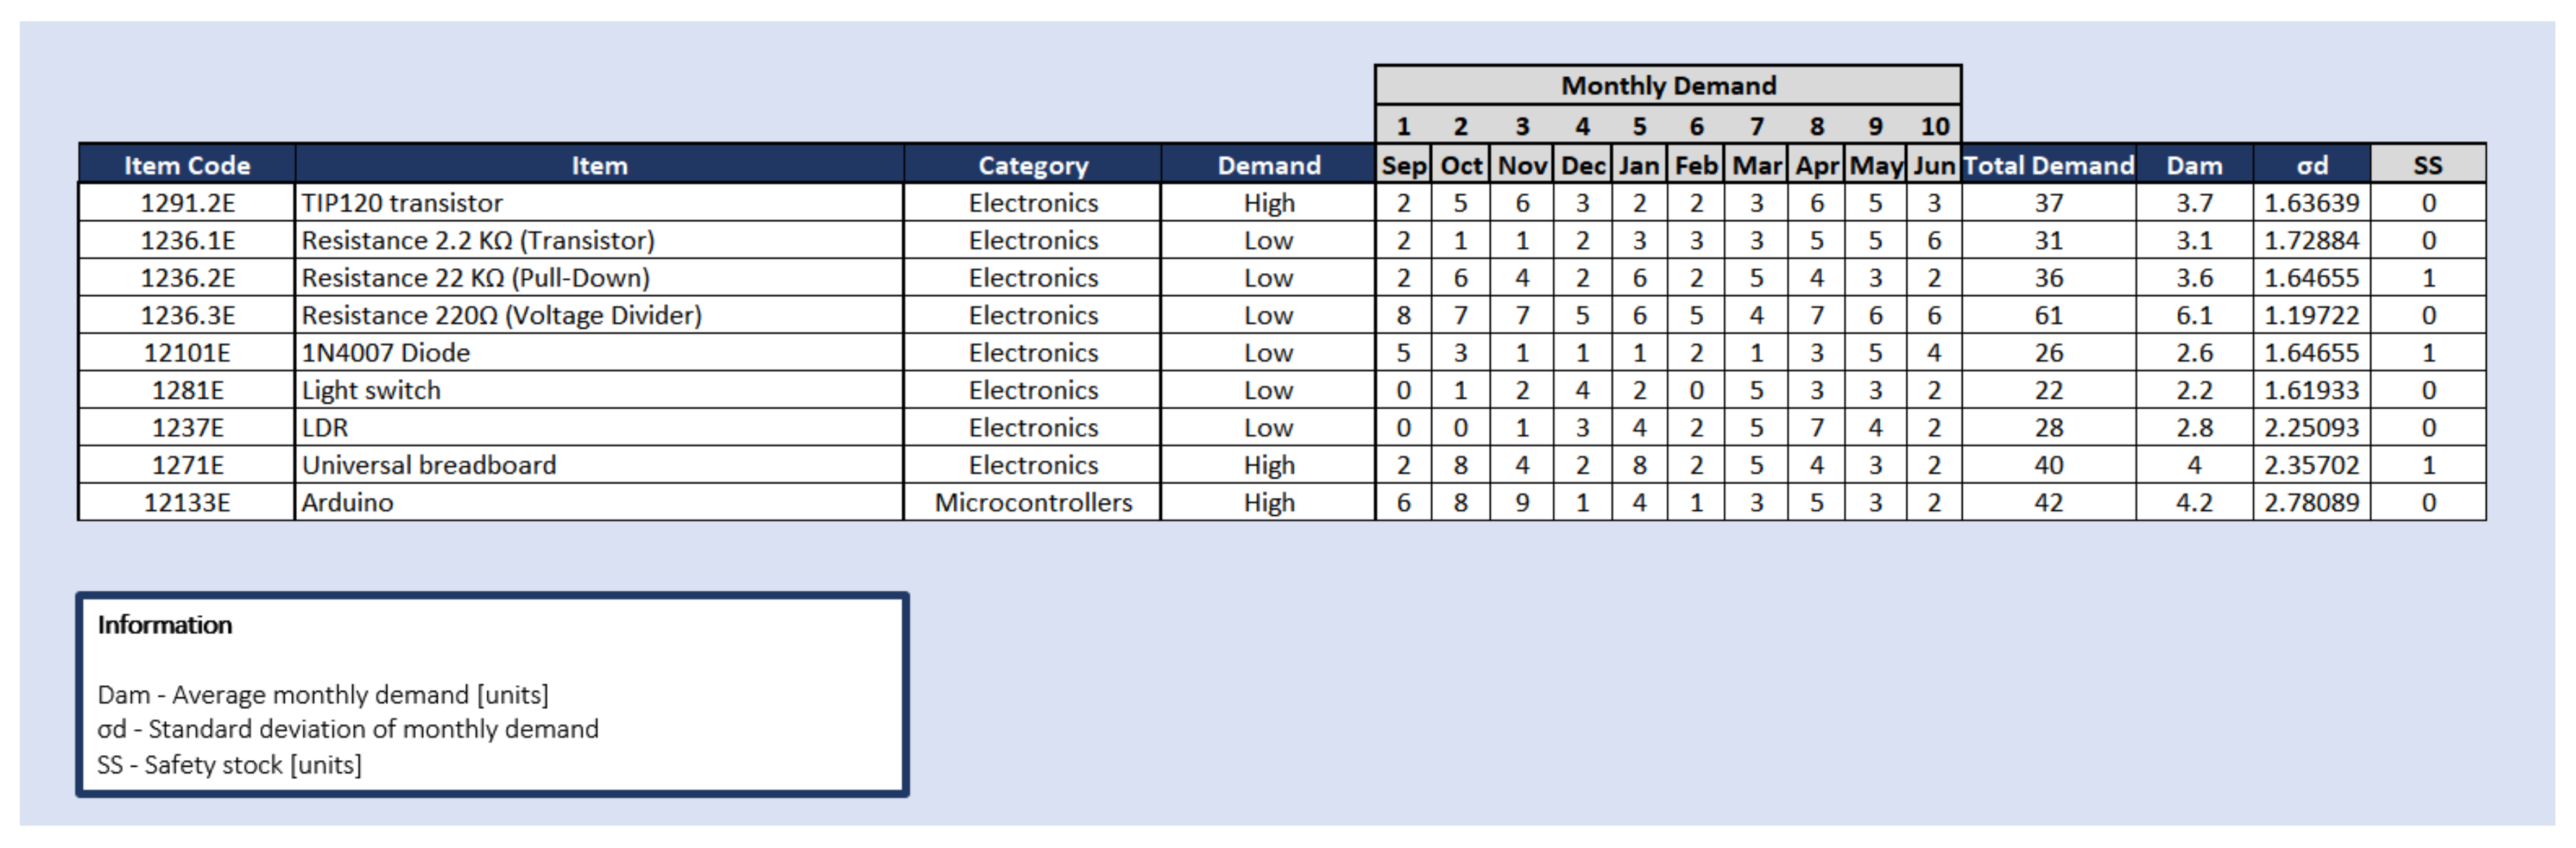
The “Safety Stock” sheet (
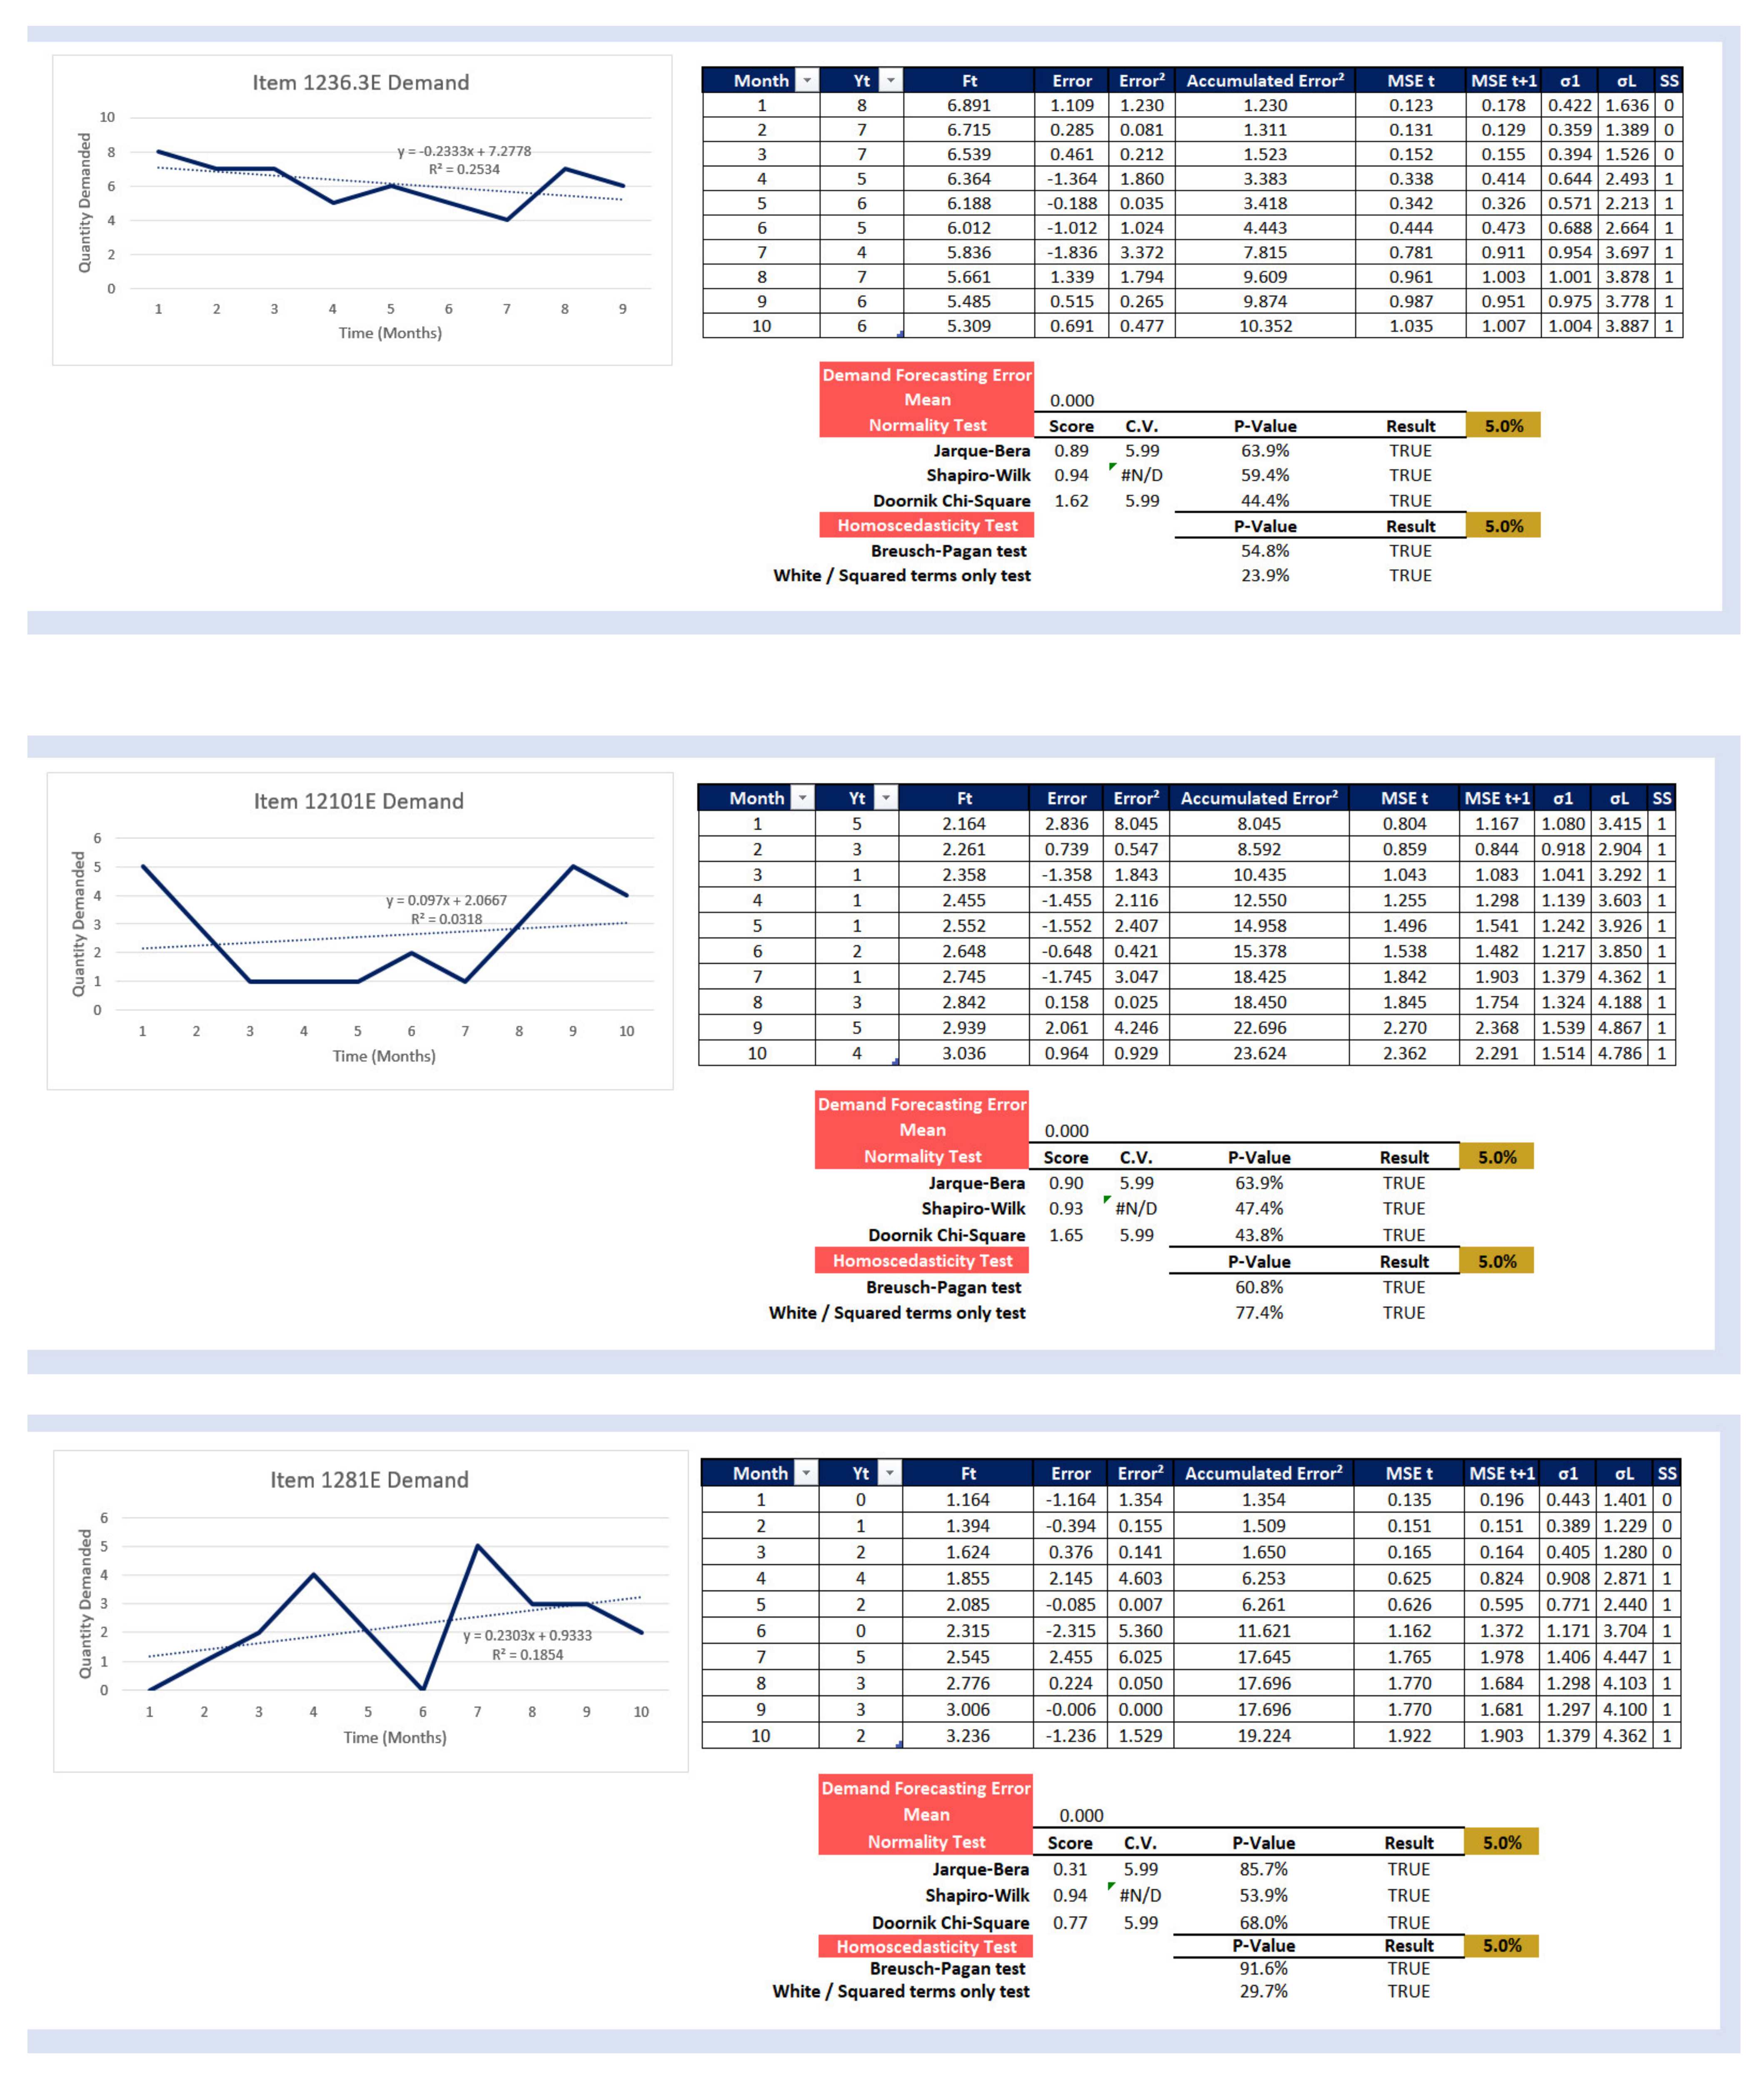
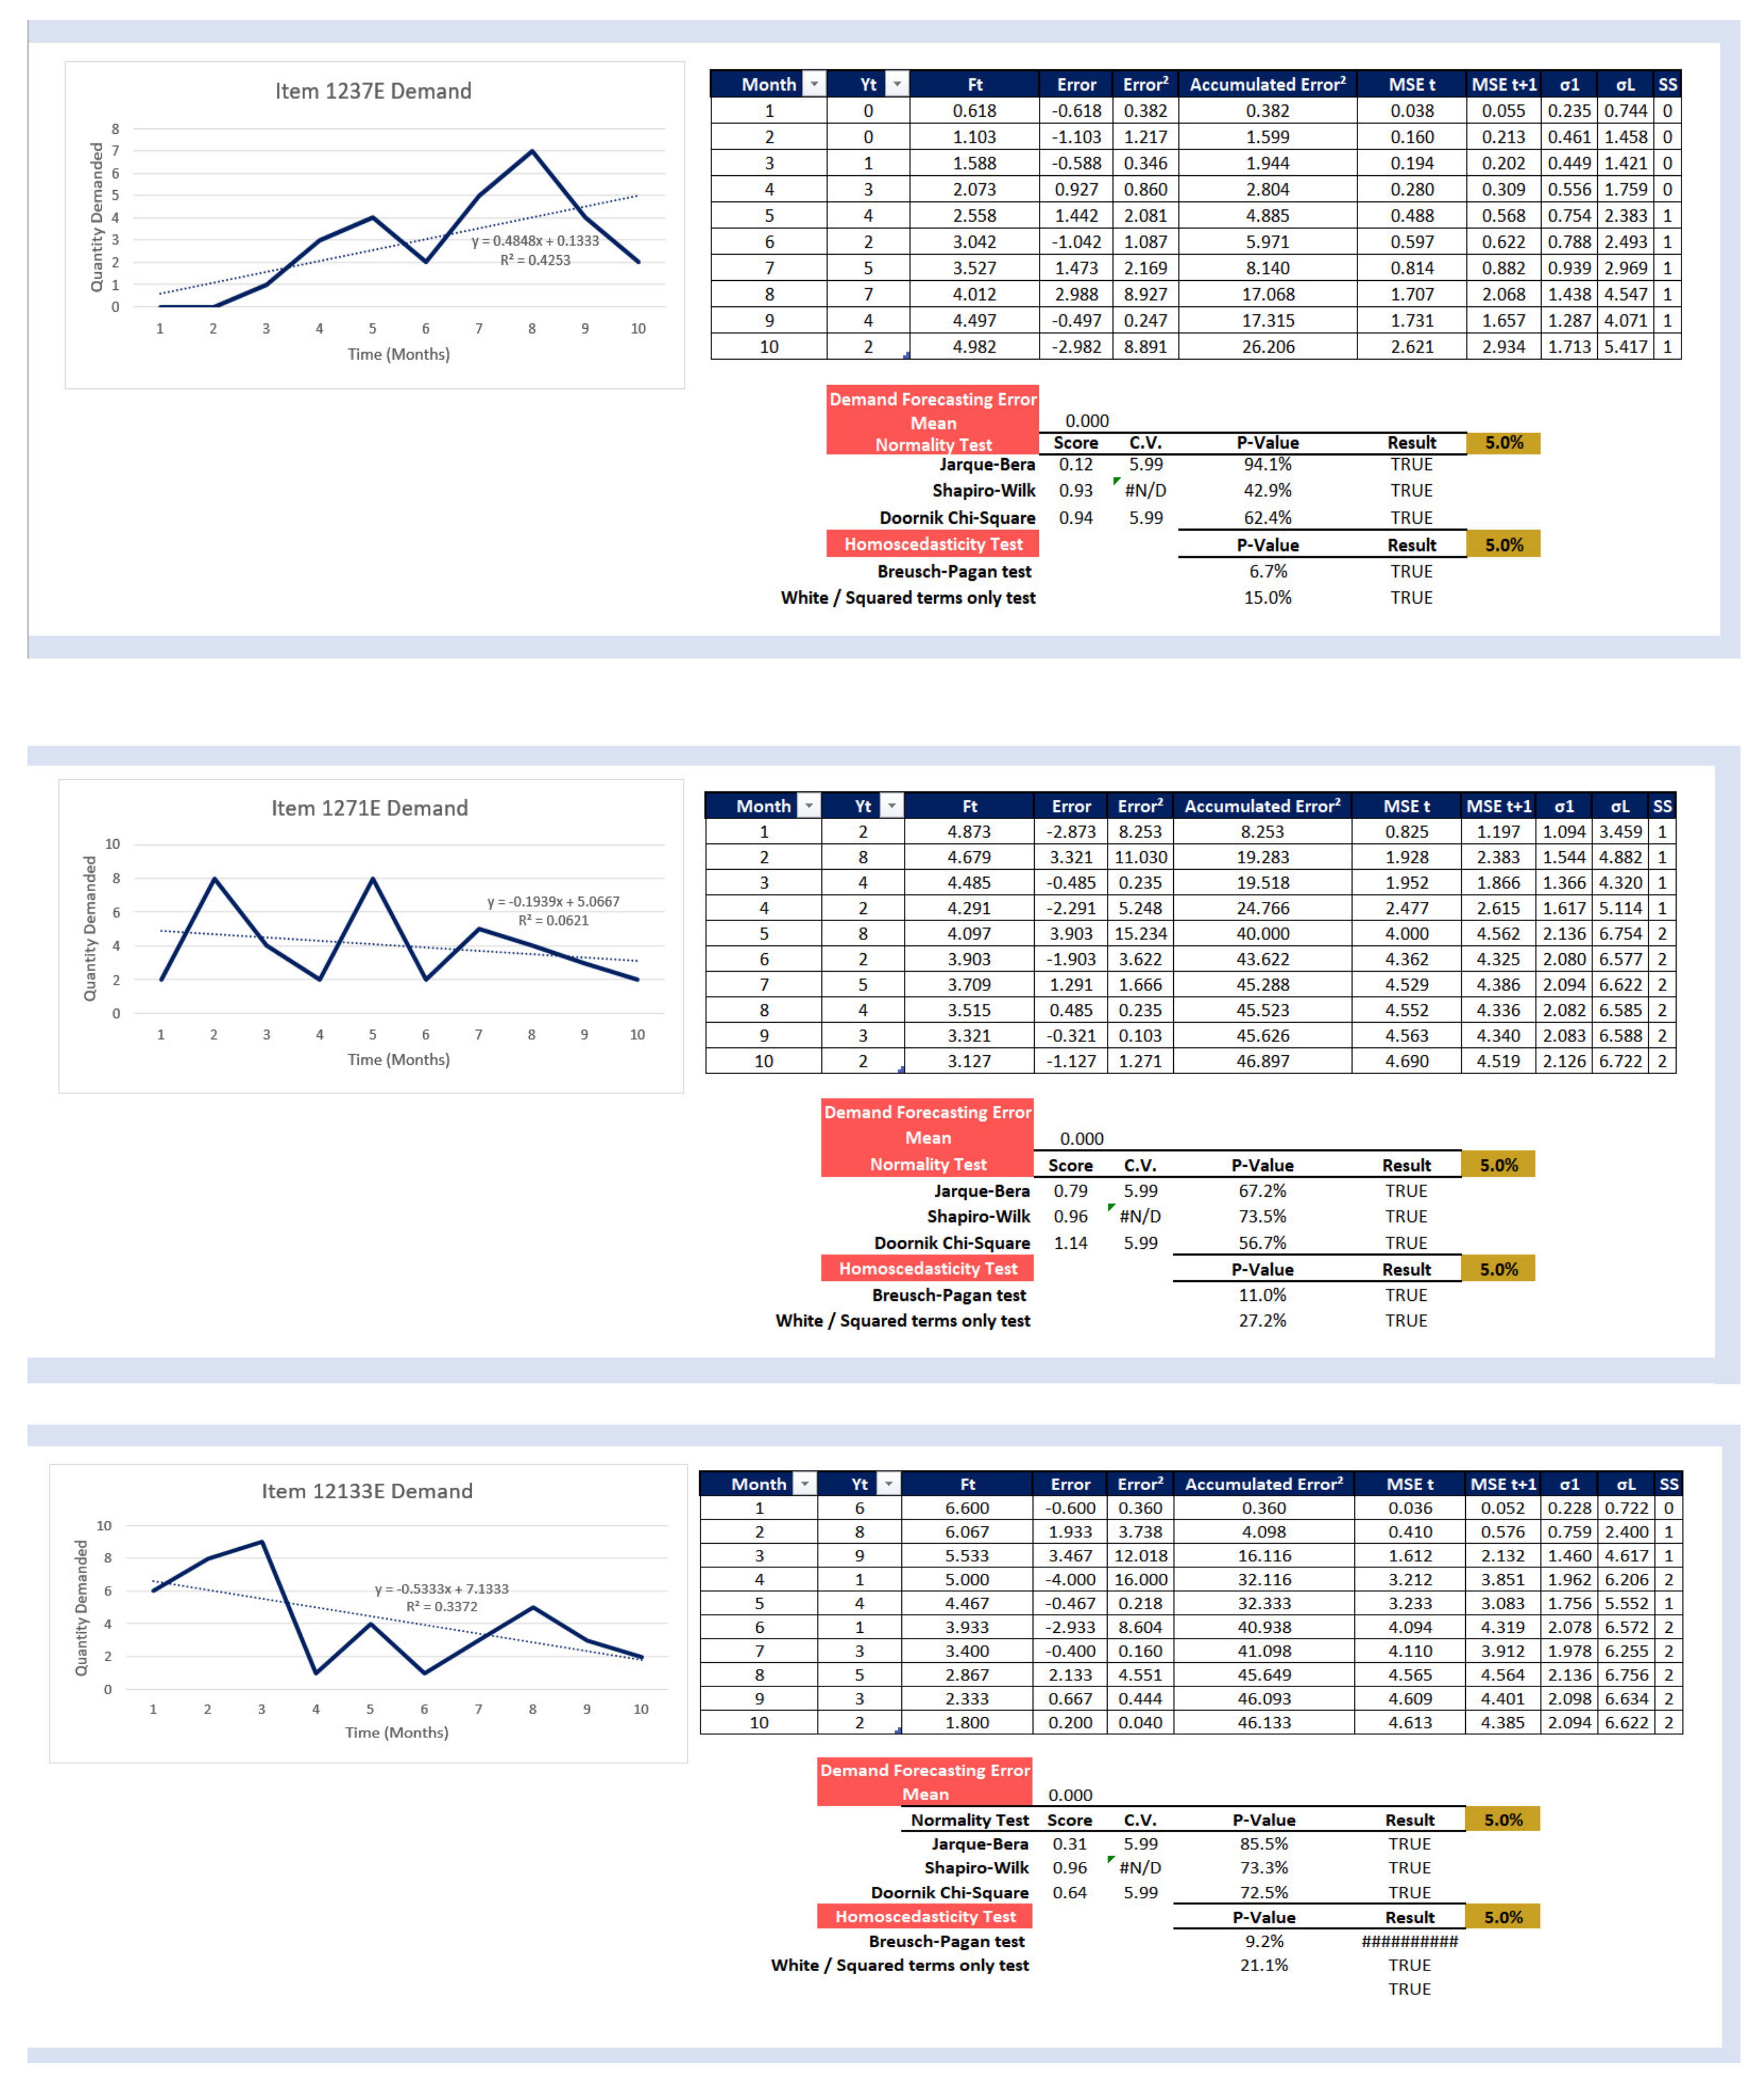
Figure 7) shows the monthly demand in the previous academic year. Based on these data, the average demand, the standard deviation of the demand, and the safety stock that must be kept for each article in the current month are calculated, considering the demand forecast obtained through linear regression. In the presented scenario, the considered current month is September. The fields filled in gray refer to information that must be filled in by the user. Although the safety stock is calculated automatically, the cell is grayed out as the user must verify that the values shown on this sheet correspond to the current month.
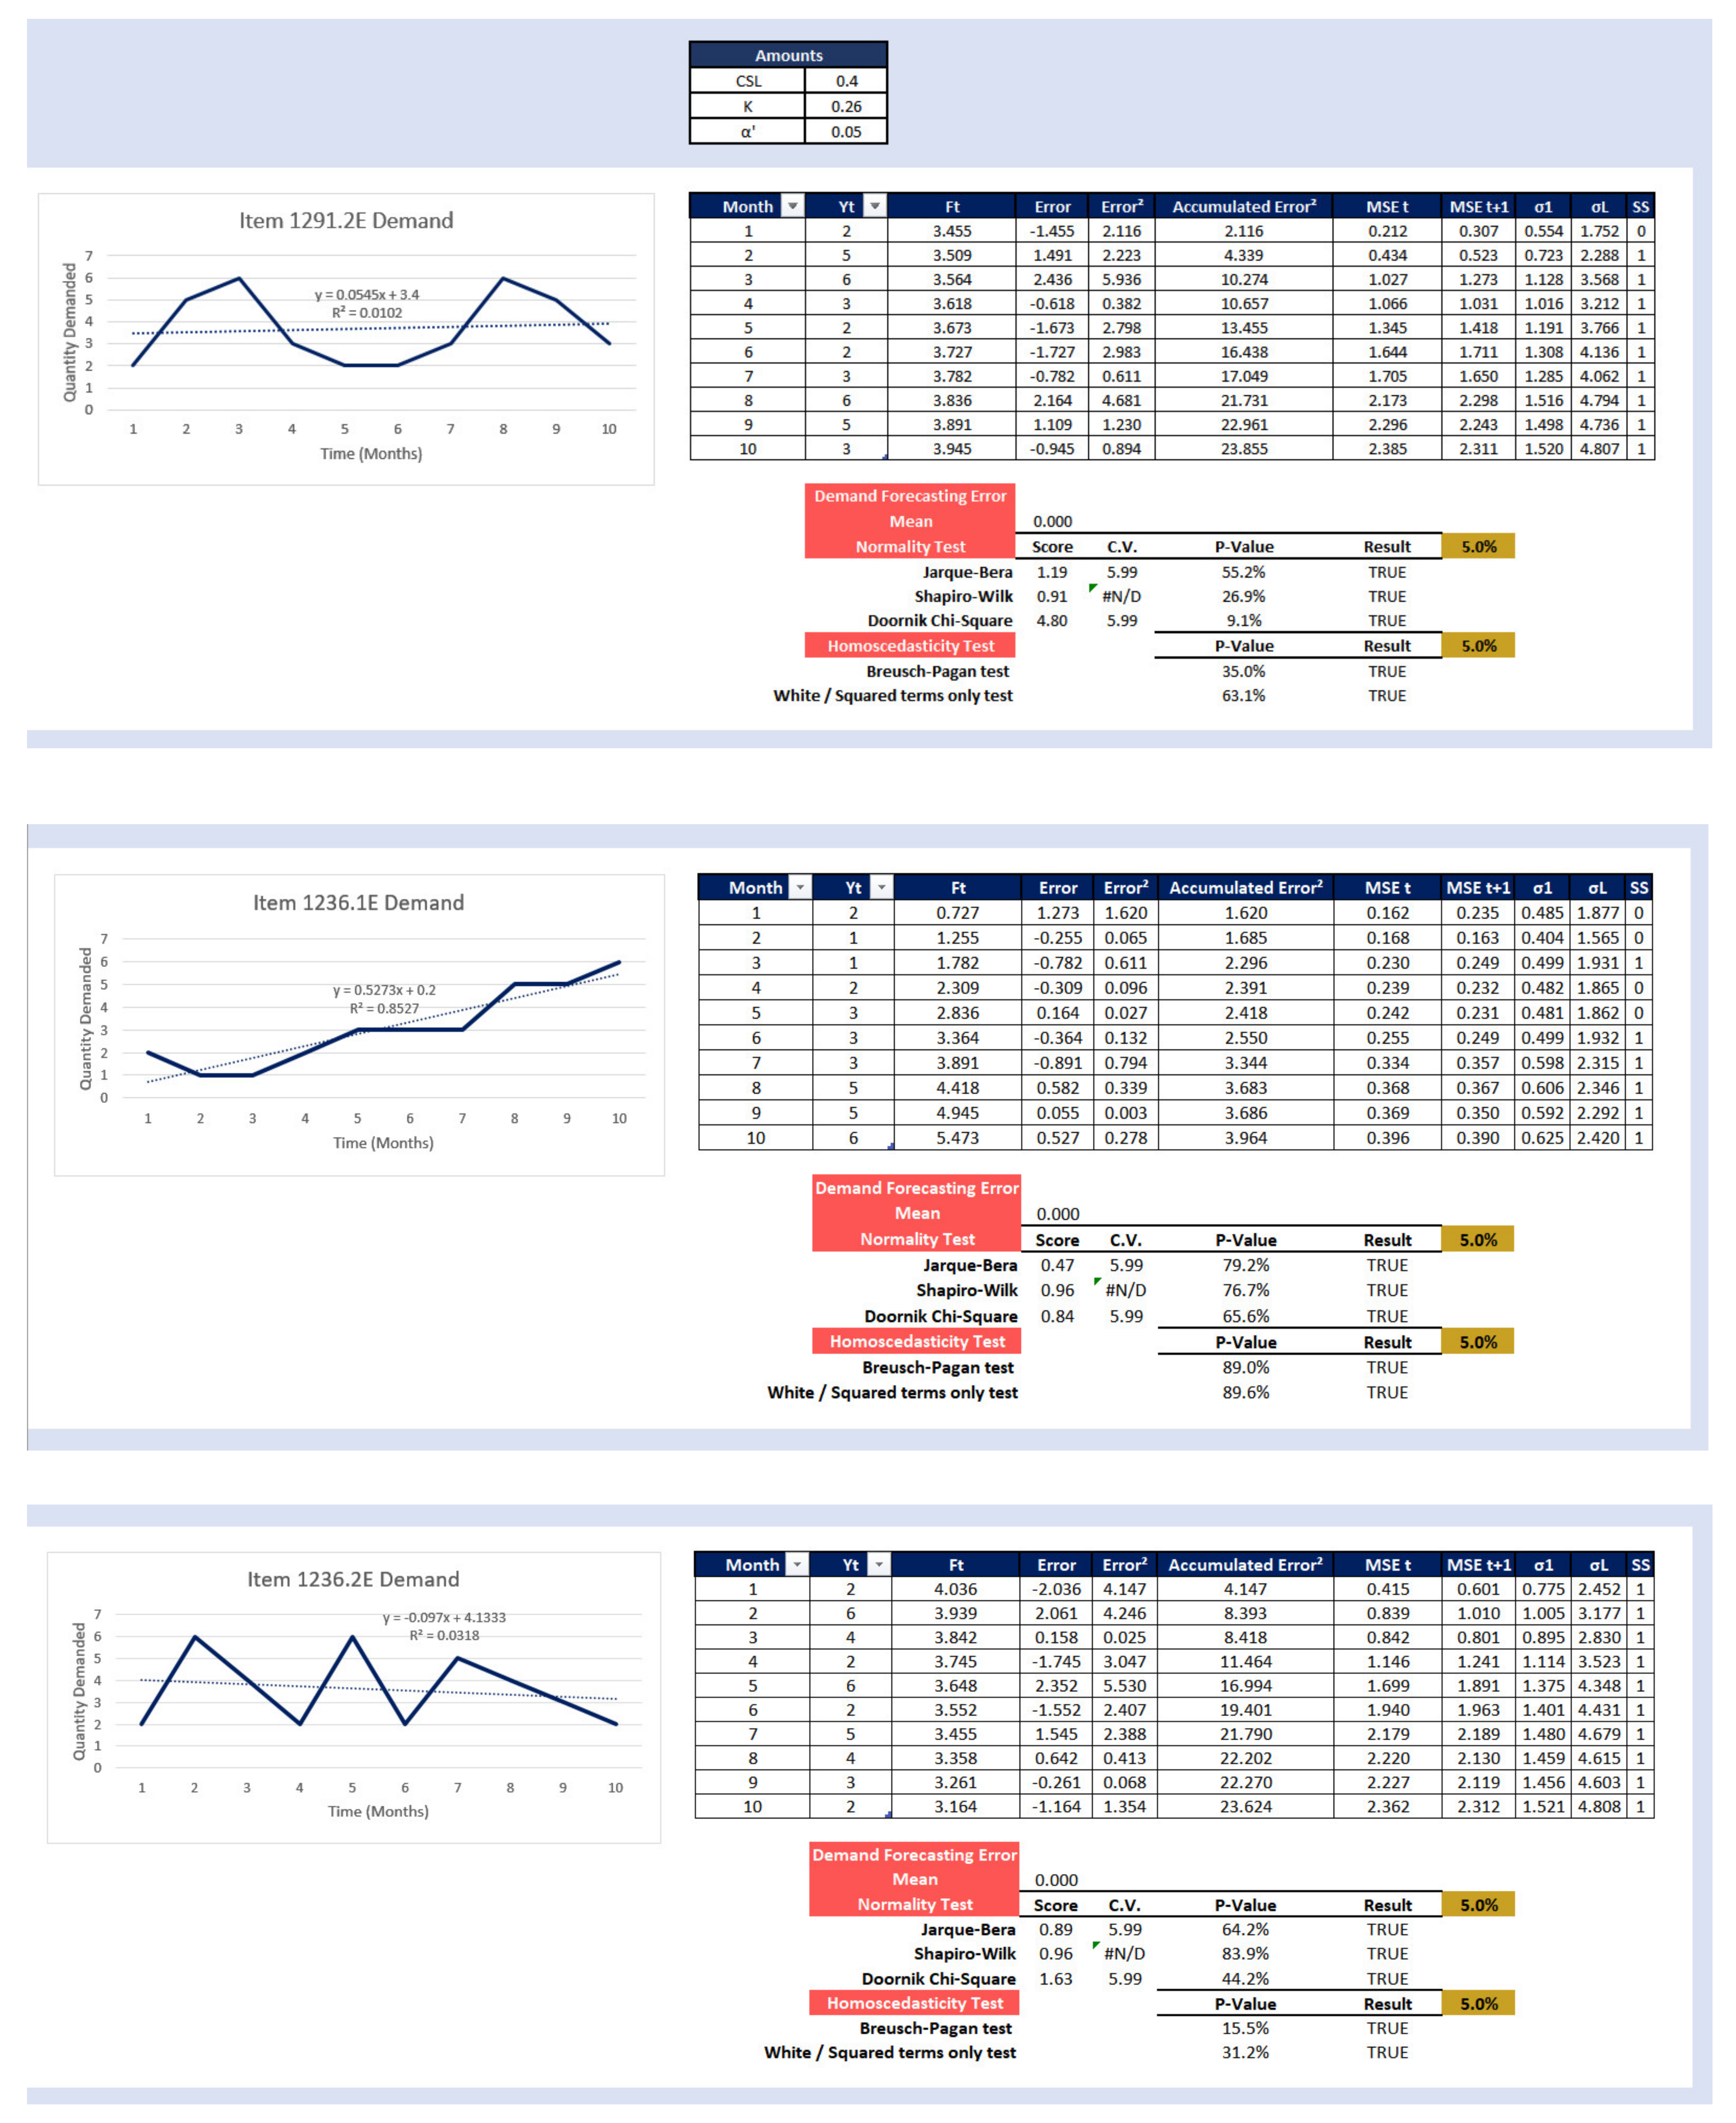
Figure 8 shows the trend lines of each item, the associated equations and coefficient of determination, and the remaining data involved in the safety stock calculation.
Due to variations in the level of demand, depending on the month, a safety stock must be kept according to the time variable. The safety stock values associated with each month are expressed in
Figure 8, as well as the values of the parameters required for their calculation.
For each item, the compliance with the assumption that the demand forecasting error is Gaussian with a zero mean and constant variance was verified through the calculation of the mean error, a normality test, and a homoscedasticity test, corresponding to the cells filled in red in the “Auxiliary Calculation” sheet. The normality test was carried out using NumXL, a suite of time series Excel add-ins, by introducing the demand forecasting errors as “Input Data.” To carry out the heteroscedasticity test, XLSTAT, the statistical software for Excel, was used. The values were obtained by introducing the error values as “residuals” and time (months) variable values as “X/Explanatory variables.”
All normality and homoscedasticity tests available in the aforementioned tools were used, admitting a significance level of 0.05. The DSS was designed to indicate in the “Result” column the value “TRUE” if the normality test indicated that the demand forecast errors followed a normal distribution and whether they were homoscedastic, i.e., with equal variance values.
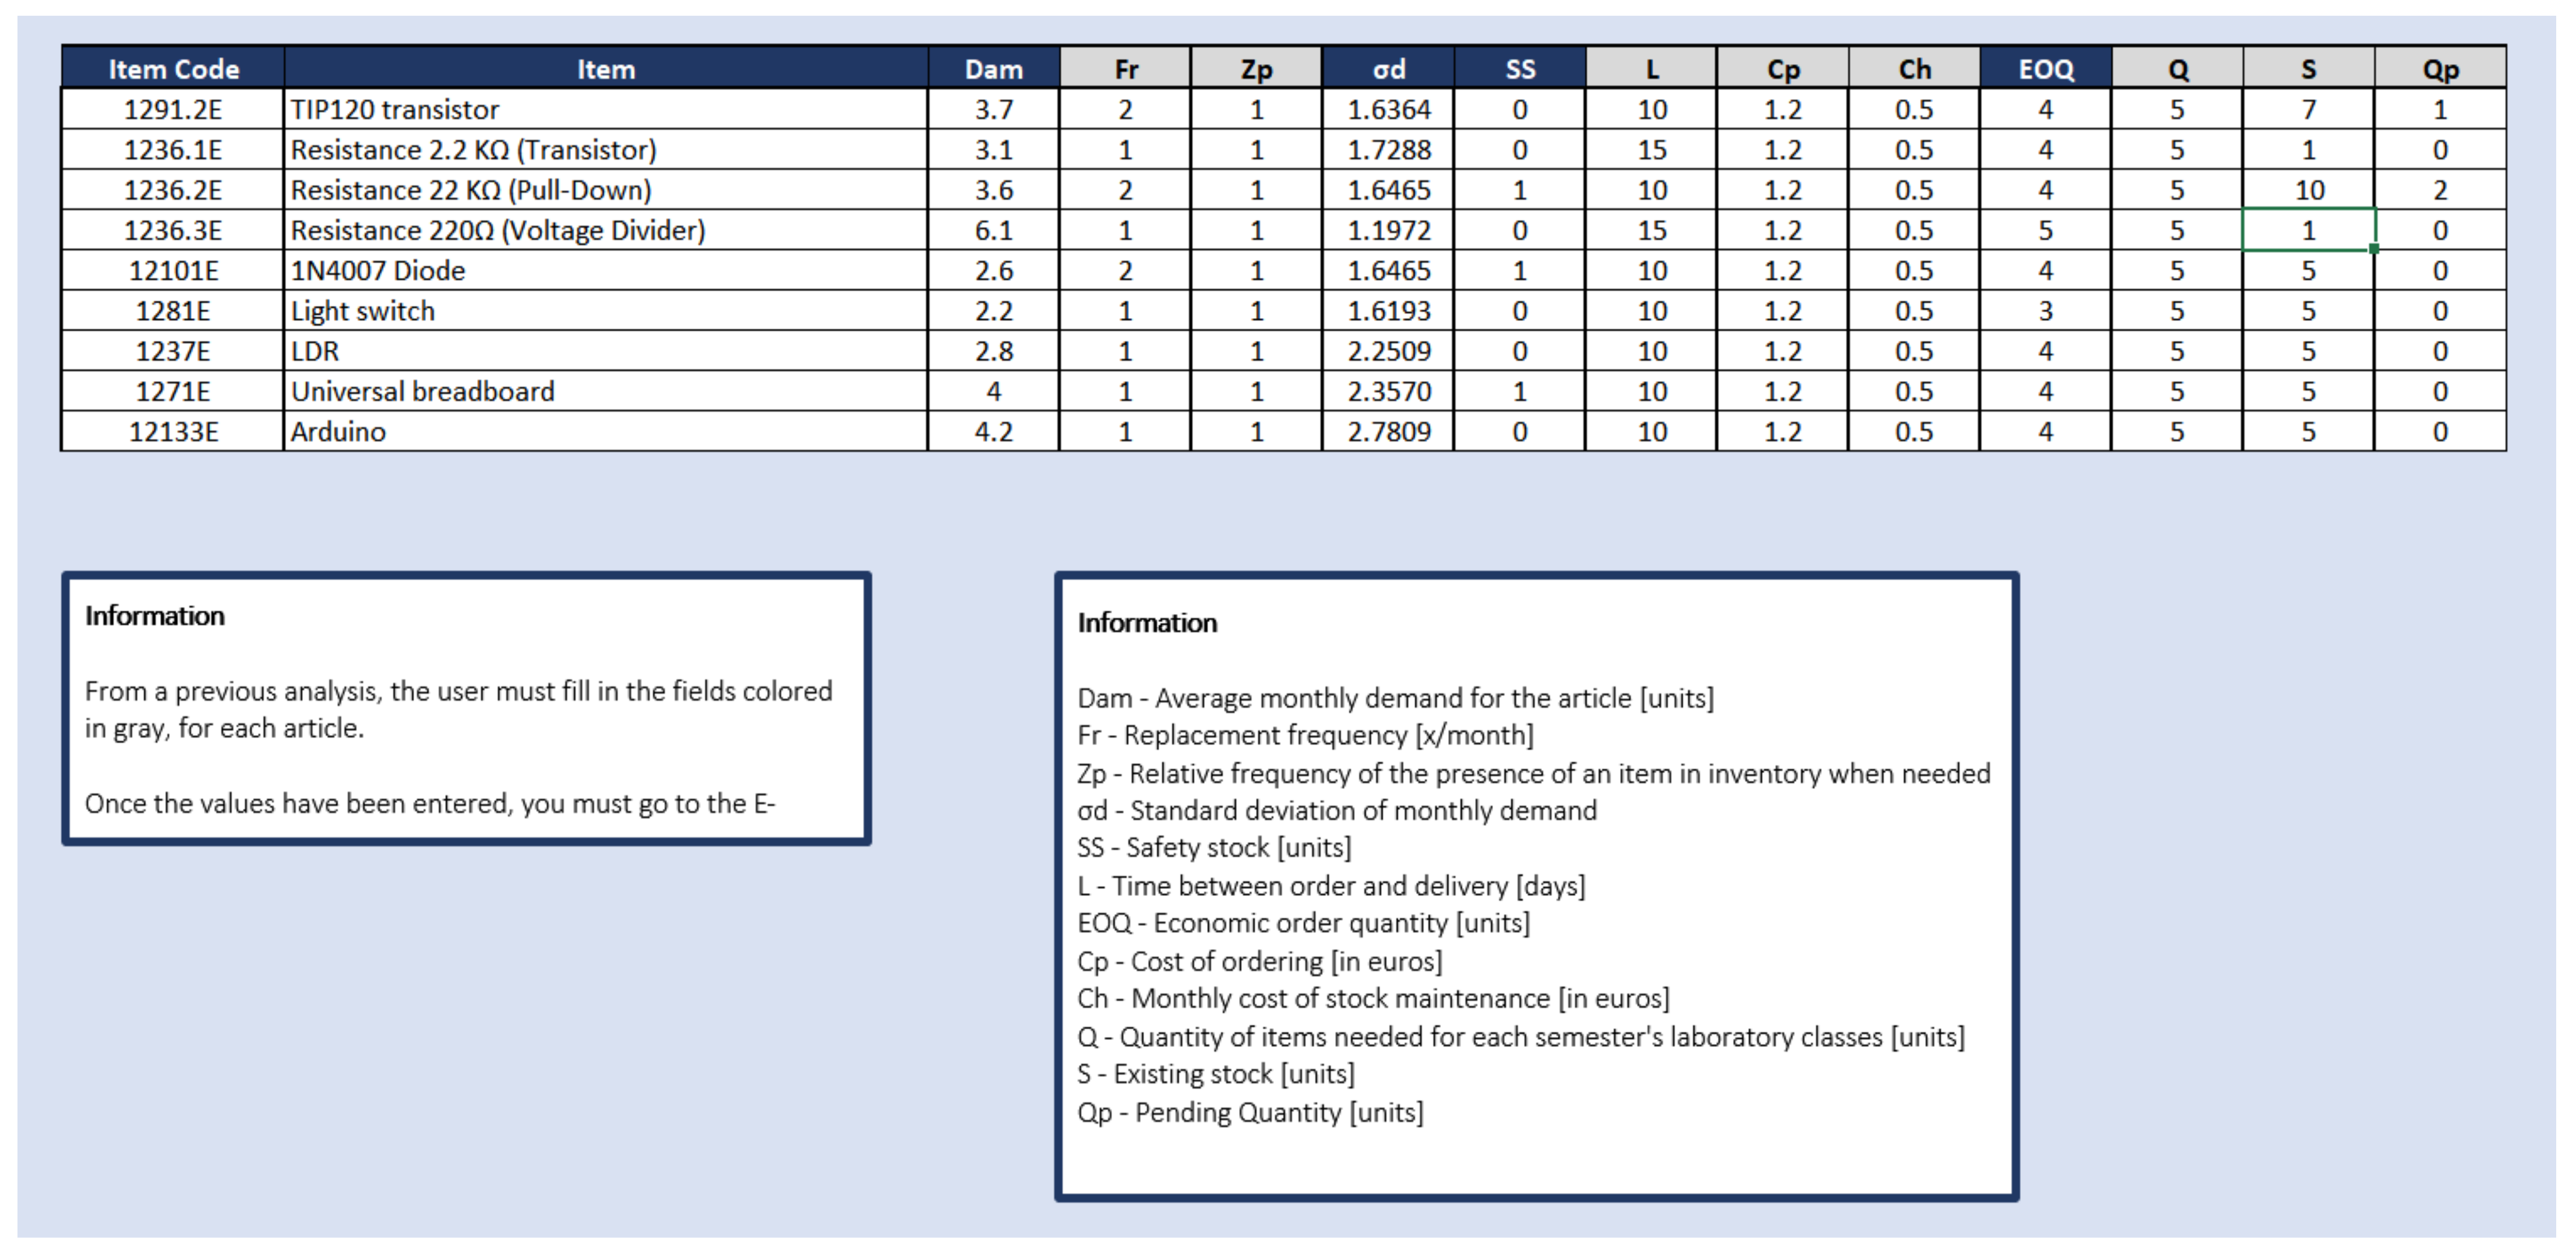
In the “Data” sheet, illustrated in
Figure 9, the values of the necessary parameters to calculate the maximum and minimum stocks of each item appear.
The data in
Figure 7 and
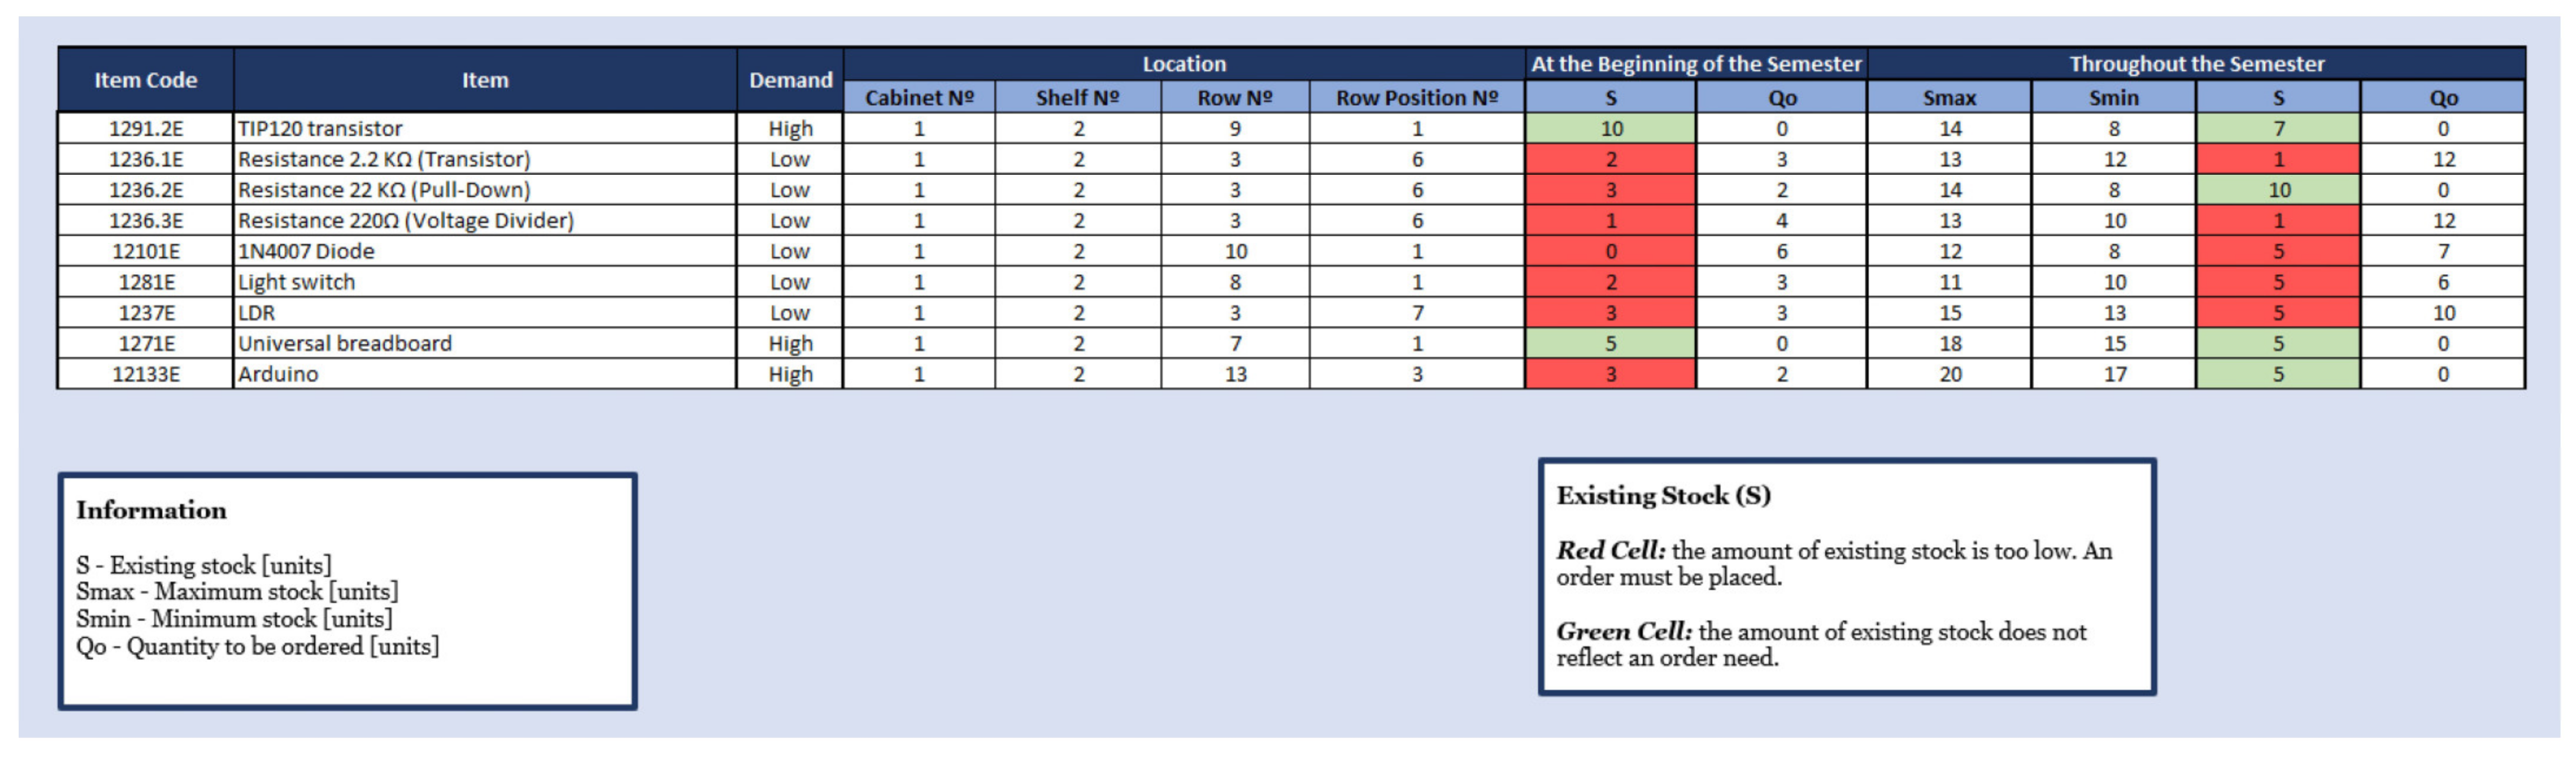
Figure 9 are transferred to the “e-Kanban” sheet, where visual alerts for stock management appear at the beginning of the semester, aiming to guarantee the availability of the necessary materials for each laboratory class. The data in the column corresponding to the Q parameter must be selected from the “Semester Planning” sheet, depending on the semester for which stock management is intended.
Figure 10 reveals that for the proposed application scenario, the visual alerts appear allowing the management of stocks, either at the beginning or throughout the semester, according to the mathematical formulas described in
Section 2.2.
Whenever it is necessary to place an order, the cell with the existing stock is filled in red. Otherwise, the cell appears filled in green.
The DSS was also designed to indicate the quantity to be ordered at the beginning of the semester and throughout it, depending on the level of demand for each item. Furthermore, once most ARL components have small dimensions and, therefore, it is not always easy to identify them, the DSS was also designed to help users to locate each item.
4. Discussion
Regarding workplace organization,
Table 4 presents a comparison of the average execution times of each task associated with the experimental procedure before and after the implementation of Lean tools.
The average setup time, i.e., the time involved in finding the materials needed to perform the experimental procedure, reduced by 93%. While before the application of Lean tools, the search for materials represented 79% of the total duration of the activity, after the application of Lean tools, it represented 33%.
Concordantly, studies conducted in university laboratory environments that applied the 5S methodology have reported reductions in setup time. Jiménez et al. [
25] achieved a 30% reduction in the setup time of practical activities, and Sremcev et al. [
8] reported that the setup time reduced by four times (from 32 min to just 8) and the teaching time reduced by 20% (from 85 min to 68).
Observing the results obtained in this case study, it is relevant to point out that after the implementation of Lean tools, the average execution time of the subsequent activities to the search for materials was also reduced.
The results in
Table 4 exhibit a significant run-time reduction in steps 3 and 4, of 54% and 61%, respectively. This reduction can be explained by the experience gained on the part of the participants by repeating the same experimental procedure. However, the most significant gain in time is associated with the search for materials, which verified the highest run-time reduction value—93%.
Regarding the application of LT for the elaboration of a DSS to provide more efficient stock management, an e-Kanban system was conceived, which signals the need to place an order and indicates the quantity to be ordered, to avoid stock ruptures and, at the same time, avoid costs and inefficient use of the workplace, which excess stock entails.
Moreover, the stock control proposed for the beginning of the semester, considering each laboratory protocol and the necessary quantities of material, aims to ensure the availability of materials necessary for teaching. The determination of material needs in advance is based on the pull system, corresponding to one of the basic principles of the Lean philosophy.
The DSS calculates the quantity needed, considering two possible situations: the materials can be used in more than one laboratory activity, or they can be used only once.
In addition, since it is common for some materials to deteriorate, the percentage of items that are expected to become unusable is added to the order quantity.
Using different mathematical formulas, the stock management proposed throughout the semester considers the level of demand and aims to guarantee the availability of necessary materials, not only for teaching activities, but also for research, according to the expected demand.
According to
Figure 8, the coefficient of determination (R
2) values indicate that despite being one of the widely used methods for forecasting demand [
33], the use of linear regression might not be appropriate for all the items. The simulation results illustrate the need for further research on how to incorporate in the designed DSS a mechanism to choose and apply a better method for forecasting demand, considering demand fluctuation for each item.
5. Conclusions
The proposed implementation of Lean tools grants to achieve the project’s goals, which consisted in improving the organization of the ARL space to reduce the setup time of practical activities and propose a DSS with the potential to improve stock management. There was a 93% reduction in the average setup time of an experimental procedure and a reduction in the total average execution time of 84%.
Additionally, it was possible to demonstrate that the DSS correctly calculates the quantity to be ordered for the various items used, according to the selected mathematical formulas. The DSS is divided into two systems: one of them must be used at the beginning of the semester and applied to all the items necessary to carry out the practical activities of laboratory classes throughout the semester. This system can be an asset in the teaching laboratory environment, as it ensures in advance the presence of items necessary for teaching activities.
Regarding the benefits associated with the proposed model, it is important to highlight the ease with which it can be used in different organizations. Although the model was designed for teaching and research laboratories, the mathematical formulas used for stock management throughout the semester can be replicated for stock management in other organizations.
An additional positive aspect of the designed DSS is the fact that it can be easily applied since it uses a tool commonly used in several organizations for data processing (Excel) that has reduced implementation costs when compared to other computerized and automatic methods.
Concerning theoretical implications, this study contributes to the literature by developing an e-Kanban DSS for stock management in teaching and research laboratories. In addition, this study adds to the literature on stock management by including, in a single decision system, factors such as demand forecasting to calculate safety stocks, the level of demand (high or low), and the deterioration to which the most fragile components are subject.
Furthermore, notwithstanding the limited sample selected to assess the impact of Lean tool implementation, this study confirms that by implementing 5S and Visual Management methodologies, the setup time of laboratory activities can be reduced.
Regarding practical implications, by describing the approach followed, this study provides a practical guide to implementing Lean tools in teaching and researching environments regarding workplace organization, codification, and stock management that might be useful for policymakers in academic institutions.
This research, however, is subject to several limitations, namely:
The run times of the temperature measurement were only taken once for each participant, before and after Lean tool implementation, and the experimental procedure was carried out only by three individuals.
The safety stock calculation used in the DSS is only valid if the demand forecasting error is an i.i.d. Gaussian with zero mean and constant variance.
The absence of real data makes it impossible to evaluate the effectiveness and efficiency of the proposed model in reducing costs and increasing the quality of teaching service or to quantify its real impact on the reduction in the frequent scarcity of materials.
The efficiency of the DSS depends on the frequent updating of the existing stock values for each article.
Concerning proposals for future research work, the following topics are highlighted:
Application of the same lean methods (5S, Visual Management, and SMED) in other teaching institutions and test their efficiency;
Assessment of the impact of the 5S methodology on the reduction in damaged materials, since in environments where fragile components are used, there are relevant associated costs;
Application of the proposed DSS in a real context and assessment of its impact in terms of reducing stockouts and costs;
Development of a training plan for technicians, professors, or managers about how to keep the database always updated and reliable;
Evaluation over time of the effectiveness and efficiency of the implementation of the 5S methodology in the ARL and in other laboratories where similar Lean methodologies were applied;
Automatic identification of materials, which would allow a permanently updated record of the existing stock;
Research on more appropriate empirical approaches applied to safety stock calculation, since often the forecast error does not fulfil the assumption that the demand forecasting error is an i.i.d. Gaussian with zero mean and constant variance;
Inclusion of a mechanism to choose and apply an appropriate method for forecasting demand, considering the demand fluctuation for each item in the designed DSS.


