Article

Enhanced Heart Disease Prediction Based on Machine Learning and χ2 Statistical Optimal Feature Selection Model

by
Raniya R. Sarra
1,
Ahmed M. Dinar
1,*,
Mazin Abed Mohammed
2 and
Karrar Hameed Abdulkareem
3
1
Computer Engineering Department, University of Technology-Iraq, Baghdad 19006, Iraq
2
College of Computer Science and Information Technology, University of Anbar, Anbar 31001, Iraq
3
College of Agriculture, Al-Muthanna University, Samawah 66001, Iraq
*
Author to whom correspondence should be addressed.
Designs 2022, 6(5), 87; https://doi.org/10.3390/designs6050087
Submission received: 20 June 2022 / Revised: 31 August 2022 / Accepted: 5 September 2022 / Published: 29 September 2022
(This article belongs to the Special Issue Design of Reliable Framework for Healthcare Data Assessment)

Abstract

:
Automatic heart disease prediction is a major global health concern. Effective cardiac treatment requires an accurate heart disease prognosis. Therefore, this paper proposes a new heart disease classification model based on the support vector machine (SVM) algorithm for improved heart disease detection. To increase prediction accuracy, the χ2 statistical optimum feature selection technique was used. The suggested model’s performance was then validated by comparing it to traditional models using several performance measures. The proposed model increased accuracy from 85.29% to 89.7%. Additionally, the componential load was reduced by half. This result indicates that our system outperformed other state-of-the-art methods in predicting heart disease.

1. Introduction

At present, the load on a person has increased significantly due to increased work. Because of this dire circumstance that cannot be avoided, there is a high probability that the person will suffer from heart disease [1,2,3]. According to the 2018 World Heart Federation study, heart disease causes millions of deaths annually. A decrease in the amount of blood flowing to the brain, heart, lungs, and other important organs is the cause of heart disorders (HDs). Congestive heart failure is the most common type of cardiovascular disease and the least serious. In human anatomy, blood veins are responsible for transporting blood to the heart. Other factors that contribute to heart disease include defective heart valves, which can result in heart failure. A typical symptom of cardiac disease is muscle soreness in the upper abdominal area, which might be accompanied by anesthesia. Decreasing blood pressure, minimizing cholesterol, and engaging in regular physical activity are all suggested to lower the risk of heart disease. Heart disease is most related to angina pectoris, dilated cardiomyopathy, stroke, and congestive heart failure, among other things. As a result, it is necessary to monitor cardiovascular disease (CVD) biomarkers and consult with healthcare physicians [4,5,6].
Since ancient times, humans have significantly improved in terms of machines and health care. In modern times, after the entry of machines and artificial intelligent (AI) in medicine and health care, there has been significant developments and improvements in medicine and health care [7,8,9,10]. When it comes to heart disease, determining a person’s risk of heart failure is a major concern [11,12]. The application of multiple longitudinal study auto-regression analyses results in the construction of the prediction method [13]. Because of changes in technology, healthcare facilities now must store a huge amount of data in their databases, which makes it very hard to figure out what the data means.
The study of how computers acquire knowledge via observation and experience is known as machine learning. Machine-learning (ML) algorithms have the potential to tackle a wide range of problems in the management of specific medical centers and the analysis of data [14]. Analyzing and interpreting large datasets is made easier using these tools and methods. Heart disease is characterized by several factors, including age, cholesterol, weight, height, sex, blood pressure, resting ECG (electrocardiogram), chest pain, smoking, obesity, and eating habits [15,16]. Another challenge in this field is the large number of features used in heart disease prediction, which makes the task somewhat difficult. Additionally, the number of features makes it difficult to classify in machine learning and, in turn, affects performance and thus reduces the accuracy value of ML systems. Therefore, the following offers a significant contribution to this developed heart disease diagnosis:
  • To develop a new heart disease (HD) classification model based on the ML (SVM) algorithm to improve the detection of heart disease;
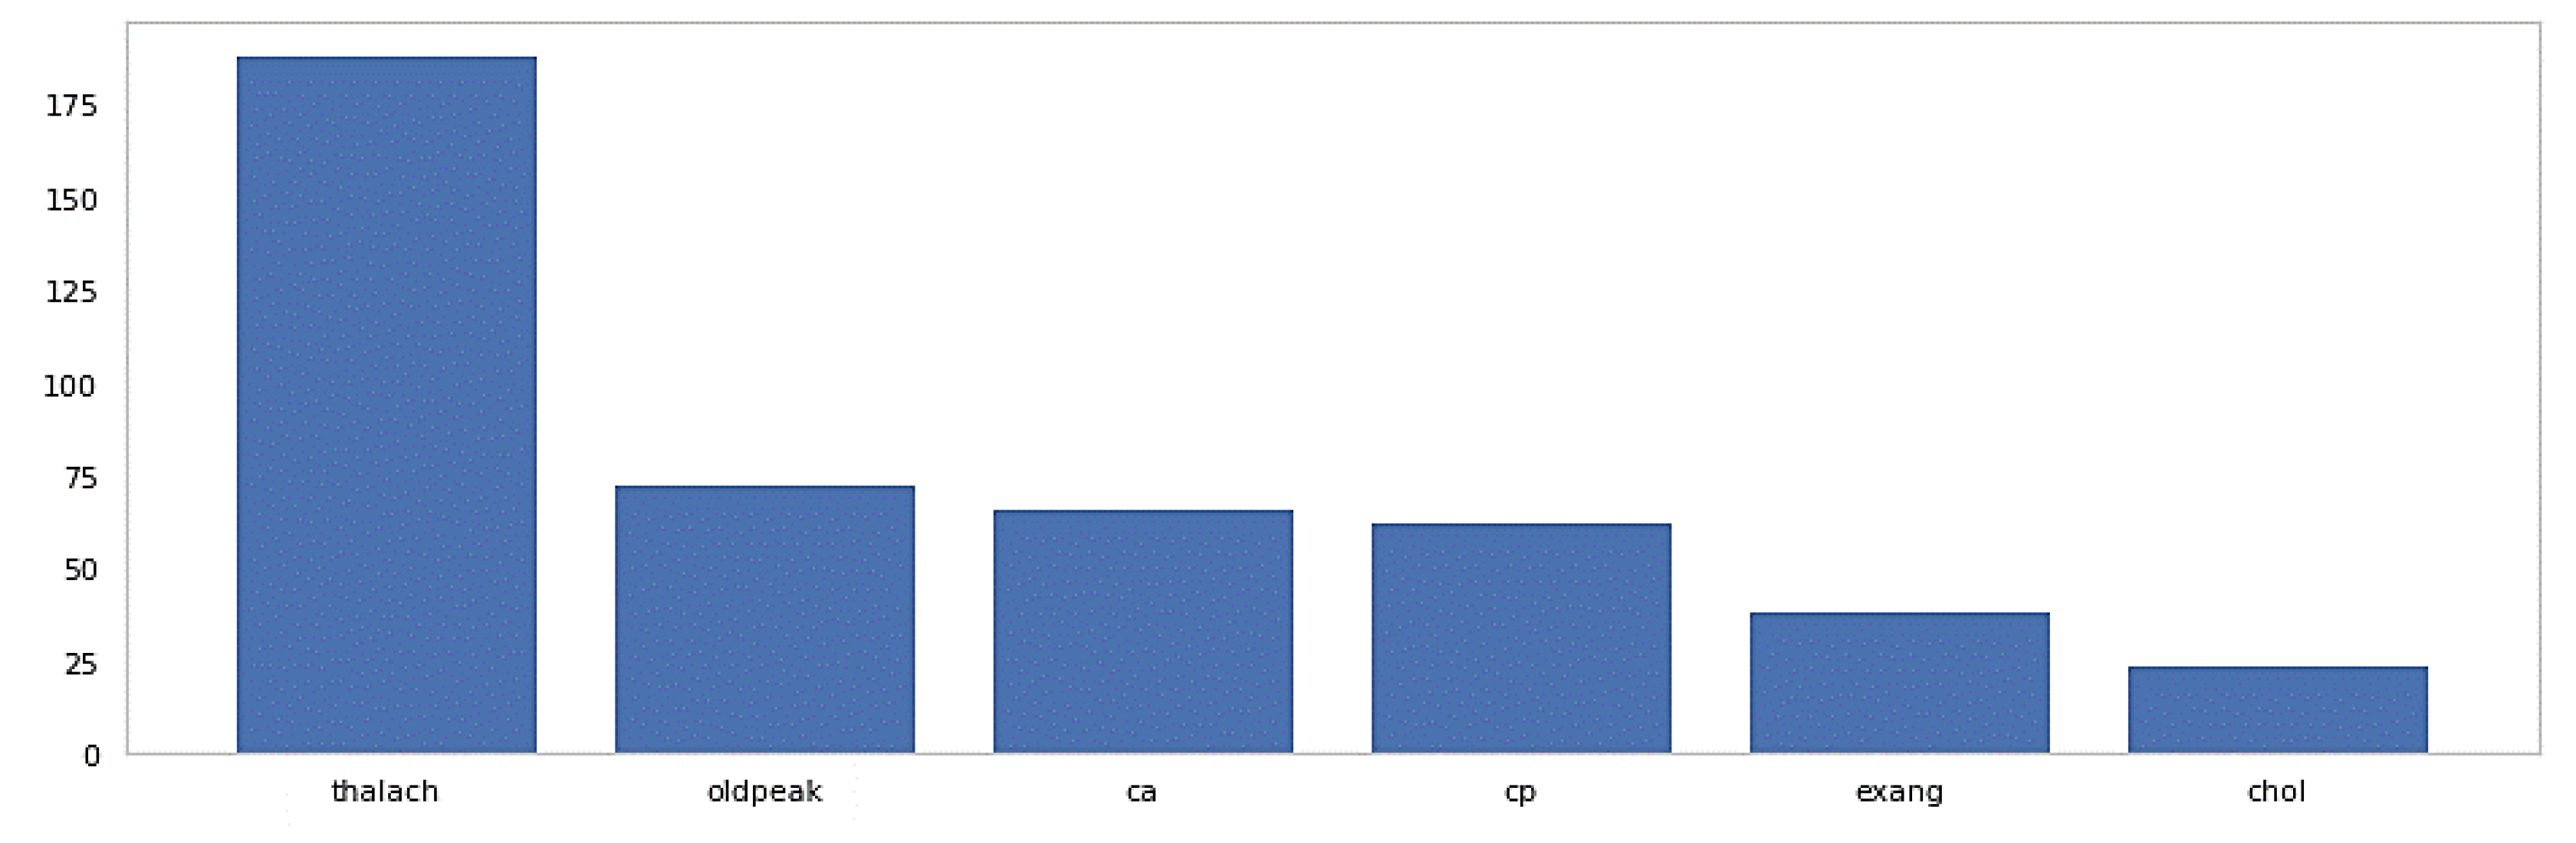
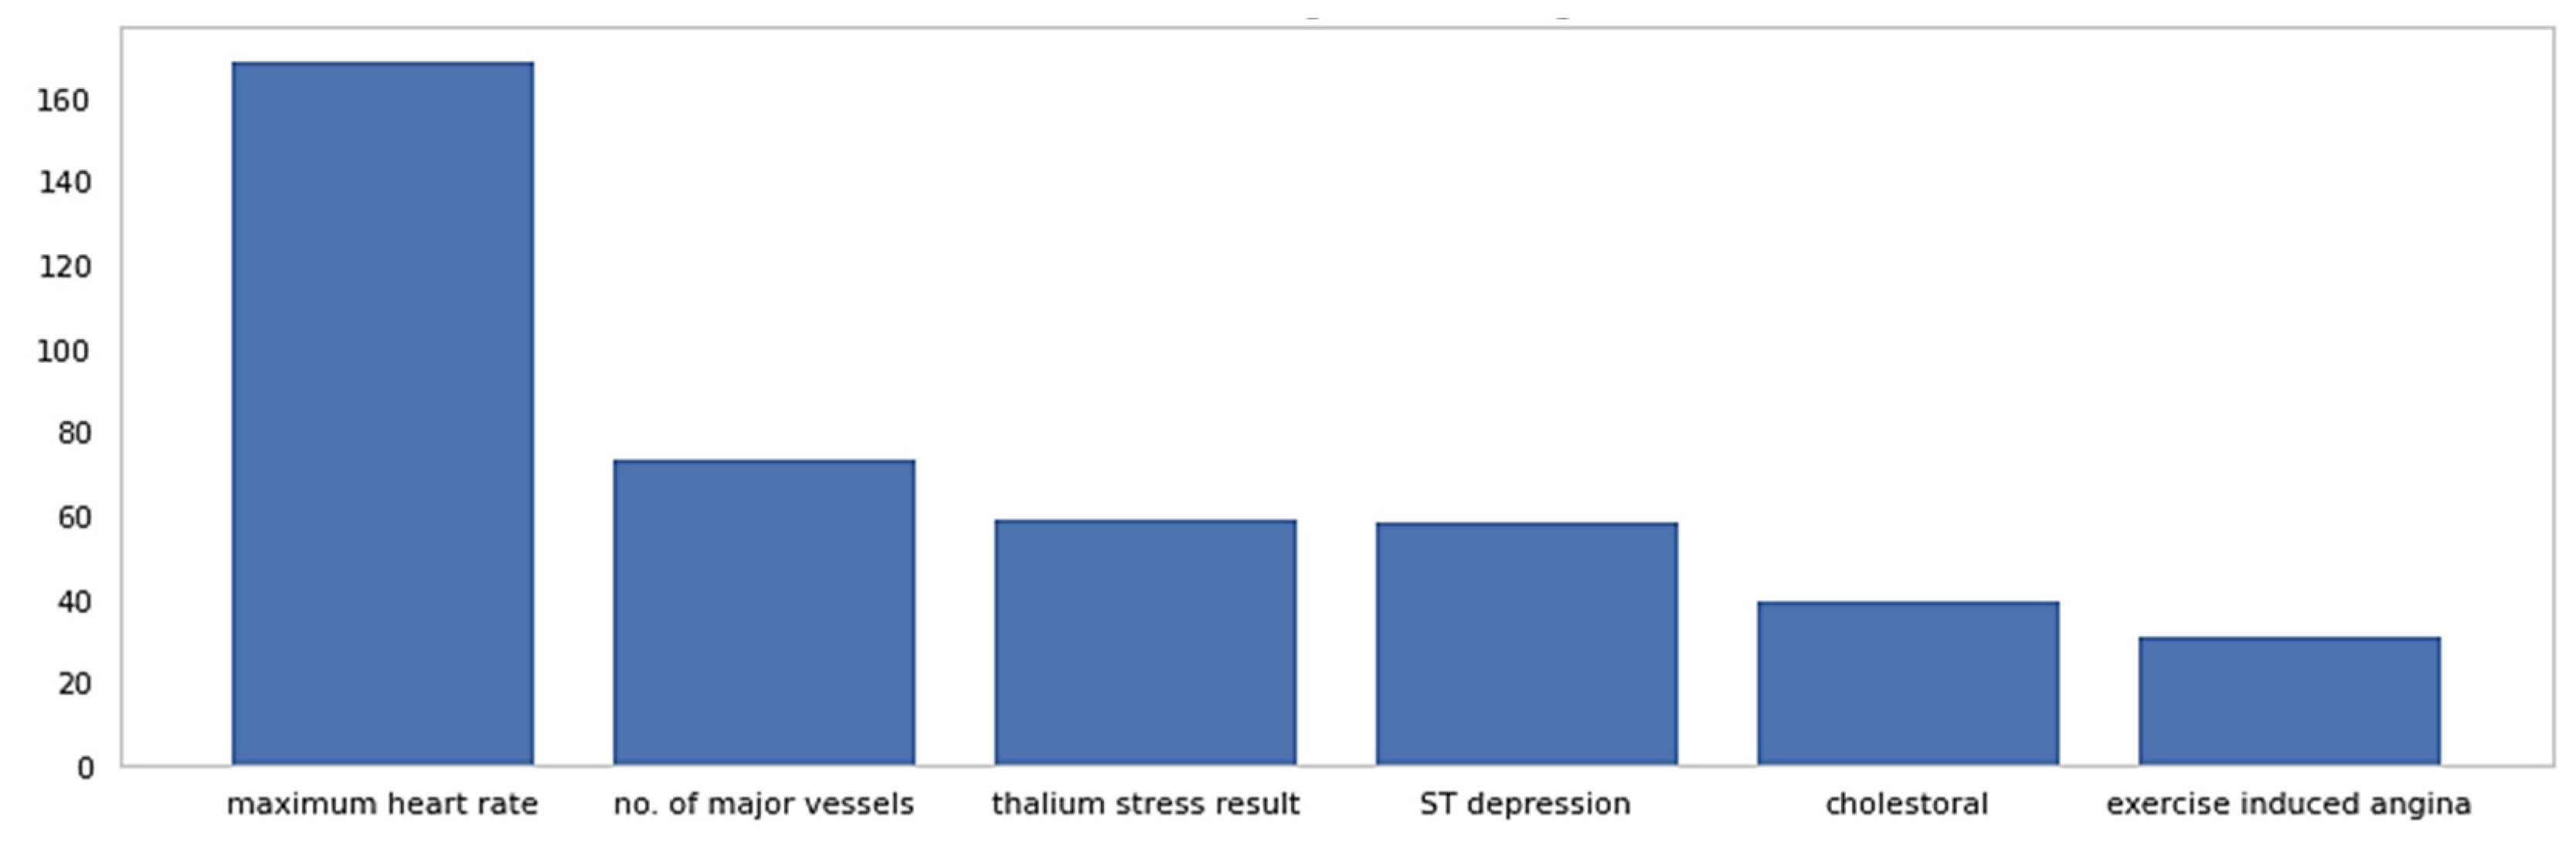
  • To implement an optimal feature selection model using the χ2 statistical method for the extraction of the most informative attributes to improve prediction accuracy;
  • To validate the proposed heart disease diagnosis model’s accuracy by comparing it with traditional models through the analysis of several performance metrics.
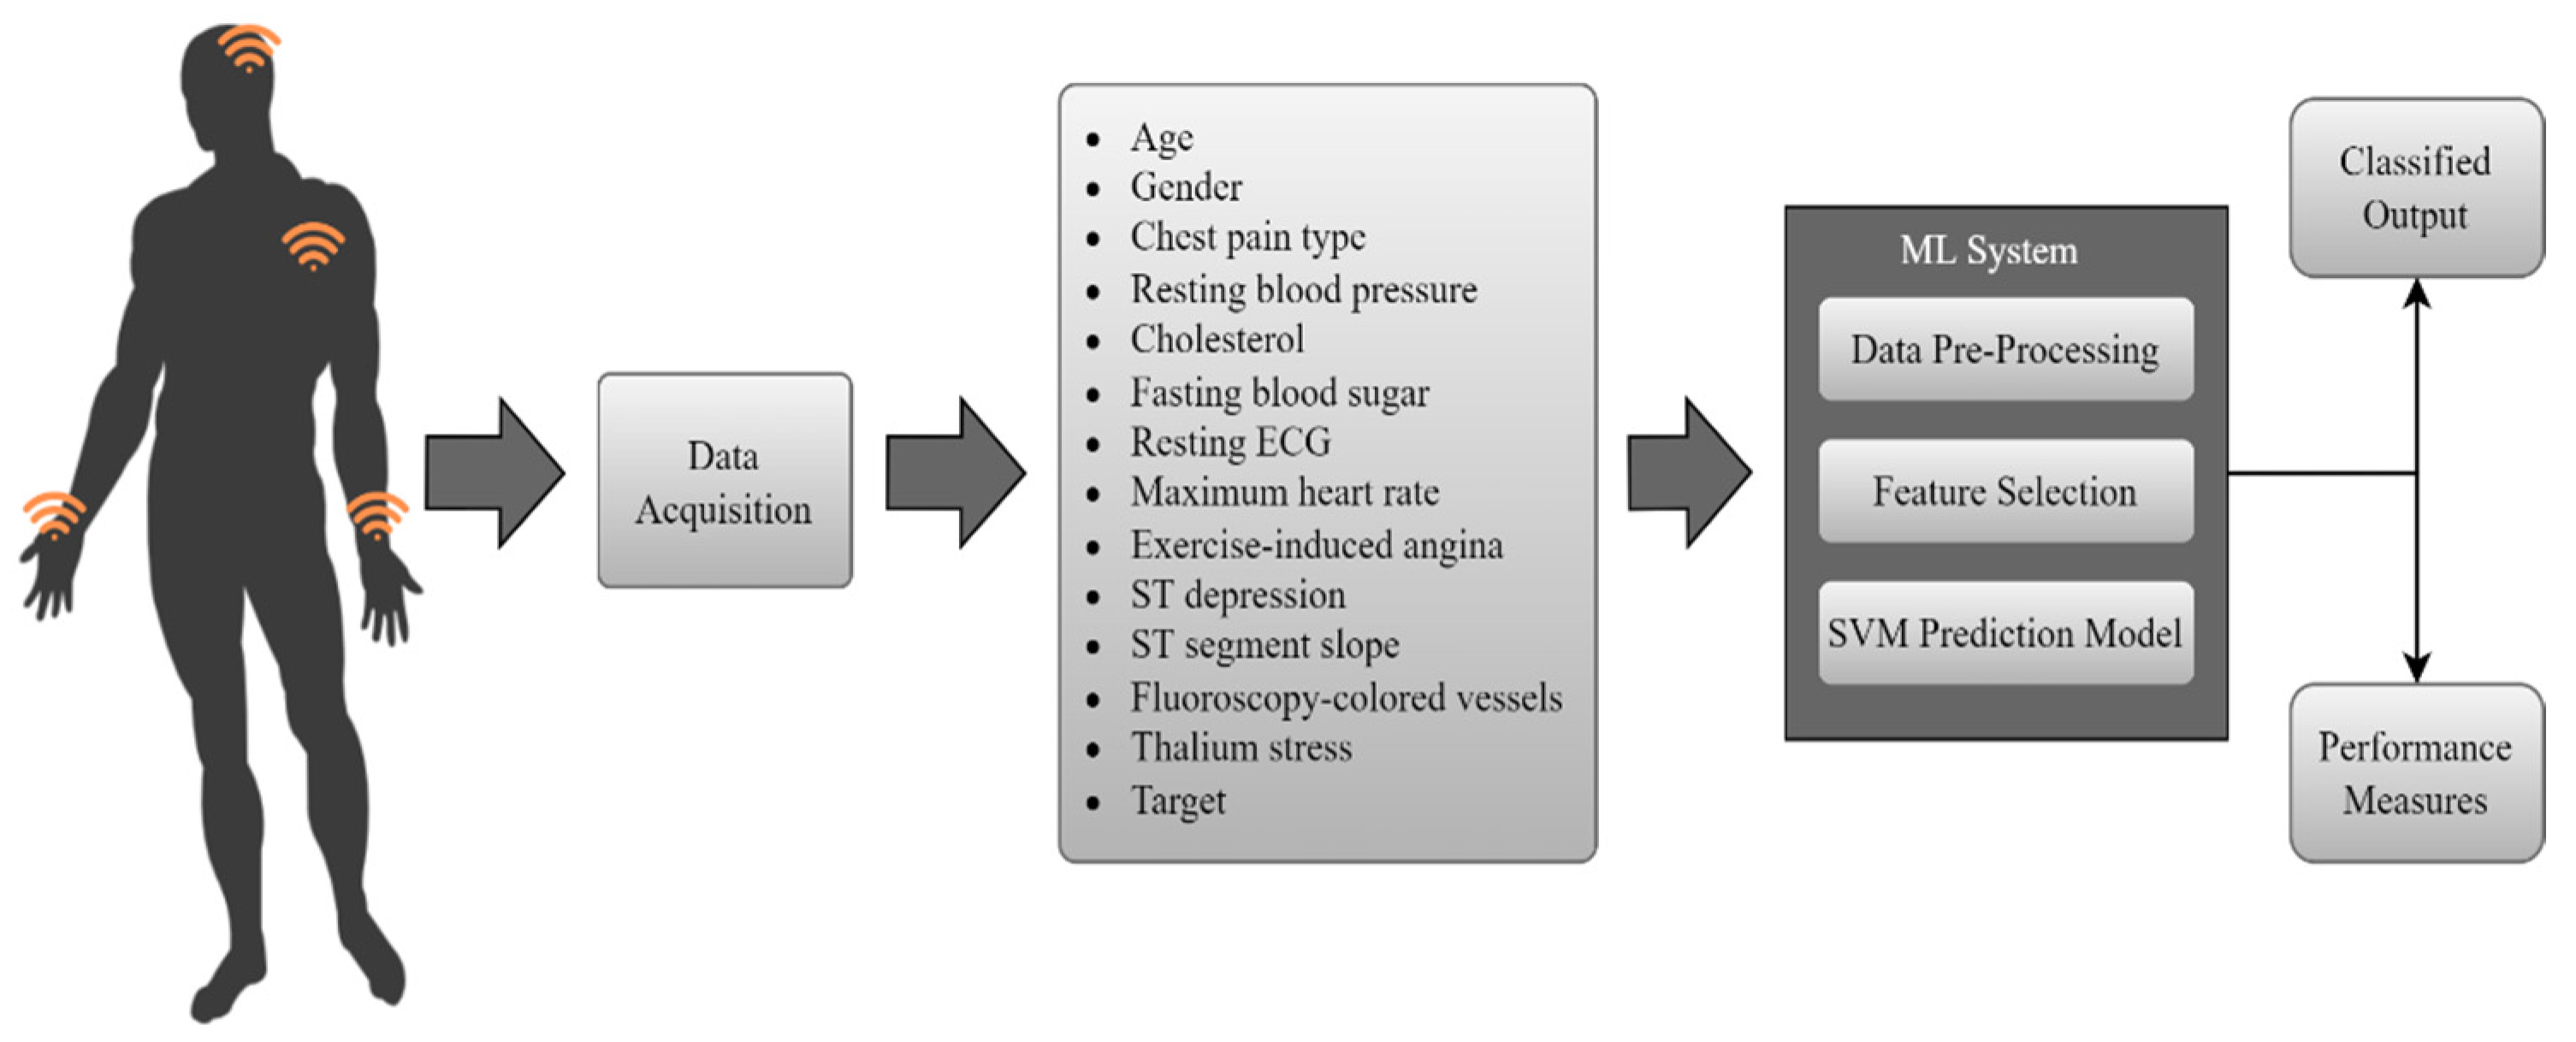
2. Methodology

The following are the two primary steps that have been carried out to meet the objectives of this work:

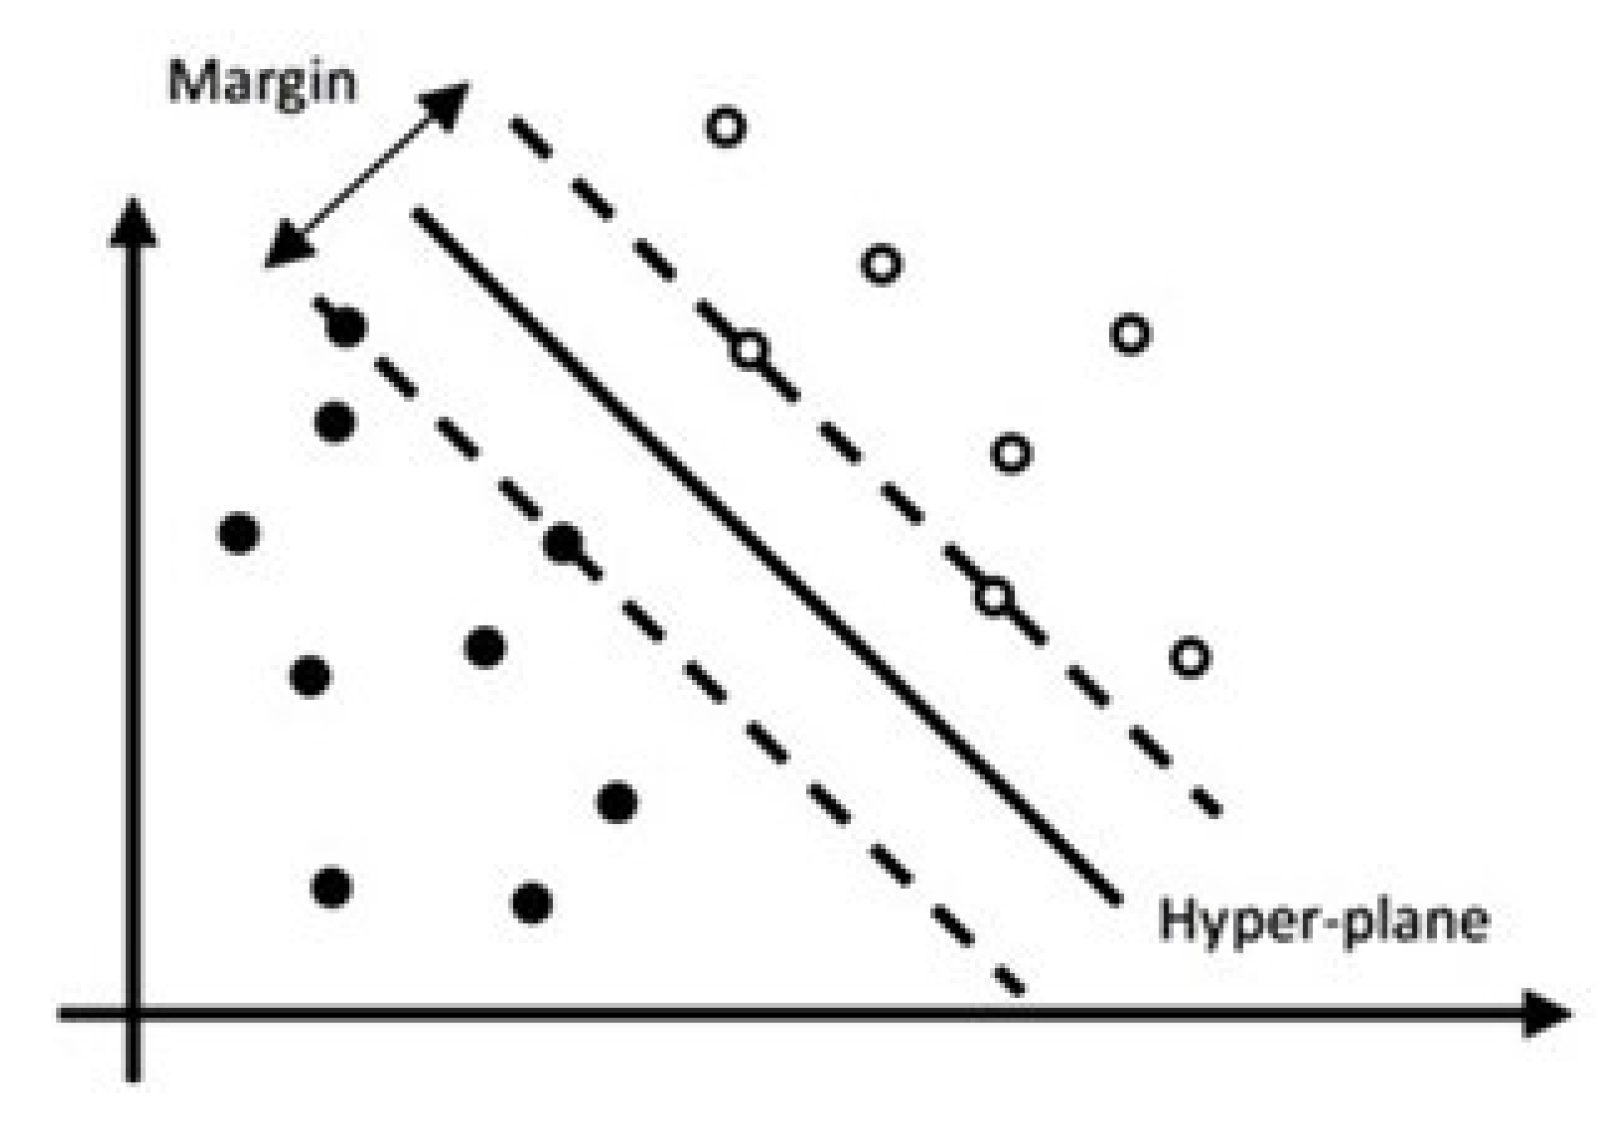
2.1. Support Vector Machine (SVM) Model

Figure 1 depicts the model’s operation in detail. In the proposed support vector machine (SVM)-based heart disease prediction system, the most significant stages were data pre-processing, feature selection, and classifying. The feature normalization method was included in the pre-processing block. Training and testing sets were then created from the data. A feature scoring and selection algorithm was employed to ensure that the training subset was free of any biases. The χ2 statistical model selected the same feature set for training and testing data. Next, training data with fewer features was fed into the SVM model for training purposes. Finally, using testing data, the trained SVM model was evaluated. The proposed model utilized 14 features from the University of California Irvine (UCI) Heart Disease Repository’s Statlog and Cleveland datasets [17,18,19,20]. These features were examined using approaches that successfully predict heart disease. It was possible to develop and evaluate the system for heart disease prediction by using Python and the sci-kit learn library [21].
Vladimir N. V. and Alexey Ya were the first to propose the SVM method in their study of statistical learning theory [4]. The support vector machine (SVM) algorithm, a supervised learning ML method, can be used for both classification and regression purposes. Prediction of cardiovascular disease using the SVM method is more accurate and less error prone [22].
The SVM model learns how to separate various categories by a significant distance. It finds the optimum hyperplane for dividing sensitive data with the most significant margin. This margin is displayed as the distance between the hyperplane and the closest data points on each side of it in Figure 2. The hyperplane computations based on the fact that many points of one group fall on one side of the plane [23]. The SVM model uses a trick kernel to transform data and then find the optimal surface that divides between different classes [21]. This paper used a radial basis function (RBF) kernel, denoted in Equation (1). SVM classification relies heavily on the RBF, commonly known as the Gaussian kernel, to map input data into a feature space. For each feature, the kernel function calculates the inner product of the data points.
k x , y = e g a m m a   x y 2
Here, x and y are the two data points. The core functions determine the kernel parameters. For example, this experiment’s RBF kernel had a parameter gamma, which had to be tweaked to find the optimal hyperplane. It specified how much of an impact a single training sample can have. Higher gamma values indicate a close influence [22,23].
Another factor that needed to be tuned was penalty factor C (Cost). The model’s accuracy decreased as C decreased, while its generalizability increased. A more significant number for C improved model accuracy but reduced its generalizability. In our SVM (RBF) model, we set gamma equal to 1, divided by the number of features seen during model fitting, and C = 1.0 to maximize efficiency.

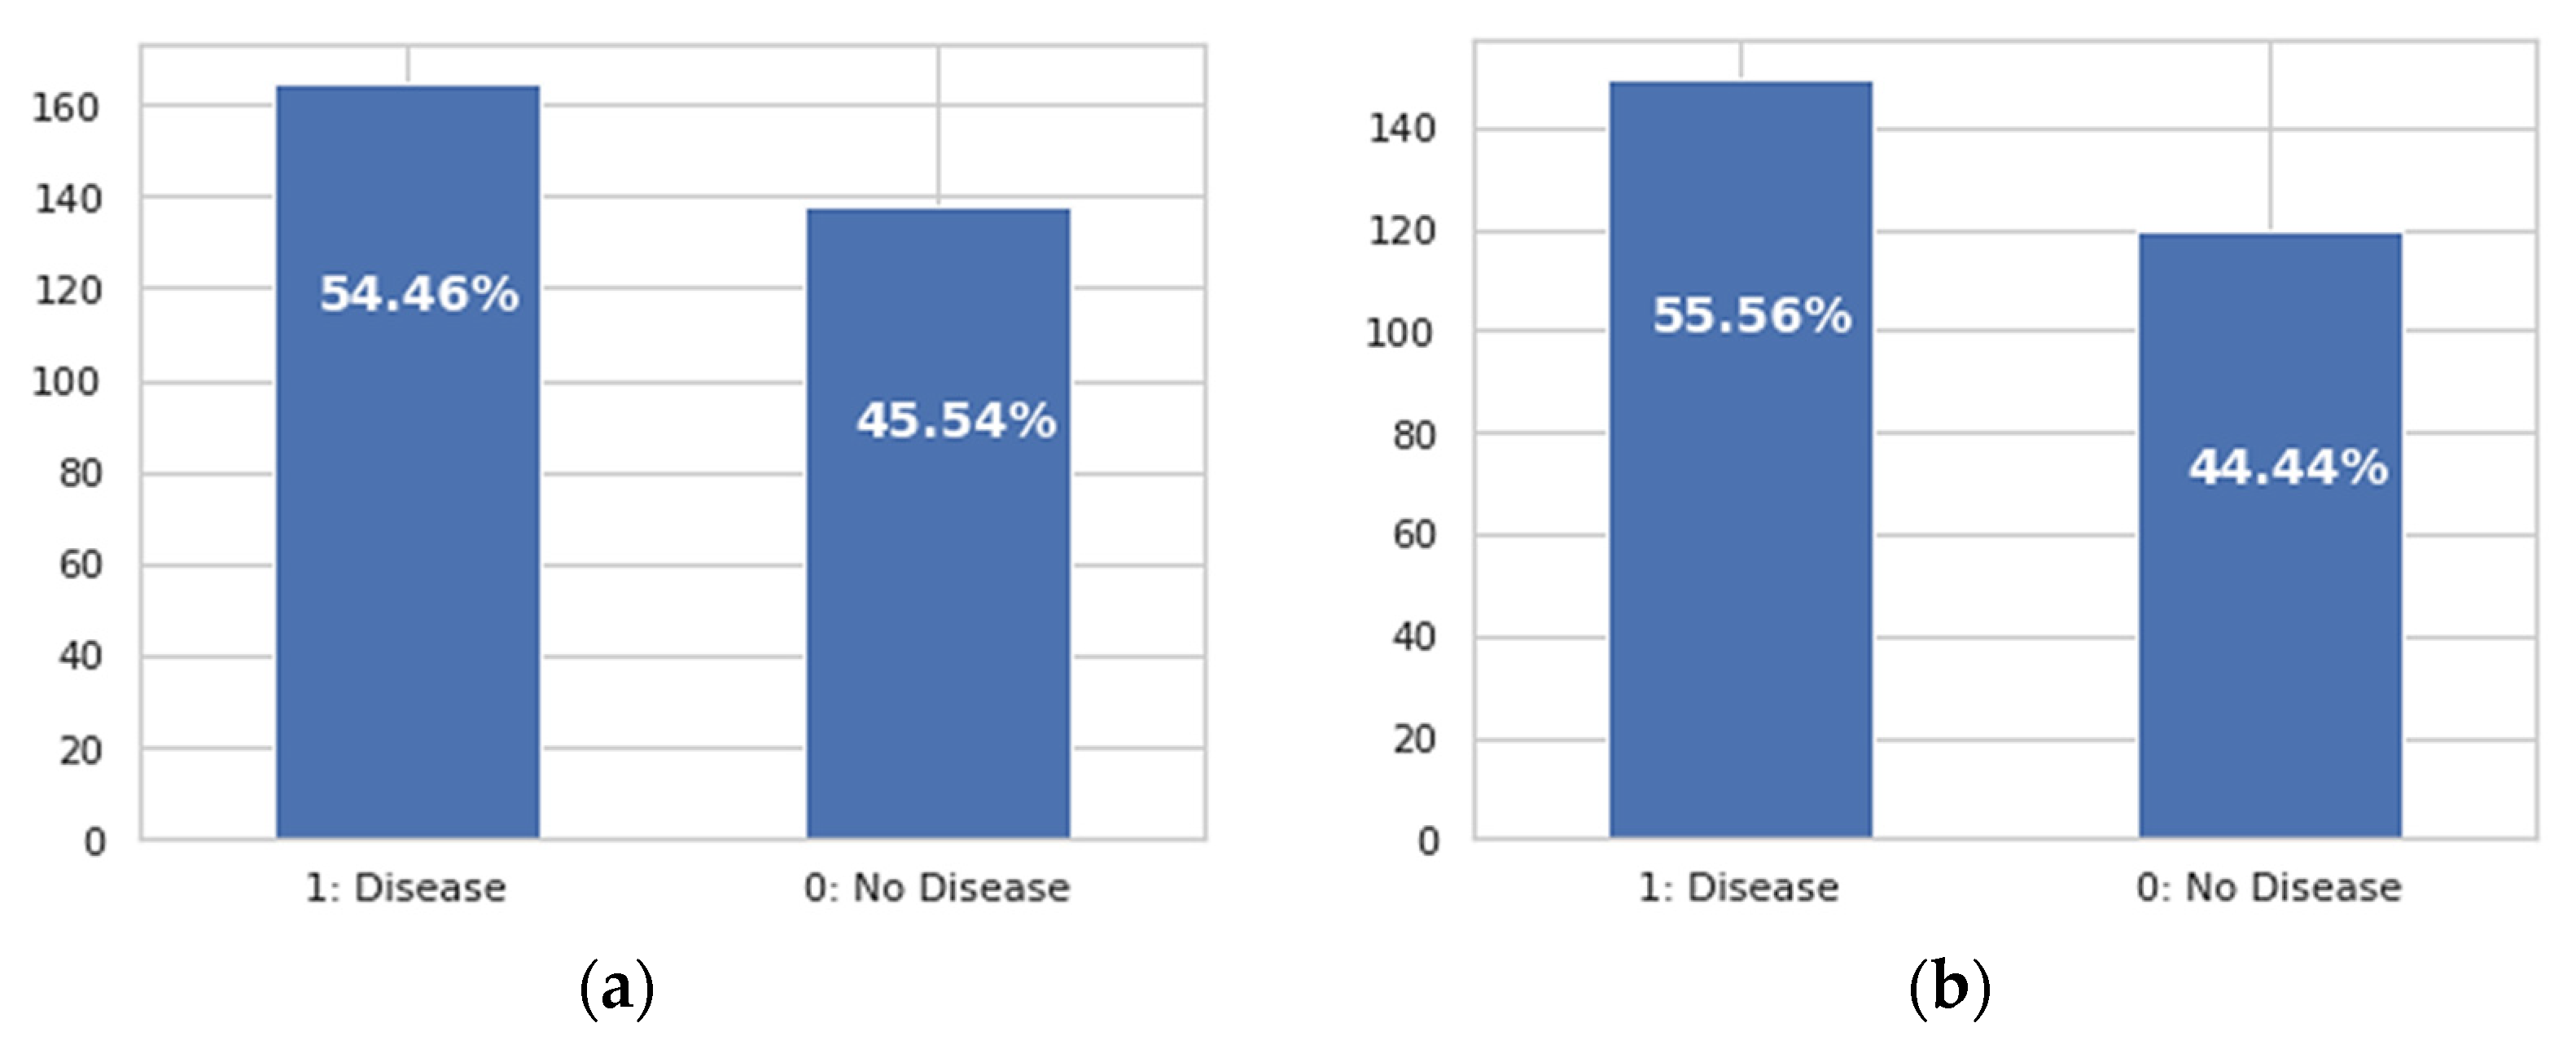
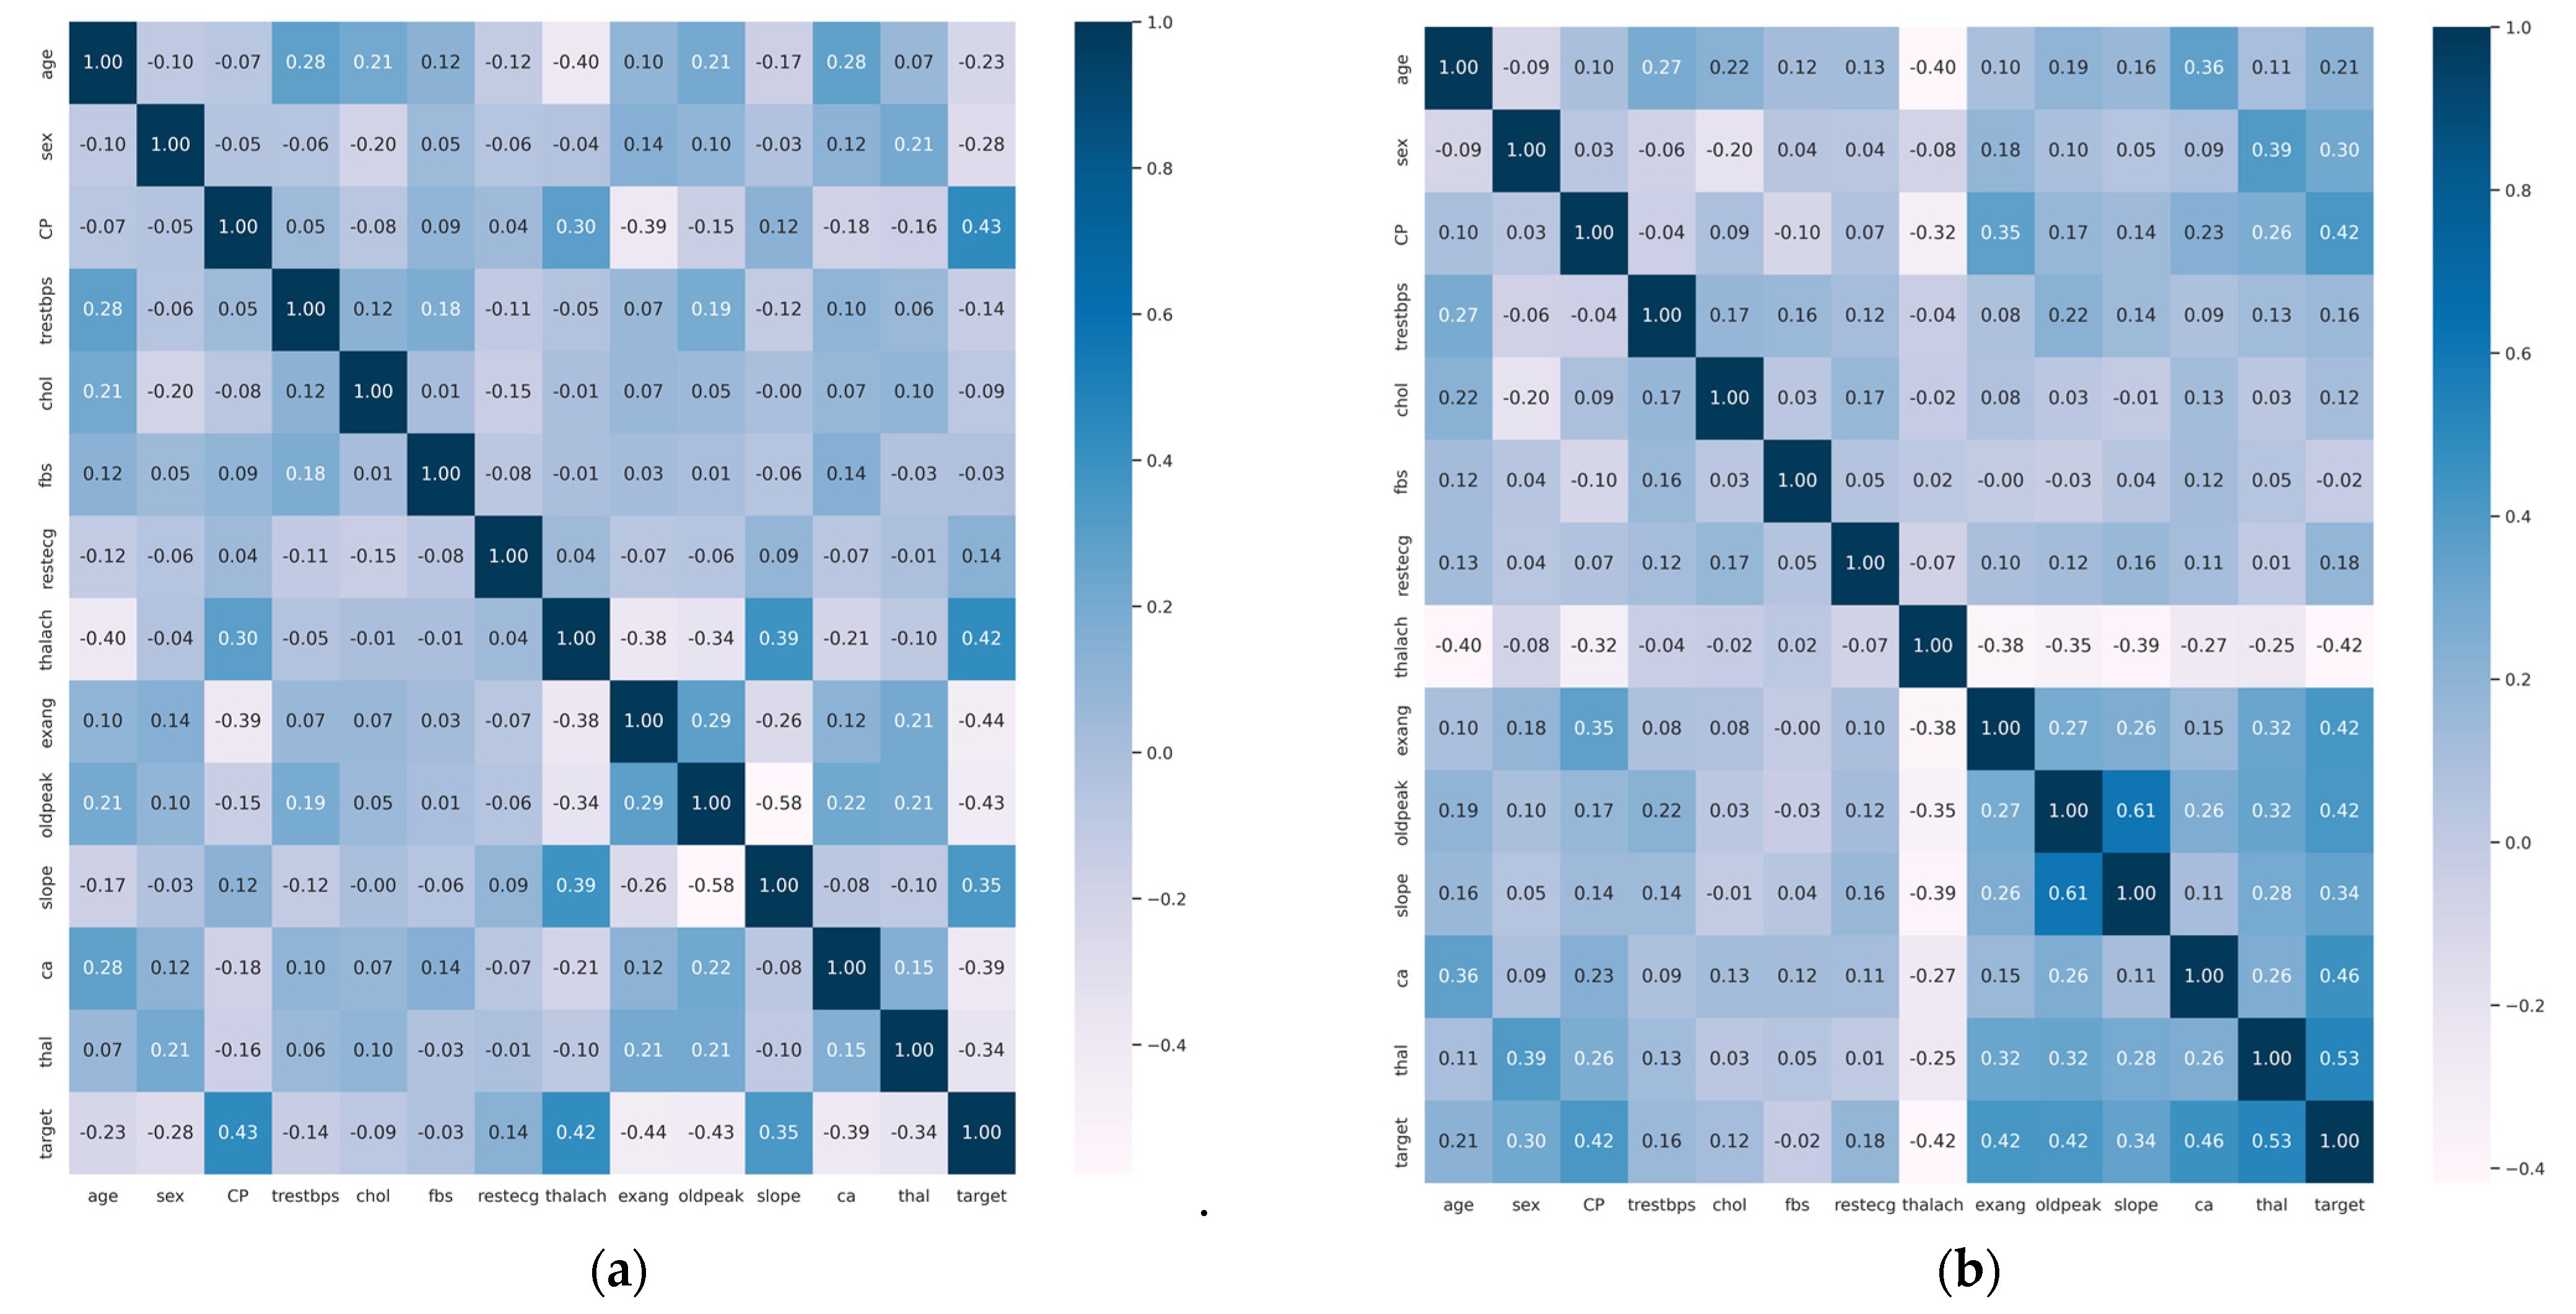
2.1.1. Heart Disease Dataset Features

In this study, we utilized two publicly available heart disease datasets, the Cleveland and Statlog (Heart) datasets, which were obtained from the University of California at the Irvine (UCI) machine-learning repository [19,20]. The datasets were chosen because they are the most widely used datasets by various researchers on heart disease prediction to find their model’s effectiveness [24].
All 303 cases in the Cleveland dataset have 76 attributes. These include patients’ identification numbers, ages, social security numbers, as well as a variety of health data, including details on the location and type of chest pain they were experiencing, measurements of their blood pressure and cholesterol levels, along with their fasting blood sugar and electrocardiogram readings [25]. Although the Cleveland heart disease database has 76 different features, most researchers only used 14 of them in their experiments [24]. With 270 instances, the Statlog (heart) dataset has 14 characteristics.
Table 1 shows a description of the attributes of both datasets, which have the same type and number of features as one another. In the prediction of heart disease, thirteen attributes are used, with the last attribute serving as the output that decides whether a person has heart disease.
The data distribution is critical when attempting to predict [26]. Figure 3 depicts the expected attribute class distributions for the two used datasets. There are 138 people in the Cleveland dataset who have no cardiac disease, and 165 patients in the dataset who do. A total of 120 people do not have heart disease in the Statlog dataset, whereas a total of 150 people do. Consequently, we have a dataset that is almost evenly distributed in terms of target output, which helps to prevent the overfitting issue.
In Figure 4, a heatmap is used to display the correlation analysis of all attributes and the target. For each attribute, the heatmap’s color indicates the degree to which that attribute is correlated with all the others and with the output target class. In general, the stronger the correlation, the warmer the color. For the Cleveland dataset, the target attribute was most closely associated with the Cleveland dataset’s features of exercise-induced depression, the kind of chest pain, exercise-induced angina, and the maximum heart rate reached. Meanwhile, for the Statlog dataset, the highest correlated features with the target were thalium, no. of major vessels, ST depression, exercise-induced angina, maximum heart rate, and chest pain.

2.1.2. Data Pre-Processing

There were no missing values in any of the derived datasets. Additionally, there was a roughly equal proportion of individuals with and without cardiac illness in the target variable, as indicated in Figure 3. This means that no target weighting would be needed in any way. However, a feature scaling approach was applied to ensure a normal distribution of the data. Features were scaled based on the standard scaler approach, which standardizes a feature by removing the mean and then scaling to a unit variance. The term “unit variance” refers to the process of dividing all the values by the standard deviation. As shown in Equation (2), to obtain the new data point ( x ), the mean ( μ ) value was subtracted from the old data point in a particular column, and the result was divided by the standard deviation ( σ ) [22].
Standard   outcome = x     μ σ
Two common issues in any prediction system are the underfitting and overfitting of the training data. Underfitting happens when the generated model does not learn enough from the training data, resulting in poor training and testing data performance. Overfitting occurs when a model learns too much from the training data and achieves unsatisfactory results from even minor details [27,28]. Irrelevant features in the training data often result in model overfitting. Even if the SVM model performs well on training data, it may not generalize well. We propose eliminating irrelevant features by using χ2 statistical model to overcome this issue.

2.2. Enhanced SVM Model with Feature Selection

Having too many features causes overfitting. Thus, it is important to select the right features for both training and testing data to improve model performance [29]. Features that are relevant to the ML model are selected, while those that are irrelevant or noisy are discarded [28]. This paper used the chi-squared (χ2) statistical model [30,31] to select the essential features before applying the SVM model.
A chi-squared (χ2) test is a correlation-based feature selection method that determines the correlation between the features and the predicted class. Each non-negative feature (Xi) computes chi-square statistics to determine which features depend on the predicted attribute. The higher the chi-square score, the more dependent the feature is on the predicted class [24]. First, the commonly used 13 features are ranked according to their χ2 test score. The χ2 test rank features for a binary classification problem are as follows: Let us assume there are (t) instances and two classes, positive and negative. To determine the χ2 test score, we construct Table 2.
Where (m) represents the sum of instances that include the feature (Xi), (t − m) represents the sum of instances that do not include the feature (Xi), (p) represents the sum of positive instances, and (t − p) represents the sum of all instances that are not positive.
The χ2 test examines the difference between the expected count (E), and the observed count (O). The observed count (O) is the observed data (α, b, λ, and y), and the expected count (E) is calculated from the row total, column total, and overall total. If two features are independent, the observed count and the expected count are close. The α, b, λ, and y represent the observed values, and Eα, Eb, Eλ, and Ey represent the expected values. Then, assuming that the two occurrences are unrelated, the expected value (Eα) is calculated using Equation (3). Similarly, Eb, Eλ, and Ey are calculated. Finally, based on the general χ2 test form shown in Equation (4), we calculate χ2 score as shown in Equation (5) [27].
E α = α + b   ×   α + b t
χ 2 = 1 d   k = 1 n O k E k 2 E k
χ 2 = α E α 2 E α + b E b 2 E b + λ E λ 2 E λ + y E y 2 E y
After ranking the features using Equation (5), we looked for the best subset of features (n) with the highest χ2 score. In the beginning, we used a subset of (n = 1), i.e., the feature with the highest χ2 score. This subset was then applied to the SVM model, and the performance results were recorded as we experimented with various hyperparameters. We selected a subset of the two most highly scored attributes (n = 2) as a second approach. Then, this selection was applied to the SVM model, and the results were saved. We iterated this process until we obtained the optimum subset of ranked features (n = 6) that gave the best performance.
The proposed feature selection algorithm, based on the χ2 statistical method, recognized six notable features that can be selected for model training. As shown in Figure 5, regarding the Cleveland dataset, the algorithm selected the following features: thalach, oldpeak, ca, cp, exang, and chol. While in Figure 6, for the Statlog dataset, the algorithm selected the following features: maximum heart rate, number of major vessels, thallium stress result, exercise-induced ST depression, cholesterol, and exercise-induced angina.

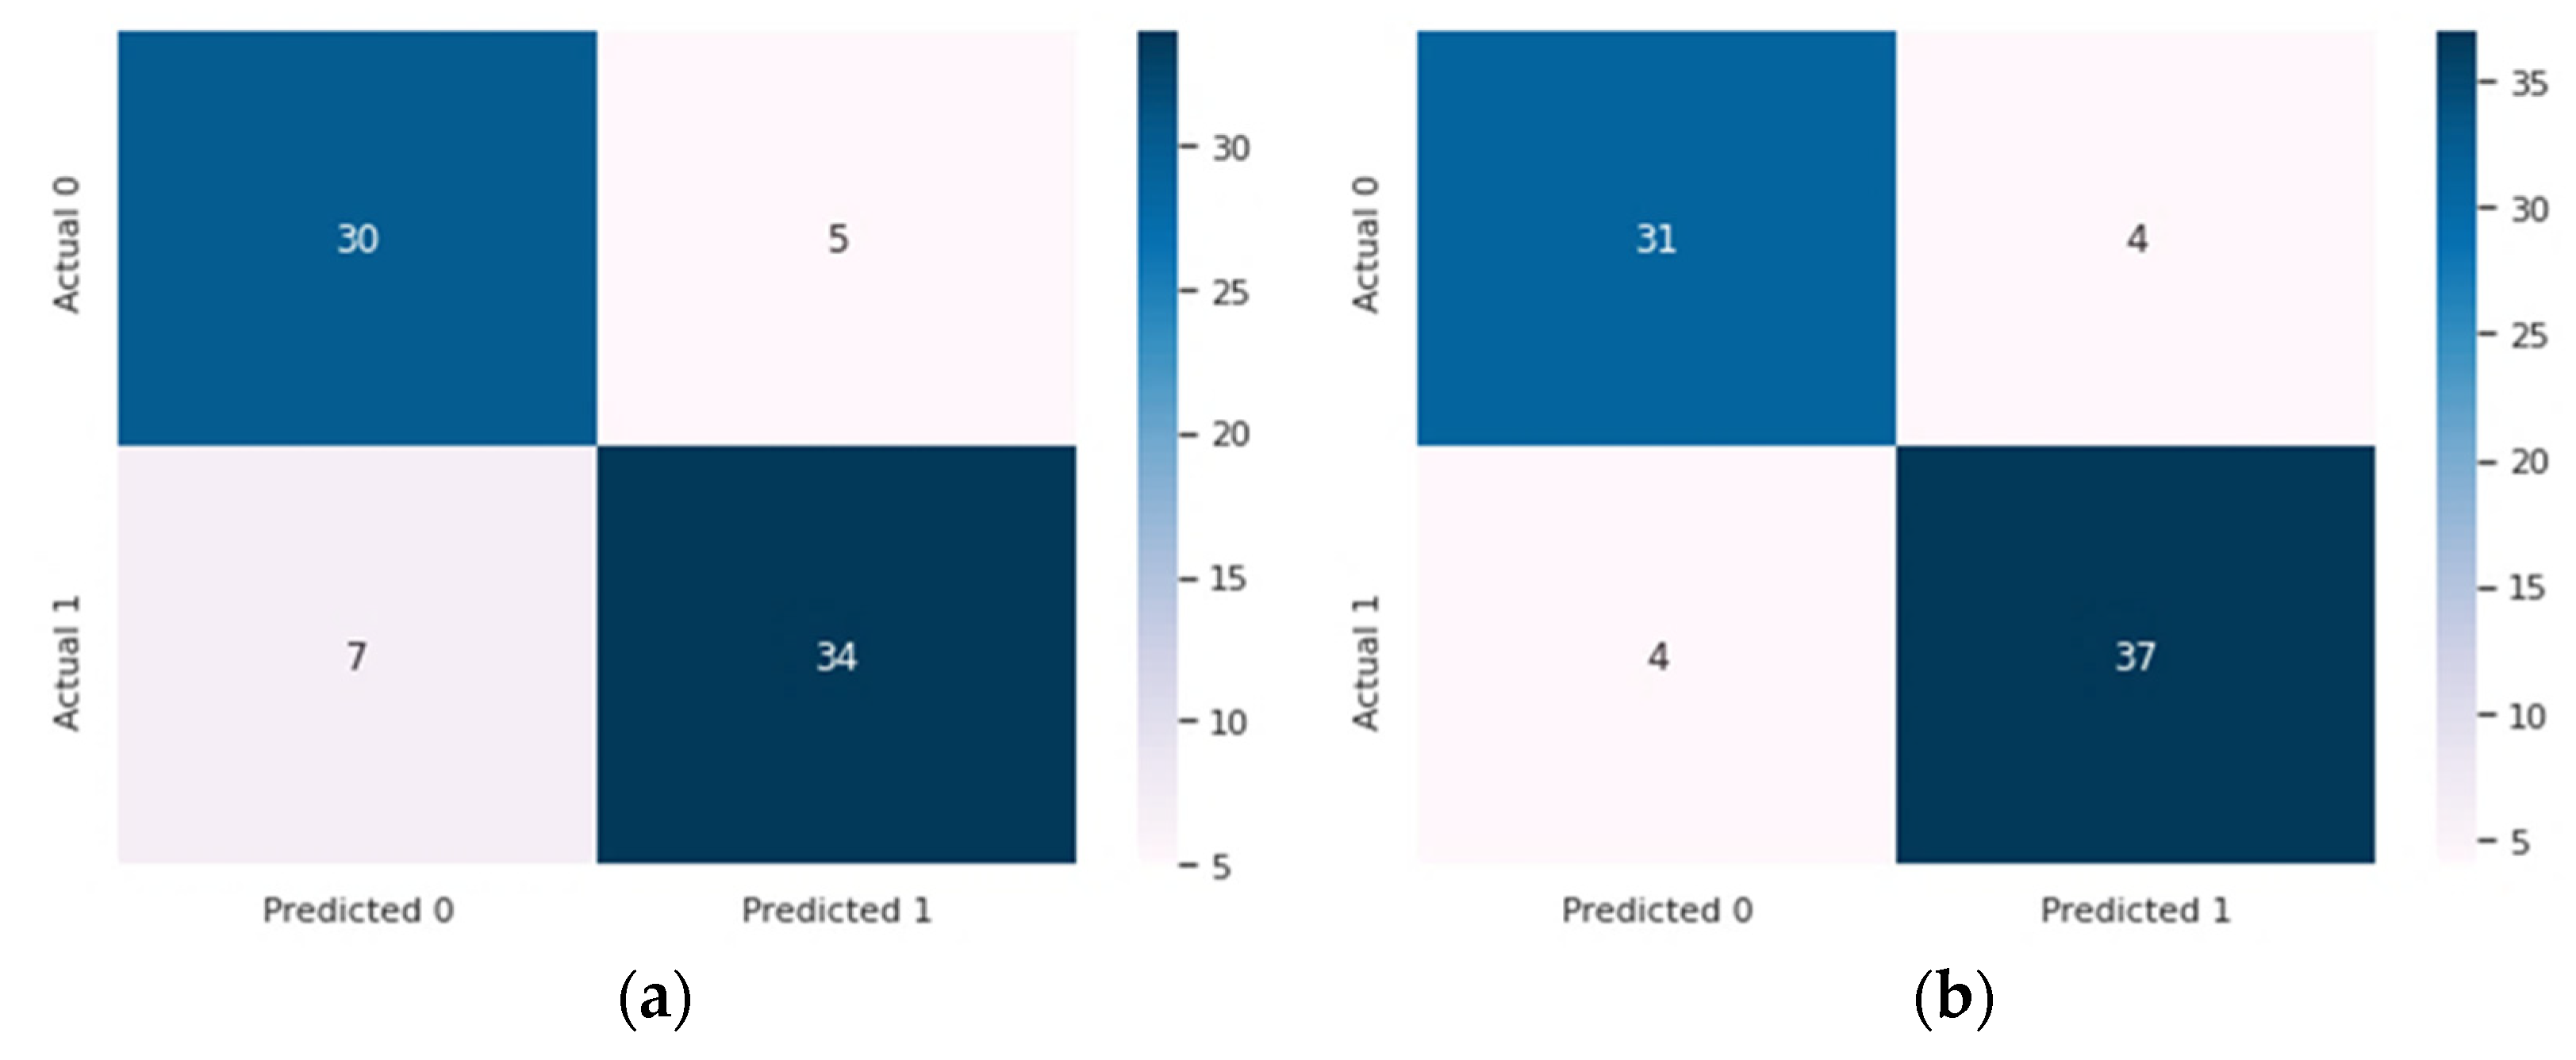
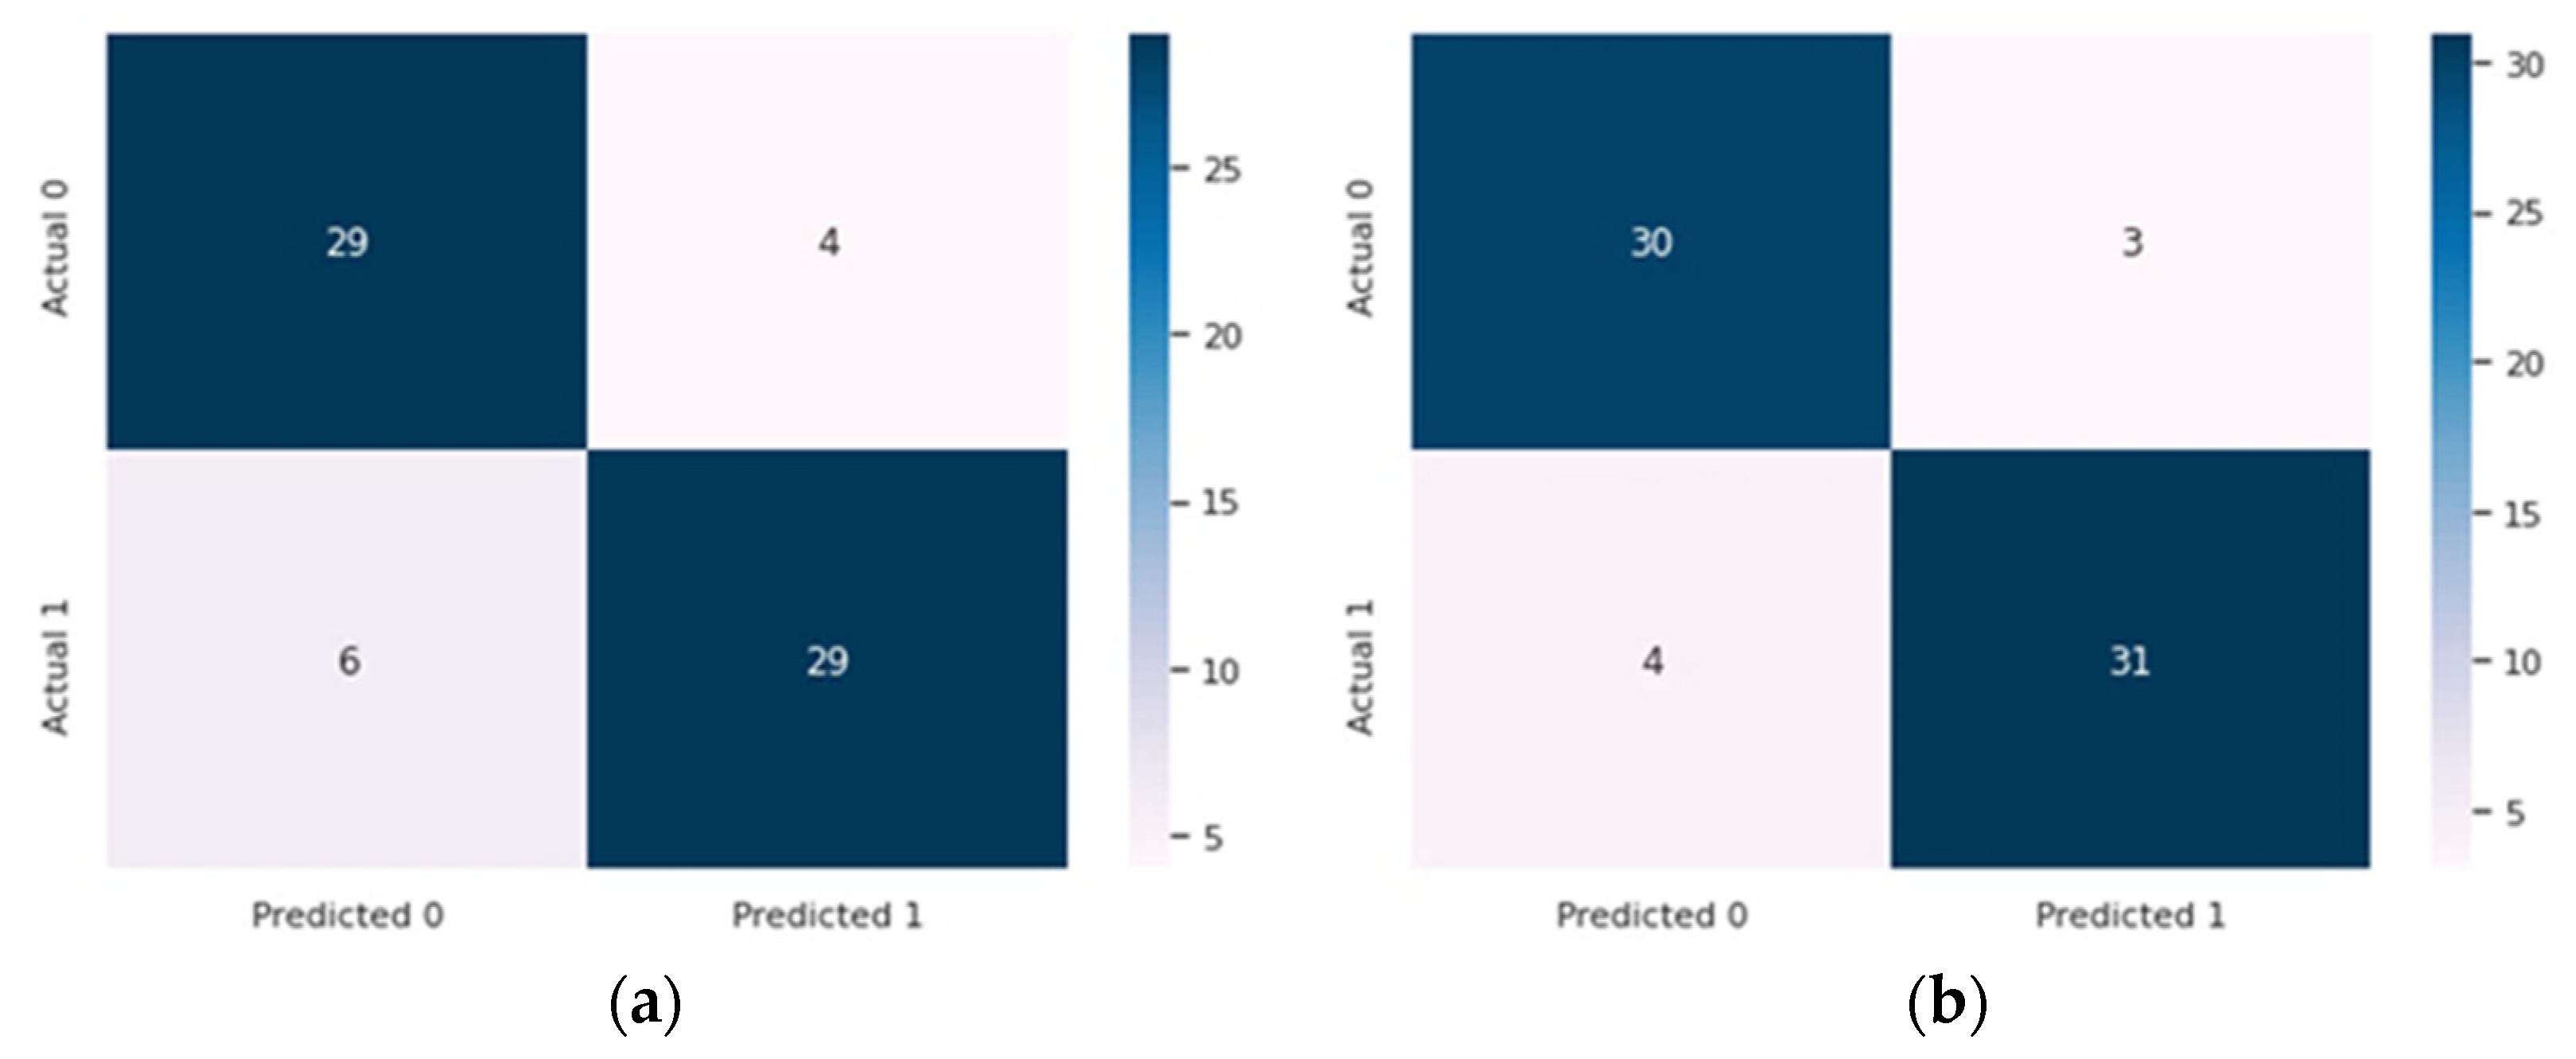
3. Results and Discussion

In this paper, the SVM model was enhanced with the χ2 statistical feature selection method. The feature selection method was used to select the six most important features for the prediction of heart disease. The χ2-based SVM heart disease prediction model was developed and evaluated using Python and sci-kit learn library [21]. The two collected datasets (i.e., the Cleveland and Statlog (Heart) datasets) were partitioned into train and test sets. Training data was used to train the model, whereas testing data was used to evaluate the performance of the model [32]. To train and evaluate our proposed model, both datasets were split into a train and test set using a 75:25 split ratio. The following four primary parameters were assessed: true negative (TN), which means that the algorithm prediction output for persons with no heart disease is correct; true positive (TP), which means that the algorithm prediction output for heart disease patients is correct; false positive (FP), which means that the patients who have no heart disease are incorrectly classified as having heart disease; and false negative (FN), which refers to patients who are actually suffering from a cardiac disease but are incorrectly categorized as healthy [24]. The proposed χ2-based SVM model was evaluated based on the following metrics:
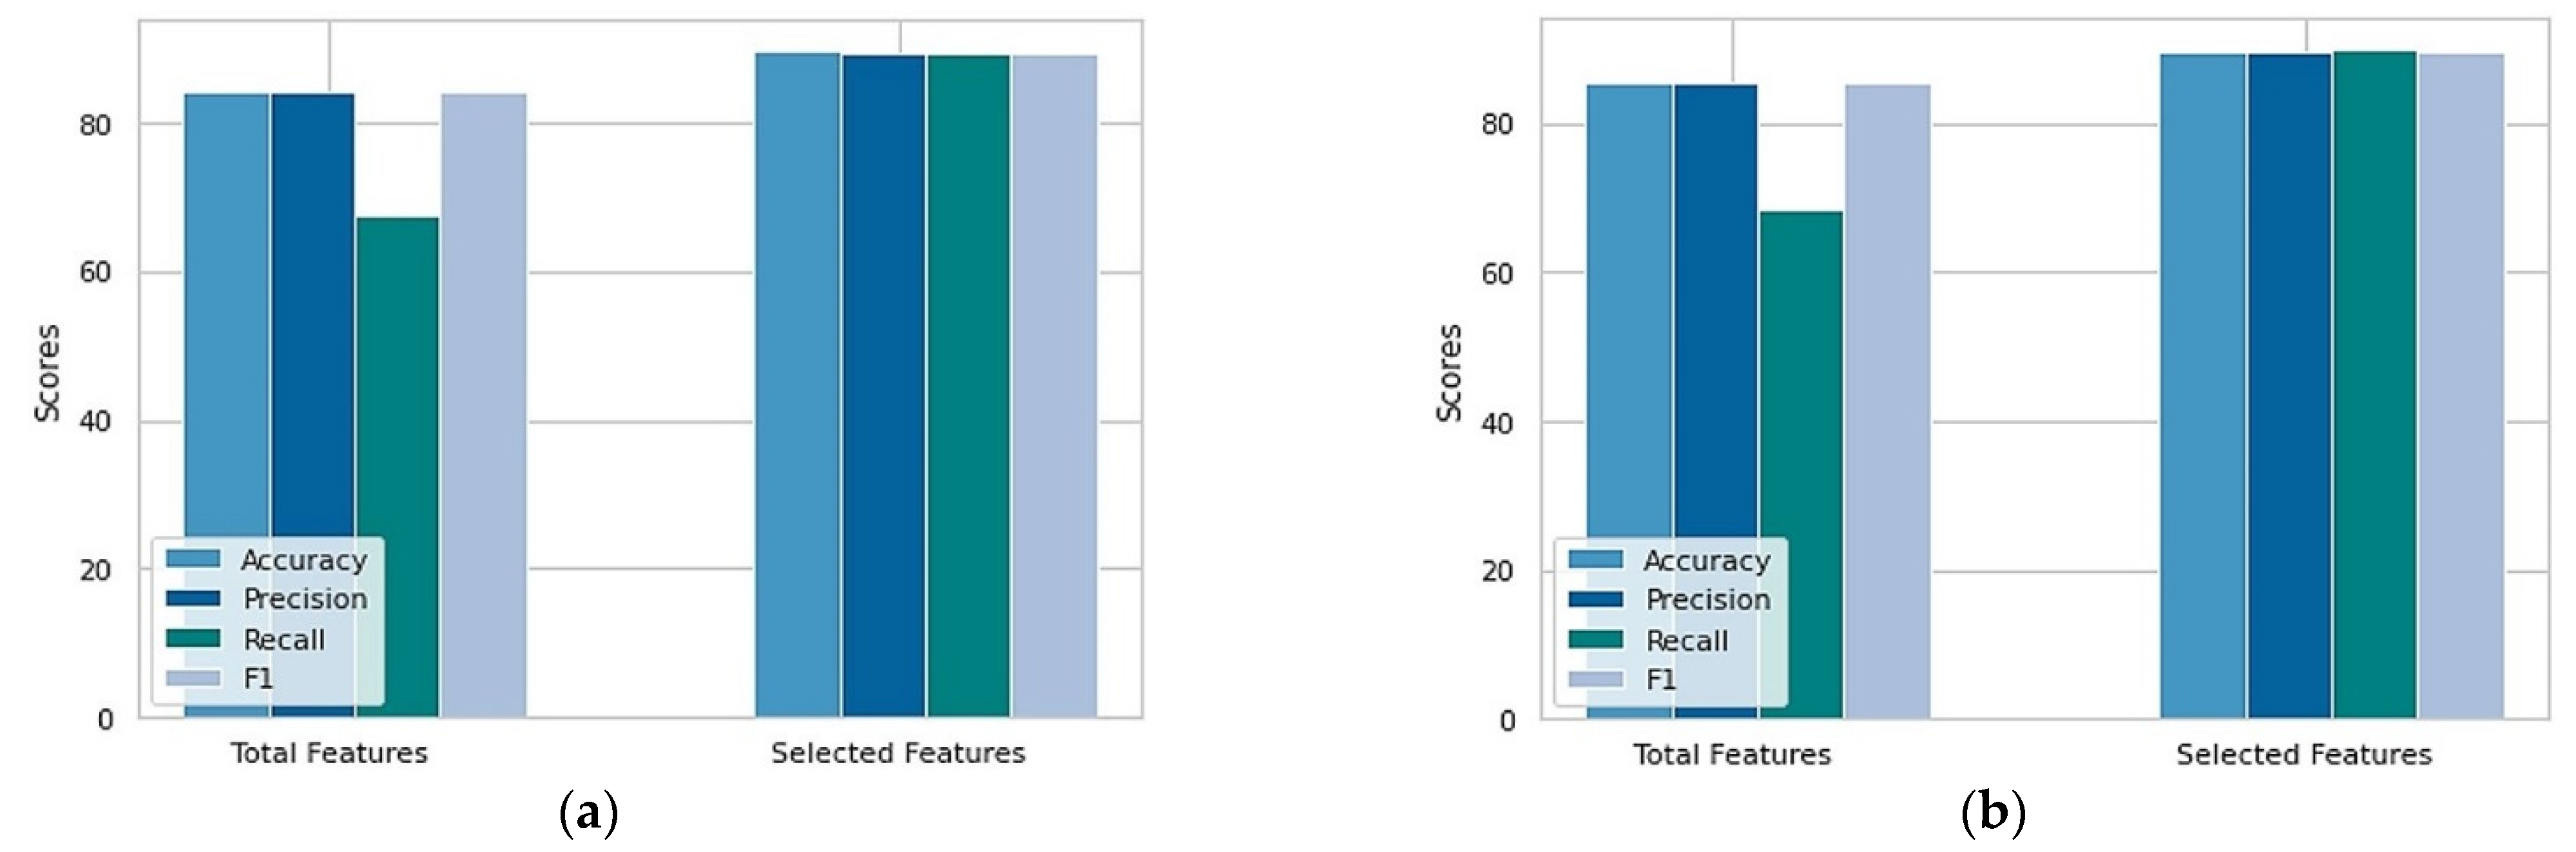
  • Accuracy (Acc): defined as the proportion of total positive instances of the model to the total number of instances, as shown in Equation (6).
Accuracy = T P   +   T N T P   +   T N   +   F P   +   F N
  • Specificity (Spe): the percentage of true negatives out of all healthy individuals, calculated by Equation (7). It was used to determine the degree of the attribute to appropriately classify the individuals without diseases.
Specificity = T N T N   +   F P
  • Sensitivity (Sen): used to determine the degree of the attribute in order to appropriately classify the individuals who have diseases, as illustrated in Equation (8);
Sensitivity = T P T P   +   F N
  • F1-score: defined as the harmonic mean of the specificity and sensitivity. It can be computed as shown in Equation (9);
F 1   Score = 2 T P 2 T P   +   F P   +   F N
The chi-squared-SVM algorithm was applied to the two collected datasets to see the difference when applied to different datasets. Two approaches were experimented with. In the first approach, the dataset with the total 14 features was normalized, then directly used for prediction using the SVM classifier. In the second approach, the χ2-based feature selection method was applied to the normalized dataset to choose the six features that are the most significant for heart disease detection before applying the SVM classifier.
As can be shown in Table 3, by using the first approach (feeding the total 14 features of the collected datasets), the SVM classifier achieved the following results for the Cleveland dataset: accuracy of 84.21%; sensitivity of 67.45%; specificity of 84.13%; and an F1-score of 84.16%. Meanwhile, for the Statlog dataset, the following results were achieved: diagnostic accuracy of 85.29%; sensitivity of 68.29%; specificity of 85.36%; and an F1-score of 85.29%. The results of the SVM model for the Cleveland dataset are as follows, as shown in Table 4: diagnostic accuracy of 89.47%; sensitivity of 89.40%; specificity of 89.40%; and an F1-score of 89.40%. These results were achieved by applying the second approach, which used the χ2 feature selection method.
The experimental results of applying these two approaches are shown in Figure 7. From Figure 7, conclusion can be drawn that the χ2 feature selection method played a critical role in enhancing the accuracy of the SVM model, while also improving the results of sensitivity and specificity, which shows the model’s ability to correctly identify people with and without the heart disease. The proposed χ2-based SVM model improves classification accuracy by 6.25% for the Cleveland dataset and 5.17% for the Statlog dataset, which is important for providing a correct diagnosis and decreasing the rate of false predictions.
Furthermore, ROC (receiver operating characteristic) curve and AUC (area under the curve) charts were utilized to assess the performance of the proposed χ2-based SVM diagnostic model and its ability to identify heart disease occurrence. The ROC and AUC chart is a 2D graph, between the sensitivity and specificity, which evaluates the validity of a diagnostic model. The true positive rate (Y axis) and the true negative rate (X axis) are plotted in the ROC chart. It indicates that the optimal ROC curve is in the plot’s upper left corner. An ROC chart with a bigger AUC is better, which indicates that a diagnostic model can correctly identify people with heart issues [27].
ROC curves are given in Figure 8a before and after the 14 features of the Cleveland dataset were reduced to 6. The AUC of the SVM model was 0.90 after lowering the features by the χ2 method, but it was 0.91 when using the full set of features. Figure 8b depicts the same thing, but with the Statlog dataset. Before using the χ2 feature selection method, the SVM model’s AUC was 0.94; after using it, the AUC dropped to 0.91. This suggests that the influence of χ2 feature selection approach was minimal in terms of AUC.
To evaluate the proposed χ2-based SVM model in detecting heart disease, another metric that goes by the term “confusion matrix” was utilized. In a confusion matrix, the values of the true positive (TP) and false negative (FN) parameters are laid out in a format like that of a table. The confusion matrix summarizes the number of correct and incorrect predictions. Figure 9b illustrates the confusion matrix that was produced as a result of using the proposed χ2-based SVM model on the Cleveland dataset. It shows that the proposed model can correctly detect 37 (predicted 1 and actual 1) heart diseased persons and identify 31 healthy subjects out of 35 (predicted 0 and actual 0). In Figure 10b, the resulting confusion matrix of the Statlog dataset is presented. This demonstrates that the methodology that was proposed can accurately identify 31 heart disease patients and identify 30 out of 33 healthy subjects. Both Figure 9 and Figure 10 show that the number of incorrect predictions (actual 1 but predicted 0, and actual 0 but predicted 1) made by the SVM model before and after applying the χ2 feature selection method was reduced from 12 to 8 for the Cleveland dataset, and from 10 to 7 for the Statlog dataset.
Furthermore, concerning the accuracy and number of selected features, our proposed model was compared to several existing state-of-the-art techniques, as shown in Table 5. The performance of the suggested chi-squared-SVM methodology was shown to perform better than other methods, with an accuracy of 89.47%.

4. Conclusions

In this work, an enhanced model was implemented to increase the heart disease diagnosis and prediction accuracy, as well as to reduce computational load. The ML (SVM) algorithm was used as a classification model for enhanced heart disease diagnoses. This model was performed on two famous heart disease datasets. The results showed increasing accuracy from 84.21% to 89.47 and from 85.29% to 89.7% in the Cleveland and Statlog datasets, respectively. Furthermore, the features used in the system were decreased from 14 to 6 features, which means that the computational load was reduced from 100% to approximately 42%. We anticipate that this work will contribute to the future development and implementation of heart disease prediction and diagnosis systems.

Author Contributions

Conceptualization, R.R.S. and A.M.D.; methodology, R.R.S.; writing—original draft preparation, R.R.S.; writing—review and editing, A.M.D., K.H.A. and M.A.M.; supervision, A.M.D. and M.A.M. All authors have read and agreed to the published version of the manuscript.

Funding

This research received no external funding.

Institutional Review Board Statement

Not applicable.

Informed Consent Statement

Not applicable.

Data Availability Statement

The machine-learning repository at UCI provides access to the datasets that were used in this study.

Conflicts of Interest

The authors declare no conflict of interest.

References

  1. Das, S.; Sharma, R.; Gourisaria, M.; Rautaray, S.; Pandey, M. Heart disease detection using core machine learning and deep learning techniques: A comparative study. Int. J. Emerg. Technol. 2020, 11, 531–538. [Google Scholar]
  2. Hasan, T.T.; Jasim, M.H.; Hashim, I.A. FPGA Design and Hardware Implementation of Heart Disease Diagnosis System Based on NVG-RAM Classifier. In Proceedings of the 2018 Third Scientific Conference of Electrical Engineering (SCEE), Baghdad, Iraq, 19–20 December 2018; pp. 33–38. [Google Scholar] [CrossRef]
  3. Rahman, A.U.; Saeed, M.; Mohammed, M.A.; Jaber, M.M.; Garcia-Zapirain, B. A novel fuzzy parameterized fuzzy hypersoft set and riesz summability approach based decision support system for diagnosis of heart diseases. Diagnostics 2022, 12, 1546. [Google Scholar] [CrossRef] [PubMed]
  4. Javid, I.; Khalaf, A.; Ghazali, R. Enhanced accuracy of heart disease prediction using machine learning and recurrent neural networks ensemble majority voting method. Int. J. Adv. Comput. Sci. Appl. 2020, 11, 540–551. [Google Scholar] [CrossRef]
  5. Muhsen, D.K.; Khairi, T.W.A.; Alhamza, N.I.A. Machine Learning System Using Modified Random Forest Algorithm. In Intelligent Systems and Networks, Singapore; Tran, D.-T., Jeon, G., Nguyen, T.D.L., Lu, J., Xuan, T.-D., Eds.; Springer: Singapore, 2021; pp. 508–515. [Google Scholar]
  6. Wah, T.Y.; Mohammed, M.A.; Iqbal, U.; Kadry, S.; Majumdar, A.; Thinnukool, O. Novel DERMA fusion technique for ECG heartbeat classification. Life 2022, 12, 842. [Google Scholar]
  7. Mohammed, M.A.; Abdulkareem, K.H.; Al-Waisy, A.S.; Mostafa, S.A.; Al-Fahdawi, S.; Dinar, A.M.; Alhakami, W.; Abdullah, B.A.Z.; Al-Mhiqani, M.N.; Alhakami, H.; et al. Benchmarking methodology for selection of optimal COVID-19 diagnostic model based on entropy and TOPSIS methods. IEEE Access 2020, 8, 99115–99131. [Google Scholar] [CrossRef]
  8. Dinar, A.M.; Zain, A.M.; Salehuddin, F. Utilizing of CMOS ISFET sensors in DNA applications detection: A systematic review. J. Adv. Res. Dyn. Control Syst. 2018, 10, 569–583. [Google Scholar]
  9. Soni, M.; Gomathi, S.; Kumar, P.; Churi, P.P.; Mohammed, M.A.; Salman, A.O. Hybridizing Convolutional Neural Network for Classification of Lung Diseases. Int. J. Swarm Intell. Res. (IJSIR) 2022, 13, 1–15. [Google Scholar] [CrossRef]
  10. Nasser, A.R.; Hasan, A.M.; Humaidi, A.J.; Alkhayyat, A.; Alzubaidi, L.; Fadhel, M.A.; Santamaría, J.; Duan, Y. IoT and Cloud Computing in Health-Care: A New Wearable Device and Cloud-Based Deep Learning Algorithm for Monitoring of Diabetes. Electronics 2021, 10, 2719. Available online: https://www.mdpi.com/2079-9292/10/21/2719 (accessed on 1 May 2022).
  11. Diwakar, M.; Tripathi, A.; Joshi, K.; Memoria, M.; Singh, P. Latest trends on heart disease prediction using machine learning and image fusion. Mater. Today Proc. 2021, 37, 3213–3218. [Google Scholar] [CrossRef]
  12. Rahman, A.U.; Saeed, M.; Mohammed, M.A.; Krishnamoorthy, S.; Kadry, S.; Eid, F. An Integrated Algorithmic MADM Approach for Heart Diseases’ Diagnosis Based on Neutrosophic Hypersoft Set with Possibility Degree-Based Setting. Life 2022, 12, 729. [Google Scholar] [CrossRef] [PubMed]
  13. Hu, G.; Root, M.M. Building prediction models for coronary heart disease by synthesizing multiple longitudinal research findings. Eur. J. Prev. Cardiol. 2005, 12, 459–464. [Google Scholar] [CrossRef] [PubMed]
  14. Deo, R.C. Machine learning in medicine. Circulation 2015, 132, 1920–1930. [Google Scholar] [CrossRef] [PubMed]
  15. Mythili, T.; Mukherji, D.; Padalia, N.; Naidu, A. A heart disease prediction model using SVM-decision trees-logistic regression (SDL). Int. J. Comput. Appl. 2013, 68, 0975–8887. [Google Scholar]
  16. Elhoseny, M.; Mohammed, M.A.; Mostafa, S.A.; Abdulkareem, K.H.; Maashi, M.S.; Garcia-Zapirain, B.; Mutlag, A.A.; Maashi, M.S. A new multi-agent feature wrapper machine learning approach for heart disease diagnosis. Comput. Mater. Contin 2021, 67, 51–71. [Google Scholar] [CrossRef]
  17. Detrano, R.; Janosi, A.; Steinbrunn, W.; Pfisterer, M.; Schmid, J.J.; Sandhu, S.; Guppy, K.H.; Lee, S.; Froelicher, V. International application of a new probability algorithm for the diagnosis of coronary artery disease. Am. J. Cardiol. 1989, 64, 304–310. [Google Scholar] [CrossRef]
  18. Gennari, J.H.; Langley, P.; Fisher, D. Models of incremental concept formation. Artif. Intell. 1989, 40, 11–61. [Google Scholar] [CrossRef]
  19. Janosi, A.; Steinbrunn, W.; Pfisterer, M.; Detrano, R. UCI Machine Learning Repository: Heart Disease Dataset [Online]. Available online: https://archive-beta.ics.uci.edu/ml/datasets/heart+disease (accessed on 1 March 2022).
  20. Machine Learning Repository: Statlog (Heart) [Online]. Available online: http://archive.ics.uci.edu/ml/datasets/Statlog+%28Heart%29 (accessed on 1 March 2022).
  21. Pedregosa, F.; Varoquaux, G.; Gramfort, A.; Michel, V.; Thirion, B.; Grisel, O.; Blondel, M.; Prettenhofer, P.; Weiss, R.; Dubourg, V.; et al. Scikit-learn: Machine learning in Python. J. Mach. Learn. Res. 2011, 12, 2825–2830. [Google Scholar]
  22. Sajja, T.K.; Kalluri, H.K. A Deep Learning Method for Prediction of Cardiovascular Disease Using Convolutional Neural Network. Rev. D’intelligence Artif. 2020, 34, 601–606. [Google Scholar] [CrossRef]
  23. Guo, C.; Zhang, J.; Liu, Y.; Xie, Y.; Han, Z.; Yu, J. Recursion enhanced random forest with an improved linear model (RERF-ILM) for heart disease detection on the internet of medical things platform. IEEE Access 2020, 8, 59247–59256. [Google Scholar] [CrossRef]
  24. Ali, S.A.; Raza, B.; Malik, A.K.; Shahid, A.R.; Faheem, M.; Alquhayz, H.; Kumar, Y.J. An optimally configured and improved deep belief network (OCI-DBN) approach for heart disease prediction based on Ruzzo–Tompa and stacked genetic algorithm. IEEE Access 2020, 8, 65947–65958. [Google Scholar] [CrossRef]
  25. Vijayashree, J.; Parveen Sultana, H. Heart disease classification using hybridized Ruzzo-Tompa memetic based deep trained Neocognitron neural network. Health Technol. 2020, 10, 207–216. [Google Scholar] [CrossRef]
  26. Bharti, R.; Khamparia, A.; Shabaz, M.; Dhiman, G.; Pande, S.; Singh, P. Prediction of Heart Disease Using a Combination of Machine Learning and Deep Learning. Comput. Intell. Neurosci. 2021, 2021, 8387680. [Google Scholar] [CrossRef] [PubMed]
  27. Ali, L.; Rahman, A.; Khan, A.; Zhou, M.; Javeed, A.; Khan, J.A. An Automated Diagnostic System for Heart Disease Prediction Based on χ2 Statistical Model and Optimally Configured Deep Neural Network. IEEE Access 2019, 7, 34938–34945. [Google Scholar] [CrossRef]
  28. Aliyar Vellameeran, F.; Brindha, T. A new variant of deep belief network assisted with optimal feature selection for heart disease diagnosis using IoT wearable medical devices. Comput. Methods Biomech. Biomed. Eng. 2021, 25, 387–411. [Google Scholar] [CrossRef]
  29. Yue, W.; Wang, Z.; Chen, H.; Payne, A.; Liu, X. Machine Learning with Applications in Breast Cancer Diagnosis and Prognosis. Designs 2018, 2, 13. [Google Scholar] [CrossRef] [Green Version]
  30. Ali, L.; Zhu, C.; Zhou, M.; Liu, Y. Early diagnosis of Parkinson’s disease from multiple voice recordings by simultaneous sample and feature selection. Expert Syst. Appl. 2019, 137, 22–28. [Google Scholar] [CrossRef]
  31. Liu, H.; Setiono, R. Chi2: Feature selection and discretization of numeric attributes. In Proceedings of the 7th IEEE International Conference on Tools with Artificial Intelligence, Herndon, VA, USA, 5–8 November 1995; pp. 388–391. [Google Scholar]
  32. Maldonado, S.; Pérez, J.; Weber, R.; Labbé, M. Feature selection for support vector machines via mixed integer linear programming. Inf. Sci. 2014, 279, 163–175. [Google Scholar] [CrossRef]
  33. Shorewala, V. Early detection of coronary heart disease using ensemble techniques. Inform. Med. Unlocked 2021, 26, 100655. [Google Scholar] [CrossRef]
  34. Ali, F.; El-Sappagh, S.; Islam, S.R.; Kwak, D.; Ali, A.; Imran, M.; Kwak, K.S. A smart healthcare monitoring system for heart disease prediction based on ensemble deep learning and feature fusion. Inf. Fusion 2020, 63, 208–222. [Google Scholar] [CrossRef]
  35. Latha, C.B.C.; Jeeva, S.C. Improving the accuracy of prediction of heart disease risk based on ensemble classification techniques. Inform. Med. Unlocked 2019, 16, 100203. [Google Scholar] [CrossRef]
  36. Haq, A.U.; Li, J.P.; Memon, M.H.; Nazir, S.; Sun, R. A Hybrid Intelligent System Framework for the Prediction of Heart Disease Using Machine Learning Algorithms. Mob. Inf. Syst. 2018, 2018, 3860146. [Google Scholar] [CrossRef]
  37. Vijayashree, J.; Sultana, H.P. A Machine Learning Framework for Feature Selection in Heart Disease Classification Using Improved Particle Swarm Optimization with Support Vector Machine Classifier. Program. Comput. Softw. 2019, 44, 388–397. [Google Scholar] [CrossRef]
  38. Tuli, S.; Basumatary, N.; Gill, S.S.; Kahani, M.; Arya, R.C.; Wander, G.S.; Buyya, R. HealthFog: An ensemble deep learning based Smart Healthcare System for Automatic Diagnosis of Heart Diseases in integrated IoT and fog computing environments. Future Gener. Comput. Syst. 2020, 104, 187–200. [Google Scholar] [CrossRef] [Green Version]
Figure 1. The proposed model’s overall working process.
Designs 06 00087 g001
Figure 2. The margin between hyperplane and data.
Designs 06 00087 g002
Figure 3. Heart disease classes. (a) Cleveland dataset; (b) Statlog dataset.
Designs 06 00087 g003
Figure 4. Correlation heat map. (a) Cleveland dataset; (b) Statlog dataset.
Designs 06 00087 g004
Figure 5. Selected features by highest χ2 score (Cleveland dataset).
Designs 06 00087 g005
Figure 6. Selected features by highest χ2 score (Statlog dataset).
Designs 06 00087 g006
Figure 7. Performance of proposed algorithm. (a) Cleveland dataset; (b) Statlog dataset.
Designs 06 00087 g007
Figure 8. AUC and ROC analysis. (a) Cleveland dataset; (b) Statlog dataset.
Designs 06 00087 g008
Figure 9. Confusion matrix of Cleveland dataset. (a) Total features; (b) Selected features.
Designs 06 00087 g009
Figure 10. Confusion matrix of Statlog dataset. (a) Total features; (b) Selected features.
Designs 06 00087 g010
Table 1. Attribute descriptions of Cleveland datasets [19].
NameTypeDescription
AgeNumericAge in years
SexCategorial0 = Female or 1 = male
CpCategorialType of Chest pain (1 = typical angina, 2 = atypical angina, 3 = non anginal pain, 4 = asymptomatic)
TrestbpsNumericResting blood pressure (mm hg)
CholNumericSerum cholesterol (mg/dL)
FbsCategorialFasting blood sugar > 120 mg/dL (0 = false, 1 = true)
RestecgCategorialResting electrocardiography results (0 = normal, 1 = ST-T wave abnormality, 2 = probable or definite left ventricular hypertrophy)
ThalachNumericMaximum heart rate achieved during thalium stress test
ExangCategorialExercise-induced angina (1 = yes, 0 = no)
OldpeakNumericSt depression induced by exercise relative to rest
SlopeCategorialSlope of peak exercise ST segment (1 = upsloping, 2 = flat, 3 = downsloping)
CaCategorialNumber of significant vessels colored by fluoroscopy
ThalCategorialThalium stress test result (3 = normal, 6 = fixed, 7 = reversible defect)
NumCategorialHeart disease status (0 = < 50% diameter narrowing, 1 = > 50% diameter narrowing)
Table 2. Calculation table for the χ2 test score [27].
Positive ClassNegative ClassTotal
Feature Xi occursαbα + b = m
Feature Xi does not occurλyλ + y = t − m
Totalα + λ = pb + y = t − pt
Table 3. Performance of proposed model without feature selection.
DatasetTotal RecordsTotal FeaturesAcc (%)Spe (%)Sen (%)F1 (%)
Cleveland3031484.2184.1367.4584.16
Statlog2701485.2985.3668.2985.29
Table 4. Performance of proposed model with feature selection.
DatasetTotal RecordsTotal FeaturesAcc (%)Spe (%)Sen (%)F1 (%)
Cleveland303689.4789.4089.4089.40
Statlog270689.7089.7089.7489.70
Table 5. Proposed model comparative analysis with current state-of-the-art methods.
StudyFeature Selection MethodDatasetClassifierTotal
Features
Acc (%)Selected
Features
Acc (%)
[33]Lasso 1ClevelandEnsemble13-875.1
[34]Information GainClevelandEnsemble2772.21683.5
[26]LassoClevelandSVM1384.09-84.26
[35]Randomly Generated Feature SetClevelandEnsemble13-985.48
[24]Ruzzo-TompaClevelandANN 213-786.20
[36]LassoClevelandSVM (RBF)1386688
[37]PSO-SVM 3ClevelandSVM1379.35688.22
[28]PS-GWOStatlog and ClevelandDBN 413--88.8
[38]PCA 5ClevelandDL 613--89
ProposedChi-squared SVM1385.29689.47
1 Lasso: least absolute shrinkage and selection operator; 2 ANN: artificial neural network; 3 PSO: swarm optimizations; 4 DBN: deep belief network; 5 PCA: principal component analysis; 6 DL: deep learning.
Publisher’s Note: MDPI stays neutral with regard to jurisdictional claims in published maps and institutional affiliations.

