An Enriched Customer Journey Map: How to Construct and Visualize a Global Portrait of Both Lived and Perceived Users’ Experiences?

Abstract
:1. Introduction
2. Defining Concepts
2.1. User Experience
2.2. Defining UX Tools
3. Method
3.1. Sample and Procedure
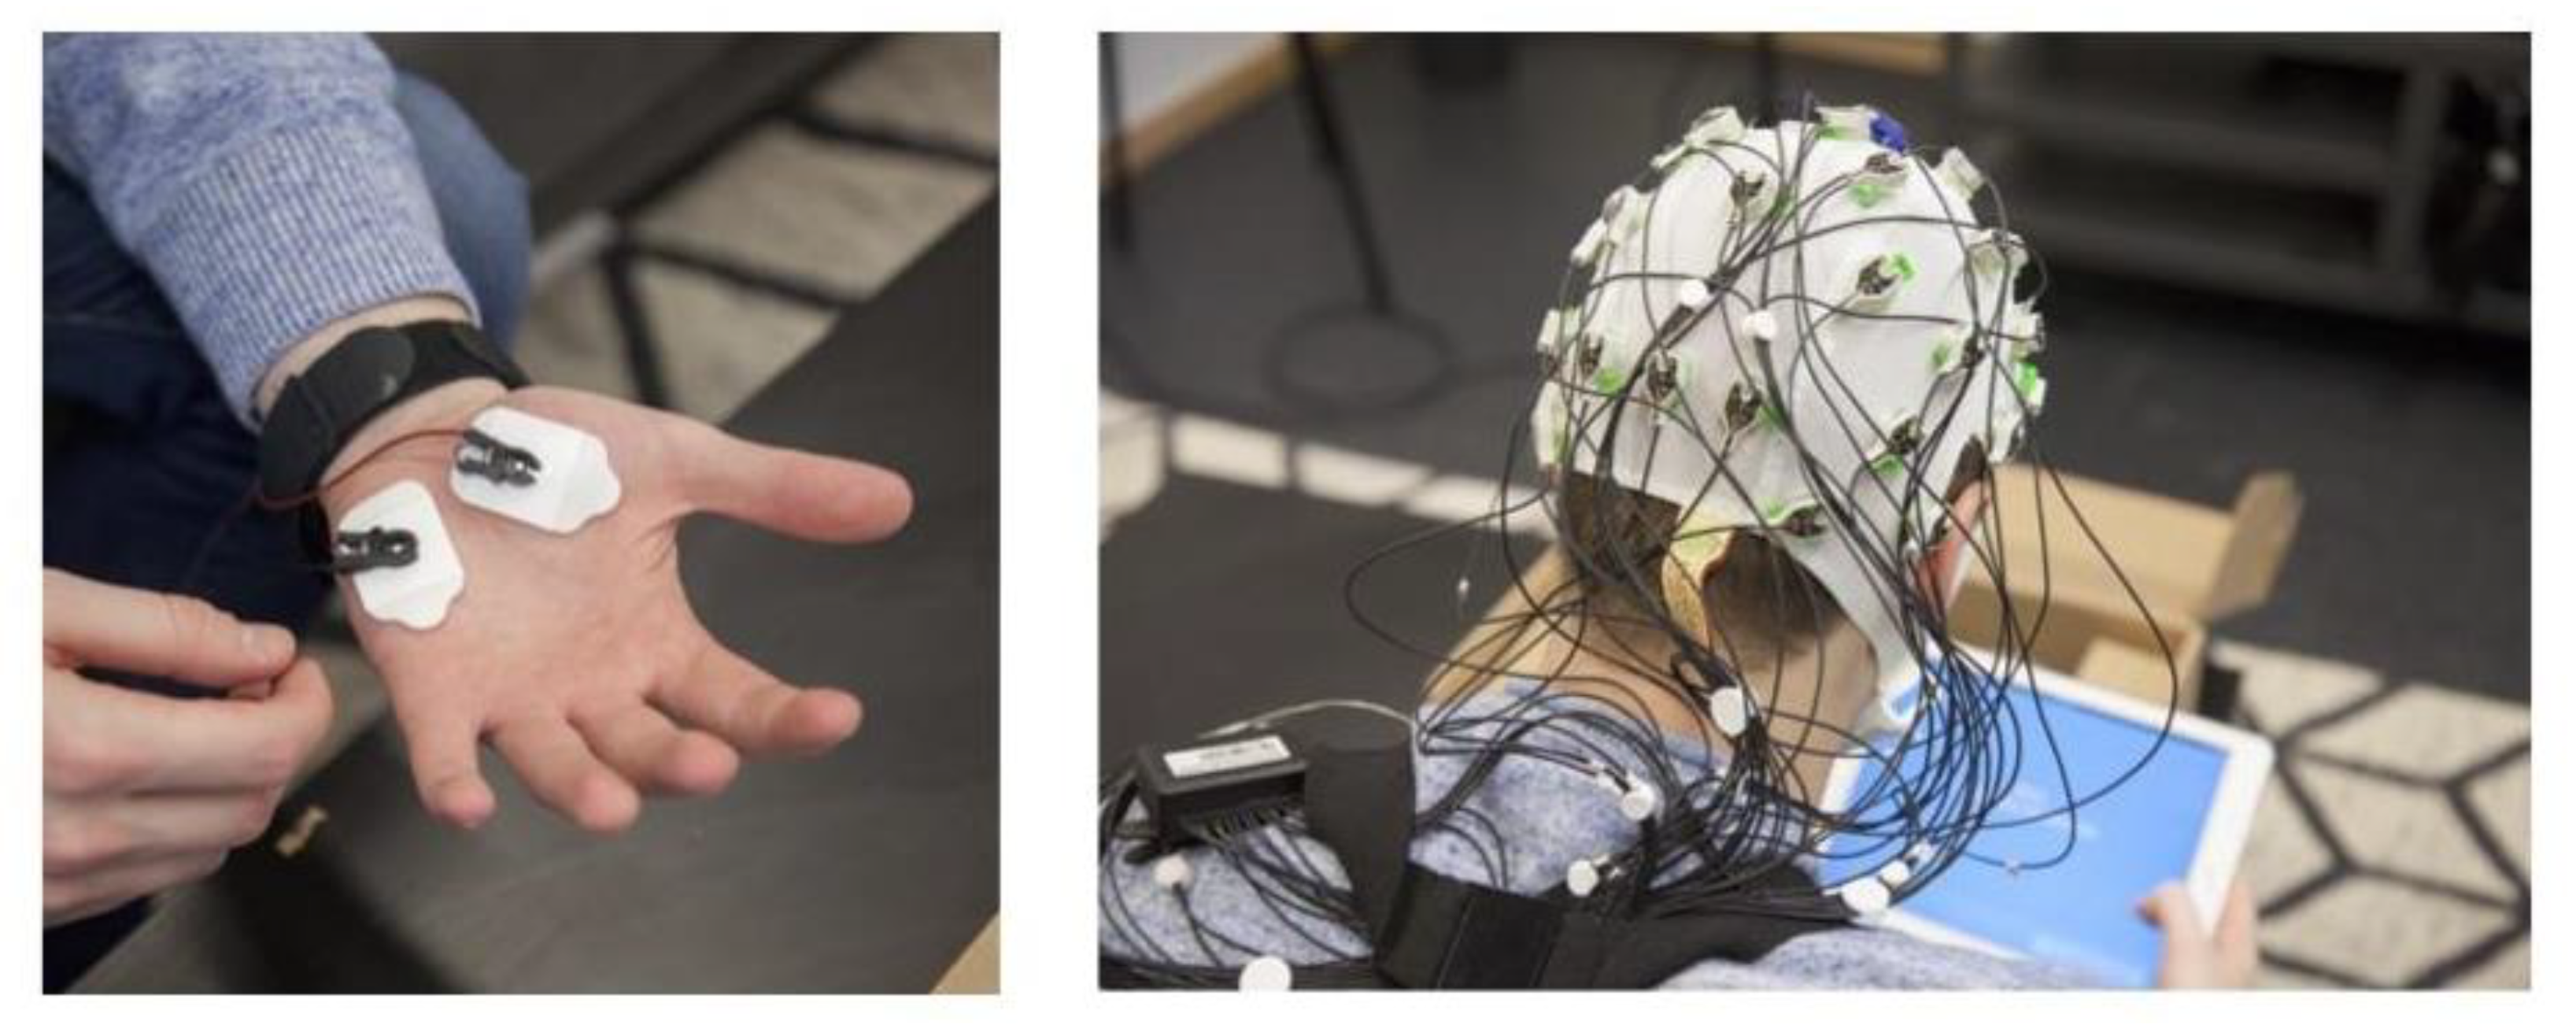
3.2. Apparatus and Instruments
3.3. Measures
4. Results
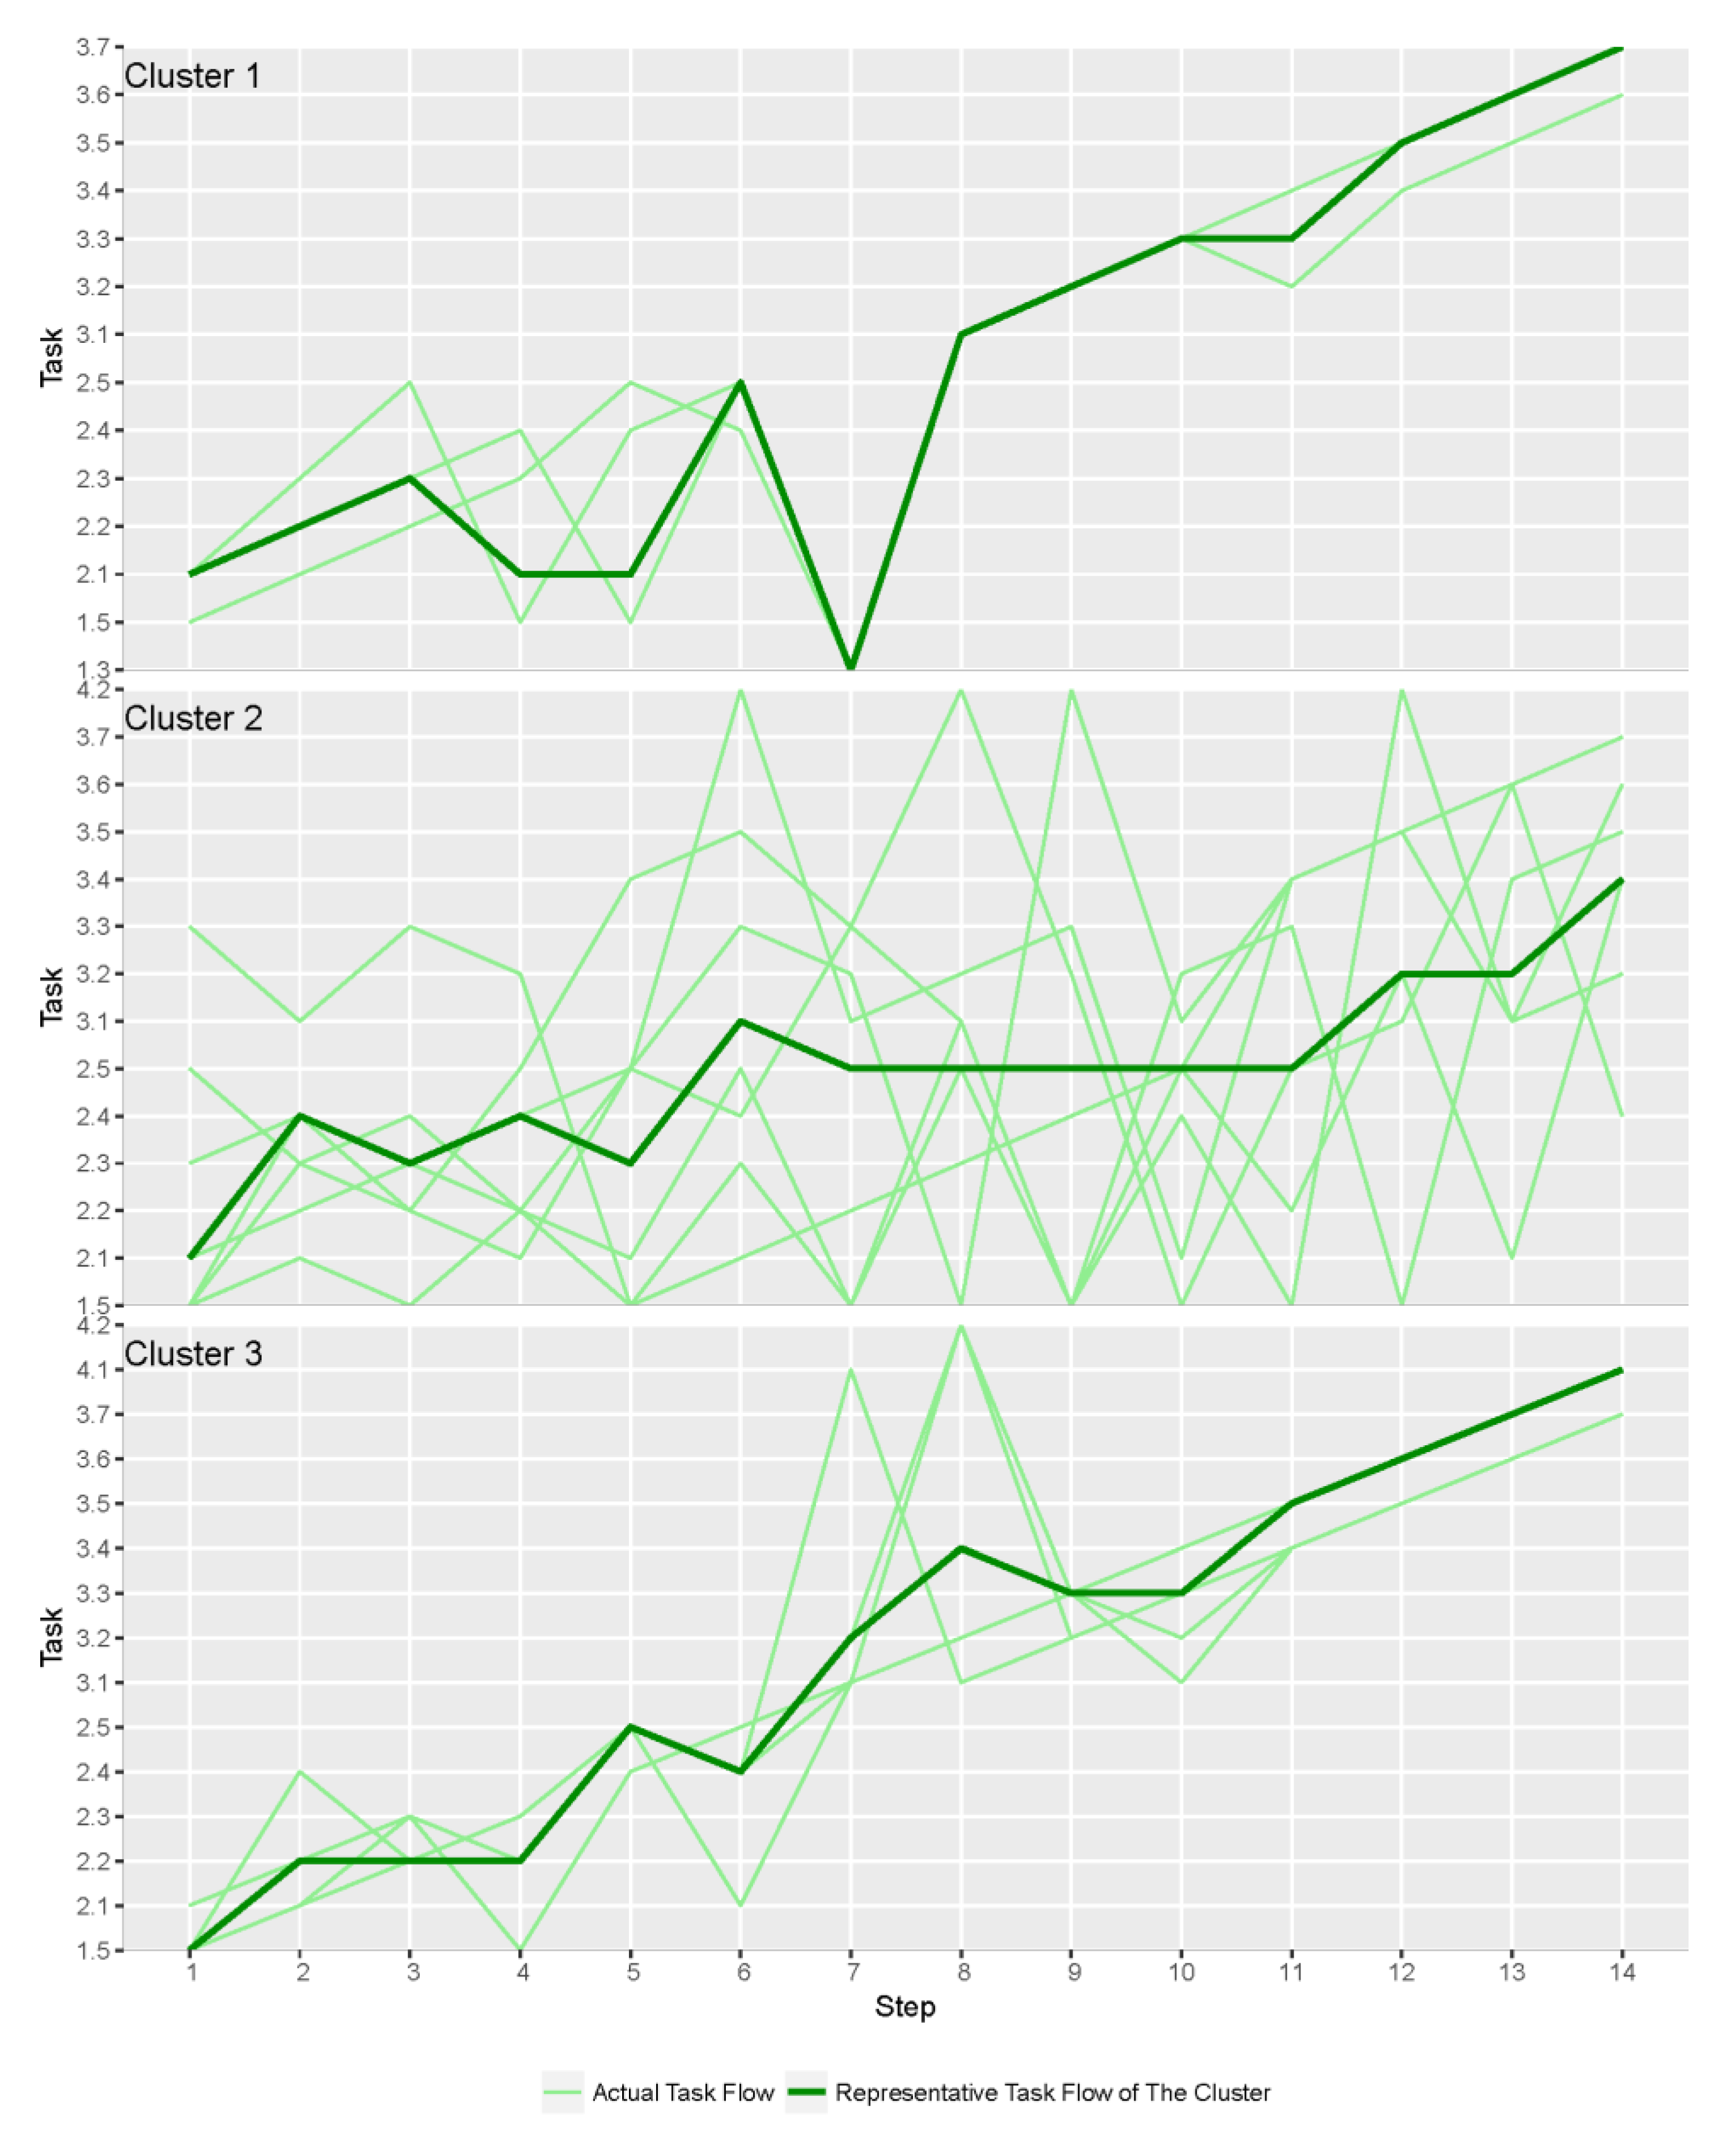
4.1. Step 1: Inductive Statistical Approach
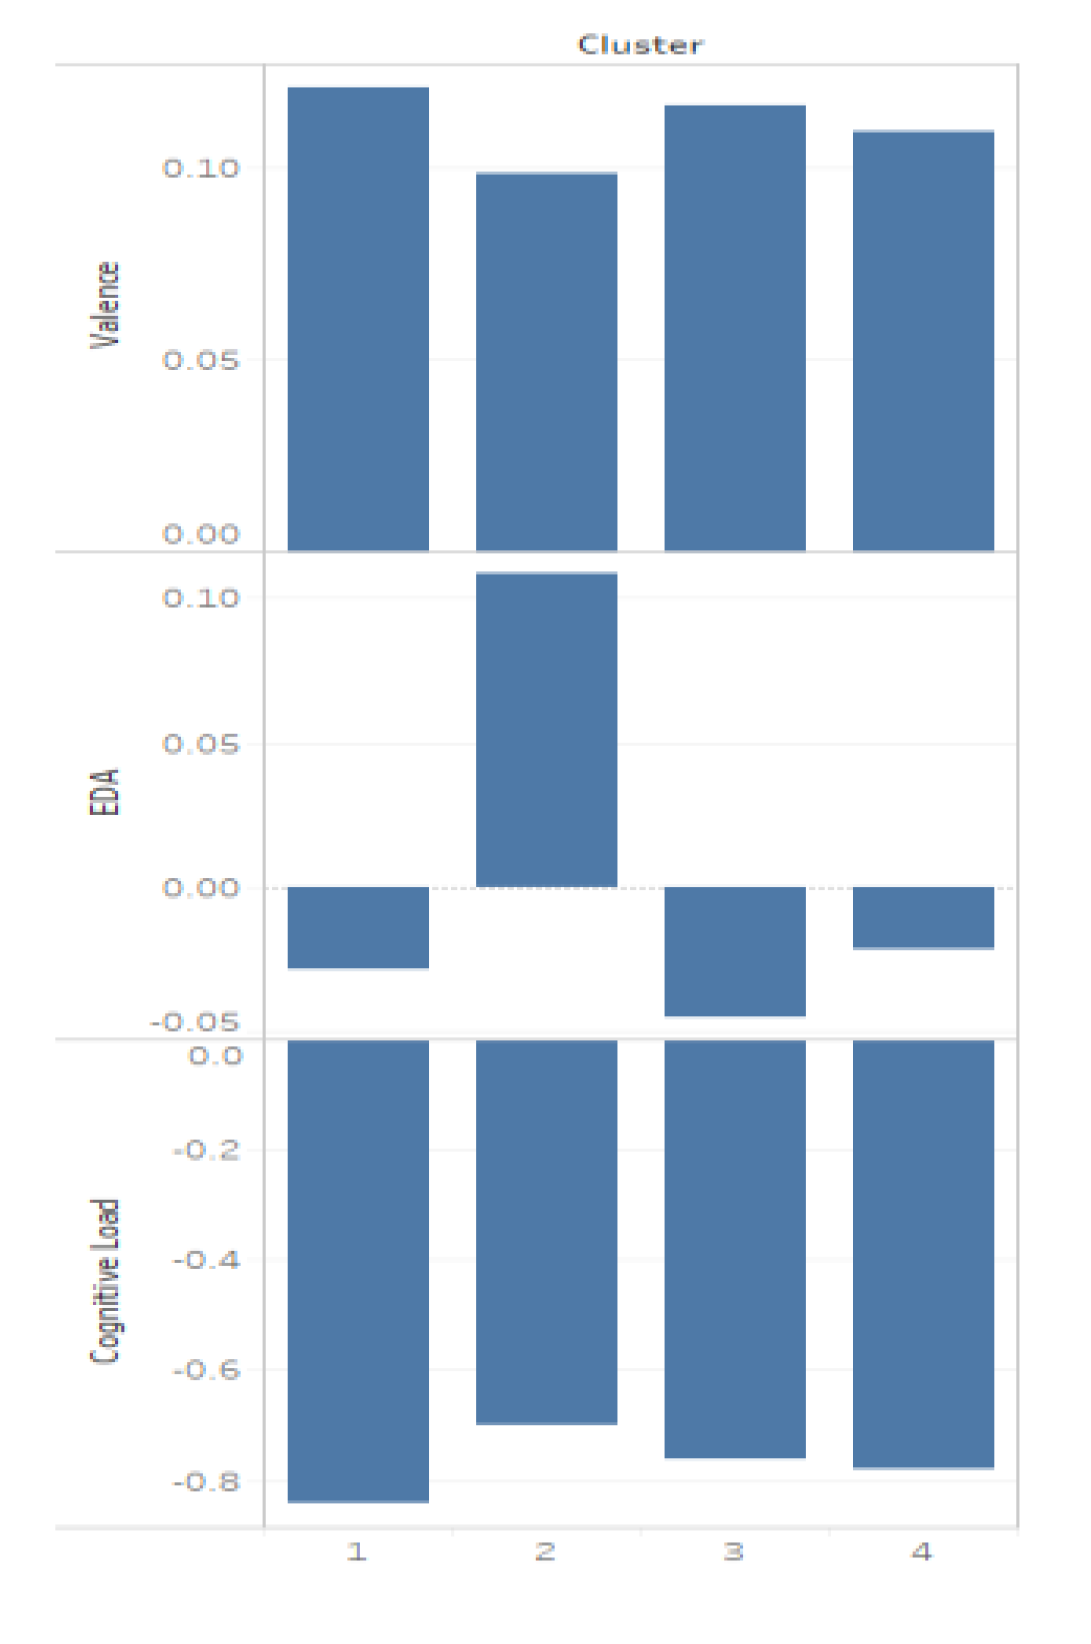
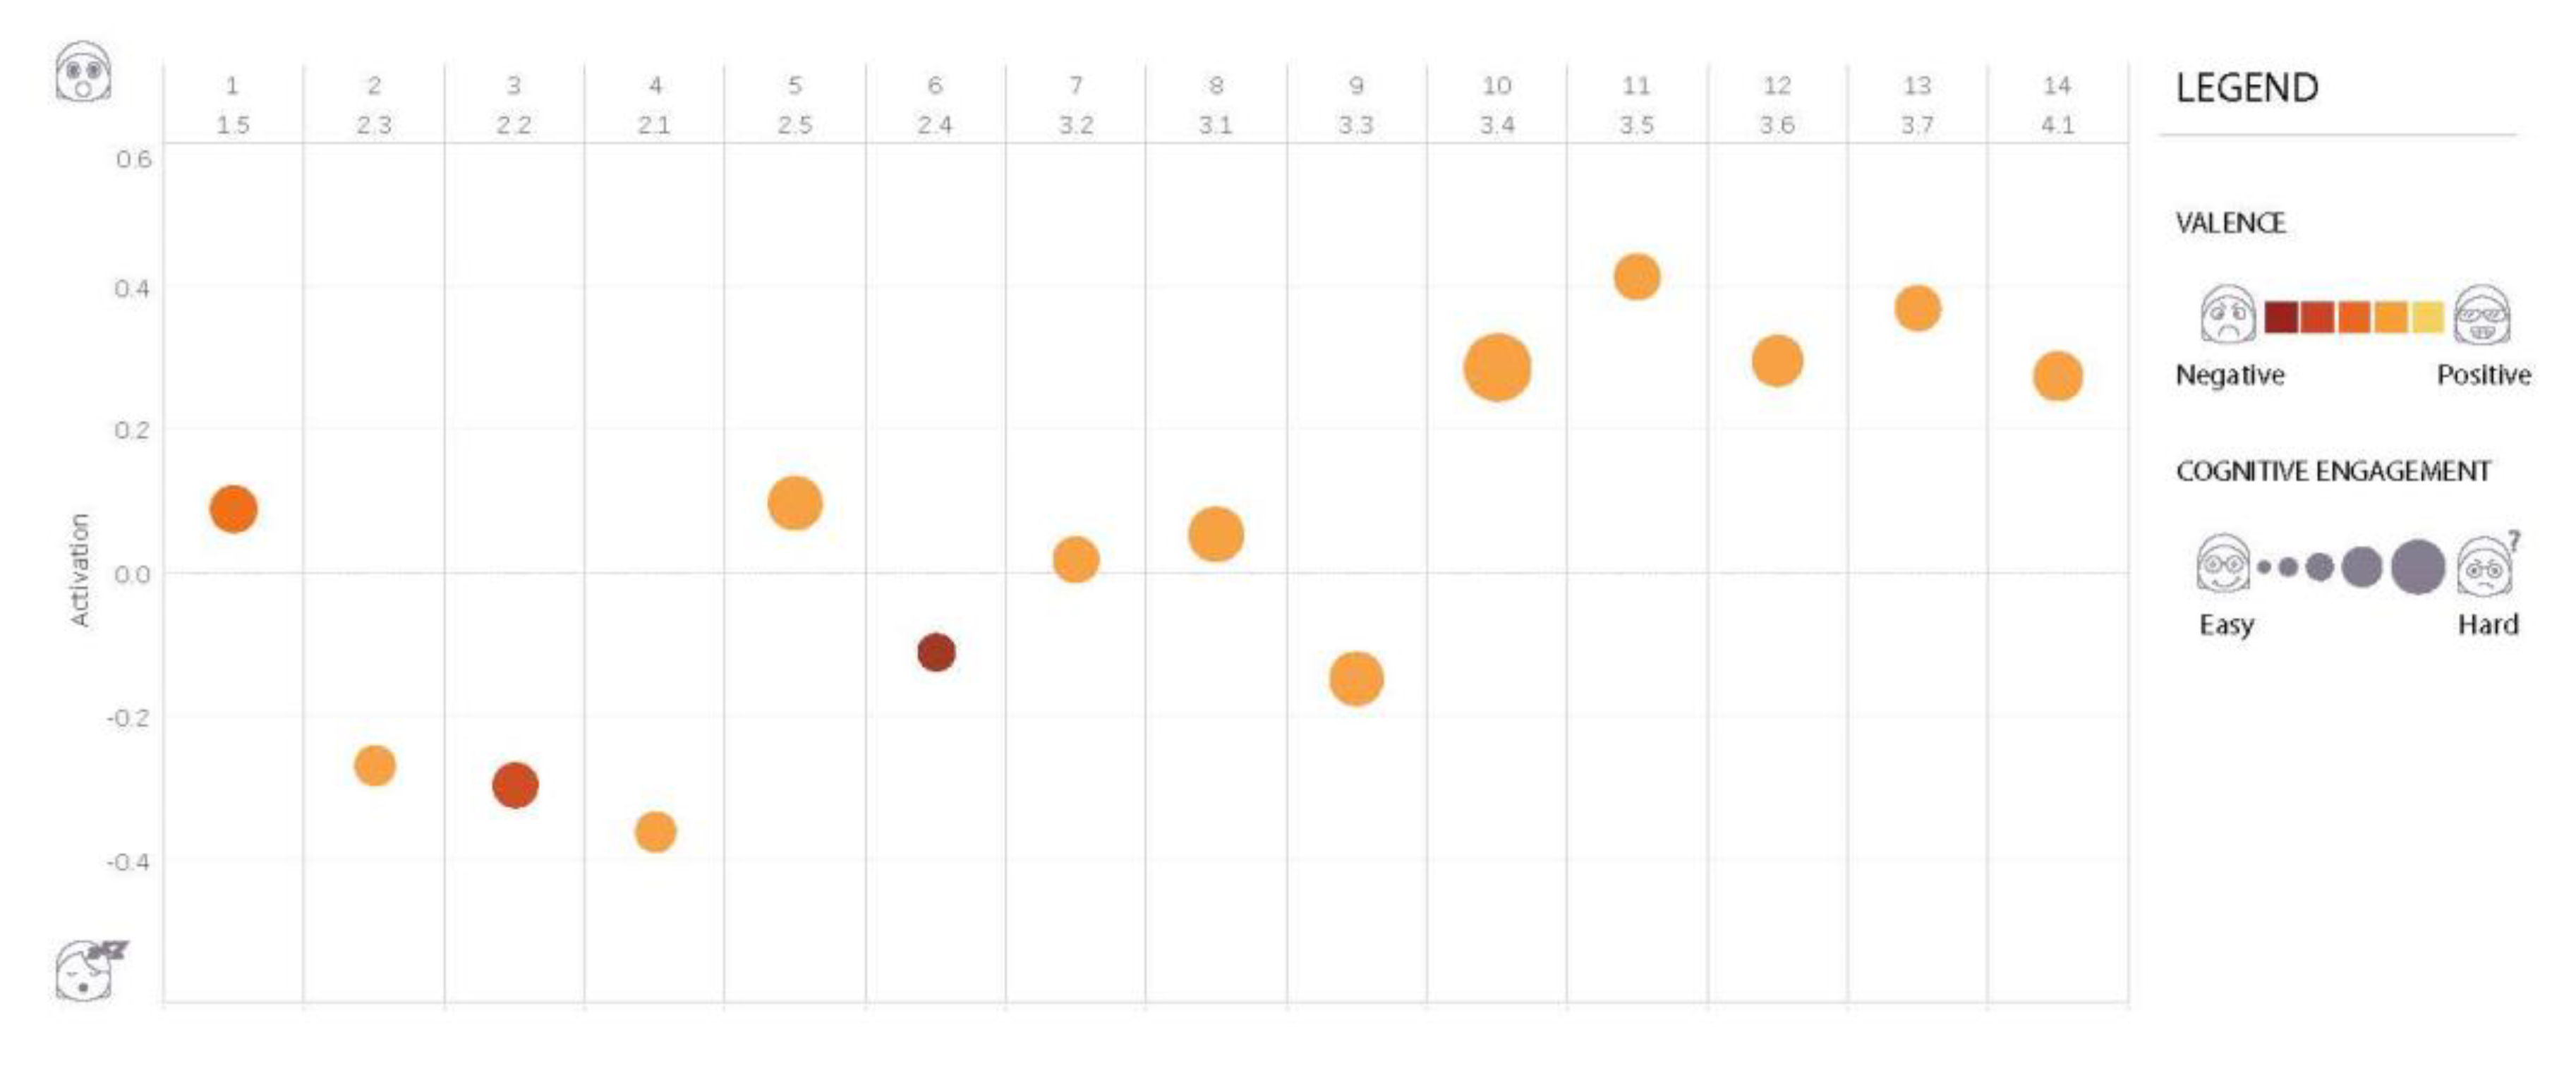
4.2. Step 2: User’s Cognitive Engagement, Valence and Arousal
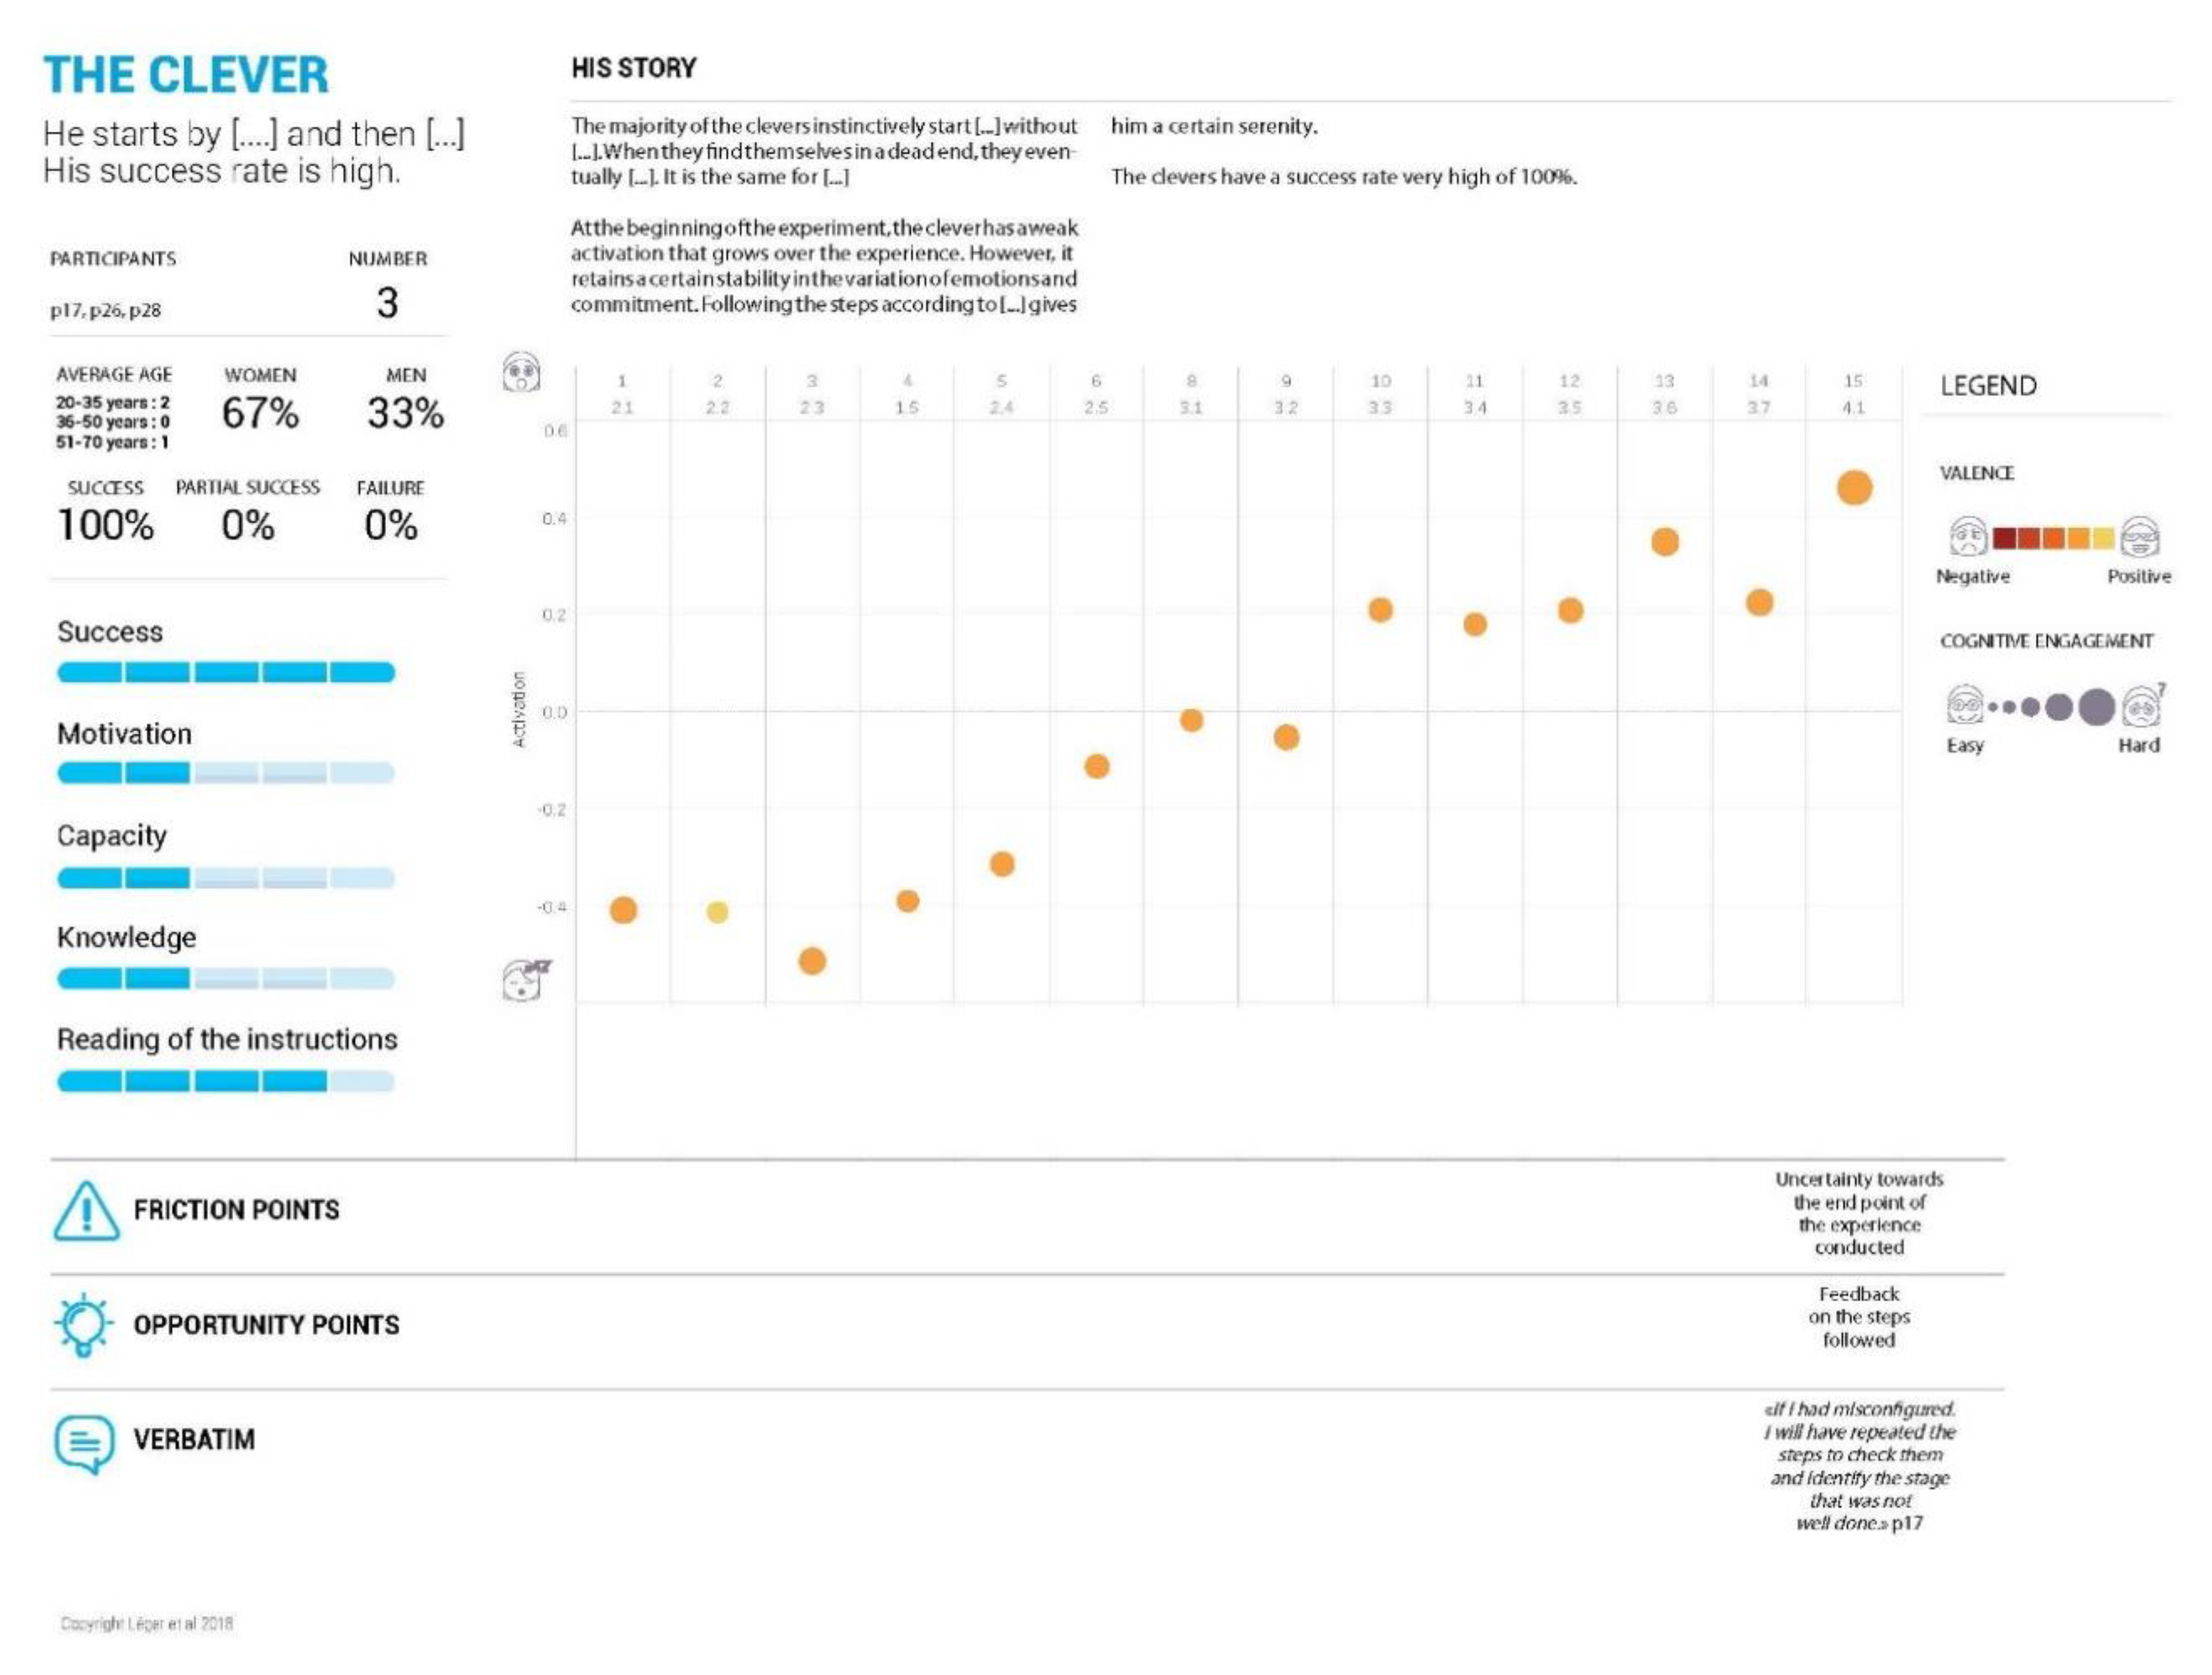
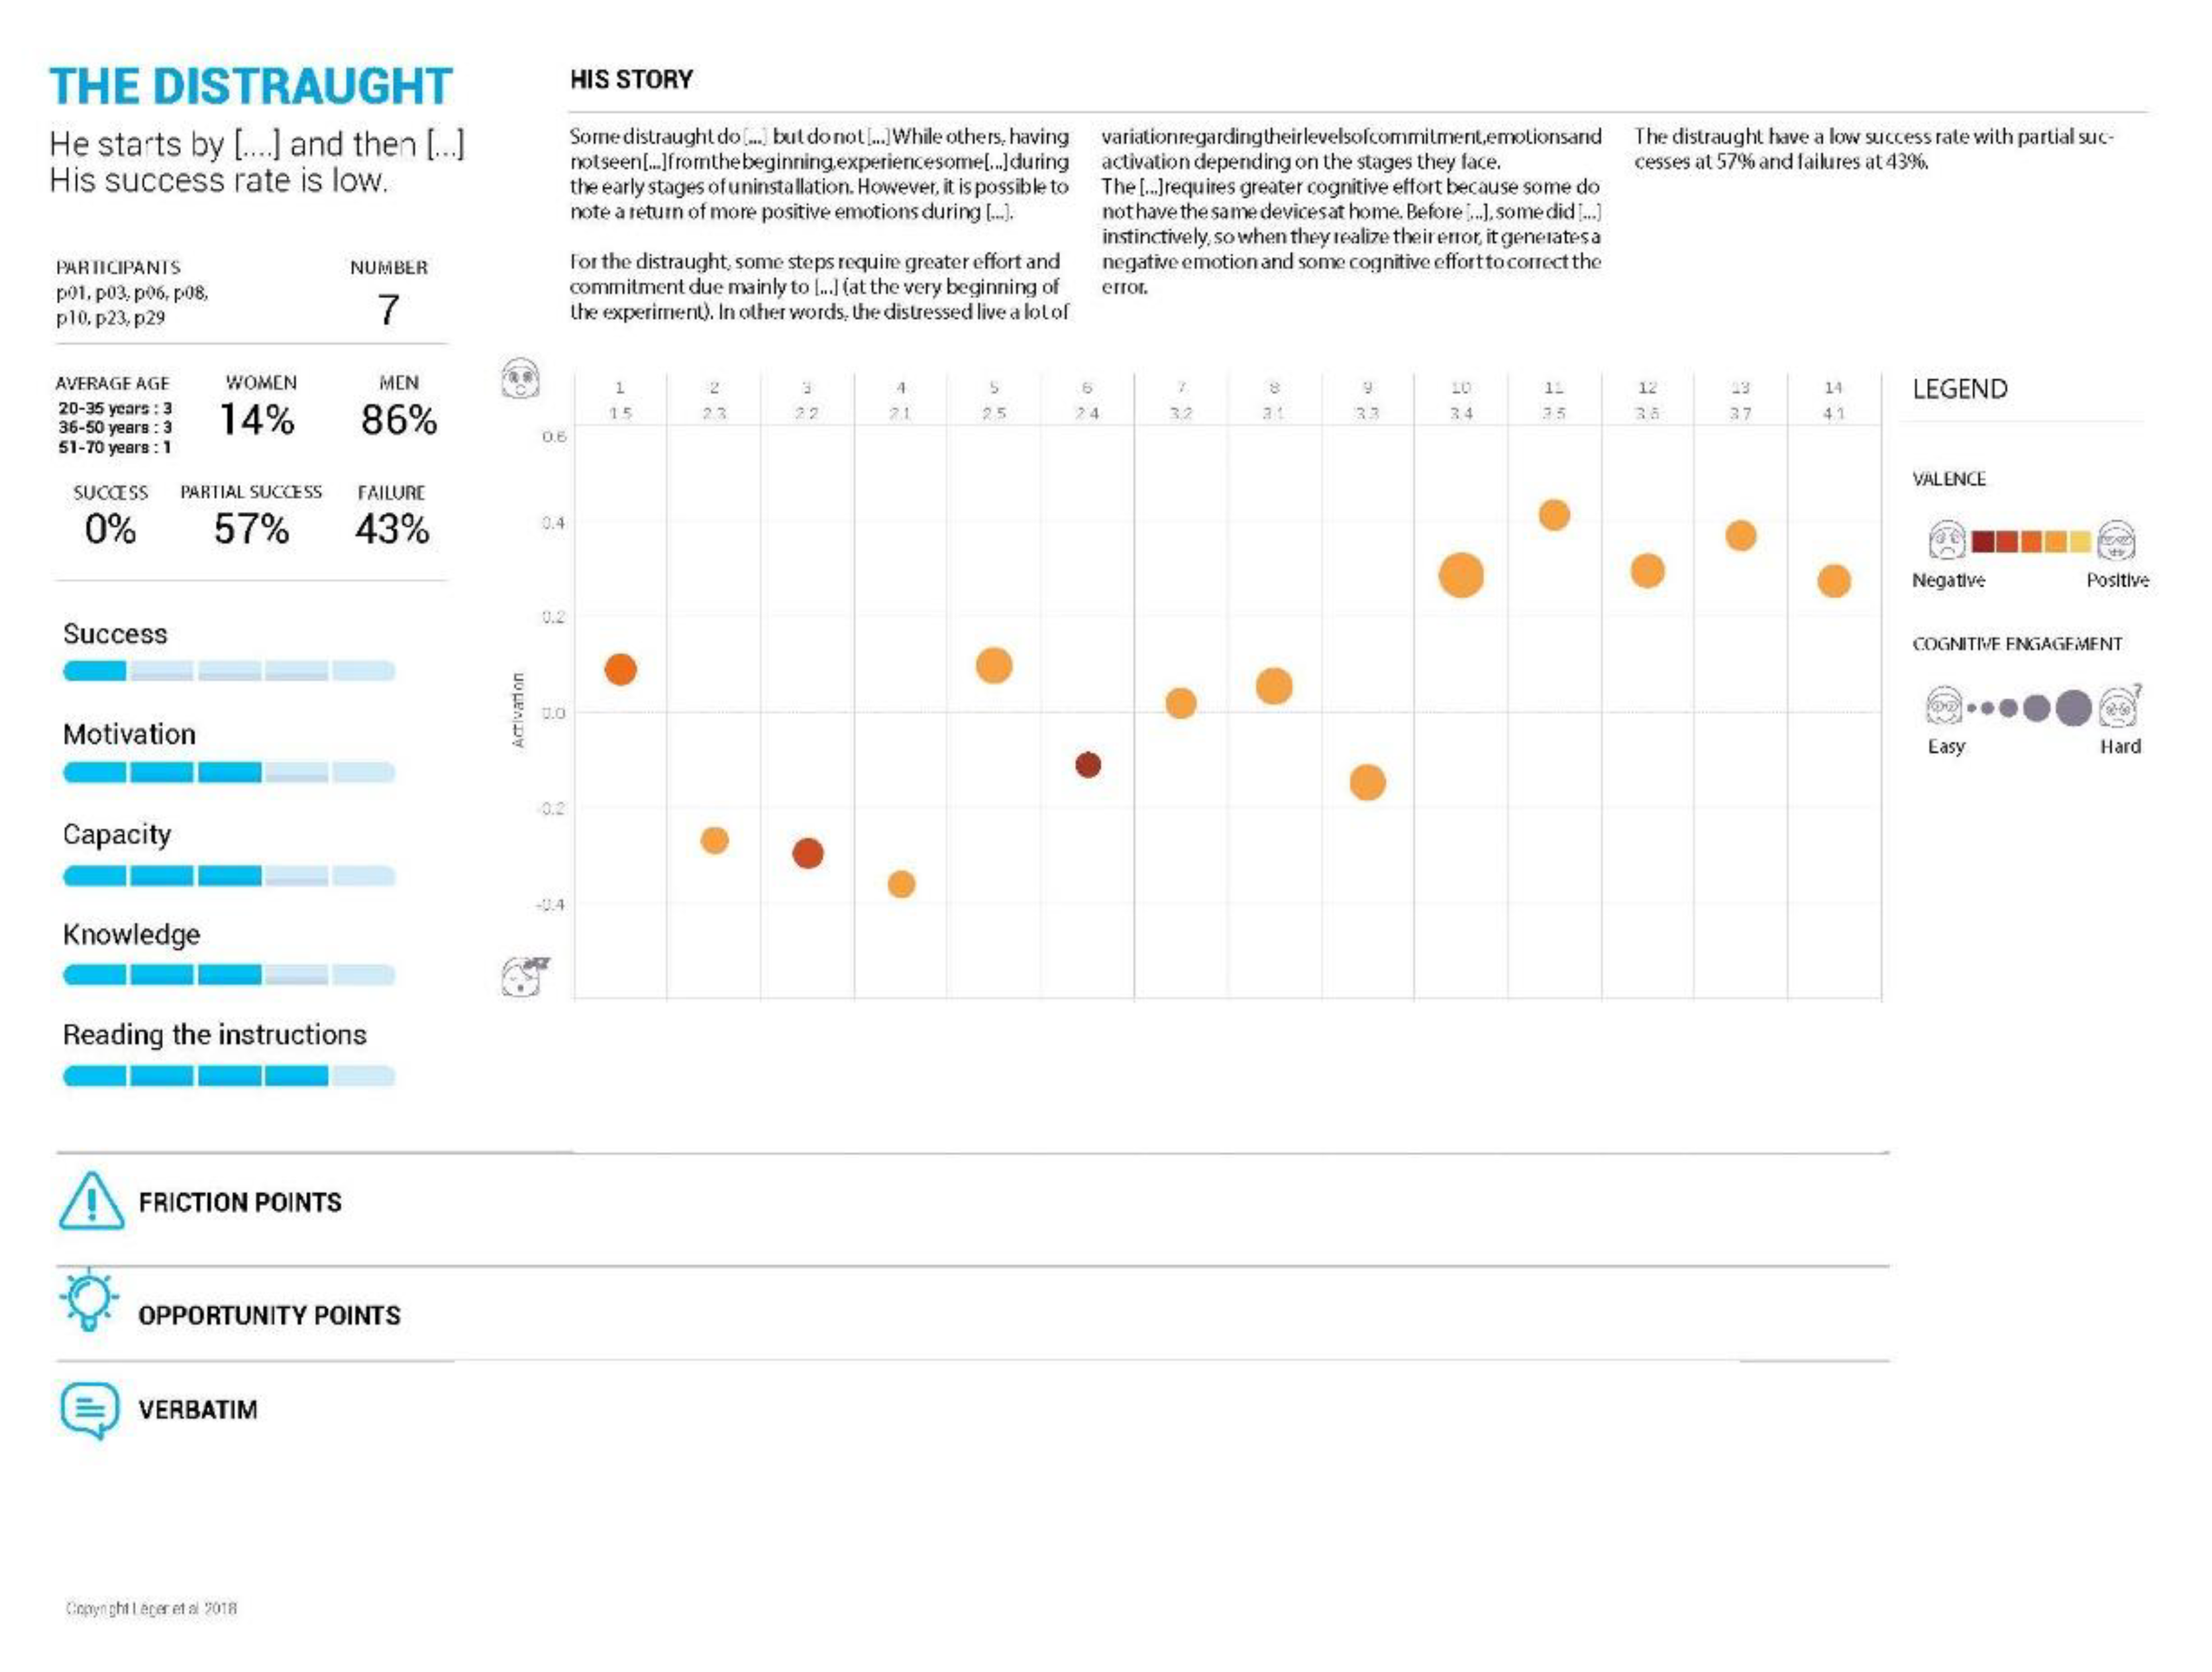
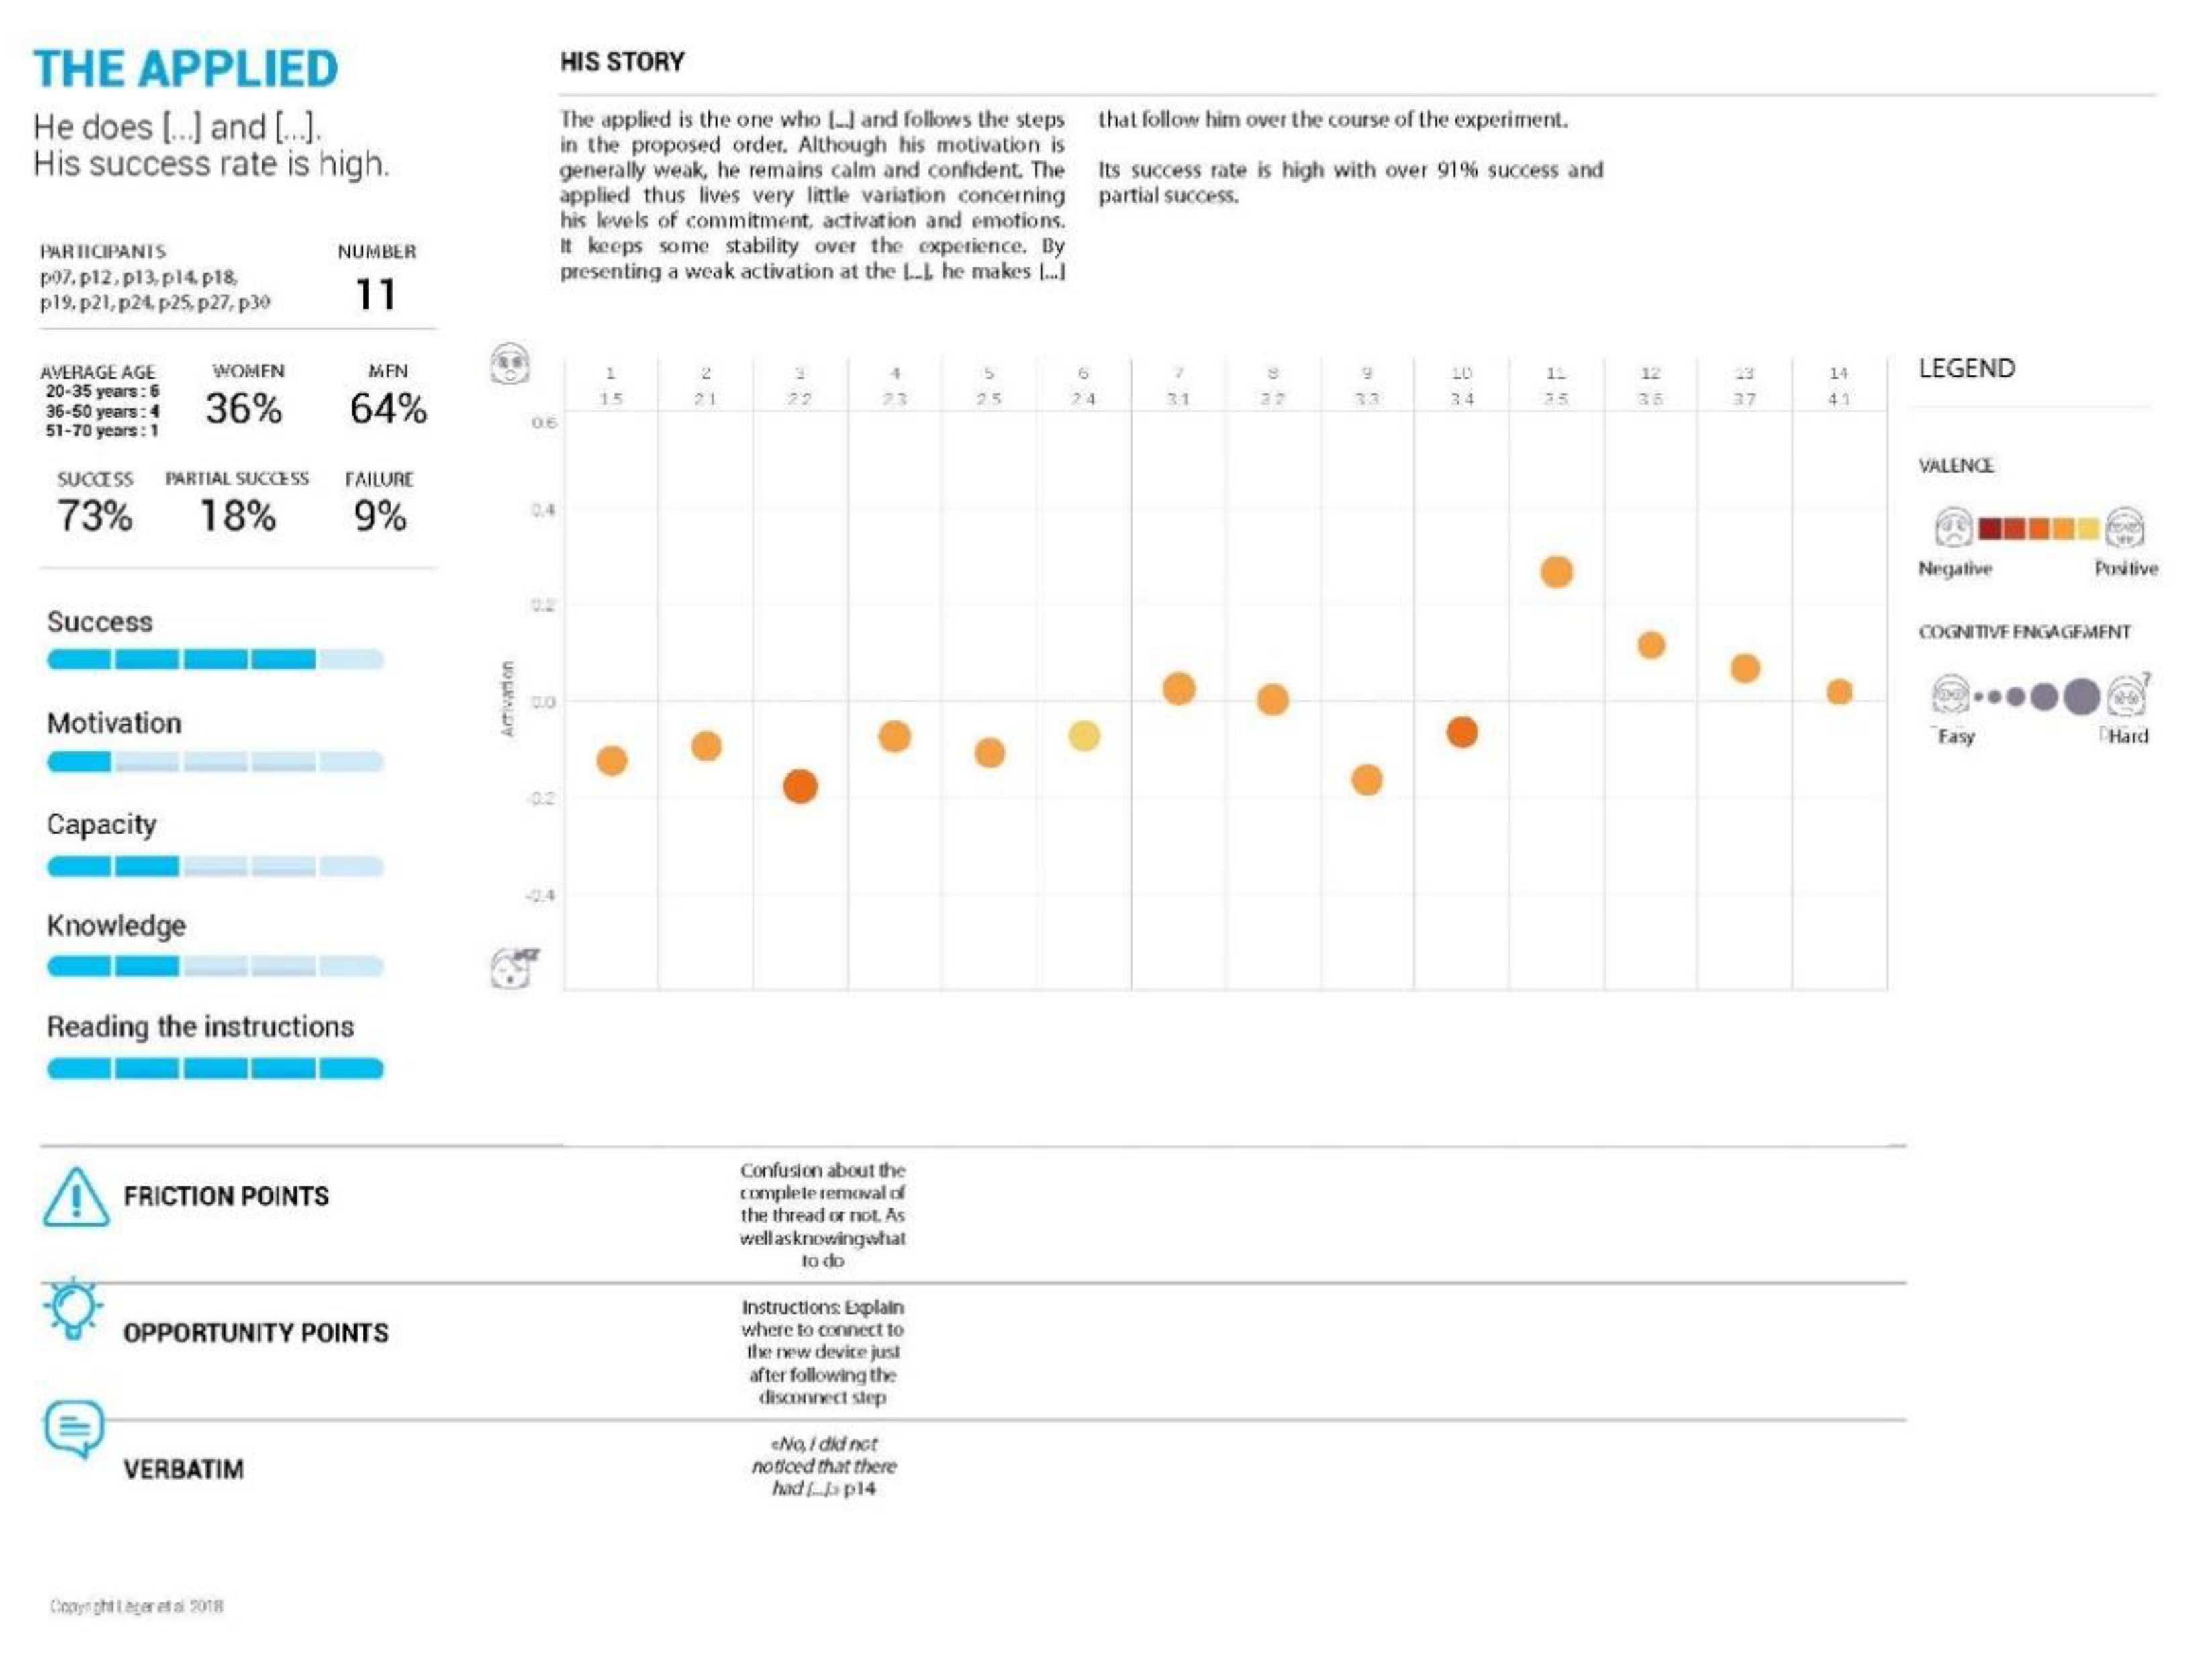
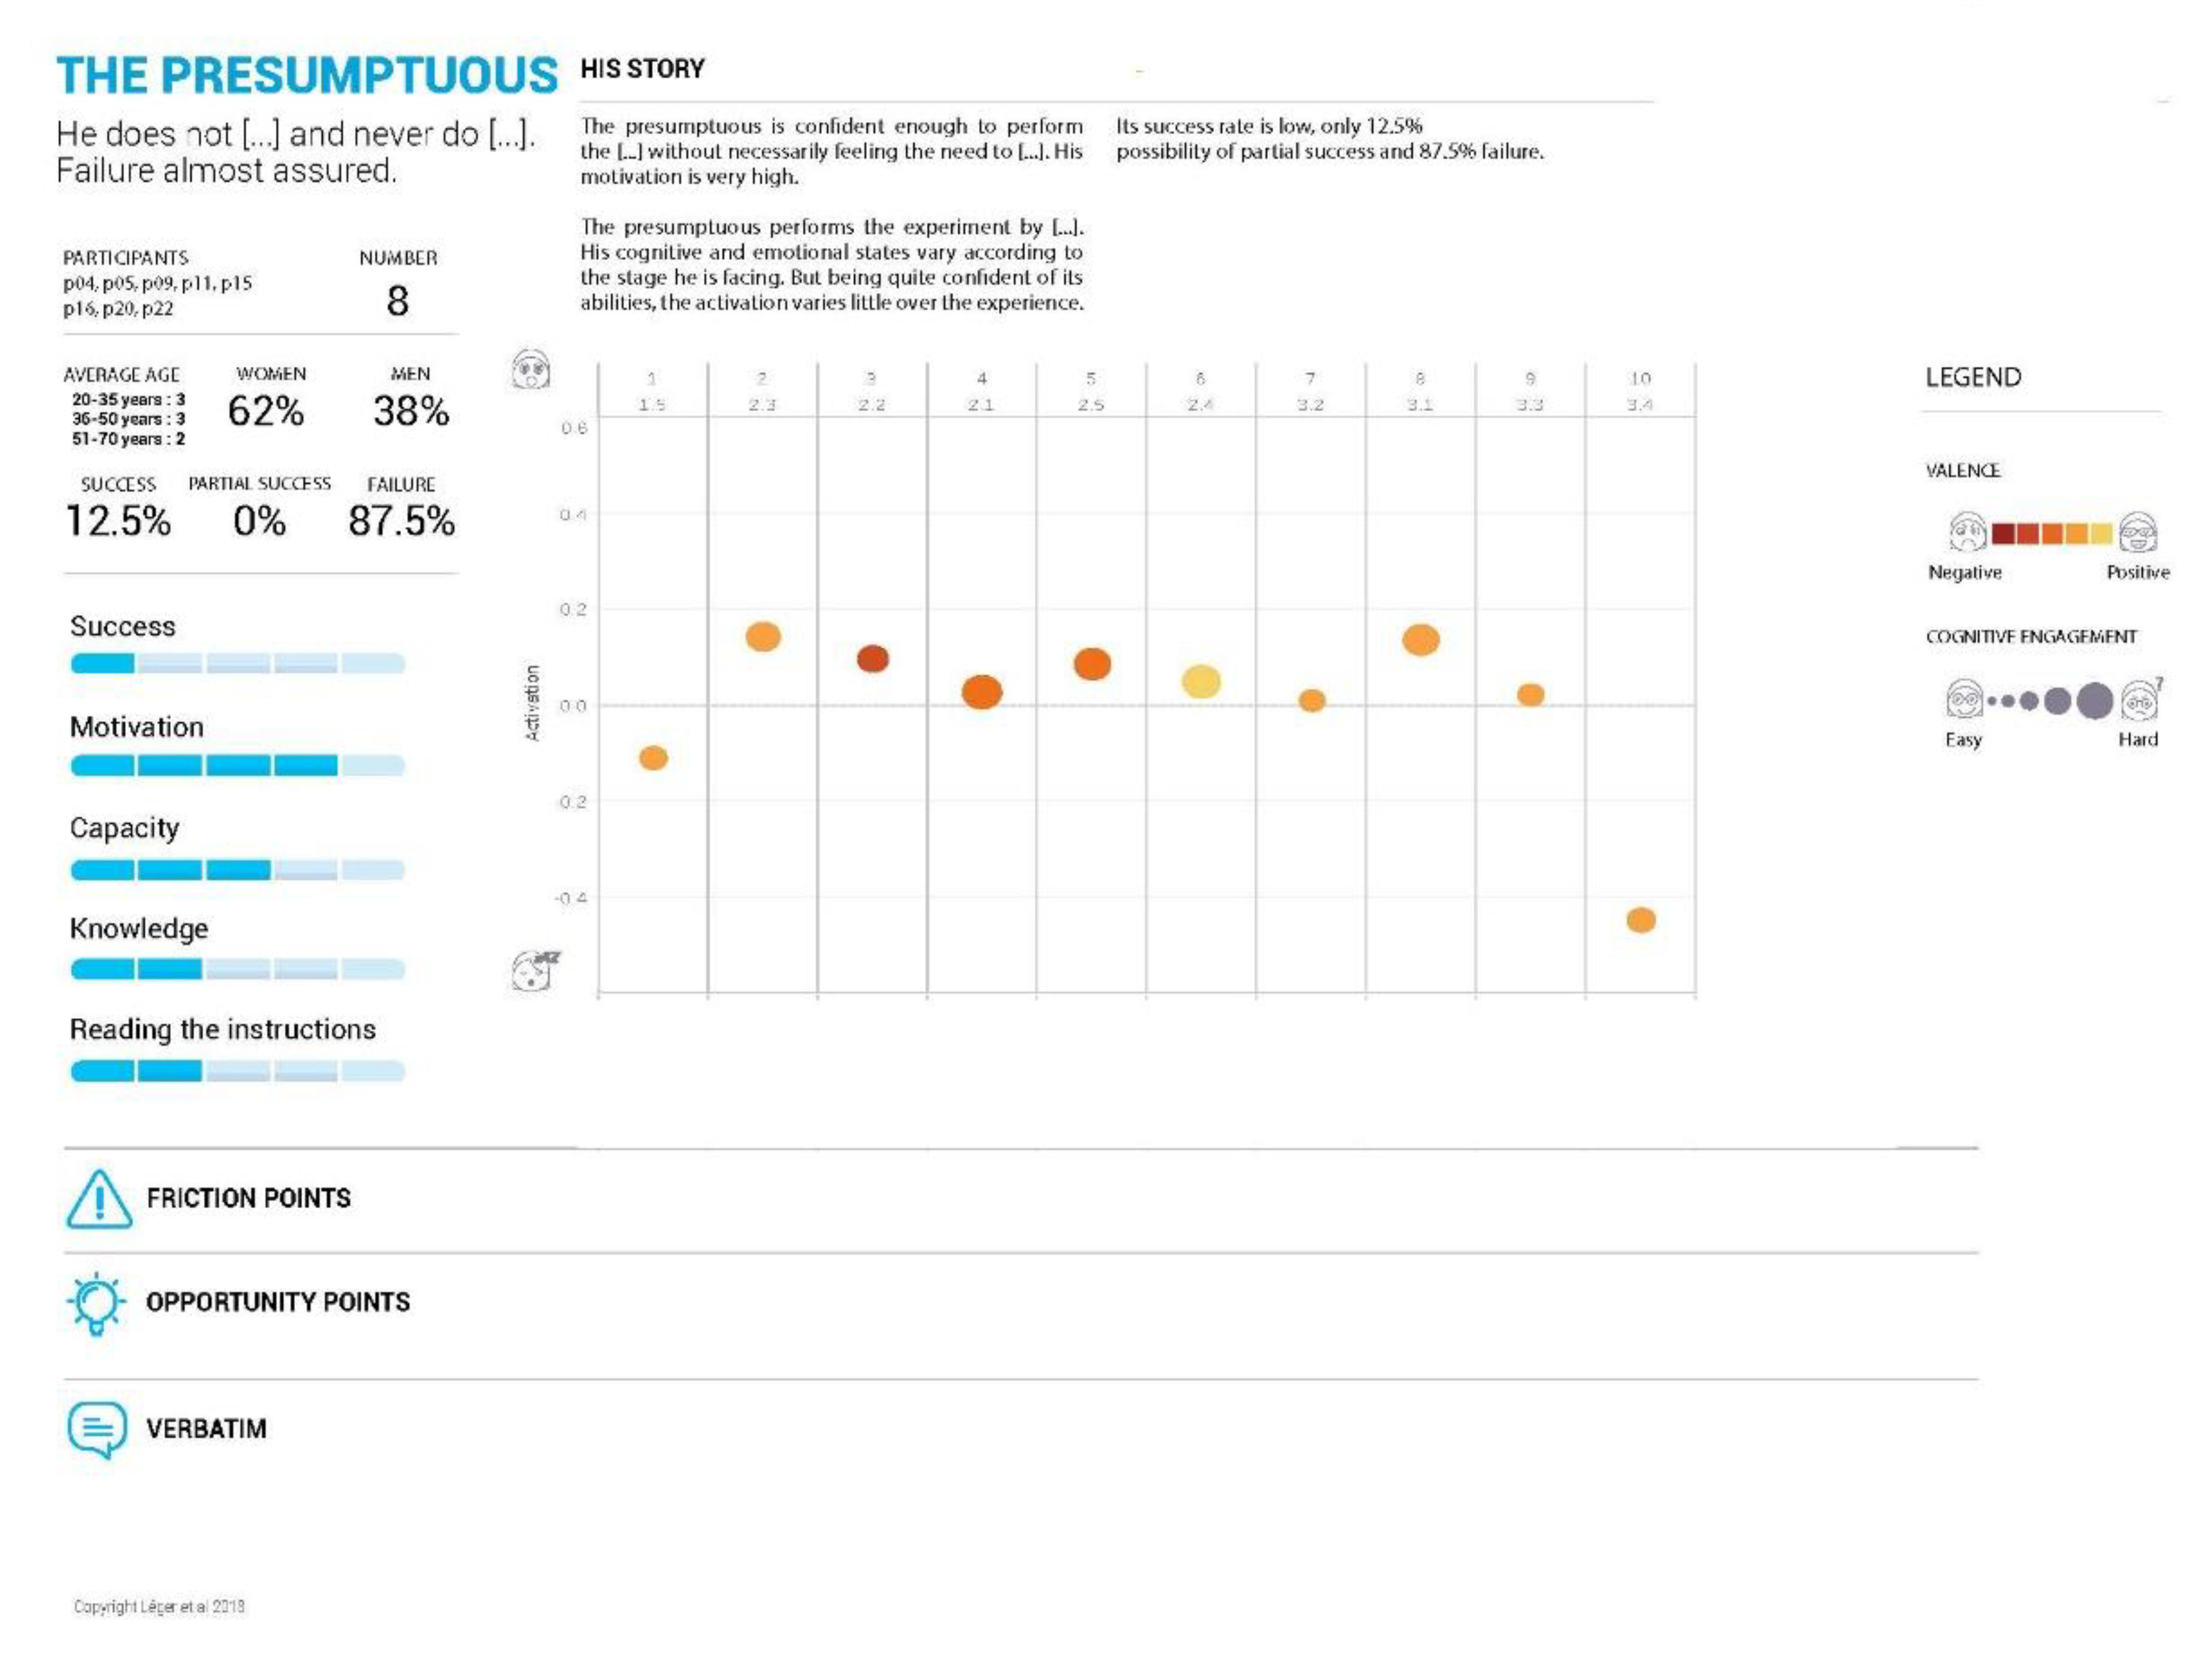
4.3. Step 3: Qualitative Data to Story Tell the Customer Journey
5. Discussion
5.1. Contribution for Theory
5.2. Implications for Design Practice
5.3. Implications for Experimental Design Practice
5.4. Limits of This Research
5.5. Future Research
6. Conclusions
Author Contributions
Funding
Conflicts of Interest
References
- Law, E.L.C.; Roto, V.; Hassenzahl, M.; Vermeeren, A.P.; Kort, J. Understanding, scoping and defining user experience: A survey approach. In Proceedings of the SIGCHI Conference on Human Factors in Computing Systems, Boston, MA, USA, 4–9 April 2009; ACM: New York, NY, USA, 2009; pp. 719–728. [Google Scholar]
- van der Bijl-Brouwer, M.; Dorst, K. Advancing the strategic impact of human-centered design. Des. Stud. 2017, 53, 1–23. [Google Scholar] [CrossRef] [Green Version]
- Hartson, R.; Pyla, P.S. The UX Book: Process and Guidelines for Ensuring a Quality User Experience; Elsevier: Amsterdam, The Netherlands, 2012. [Google Scholar]
- de Guinea, A.O.; Titah, R.; Léger, P.M. Explicit and implicit antecedents of users’ behavioral beliefs in information systems: A neuropsychological investigation. J. Manag. Inf. Syst. 2014, 30, 179–210. [Google Scholar] [CrossRef]
- Bargas-Avila, J.A.; Hornbæk, K. Old wine in new bottles or novel challenges: A critical analysis of empirical studies of user experience. In Proceedings of the SIGCHI Conference on Human Factors in Computing Systems, Vancouver, BC, Canada, 7–12 May 2011; ACM: New York, NY, USA, 2011; pp. 2689–2698. [Google Scholar]
- Lim, V.; Niforatos, E.; Alves, R.; Chen, M.; Karapanos, E.; Nunes, N.J. Exploring the use of EEG and Eye Tracking in Understanding Customer Experiences for Service Design. In Proceedings of the APCHI 2012, Matsue, Japan, 28–31 August 2012. [Google Scholar]
- Alves, R.; Lim, V.; Niforatos, E.; Chen, M.; Karapanos, E.; Nunes, N.J. Augmenting Customer Journey Maps with quantitative empirical data: A case on EEG and eye tracking. arXiv 2012, arXiv:1209.3155. [Google Scholar]
- Redström, J. Towards user design? On the shift from object to user as the subject of design. Des. Stud. 2006, 27, 123–139. [Google Scholar] [CrossRef]
- Hackos, J.T.; Redish, J. User and Task Analysis for Interface Design; Wiley: New York, NY, USA, 1998; p. 479. [Google Scholar]
- Margolin, V. Getting to know the user. Des. Stud. 1997, 18, 227–236. [Google Scholar] [CrossRef]
- Pucillo, F.; Cascini, G. A framework for user experience, needs and affordances. Des. Stud. 2014, 35, 160–179. [Google Scholar] [CrossRef]
- Wilson, T.D.; Lindsey, S.; Schooler, T.Y. A model of dual attitudes. Psychol. Rev. 2000, 107, 101–126. [Google Scholar] [CrossRef] [Green Version]
- Rydell, R.J.; McConnell, A.R. Understanding implicit and explicit attitude change: A systems of reasoning analysis. J. Personal. Soc. Psychol. 2006, 91, 995. [Google Scholar] [CrossRef] [Green Version]
- Strack, F.; Deutsch, R. Reflective and impulsive determinants of social behavior. Personal. Soc. Psychol. Rev. 2004, 8, 220–247. [Google Scholar] [CrossRef] [Green Version]
- Gawronski, B.; LeBel, E.P. Understanding patterns of attitude change: When implicit measures show change, but explicit measures do not. J. Exp. Soc. Psychol. 2008, 44, 1355–1361. [Google Scholar] [CrossRef]
- Fazio, R.H.; Olson, M.A. Implicit measures in social cognition research: Their meaning and uses. Annu. Rev. Psychol. 2003, 54, 297–327. [Google Scholar] [CrossRef] [PubMed]
- Norman, D.A. The research-Practice Gap: The need for translational developers. Interactions 2010, 17, 9–12. [Google Scholar] [CrossRef]
- Roto, V.; Obrist, M.; Väänänen-Vainio-Mattila, K. User experience evaluation methods in academic and industrial contexts. In Proceedings of the Workshop UXEM sessions in CHI’08, Florence, Italy, 6 April 2008. [Google Scholar]
- Floyd, I.R.; Cameron Jones, M.; Twidale, M.B. Resolving incommensurable debates: A preliminary identification of persona kinds, attributes, and characteristics. Artifact 2008, 2, 12–26. [Google Scholar] [CrossRef] [Green Version]
- Pruitt, J.; Adlin, T. The Persona Lifecycle: Keeping People in Mind throughout Product Design; Elsevier: Amsterdam, The Netherlands, 2010. [Google Scholar]
- Miaskiewicz, T.; Kozar, K.A. Personas and user-centered design: How can personas benefit product design processes? Des. Stud. 2011, 32, 417–430. [Google Scholar] [CrossRef]
- Cooper, A. The Inmates Are Running the Asylum. In Why High-Tech Products Drive Us Crazy and How to Restore the Sanity; Sams: Indianapolis, IN, USA, 1999; Volume 261. [Google Scholar]
- Manning, H.; Temkin, B.; Belanger, N. The power of design personas. Camb. MA Forrester Res. 2003, 43. [Google Scholar]
- Frissen, V. De Domesticatie van de Digitale Wereld. In Proceedings of the ICT en sociale verandering, Erasmus Universiteit, Rotterdam, The Netherlands, 25 June 2004. [Google Scholar]
- Verganti, R. Design Driven Innovation: Changing the Rules of Competition by Radically Innovating What Things Mean; Harvard Business Press: Boston, MA, USA, 2009. [Google Scholar]
- Rönkkö, K.; Hellman, M.; Kilander, B.; Dittrich, Y. Personas is not applicable: Local remedies interpreted in a wider context. In Artful Integration: Interweaving Media, Materials and Practices-Volume 1, Proceedings of the Eighth Conference on Participatory Design, Toronto, ON, Canada, 27–31 July 2004; ACM: New York, NY, USA, 2004; pp. 112–120. [Google Scholar]
- Jacobs, A.; Dreessen, K.; Pierson, J. ‘Thick’personas–Using ethnographic Methods for Persona Development as a Tool for Conveying the Social Science View in Technological Design. Observatorio OBS 2008, 2, 2. [Google Scholar]
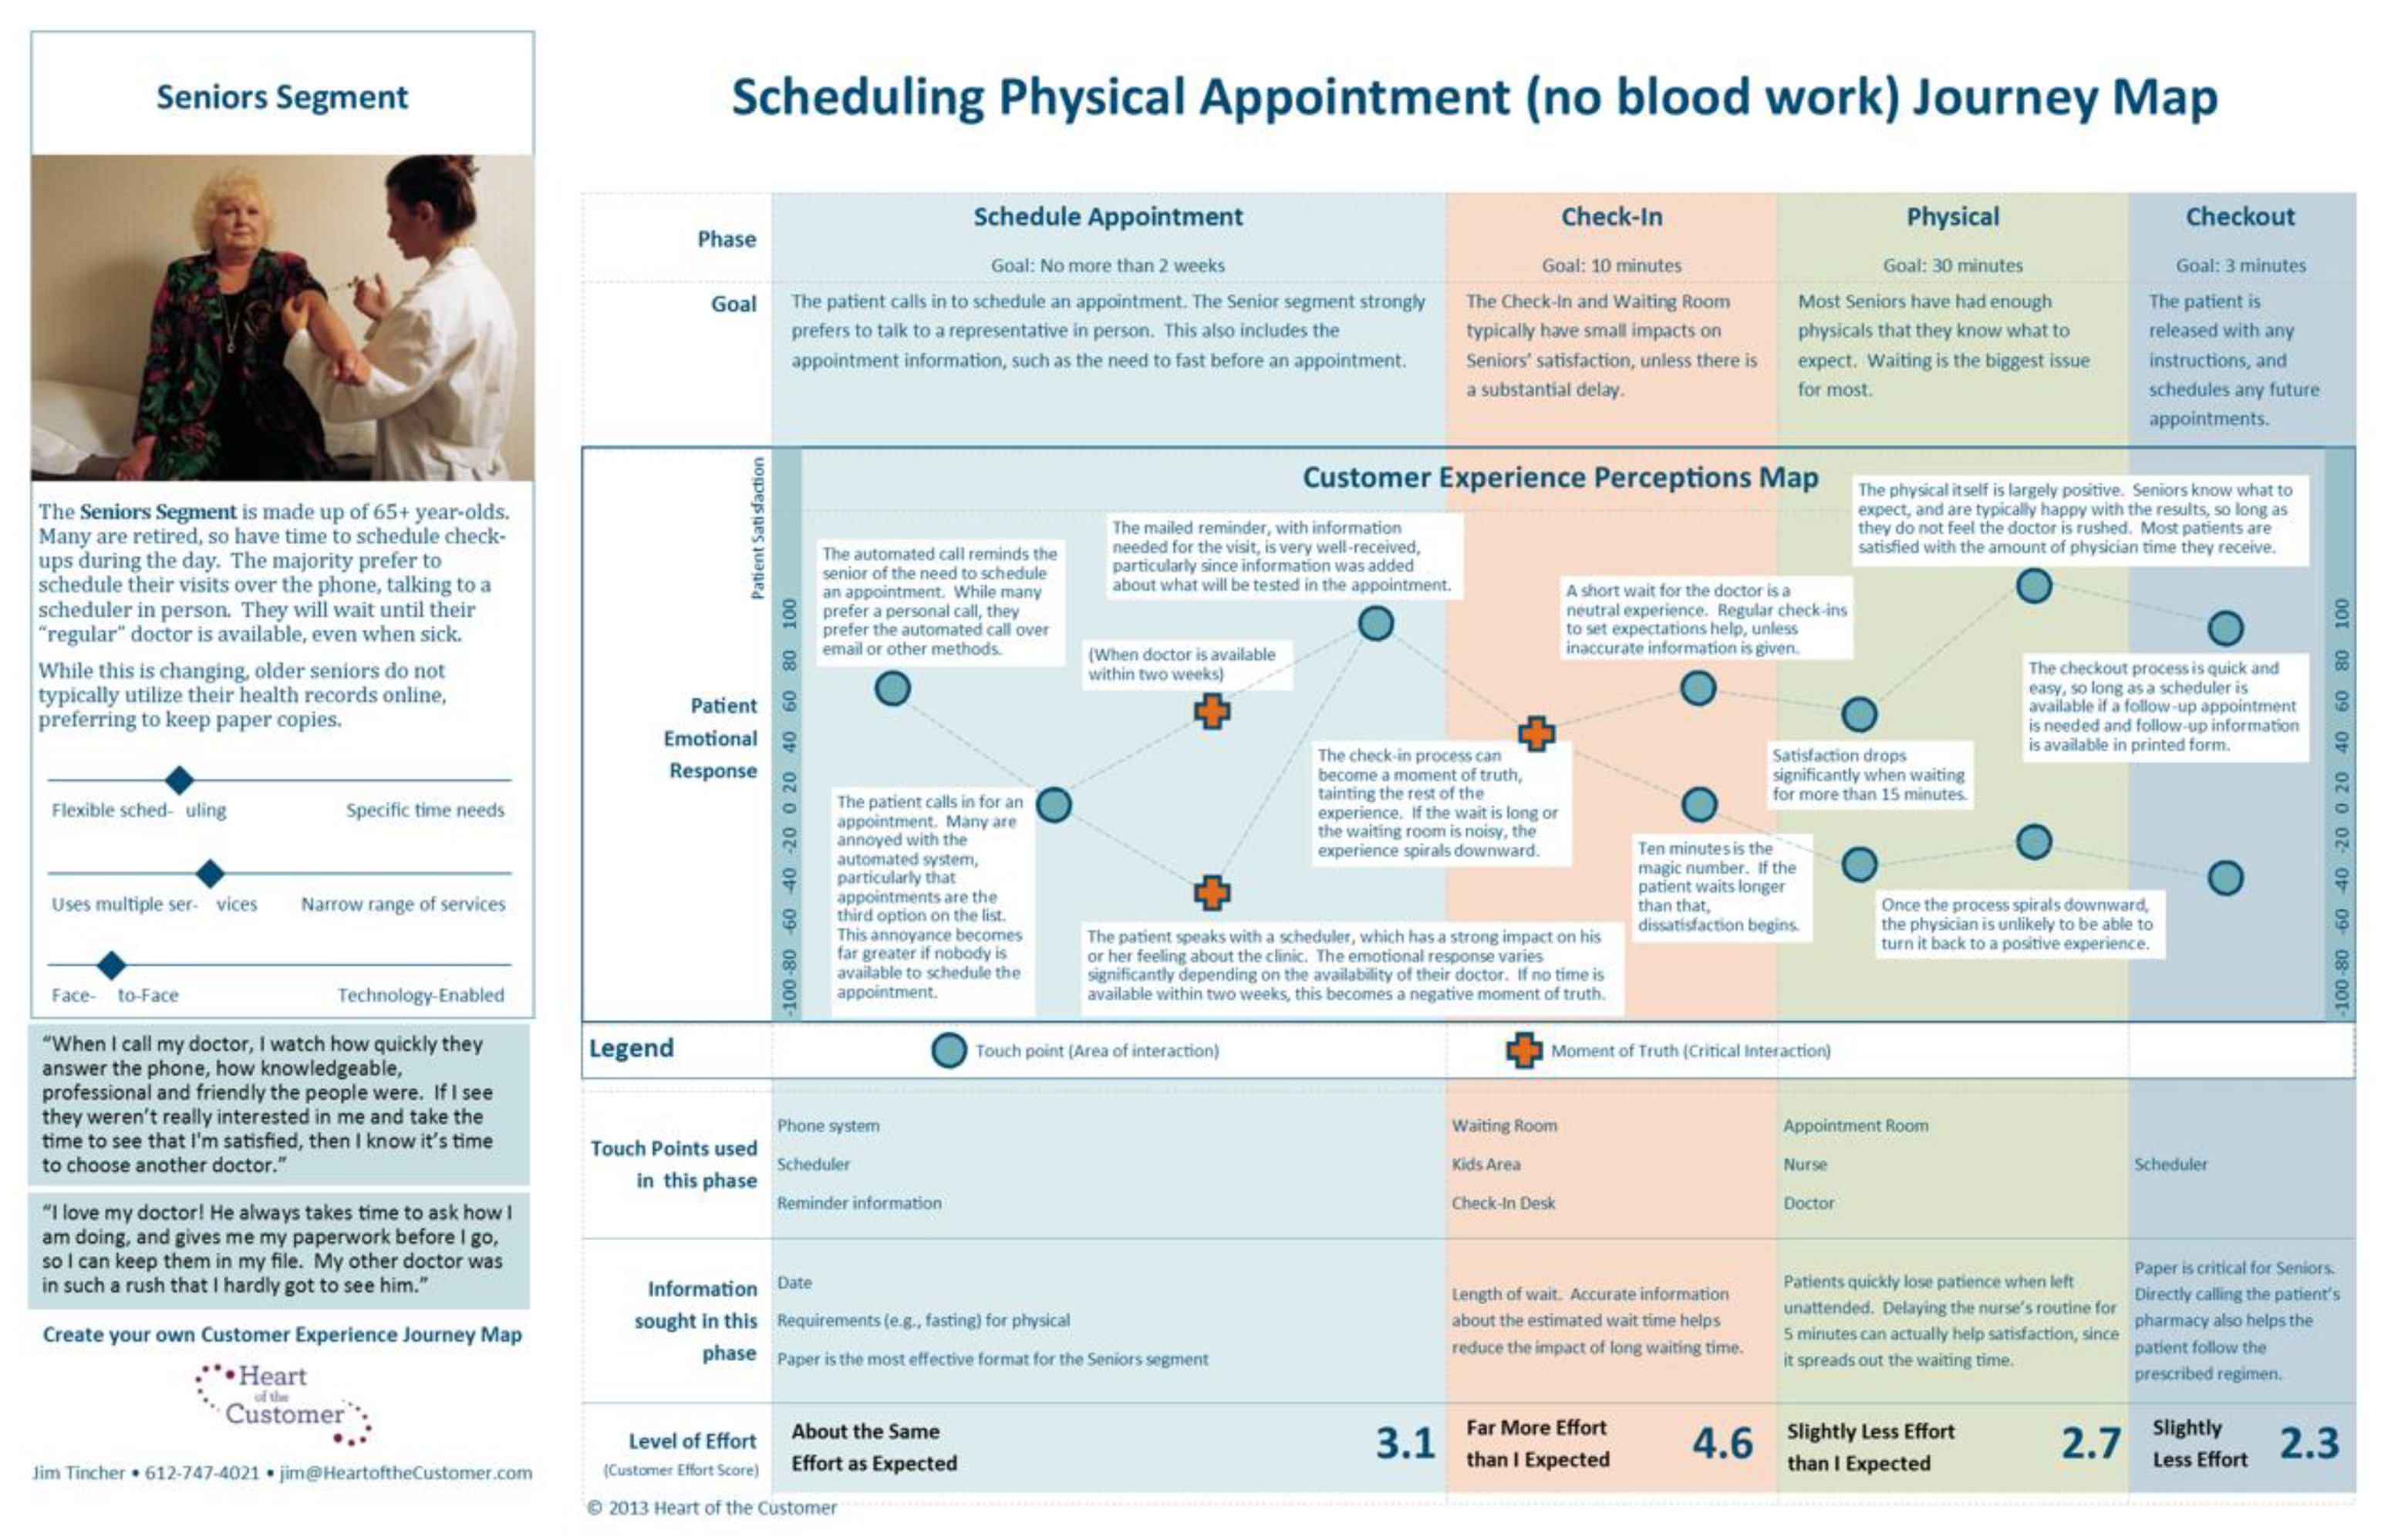
- Rosenbaum, M.S.; Otalora, M.L.; Ramírez, G.C. How to create a realistic customer journey map. Bus. Horiz. 2017, 60, 143–150. [Google Scholar] [CrossRef]
- Canfield, D.D.S.; Basso, K. Integrating Satisfaction and Cultural Background in the Customer Journey: A Method Development and Test. J. Int. Consum. Mark. 2017, 29, 104–117. [Google Scholar] [CrossRef]
- Tincher, J. Creating a Customer-Focused Customer Experience Journey Map; Heart of the Customer: Minneapolis, MN, USA, 2013. [Google Scholar]
- Verhoef, P.C.; Reinartz, W.J.; Krafft, M. Customer engagement as a new perspective in customer management. J. Serv. Res. 2010, 13, 247–252. [Google Scholar] [CrossRef]
- Meyer, C.; Schwager, A. Understanding customer experience. Harv. Bus. Rev. 2007, 85, 116. [Google Scholar]
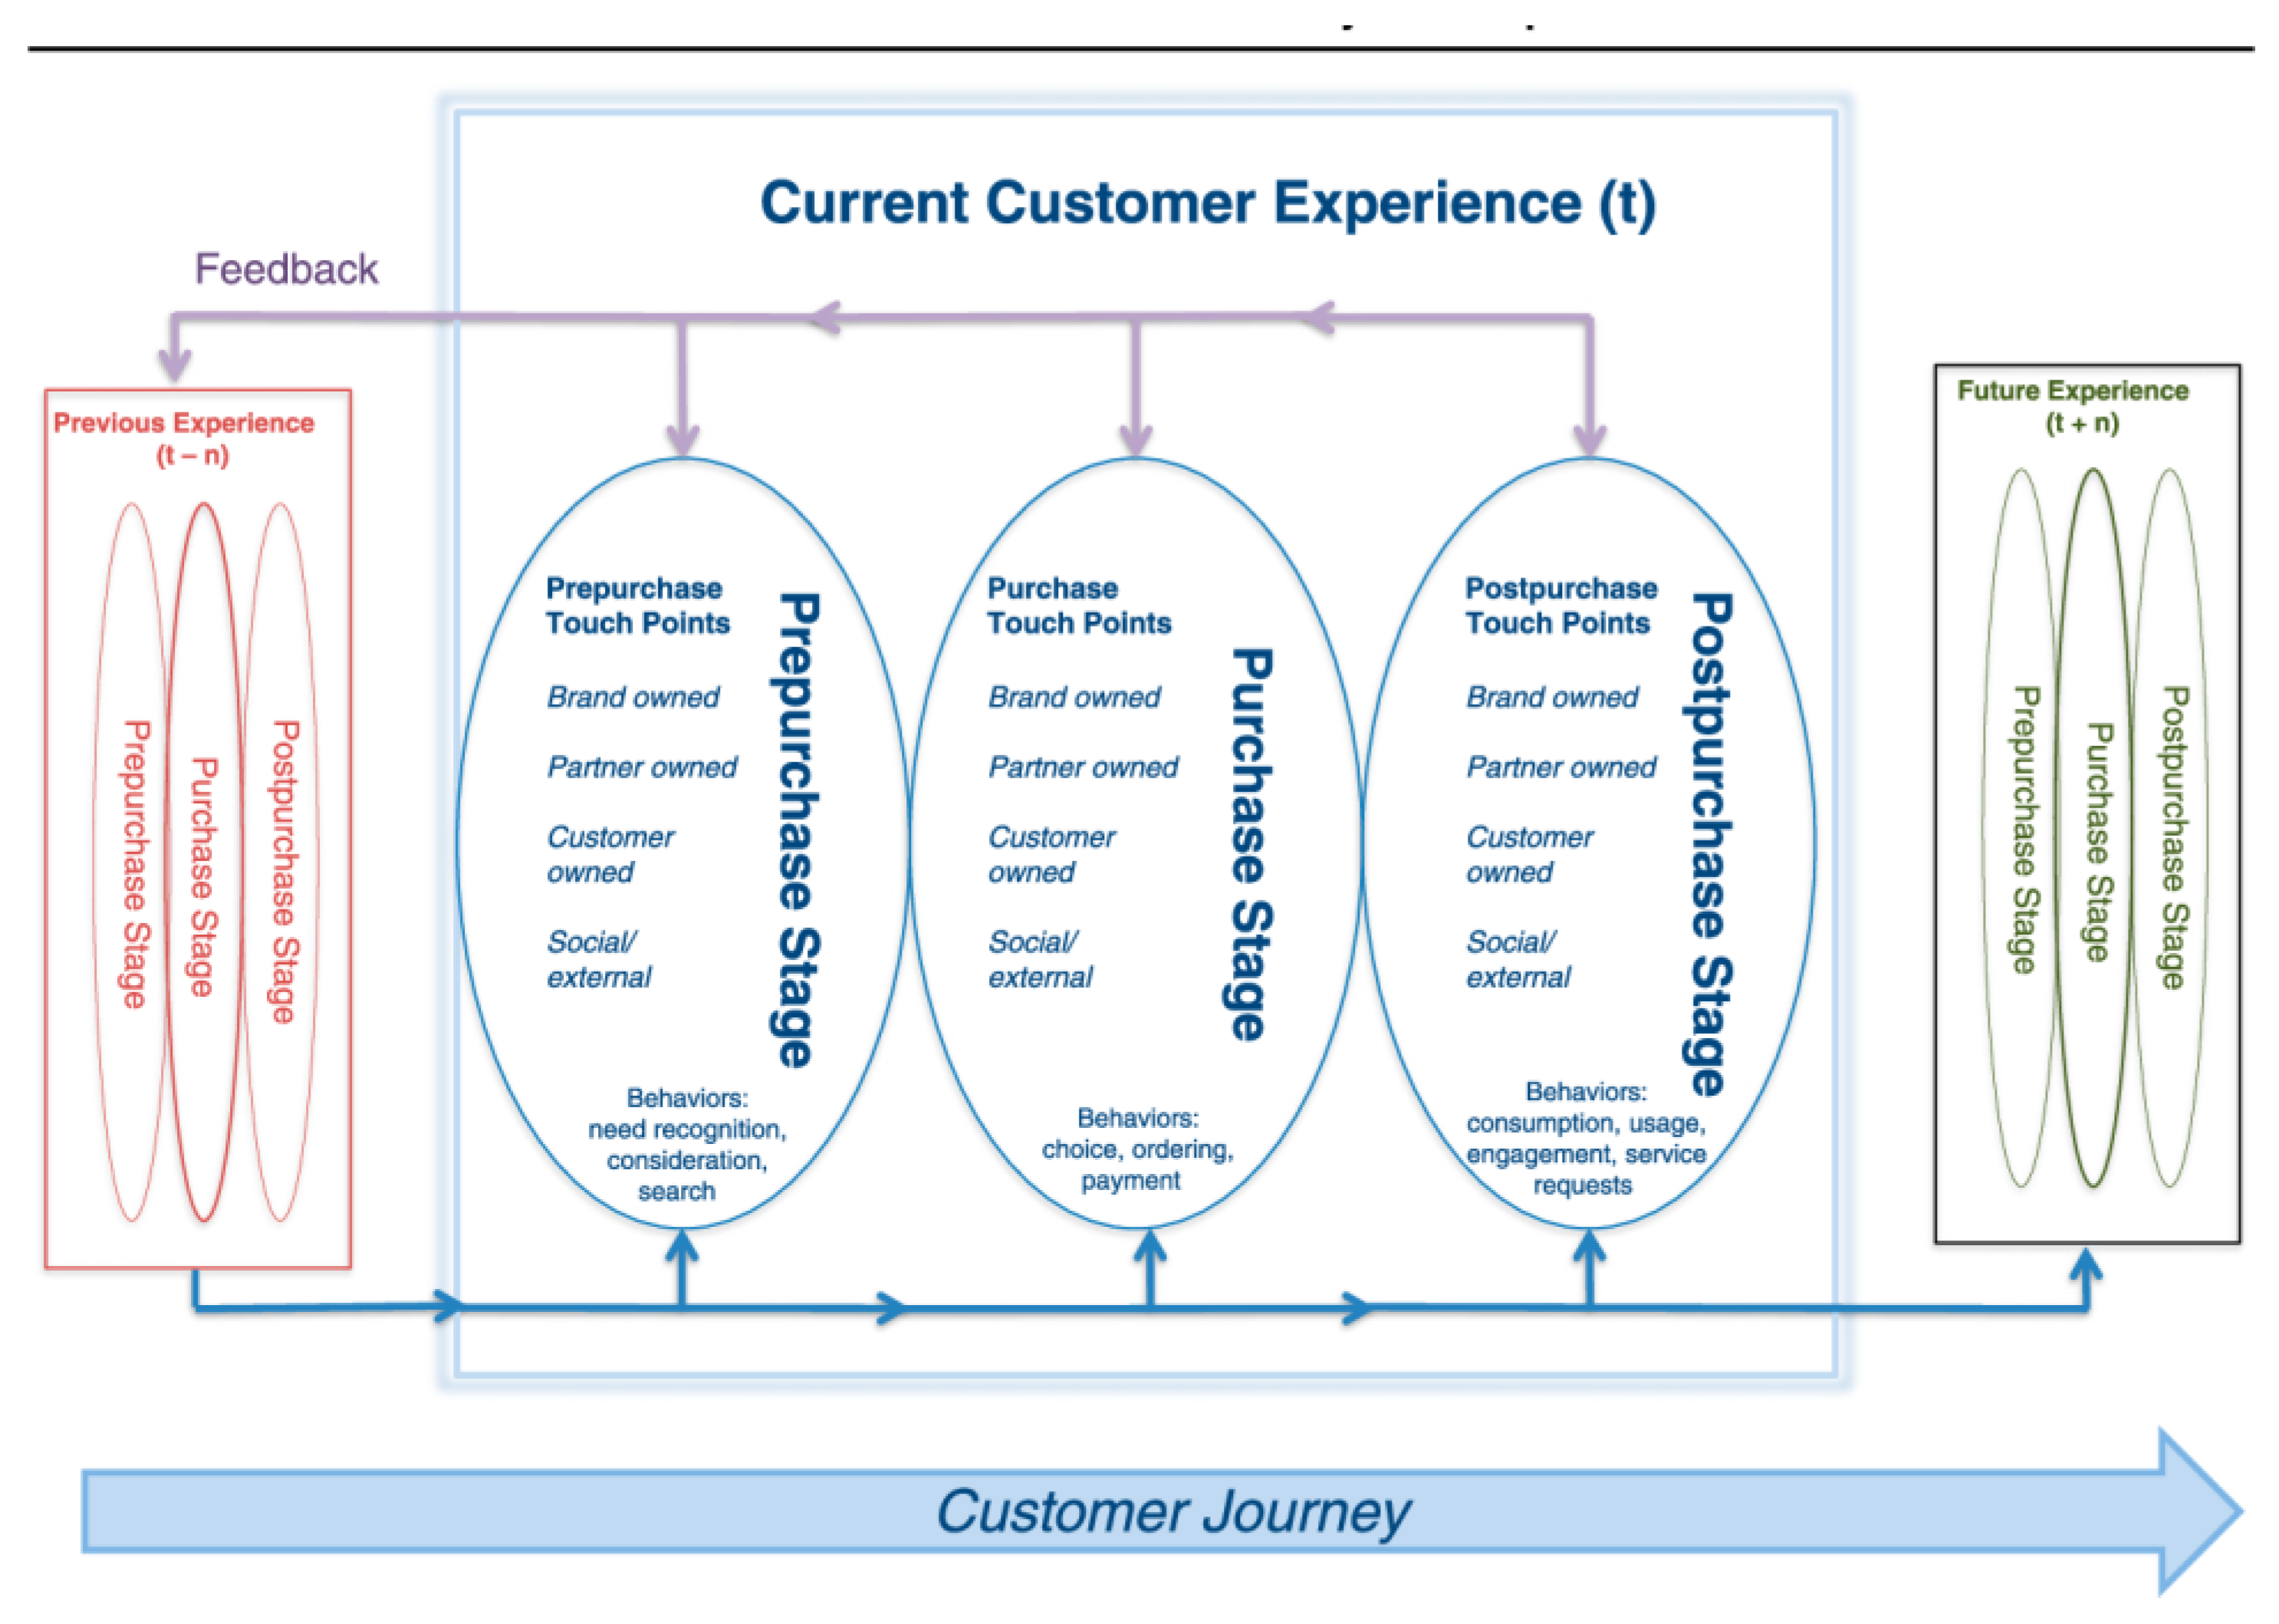
- Nenonen, S.; Rasila, H.; Junnonen, J.M.; Kärnä, S. Customer Journey—A method to investigate user experience. In Proceedings of the Euro FM Conference, Manchester, UK, 10–11 June 2008; pp. 54–63. [Google Scholar]
- Rawson, A.; Duncan, E.; Jones, C. The truth about customer experience. Harv. Bus. Rev. 2013, 91, 90–98. [Google Scholar]
- Moon, H.; Han, S.H.; Chun, J.; Hong, S.W. A design process for a customer journey map: A case study on mobile services. Hum. Factors Ergon. Manuf. Serv. Ind. 2016, 26, 501–514. [Google Scholar] [CrossRef]
- Parker, S.; Heapy, J. The journey to the interface. Lond. Demos. Available online: http://www.ngs.ufsc.br/wp-content/uploads/2010/09/TheJourneytotheInterface.pdf (accessed on 25 May 2020).
- Halvorsrud, R.; Kvale, K.; Følstad, A. Improving service quality through customer journey analysis. J. Serv. Theory Pract. 2016, 26, 840–867. [Google Scholar] [CrossRef]
- Lemon, K.N.; Verhoef, P.C. Understanding customer experience throughout the customer journey. J. Mark. 2016, 80, 69–96. [Google Scholar] [CrossRef]
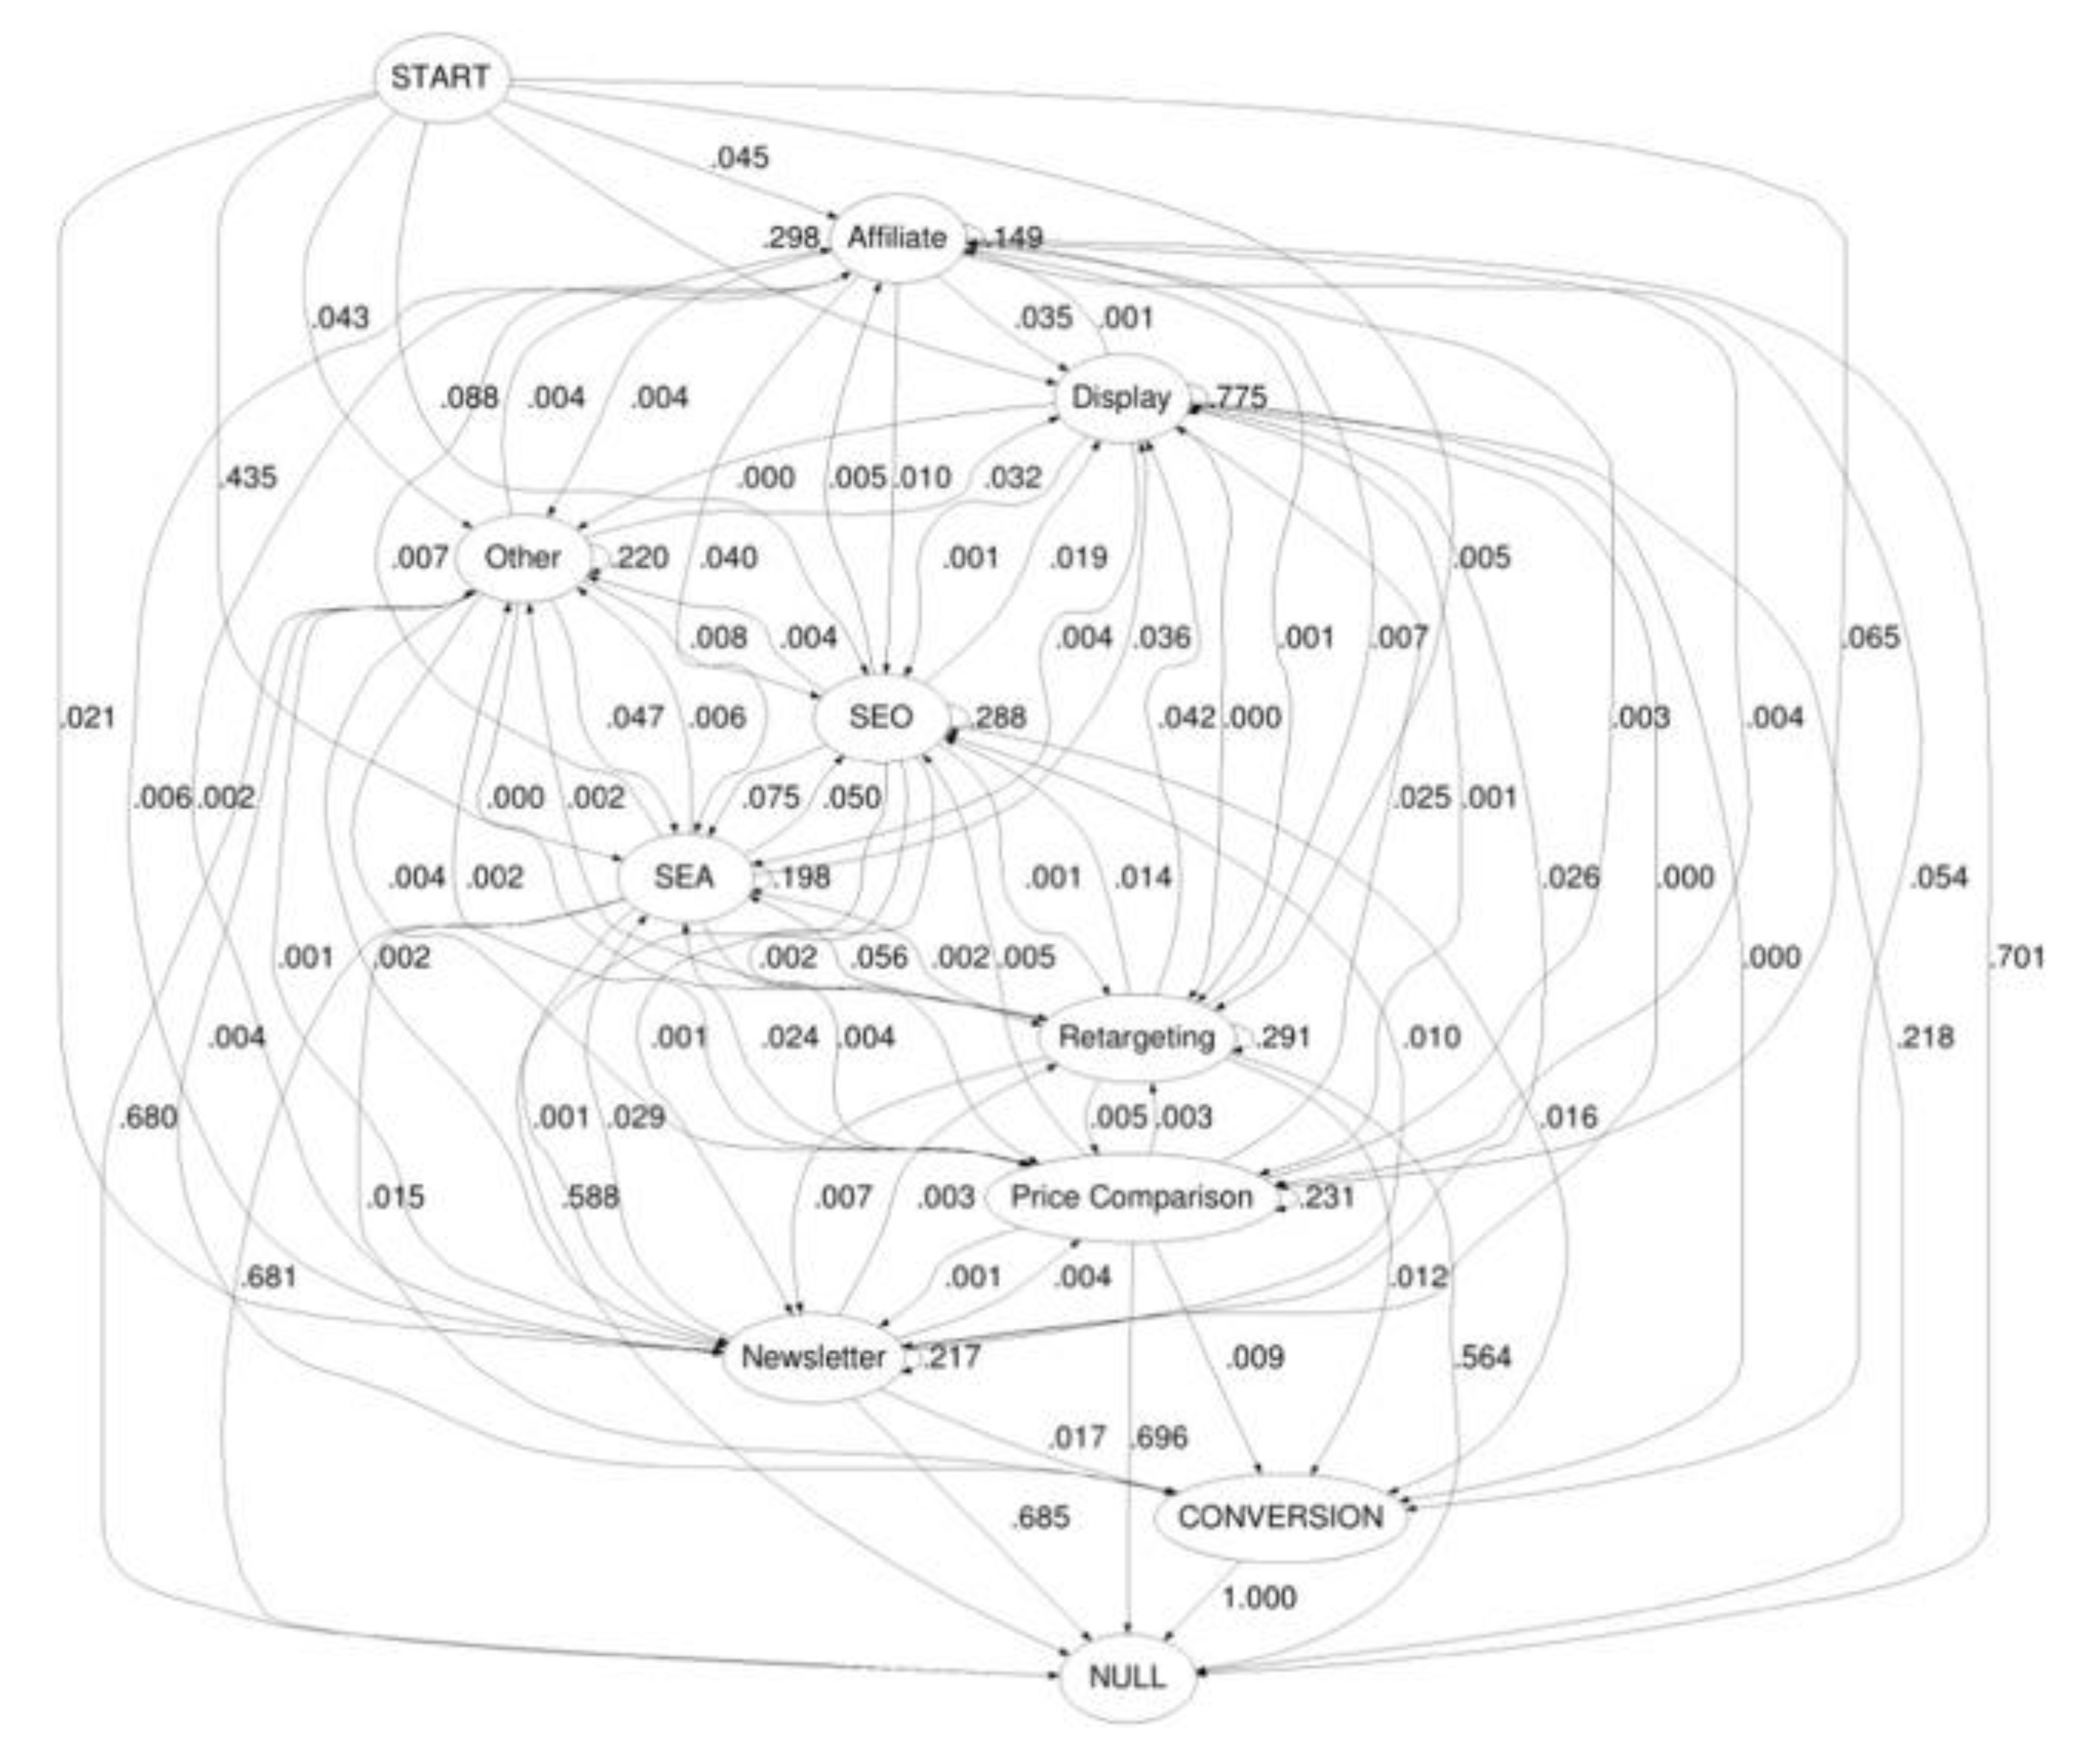
- Anderl, E.; Becker, I.; Von Wangenheim, F.; Schumann, J.H. Mapping the customer journey: Lessons learned from graph-based online attribution modeling. Int. J. Res. Mark. 2016, 33, 457–474. [Google Scholar] [CrossRef]
- Léger, P.-M.; Davis, F.D.; Cronan, T.P.; Perret, J. Neurophysiological correlates of cognitive absorption in an enactive training context. Comput. Hum. Behav. 2014, 34, 273–283. [Google Scholar] [CrossRef]
- Léger, P.-M.; Sénécal, S.; Courtemanche, F.; de Guinea, A.O.; Titah, R.; Fredette, M.; Labonté-LeMoyne, E. Precision is in the eye of the beholder: Application of eye fixation-related potentials to information systems research. J. Assoc. Inf. Syst. 2014, 15, 651. [Google Scholar] [CrossRef]
- Pope, A.T.; Bogart, E.H.; Bartolome, D.S. Biocybernetic system evaluates indices of operator engage-ment in automated task. Biol. Psychol. 1995, 40, 187–195. [Google Scholar] [CrossRef]
- Bandura, A. Self-efficacy: Toward a unifying theory of behavioral change. Psychol. Rev. 1977, 84, 191. [Google Scholar] [CrossRef]
- Davidson, R.J. EEG measures of cerebral asymmetry: Conceptual and methodological issues. Intern. J. Neurosci. 1988, 39, 71–89. [Google Scholar] [CrossRef]
- Riedl, R.; Léger, P.M. Tools in NeuroIS research: An overview. In Fundamentals of NeuroIS; Springer: Berlin/Heidelberg, Germany, 2016; pp. 47–72. [Google Scholar]
- Davidson, R.J. Prolegomenon to the structure of emotion: Gleanings from neuropsychology. Cognit. Emot. 1992, 6, 245–268. [Google Scholar] [CrossRef]
- Boucsein, W. Electrodermal Activity; Springer Science & Business Media: Berlin, Germany, 2012; p. 603. [Google Scholar]
- Goodwin, K. Designing for the Digital Age: How to Create Human-Centered Products and Services; John Wiley & Sons: Hoboken, NJ, USA, 2011; p. 710. [Google Scholar]
- Montero, P.; Vilar, J.A. TSclust: An R package for time series clustering. J. Stat. Softw. 2014, 62, 1–43. [Google Scholar] [CrossRef] [Green Version]
- Howard, N.; Harris, B. A Hierarchical Grouping Routine, IBM 360/65 FORTRAN IV Program; University of Pennsylvania Computer Center: Philadelphia, PA, USA, 1996. [Google Scholar]
- Maunier, B.; Alvarez, J.; Léger, P.M.; Sénécal, S.; Labonté-LeMoyne, É.; Chen, S.L.; Lachize, S.; Gagné, J. Keep calm and read the instructions: Factors for successful user equipment setup. In Proceedings of the International Conference on HCI in Business, Government, and Organizations, Las Vegas, NV, USA, 15 July 2018; Springer: Cham, Switzerland; pp. 372–381. [Google Scholar]


| Measures | Instruments | Advantages | Disadvantages and Limitations | Questions Answered about the User’s Experience | |
|---|---|---|---|---|---|
| Explicit data | Perceptual measures and Self-reported measures | Survey Interview Focus group | Easy to collect Summarize great amount of user’s experience information | Biases: The human tendency of socially desirable responding users’ past experiences Overall perception versus precision Self perceived scale | Why |
| Implicit data | Neurophysiological responses | Examples: Electro dermal sensors Electroencephalographic cask Micro facial recognition camera and software Eye tracking | Detailed lived experience in a timeline Baseline when calibrating the tools to be as objective as possible | Need instrumentation Costly Need of specific expertise to collect, postprocess and analyze the data | When What How |
| Observational data | Performance indicators | Examples: Camera Clickstream | Report all actions taken by the user and contextual factors | Limited in terms of understanding the user’s emotional and cognitive state | Where How |
| Persona | Customer Journey Map | |
|---|---|---|
| Orientation | Goal oriented | Task oriented |
| Presentation | Mostly narrative | Keywords Timeline |
| Design process step | Conceptualization | Validation |
| Common used instruments for data collection | -Surveys -Interviews -Group discussions | -Monitoring -Observation -Surveys -Interviews -Focus groups |
| Common used data analysis methodology | Verbatim | Touch points Statistics with satisfaction scales |
| Advantages | -Avoid self-perceived user by challenging assumptions -Understanding intentions and context of human actions -Prioritization of system requirements helping the design decision making -Require empathy for the user | -Having a global idea of the sequence of actions the user does through a timeline -Understanding intentions and context of human actions -Making a parallel in between the touchpoints and the user’s needs and satisfaction levels |
| Limitations | -No implicit user information -Narrative with too much details | -No implicit user information -Lack of narrative details about user’s needs and expectations, goals and skills |
| Instruments | Purpose | Analytical Program Used | Authors | |
|---|---|---|---|---|
| Implicit Data | EEG_ Brainvision Electroencephalographic cask EDA_BIOPAC Electrodermal sensors | Measures user’s cognitive engagement Measures user’s valence Measures user’s electrodermal activity | NeuroRT Mensia Acqknowledge | Pope et al., 1995 [42]; Davidson, 1992 [46]; Boucsein, 2012 [47] |
| Explicit Data | Surveys_pre and post experience Interviews_pre and post experience | Measures user’s self-efficacy (concerning the self-reported motivation and capacity) Open question to better understand user’s knowledge and expectations | Qualtrics Optimal workshop | Bandura, 1977 [43]; Goodwin, 2011 [48] |
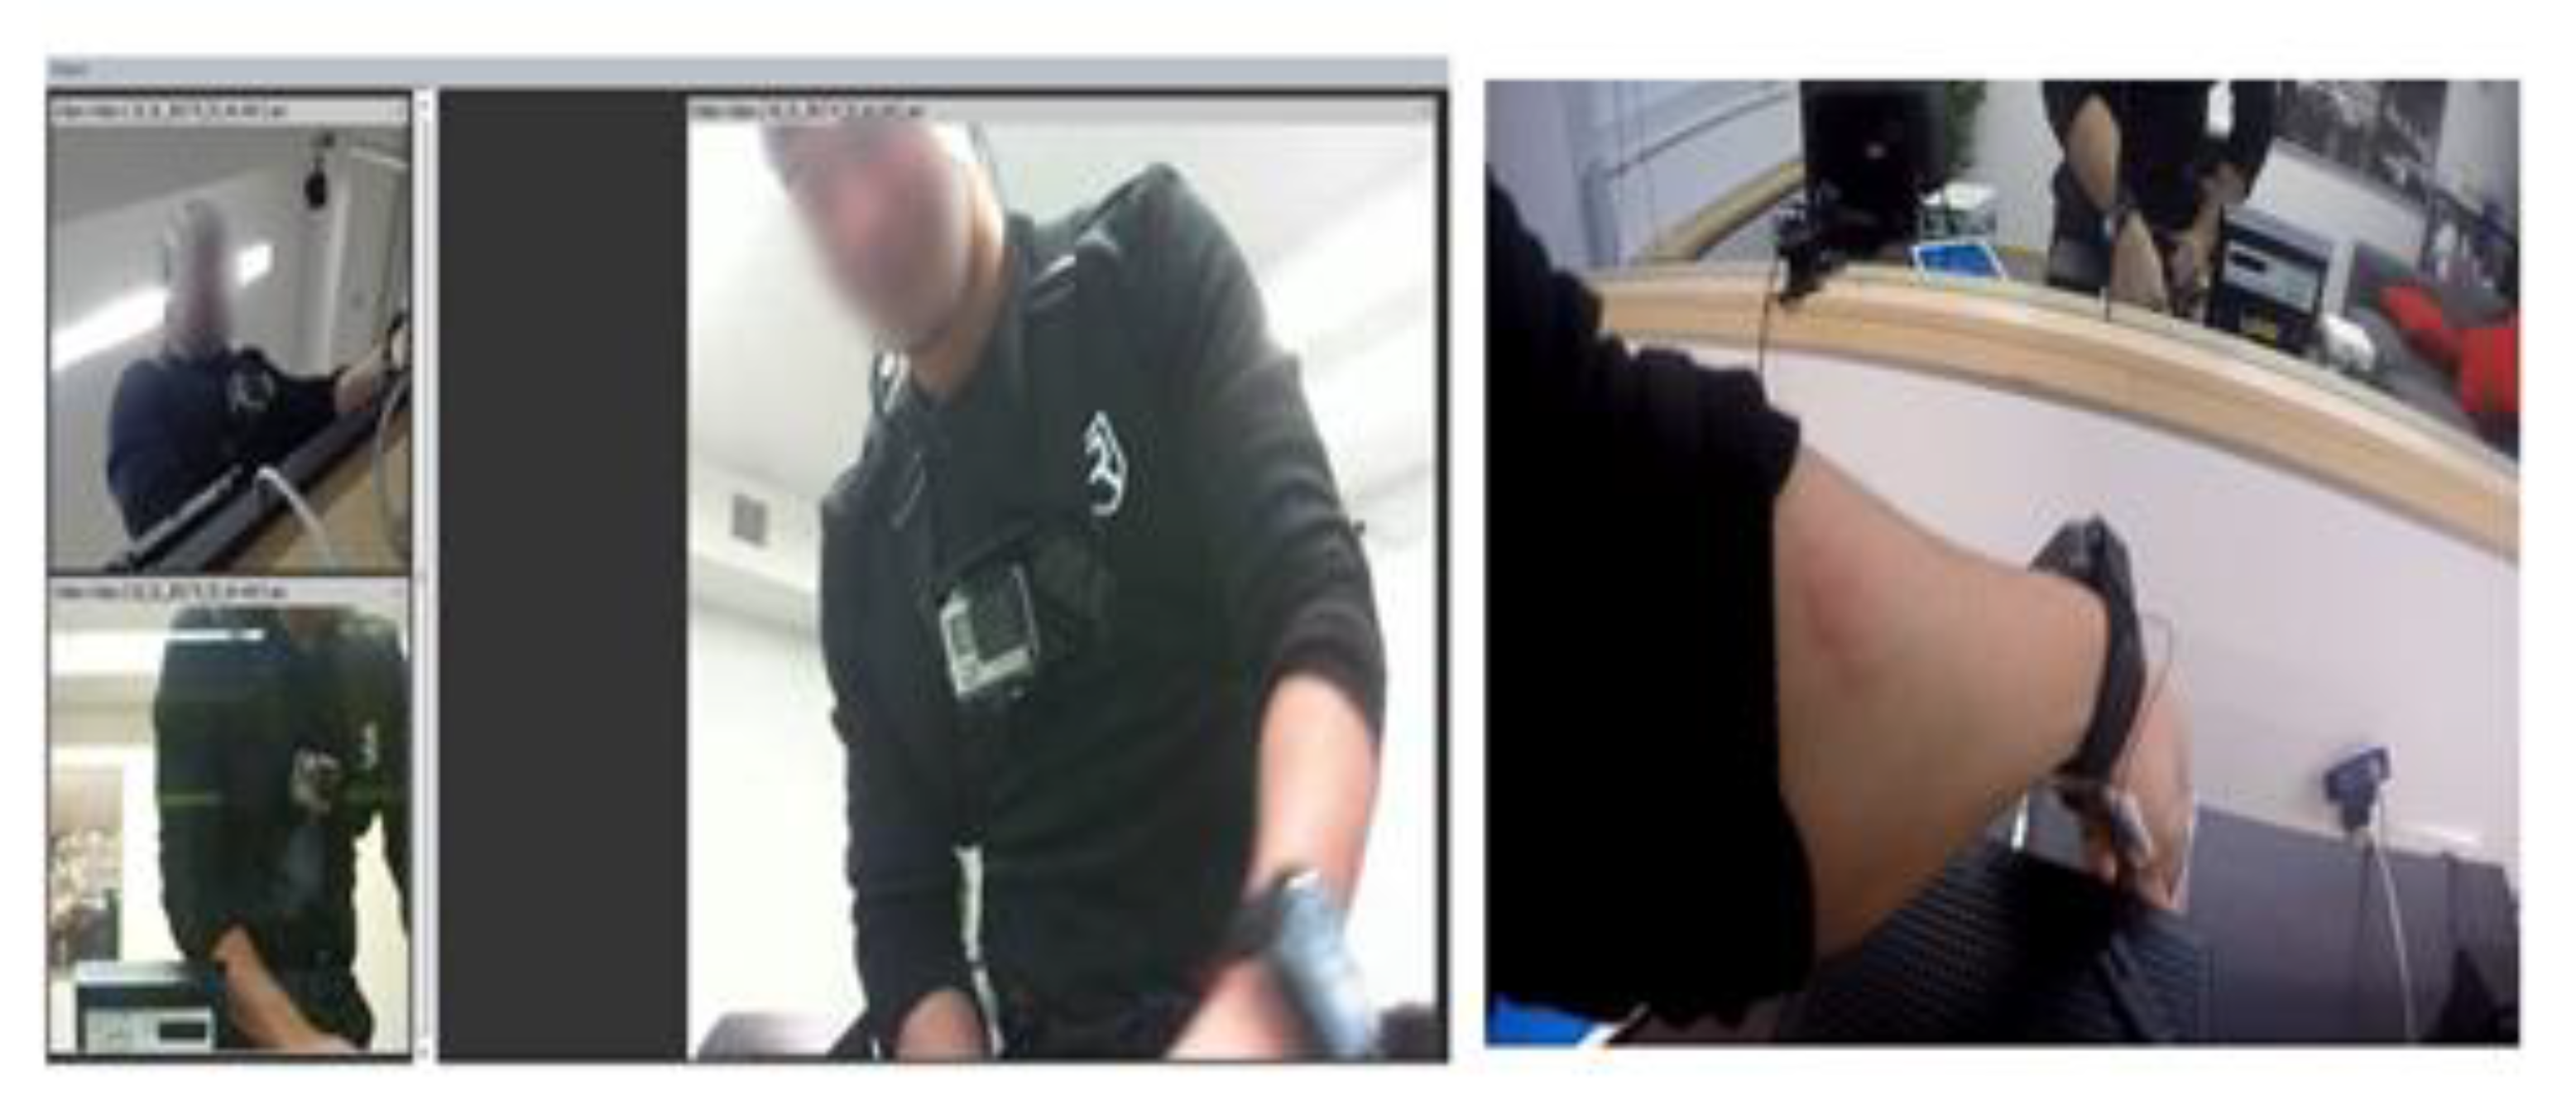
| Observational Data | 4 cameras (3 static and 1 Go Pro) | Identify user’s behaviors in their interaction with the system as well as their workflow Evaluate, with the help of pre-determined indicators, the user’s performance in succeeding or failing a specific task | Noldus Observer XT and Syncbox |
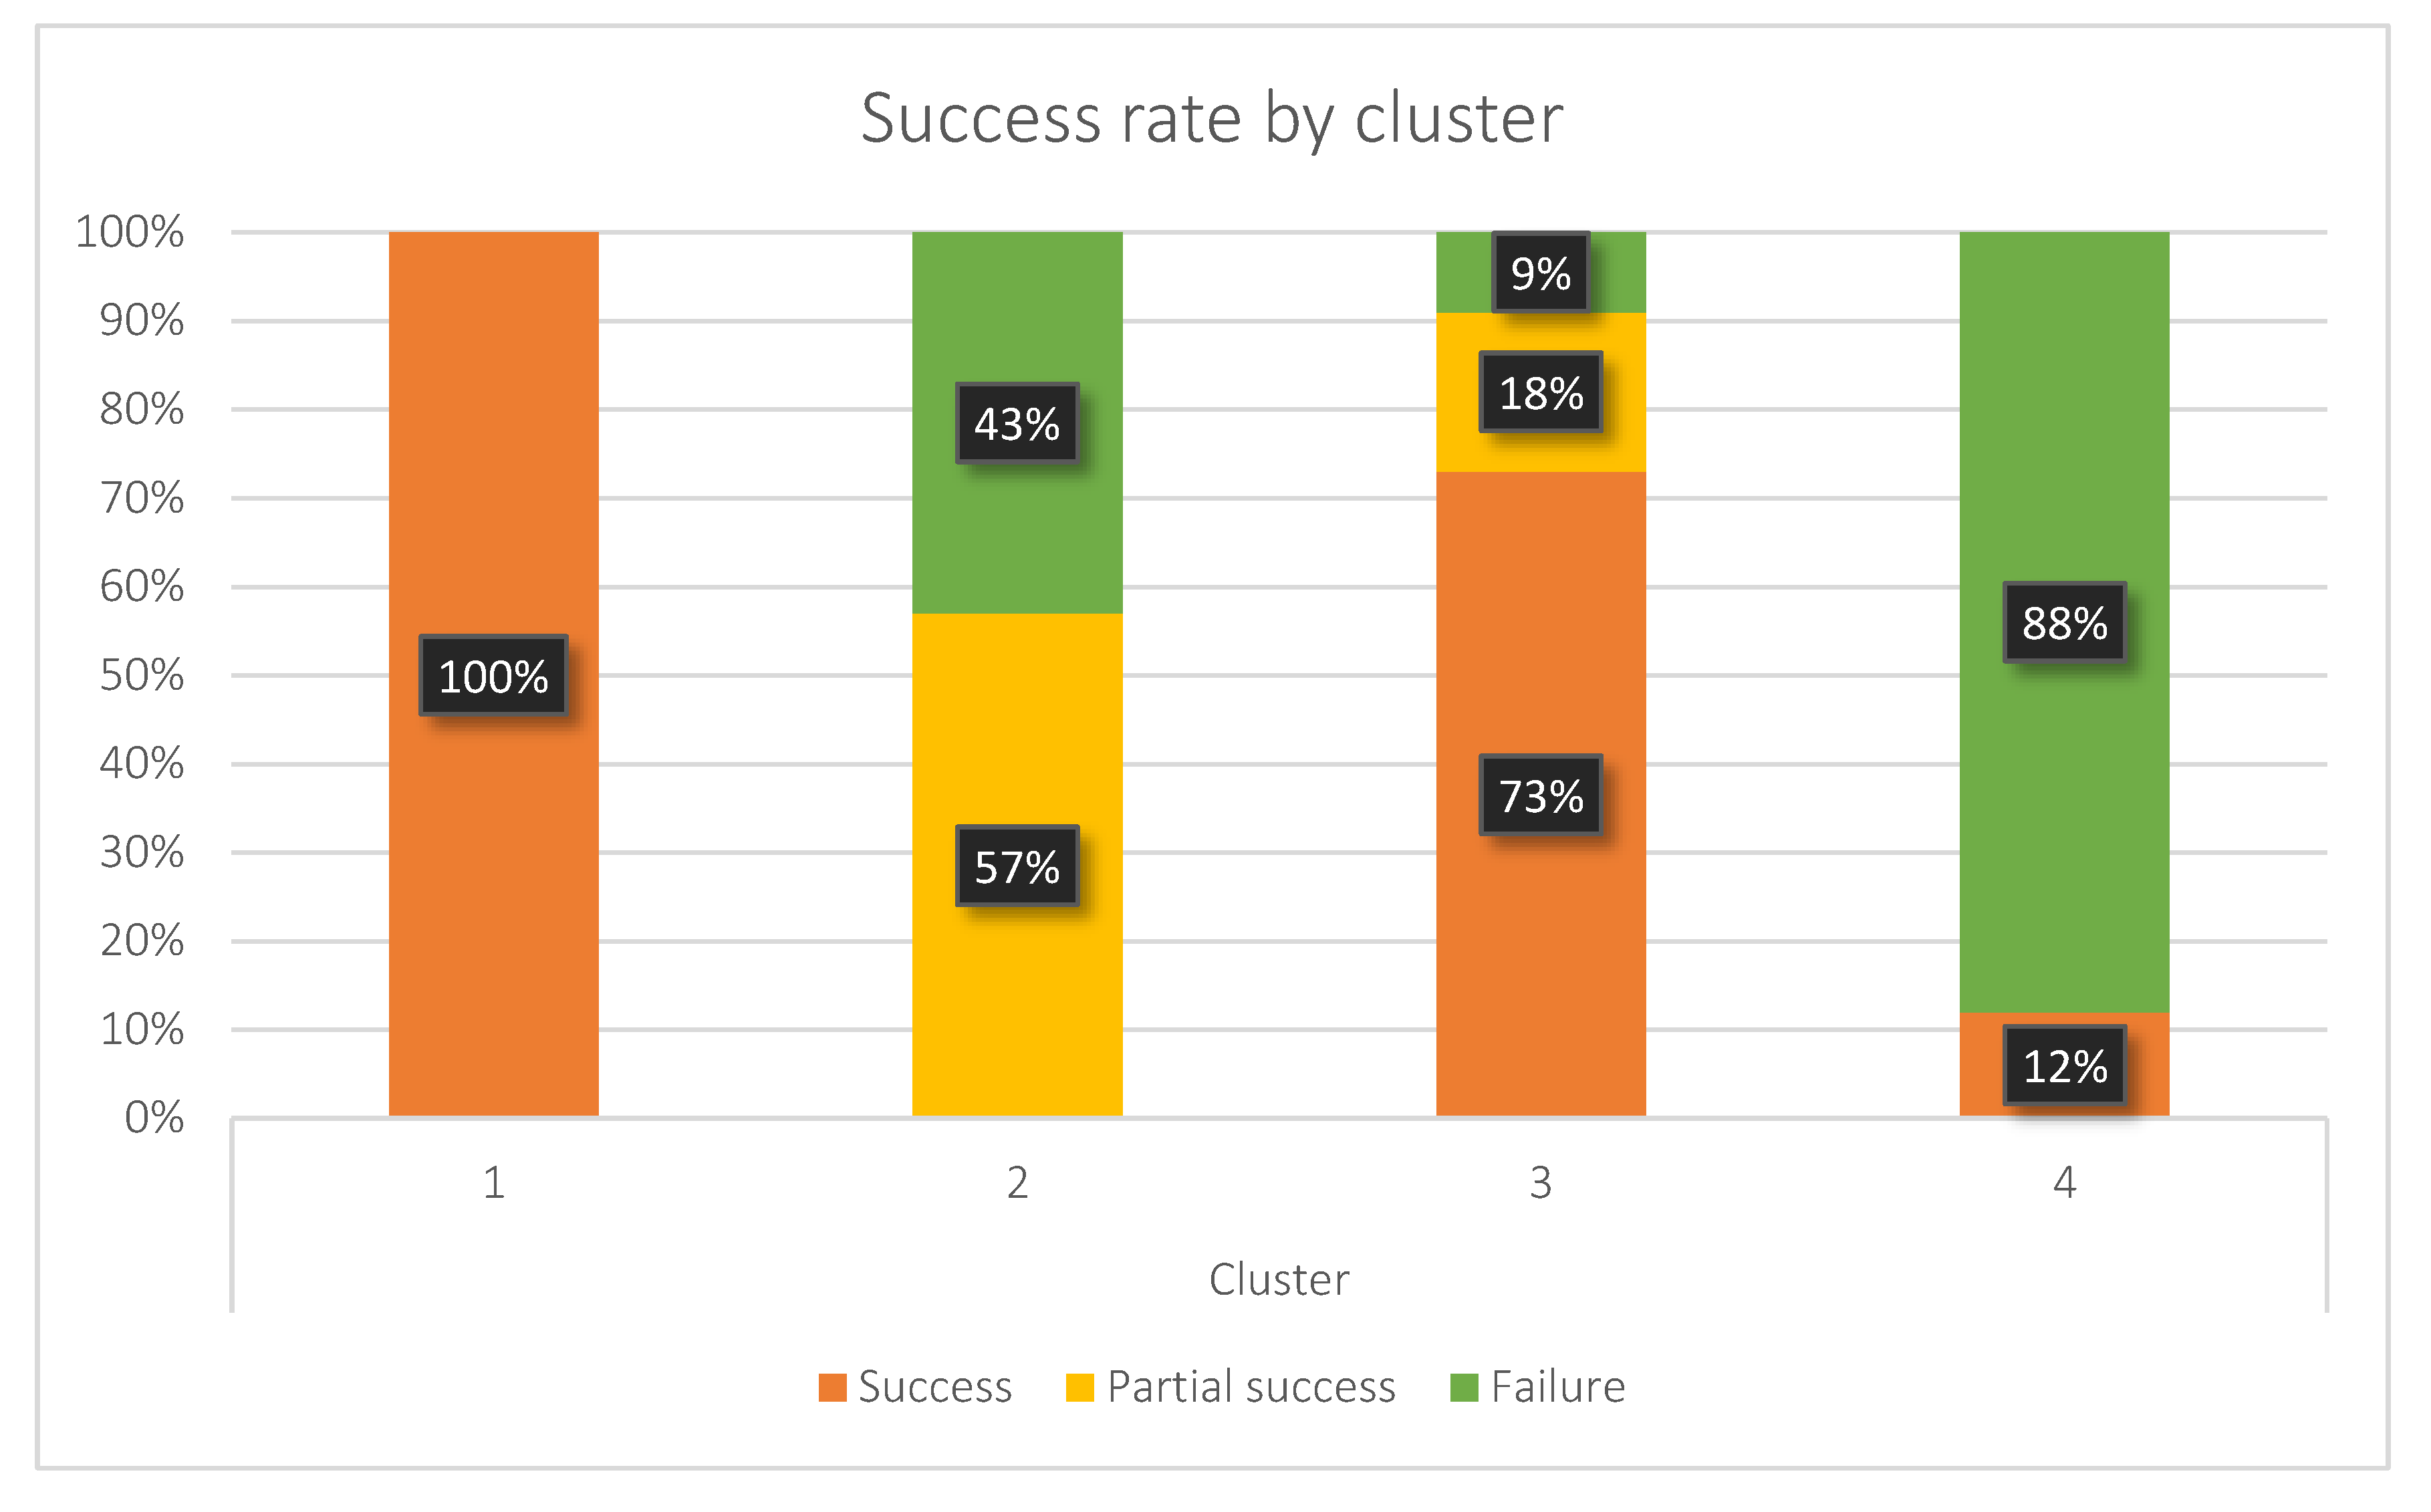
| Number of Participant | Success Rate | Self-Perceived Motivation (1-Low to 5-High) | Self-Perceived Capacity (1-Low to 5-High) | Electronic Knowledge Level (1-Novice to 5-Expert) | |
|---|---|---|---|---|---|
| Persona 1. The Clever | 3 | 100% succeeded | 2 | 2 | 2 |
| Persona 2. The Distraught | 7 | 57% succeeded partially 43% failed | 3 | 3 | 3 |
| Persona 3. The Applied | 11 | 73% succeeded 18% succeeded partially 9% failed | 1 | 2 | 2 |
| Persona 4. The Presumptuous | 8 | 12.5% succeeded 87.5% failed | 4 | 3 | 2 |
© 2020 by the authors. Licensee MDPI, Basel, Switzerland. This article is an open access article distributed under the terms and conditions of the Creative Commons Attribution (CC BY) license (http://creativecommons.org/licenses/by/4.0/).
Share and Cite
Alvarez, J.; Léger, P.-M.; Fredette, M.; Chen, S.-L.; Maunier, B.; Senecal, S. An Enriched Customer Journey Map: How to Construct and Visualize a Global Portrait of Both Lived and Perceived Users’ Experiences? Designs 2020, 4, 29. https://doi.org/10.3390/designs4030029
Alvarez J, Léger P-M, Fredette M, Chen S-L, Maunier B, Senecal S. An Enriched Customer Journey Map: How to Construct and Visualize a Global Portrait of Both Lived and Perceived Users’ Experiences? Designs. 2020; 4(3):29. https://doi.org/10.3390/designs4030029
Chicago/Turabian StyleAlvarez, Juliana, Pierre-Majorique Léger, Marc Fredette, Shang-Lin Chen, Benjamin Maunier, and Sylvain Senecal. 2020. "An Enriched Customer Journey Map: How to Construct and Visualize a Global Portrait of Both Lived and Perceived Users’ Experiences?" Designs 4, no. 3: 29. https://doi.org/10.3390/designs4030029