

Does Pool Performance of Elite Triathletes Predict Open-Water Performance?


Abstract
:1. Introduction
2. Materials and Methods
2.1. Participants
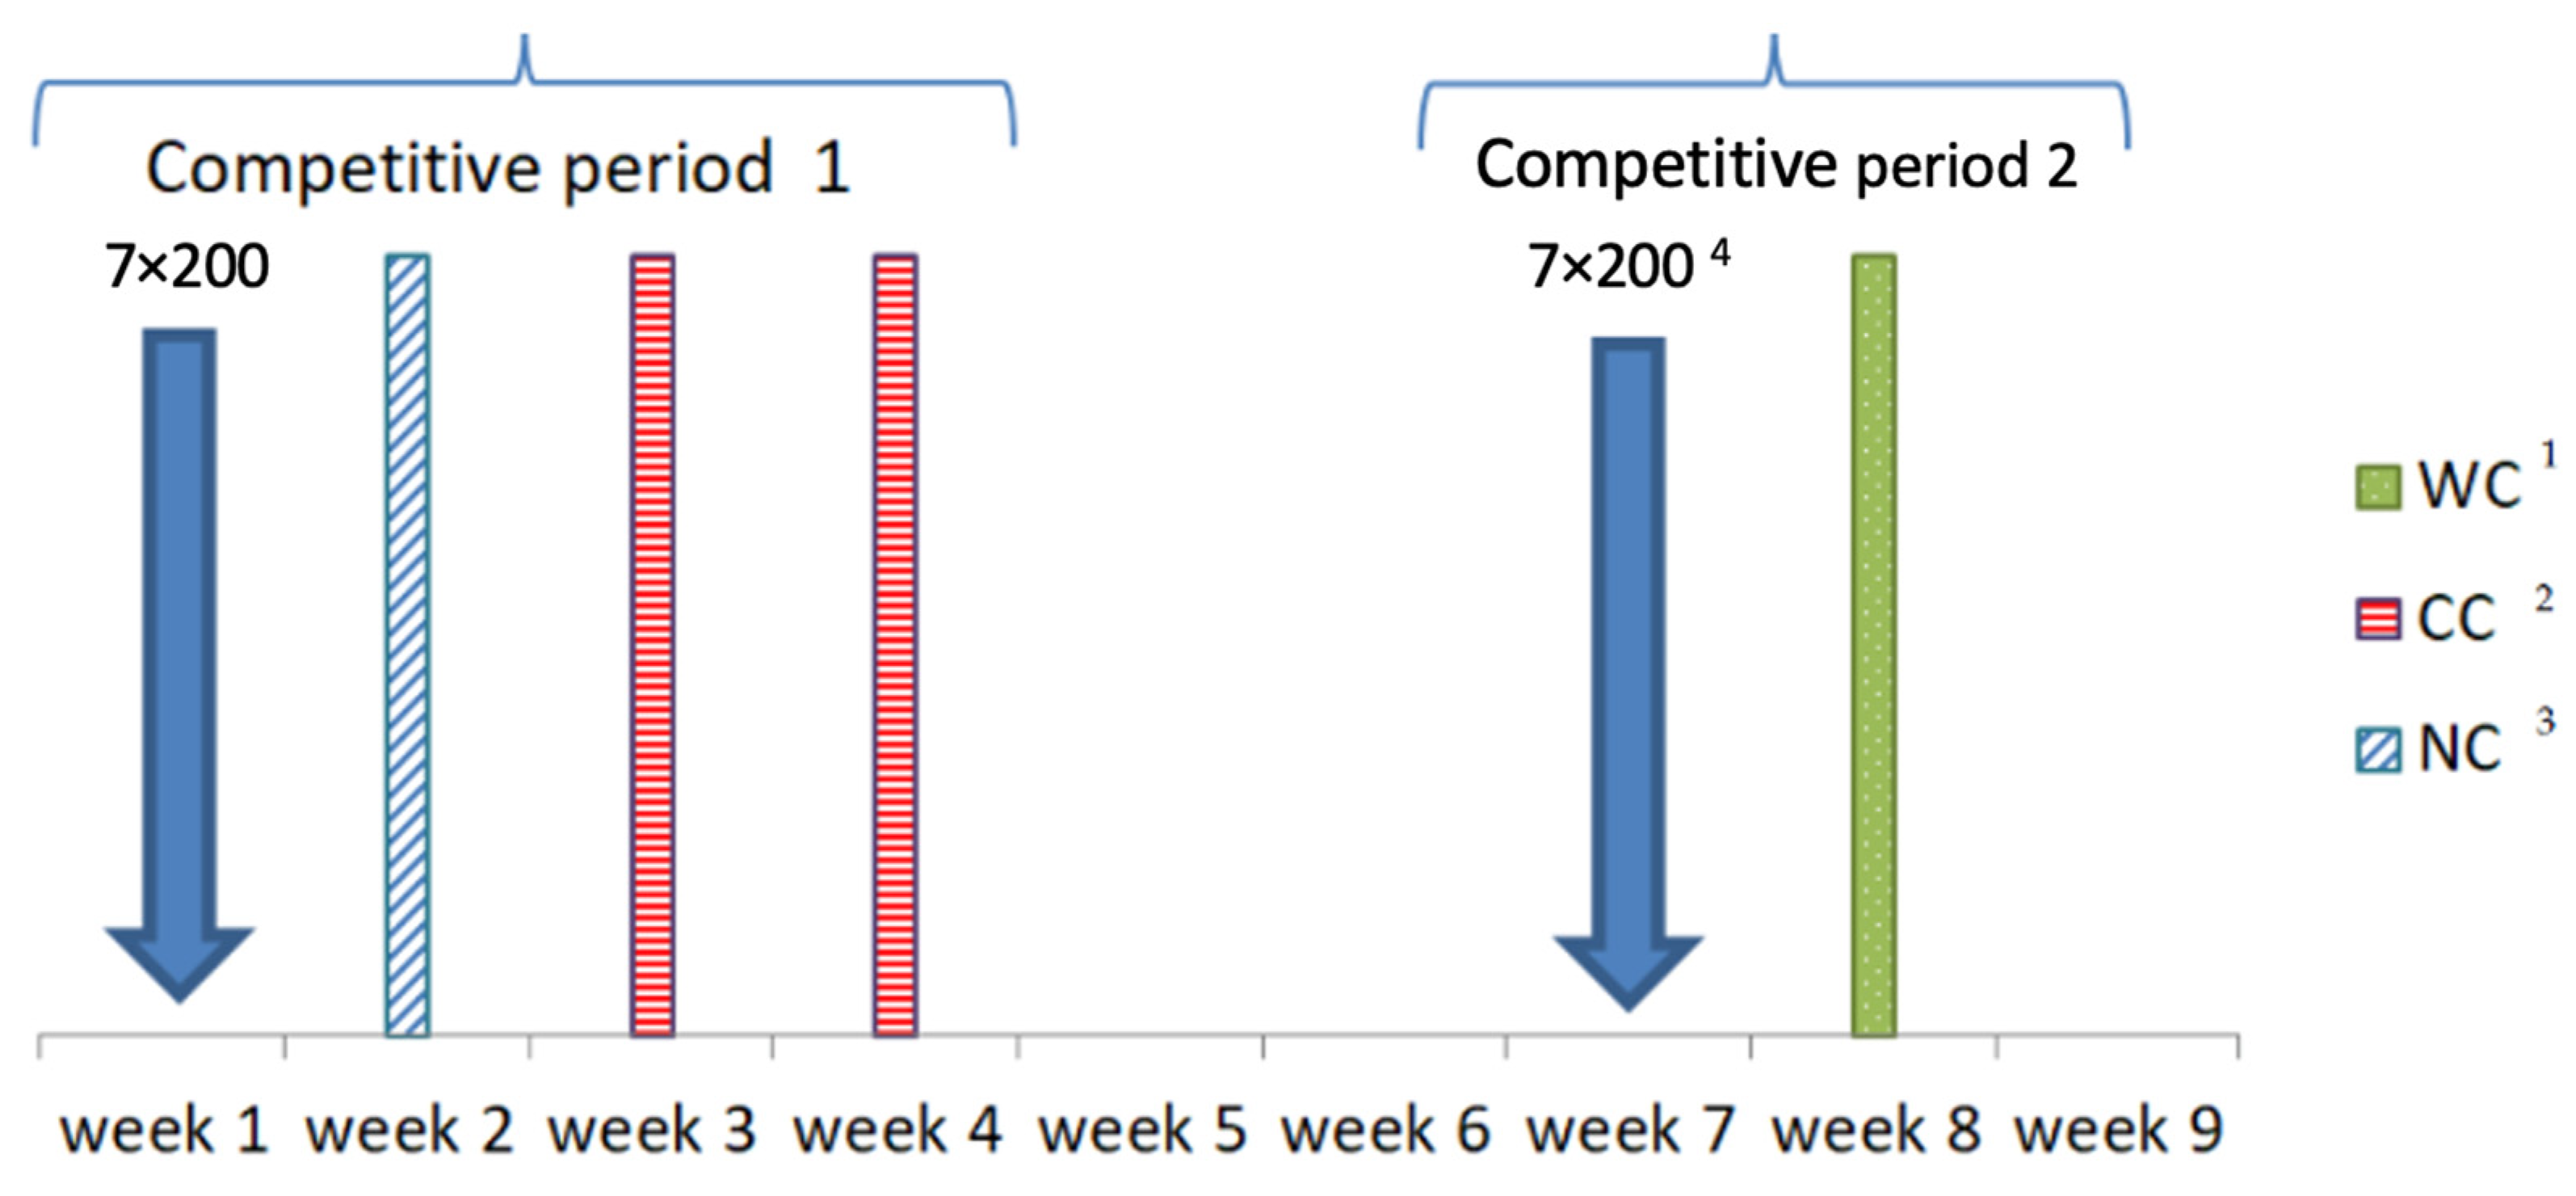
2.2. Study Design
2.3. Blood Lactate Concentration Data Analyses
2.4. Race Data
2.5. Statistical Analysis
3. Results
4. Discussion
4.1. Correlations between Test Variables and DFT
4.2. Correlations between Test Variables and PSL
4.3. Correlations between Test Variables and Overall Performance
4.4. Wetsuit Effect
4.5. Limitations
5. Conclusions
Author Contributions
Funding
Institutional Review Board Statement
Informed Consent Statement
Data Availability Statement
Conflicts of Interest
References
- World Triathlon. Competition Rule. 2023. Available online: https://triathlon.org/about/downloads/category/competition_rules (accessed on 20 August 2023).
- World Triathlon. Qualification Criteria. 2023. Available online: https://triathlon.org/about/downloads/category/qualification_criteria (accessed on 20 August 2023).
- Piacentini, M.F.; Bianchini, L.A.; Minganti, C.; Sias, M.; Di Castro, A.; Vleck, V. Is the Bike Segment of Modern Olympic Triathlon More a Transition towards Running in Males than It Is in Females? Sports 2019, 7, 76. [Google Scholar] [CrossRef] [PubMed]
- Cejuela, R.; Sellés-Pérez, S. Road to Tokyo 2020 Olympic Games: Training Characteristics of a World Class Male Triathlete. Front. Physiol. 2022, 13, 835705. [Google Scholar] [CrossRef] [PubMed]
- Lehenaff, D.; Bertrand, D. The Triathlon; Inde publicaciones: Barcelona, Spain, 2001; Volume 302. [Google Scholar]
- Vleck, V.E.; Bürgi, A.; Bentley, D.J. The Consequences of Swim, Cycle, and Run Performance on Overall Result in Elite Olympic Distance Triathlon. Int. J. Sports Med. 2006, 27, 43–48. [Google Scholar] [CrossRef] [PubMed]
- Millet, G.P.; Vleck, V.E.; Bentley, D.J. Physiological Requirements in Triathlon. J. Hum. Sport Exerc. 2011, 6, 184–204. [Google Scholar] [CrossRef]
- Janssen, M.; Wilson, B.D.; Toussaint, H.M. Effects of Drafting on Hydrodynamic and Metabolic Responses in Front Crawl Swimming. Med. Sci. Sports Exerc. 2009, 41, 837–843. [Google Scholar] [CrossRef] [PubMed]
- Puce, L.; Chamari, K.; Marinelli, L.; Mori, L.; Bove, M.; Faelli, E.; Fassone, M.; Cotellessa, F.; Bragazzi, N.L.; Trompetto, C. Muscle Fatigue and Swimming Efficiency in Behind and Lateral Drafting. Front. Physiol. 2022, 13, 835766. [Google Scholar] [CrossRef]
- Chatard, J.C.; Wilson, B. Drafting Distance in Swimming. Med. Sci. Sports Exerc. 2003, 35, 1176–1181. [Google Scholar] [CrossRef]
- Tomikawa, M.; Shimoyama, Y.; Nomura, T. Factors Related to the Advantageous Effects of Wearing a Wetsuit during Swimming at Different Submaximal Velocity in Triathletes. J. Sci. Med. Sport 2008, 11, 417–423. [Google Scholar] [CrossRef]
- Quagliarotti, C.; Cortesi, M.; Coloretti, V.; Fantozzi, S.; Gatta, G.; Bonifazi, M.; Zamparo, P.; Piacentini, M.F. The Effects of a Wetsuit on Biomechanical, Physiological, and Perceptual Variables in Experienced Triathletes. Int. J. Sports Physiol. Perform. 2023, 18, 171–179. [Google Scholar] [CrossRef]
- Puccinelli, P.J.; Lima, G.H.O.; Pesquero, J.B.; de Lira, C.A.B.; Vancini, R.L.; Nikolaids, P.T.; Knechtle, B.; Andrade, M.S. Predictors of Performance in Amateur Olympic Distance Triathlon: Predictors in Amateur Triathlon. Physiol. Behav. 2020, 225, 113110. [Google Scholar] [CrossRef]
- Buckingham, T.; Moore, R.W.; Ferguson, D.; Myers, N.; Pfeiffer, K.A. Validation of Triathlon Time Prediction Methods for Amateur Triathletes. Med. Sci. Sports Exerc. 2018, 50, 799. [Google Scholar] [CrossRef]
- Brisebois-Boies, M.; Garzon, M.; Ferland, P.-M.; Cañas, A.; Comtois, A.-S. Prediction Equations for Swimming, Cycling, Running and Total Time in Sprint Triathlon from Shorter Distance Tests. Med. Sci. Sports Exerc. 2021, 53, 7. [Google Scholar] [CrossRef]
- Billat, V.L.; Sirvent, P.; Py, G.; Koralsztein, J.P.; Mercier, J. The Concept of Maximal Lactate Steady State: A Bridge between Biochemistry, Physiology and Sport Science. Sports Med. 2003, 33, 407–426. [Google Scholar] [CrossRef] [PubMed]
- Beneke, R. Methodological Aspects of Maximal Lactate Steady State-Implications for Performance Testing. Eur. J. Appl. Physiol. 2003, 89, 95–99. [Google Scholar] [CrossRef] [PubMed]
- Schabort, E.J.; Killian, S.C.; St Clair Gibson, A.; Hawley, J.A.; Noakes, T.D. Prediction of Triathlon Race Time from Laboratory Testing in National Triathletes. Med. Sci. Sports Exerc. 2000, 32, 844–849. [Google Scholar] [CrossRef] [PubMed]
- Sandbakk, Ø.; Pyne, D.B.; McGawley, K.; Foster, C.; Talsnes, R.K.; Solli, G.S.; Millet, G.P.; Seiler, S.; Laursen, P.B.; Haugen, T.; et al. The Evolution of World-Class Endurance Training: The Scientist’s View on Current and Future Trends. Int. J. Sports Physiol. Perform. 2023, 18, 885–889. [Google Scholar] [CrossRef] [PubMed]
- McKay, A.K.A.; Stellingwerff, T.; Smith, E.S.; Martin, D.T.; Mujika, I.; Goosey-Tolfrey, V.L.; Sheppard, J.; Burke, L.M. Defining Training and Performance Caliber: A Participant Classification Framework. Int. J. Sports Physiol. Perform. 2022, 17, 317–331. [Google Scholar] [CrossRef]
- Sweetenham, B. Championship Swim Training; Human Kinetics: Champaign, IL, USA, 2004; pp. 37–42. [Google Scholar]
- Pyne, D.B.; Lee, H.; Swanwick, K.M. Monitoring the Lactate Threshold in World-Ranked Swimmers. Med. Sci. Sports Exerc. 2001, 33, 291–297. [Google Scholar] [CrossRef]
- World Triathlon. Competition Results. 2023. Available online: https://triathlon.org/results (accessed on 20 August 2023).
- Sink, C.A.; Mvududu, N.H. Statistical Power, Sampling, and Effect Sizes. Couns. Outcome Res. Eval. 2010, 1, 1–18. [Google Scholar] [CrossRef]
- Anderson, M.; Hopkins, W.; Roberts, A.; Pyne, D. Ability of Test Measures to Predict Competitive Performance in Elite Swimmers. J. Sports Sci. 2008, 26, 123–130. [Google Scholar] [CrossRef]
- Suriano, R.; Bishop, D. Physiological Attributes of Triathletes. J. Sci. Med. Sport 2010, 13, 340–347. [Google Scholar] [CrossRef] [PubMed]
- López-Belmonte, Ó.; Ruiz-Navarro, J.J.; Gay, A.; Cuenca-Fernández, F.; Cejuela, R.; Arellano, R. Determinants of 1500-m Front-Crawl Swimming Performance in Triathletes: Influence of Physiological and Biomechanical Variables. Int. J. Sports Physiol. Perform. 2023, 18, 1328–1335. [Google Scholar] [CrossRef] [PubMed]
- Baldassarre, R.; Bonifazi, M.; Zamparo, P.; Piacentini, M.F. Characteristics and Challenges of Open-Water Swimming Performance: A Review. Int. J. Sports Physiol. Perform. 2017, 12, 1275–1284. [Google Scholar] [CrossRef] [PubMed]
- Maglischo, E.W. Swimming Faster: A Comprehensive Guide to the Science of Swimming; Mayfield Pub. Co.: California City, CA, USA, 1982; Volume 472. [Google Scholar]
- Papoti, M.; Da Silva, A.S.R.; Araujo, G.G.; Santiago, V.; Martins, L.E.B.; Cunha, S.A.; Gobatto, C.A. Aerobic and Anaerobic Performances in Tethered Swimming. Int. J. Sports Med. 2013, 34, 712–719. [Google Scholar] [CrossRef]
- Abbott, A.; Collins, D. Eliminating the Dichotomy between Theory and Practice in Talent Identification and Development: Considering the Role of Psychology. J. Sports Sci. 2004, 22, 395–408. [Google Scholar] [CrossRef]
- Cejuela, R.; Selles-Perez, S. Training Characteristics and Performance of Two Male Elite Short-Distance Triathletes: From Junior to “World-Class”. Scand. J. Med. Sci. Sports 2023, 33, 2444–2456. [Google Scholar] [CrossRef]
- Figueiredo, P.; Marques, E.A.; Lepers, R. Changes in Contributions of Swimming, Cycling, and Running Performances on Overall Triathlon Performance Over a 26-Year Period. J. Strength. Cond. Res. 2016, 30, 2406–2415. [Google Scholar] [CrossRef]
- Sousa, C.V.; Aguiar, S.; Olher, R.R.; Cunha, R.; Nikolaidis, P.T.; Villiger, E.; Rosemann, T.; Knechtle, B. What Is the Best Discipline to Predict Overall Triathlon Performance? An Analysis of Sprint, Olympic, Ironman® 70.3, and Ironman® 140.6. Front. Physiol. 2021, 12, 654552. [Google Scholar] [CrossRef]
- Wu, S.S.X.; Abbiss, C.; Peiffer, J.; Brisswalter, J.; Nosaka, K. Factors Influencing Pacing in Triathlon. Open Access J. Sports Med. 2014, 5, 223. [Google Scholar] [CrossRef]
- Millet, G.P.; Bentley, D.J. The Physiological Responses to Running after Cycling in Elite Junior and Senior Triathletes. Int. J. Sports Med. 2004, 25, 191–197. [Google Scholar] [CrossRef]


| Race Level | Total Races Analysed | Average Number of Participants | Total of SD Races | Total of OD Races | No Wetsuit Allowed Races | Wetsuit Allowed Races |
|---|---|---|---|---|---|---|
| Local | 5 | 5.6 | 3 | 2 | 2 | 3 |
| National | 5 | 3.8 | 2 | 3 | 2 | 3 |
| Continental Cup | 21 | 2.2 | 11 | 10 | 16 | 5 |
| World Cup | 22 | 2.1 | 12 | 10 | 15 | 7 |
| World Series | 22 | 1.7 | 10 | 12 | 17 | 5 |
| Participant Level | Number of Participants | Speed at LT1 1 (m/s) 4 | Speed at LT2 2 (m/s) | SL200 3 (m/s) | 200 m Swim Test (s) 5 |
|---|---|---|---|---|---|
| World Class | 3 | 1.31 (0.05) | 1.41 (0.05) | 1.50 (0.06) | 133 (6) |
| Elite | 10 | 1.31 (0.04) | 1.39 (0.04) | 1.48 (0.04) | 135 (4) |
| National | 5 | 1.26 (0.02) | 1.31 (0.02) | 1.38 (0.02) | 141 (4) |
| Race Level | Type of Correlation | Speed at LT1 1 (m/s) 4 | Speed at LT2 2 (m/s) | SL200 3 (m/s) | 200 m Swim Test (s) 5 |
|---|---|---|---|---|---|
| SD L 6 | Pearson | −0.703 ** | −0.664 ** | −0.716 ** | 0.713 ** |
| Spearman | −0.730 ** | −0.672 ** | −0.745 ** | 0.601 * | |
| SD N 7 | Pearson | −0.650 | −0.759 * | −0.873 * | −0.947 ** |
| Spearman | −0.800 * | −0.929 ** | −0.829 * | 0.857 * | |
| SD CC 8 | Pearson | −0.546 * | −0.592 * | −0.004 | 0.260 |
| Spearman | −0.613 * | −0.608 * | −0.042 | 0.497 | |
| SD WC 9 | Pearson | −0.407 | −0.553 | −0.317 | 0.251 |
| Spearman | −0.543 | −0.626 * | −0.322 | 0.293 | |
| SD WS 10 | Pearson | −0.710 ** | −0.728 ** | −0.734 ** | 0.716 ** |
| Spearman | −0.663 ** | −0.659 ** | −0.660 ** | 0.677 ** | |
| OD L 11 | Pearson | −0.859 ** | −0.885 ** | −0.892 ** | 0.873 ** |
| Spearman | −0.943 ** | −0.966 ** | −0.914 ** | 0.747 * | |
| OD N 12 | Pearson | −0.719 ** | −0.761 ** | −0.860 ** | 0.660 * |
| Spearman | −0.713 ** | −0.710 ** | −0.785 ** | 0.711 ** | |
| OD CC 13 | Pearson | −0.455 * | −0.360 | −0.172 | −0.220 |
| Spearman | −0.422 * | −0.334 | −0.136 | 0.243 | |
| OD WC 14 | Pearson | −0.679 * | −0.657 * | −0.802 ** | 0.711 * |
| Spearman | −0.675 * | −0.693 * | −0.892 ** | 0.735 * | |
| OD WS 15 | Pearson | −0.692 ** | −0.683 ** | −0.707 ** | 0.625 ** |
| Spearman | −0.595 * | −0.573 * | −0.591 * | 0.559 * |
| Race Level | Type of Correlation | Speed at LT1 1 (m/s) 4 | Speed at LT2 2 (m/s) | SL200 3 (m/s) | 200 m Swim Test (s) 5 |
|---|---|---|---|---|---|
| SD L 6 | Pearson | −0.409 | −0.530 * | −0.552 * | 0.307 |
| Spearman | −0.428 | −0.551 * | −0.567 * | 0.233 | |
| SD N 7 | Pearson | −0.653 | −0.767 * | −0.880 ** | 0.835 * |
| Spearman | −0.673 | −0.857 * | −0.793 * | 0.821 * | |
| SD CC 8 | Pearson | −0.646 ** | −0.811 * | −0.406 | 0.603 * |
| Spearman | −0.692 ** | −0.824 ** | −0.441 * | 0.781 ** | |
| SD WC 9 | Pearson | −0.223 | −0.543 | −0.499 | 0.065 |
| Spearman | −0.282 | −0.581 * | −0.424 | 0.148 | |
| SD WS 10 | Pearson | −0.849 ** | −0.831 ** | −0.853 ** | 0.802 ** |
| Spearman | −0.834 ** | −0.708 ** | −0.836 * | 0.748 ** | |
| OD L 11 | Pearson | −0.905 ** | −0.948 ** | −0.860 ** | 0.861 ** |
| Spearman | −0.905 ** | −0.958 ** | −0.838 ** | 0.736 * | |
| OD N 12 | Pearson | −0.755 ** | −0.755 ** | −0.880 ** | 0.710 ** |
| Spearman | −0.793 ** | −0.788 ** | −0.852 ** | 0.797 ** | |
| OD CC 13 | Pearson | −0.454 * | −0.343 | −0.262 | 0.269 |
| Spearman | −0.440 * | −0.356 | −0.258 | 0.312 | |
| OD WC 14 | Pearson | −0.709 * | −0.607 * | −0.659 * | 0.726 * |
| Spearman | −0.672 * | −0.576 * | −0.699 * | 0.626 * | |
| OD WS 15 | Pearson | −0.686 ** | −0.714 ** | −0.728 ** | 0.651 ** |
| Spearman | −0.609 ** | −0.597 * | −0.632 ** | 0.612 ** |
| Race Level | Type of Correlation | Speed at LT1 1 (m/s) 4 | Speed at LT2 2 (m/s) | SL200 3 (m/s) | 200 m Swim Test (s) 5 |
|---|---|---|---|---|---|
| SD L 6 | Pearson | −0.307 | −0.381 | −0.472 | 0.289 |
| Spearman | −0.356 | −0.447 | −0.540 | 0.236 | |
| SD N 7 | Pearson | −0.303 | −0.392 | −0.533 | 0.527 |
| Spearman | −0.364 | −0.500 | −0.577 | 0.643 | |
| SD CC 8 | Pearson | −0.285 | −0.342 | −0.052 | 0.208 |
| Spearman | −0.269 | −0.381 | −0.013 | 0.254 | |
| SD WC 9 | Pearson | 0.409 | 0.133 | −0.156 | −0.545 |
| Spearman | 0.248 | −0.081 | −0.049 | −0.318 | |
| SD WS 10 | Pearson | −0.505 * | −0.505 * | −0.566 * | 0.494 * |
| Spearman | −0.573 * | −0.369 | −0.600 ** | 0.494 * | |
| OD L 11 | Pearson | 0.030 | 0.087 | −0.219 | 0.022 |
| Spearman | −0.043 | −0.097 | −0.279 | 0.030 | |
| OD N 12 | Pearson | −0.575 | −0.584 * | −0.709 * | 0.596 * |
| Spearman | −0.720 ** | −0.631 * | −0.782 ** | 0.648 * | |
| OD CC 13 | Pearson | −0.125 | 0.005 | −0.132 | 0.075 |
| Spearman | −0.031 | 0.060 | −0.064 | −0.088 | |
| OD WC 14 | Pearson | −0.014 | −0.094 | −0.552 | 0.147 |
| Spearman | 0.009 | −0.135 | −0.593 | 0.164 | |
| OD WS 15 | Pearson | −0.611 * | −0.542 * | −0.590 * | 0.500 * |
| Spearman | −0.611 ** | −0.403 | −0.623 ** | 0.396 |
Disclaimer/Publisher’s Note: The statements, opinions and data contained in all publications are solely those of the individual author(s) and contributor(s) and not of MDPI and/or the editor(s). MDPI and/or the editor(s) disclaim responsibility for any injury to people or property resulting from any ideas, methods, instructions or products referred to in the content. |
© 2023 by the authors. Licensee MDPI, Basel, Switzerland. This article is an open access article distributed under the terms and conditions of the Creative Commons Attribution (CC BY) license (https://creativecommons.org/licenses/by/4.0/).
Share and Cite
Sellés-Pérez, S.; Cejuela, R.; Fernández-Sáez, J.; Arévalo-Chico, H. Does Pool Performance of Elite Triathletes Predict Open-Water Performance? J. Funct. Morphol. Kinesiol. 2023, 8, 165. https://doi.org/10.3390/jfmk8040165
Sellés-Pérez S, Cejuela R, Fernández-Sáez J, Arévalo-Chico H. Does Pool Performance of Elite Triathletes Predict Open-Water Performance? Journal of Functional Morphology and Kinesiology. 2023; 8(4):165. https://doi.org/10.3390/jfmk8040165
Chicago/Turabian StyleSellés-Pérez, Sergio, Roberto Cejuela, José Fernández-Sáez, and Héctor Arévalo-Chico. 2023. "Does Pool Performance of Elite Triathletes Predict Open-Water Performance?" Journal of Functional Morphology and Kinesiology 8, no. 4: 165. https://doi.org/10.3390/jfmk8040165