
Gait Variability at Different Walking Speeds

 ,
,  , and
, and 
Abstract
:
1. Introduction
2. Materials and Methods
2.1. Participants
2.2. Experimental Design
2.3. Measurement
2.4. Statistical Analysis
3. Results
4. Discussion
5. Conclusions
Author Contributions
Funding
Institutional Review Board Statement
Informed Consent Statement
Data Availability Statement
Conflicts of Interest
References
- Padulo, J.; Di Capua, R.; Viggiano, D. Pedaling time variability is increased in dropped riding position. Eur. J. Appl. Physiol. 2012, 112, 3161–3165. [Google Scholar] [CrossRef]
- Padulo, J.; Powell, D.W.; Ardigò, L.P.; Viggiano, D. Modifications in activation of lower limb muscles as a function of initial foot position in cycling. J. Electromyogr. Kinesiol. 2015, 25, 648–652. [Google Scholar] [CrossRef]
- Russo, L.; Di Capua, R.; Arnone, B.; Borrelli, M.; Coppola, R.; Esposito, F.; Padulo, J. Shoes and insoles: The influence on motor tasks related to walking gait variability and stability. Int. J. Environ. Res. Public Health 2020, 17, 4569. [Google Scholar] [CrossRef]
- Milic, M.; Erceg, M.; Palermi, S.; Iuliano, E.; Borrelli, M.; Cè, E.; Esposito, F.; Padulo, J. Uphill walking at iso-efficiency speeds. Biol. Sport 2020, 37, 247–253. [Google Scholar] [CrossRef]
- Padulo, J.; Annino, G.; D’Ottavio, S.; Vernillo, G.; Smith, L.; Migliaccio, G.M.; Tihanyi, J. Footstep analysis at different slopes and speeds in elite race walking. J. Strength Cond. Res. 2013, 27, 125–129. [Google Scholar] [CrossRef]
- Padulo, J.; Annino, G.; Tihanyi, J.; Calcagno, G.; Vando, S.; Smith, L.; Vernillo, G.; La Torre, A.; D’ottavio, S. Uphill racewalking at iso-efficiency speed. J. Strength Cond. Res. 2013, 27, 1964–1973. [Google Scholar] [CrossRef]
- Padulo, J. The effect of uphill stride manipulation on race walking gait. Biol. Sport 2015, 32, 267–271. [Google Scholar] [CrossRef] [PubMed]
- Ardigò, L.P.; Buglione, A.; Russo, L.; Cular, D.; Esposito, F.; Doria, C.; Padulo, J. Marathon shoes vs. track spikes: A crossover pilot study on metabolic demand at different speeds in experienced runners. Res. Sport. Med. 2023, 31, 13–20. [Google Scholar] [CrossRef]
- Padulo, J.; Annino, G.; Smith, L.; Migliaccio, G.M.; Camino, R.; Tihanyi, J.; Dottavio, S. Uphill running at iso-efficiency speed. Int. J. Sports Med. 2012, 33, 819–823. [Google Scholar] [CrossRef]
- Padulo, J.; Degortes, N.; Migliaccio, G.M.; Attene, G.; Smith, L.; Salernitano, G.; Annino, G.; D’Ottavio, S. Footstep manipulation during uphill running. Int. J. Sports Med. 2013, 34, 244–247. [Google Scholar] [CrossRef]
- Padulo, J.; Annino, G.; Migliaccio, G.M.; D’Ottavio, S.; Tihanyi, J. Kinematics of running at different slopes and speeds. J. Strength Cond. Res. 2012, 26, 1331–1339. [Google Scholar] [CrossRef] [PubMed]
- Padulo, J.; Powell, D.; Milia, R.; Ardigò, L.P. A Paradigm of Uphill Running. PLoS ONE 2013, 8, e69006. [Google Scholar] [CrossRef] [PubMed]
- Gimmon, Y.; Rashad, H.; Kurz, I.; Plotnik, M.; Riemer, R.; Debi, R.; Shapiro, A.; Melzer, I. Gait coordination deteriorates in independent old-old adults. J. Aging Phys. Act. 2018, 26, 382–389. [Google Scholar] [CrossRef] [PubMed]
- Dingwell, J.B.; Salinas, M.M.; Cusumano, J.P. Increased gait variability may not imply impaired stride-to-stride control of walking in healthy older adults: Winner: 2013 Gait and Clinical Movement Analysis Society Best Paper Award. Gait Posture 2017, 55, 131–137. [Google Scholar] [CrossRef]
- Werner, C.; Easthope, C.A.; Curt, A.; Demkó, L. Towards a mobile gait analysis for patients with a spinal cord injury: A robust algorithm validated for slow walking speeds. Sensors 2021, 21, 7381. [Google Scholar] [CrossRef]
- England, S.A.; Granata, K.P. The influence of gait speed on local dynamic stability of walking. Gait Posture 2007, 25, 172–178. [Google Scholar] [CrossRef]
- Kim, J.; Bertram, J.E.A. Compliant walking appears metabolically advantageous at extreme step lengths. Gait Posture 2018, 64, 84–89. [Google Scholar] [CrossRef]
- Baroudi, L.; Yan, X.; Newman, M.W.; Barton, K.; Cain, S.M.; Shorter, K.A. Investigating walking speed variability of young adults in the real world. Gait Posture 2022, 98, 69–77. [Google Scholar] [CrossRef]
- Pitts, J.; Singhal, K.; Apte, Y.; Patel, P.; Kannan, L.; Bhatt, T. The Effect of Cognitive Task, Gait Speed, and Age on Cognitive–Motor Interference during Walking. Sensors 2023, 23, 7368. [Google Scholar] [CrossRef]
- Bezuidenhout, L.; Thurston, C.; Hagströmer, M.; Conradsson, D.M. Validity of hip and ankle worn actigraph accelerometers for measuring steps as a function of gait speed during steady state walking and continuous turning. Sensors 2021, 21, 3154. [Google Scholar] [CrossRef]
- di Prampero, P.E. The energy cost of human locomotion on land and in water. Int. J. Sports Med. 1986, 7, 55–72. [Google Scholar] [CrossRef]
- Nessler, J.A.; Spargo, T.; Craig-Jones, A.; Milton, J.G. Phase resetting behavior in human gait is influenced by treadmill walking speed. Gait Posture 2016, 43, 187–191. [Google Scholar] [CrossRef] [PubMed]
- Bari, M.A.; Mir, H.N.; Parrey, J.A.; Ateeq, A.; Ajhar, A.; Al Muslem, W.H.; Nuhmani, S.; Alduhishy, A.; Alsubaiei, M.E. Exploring variations in gait patterns and joint motion characteristics in school-aged children across different walking speeds: A comprehensive motion analysis study. J. Med. Life 2023, 16, 895–903. [Google Scholar] [CrossRef]
- Brinkerhoff, S.A.; Murrah, W.M.; Hutchison, Z.; Miller, M.; Roper, J.A. Words matter: Instructions dictate “self-selected” walking speed in young adults. Gait Posture 2022, 95, 223–226. [Google Scholar] [CrossRef] [PubMed]
- Cinar, E.; Saxena, S.; Gagnon, I. Differential Effects of Concurrent Tasks on Gait in Typically Developing Children: A Meta-Analysis. J. Mot. Behav. 2021, 53, 1–14. [Google Scholar] [CrossRef] [PubMed]
- Hennah, C.; Ellis, G.; Doumas, M. Dual task walking in healthy aging: Effects of narrow and wide walking paths. PLoS ONE 2021, 16, e0261647. [Google Scholar] [CrossRef]
- Mazaheri, M.; Negahban, H.; Soltani, M.; Mehravar, M.; Tajali, S.; Hessam, M.; Salavati, M.; Kingma, I. Effects of narrow-base walking and dual tasking on gait spatiotemporal characteristics in anterior cruciate ligament-injured adults compared to healthy adults. Knee Surg. Sport. Traumatol. Arthrosc. 2017, 25, 2528–2535. [Google Scholar] [CrossRef]
- Jung, T.; Kim, Y.; Kelly, L.E.; Wagatsuma, M.; Jung, Y.; Abel, M.F. Comparison of Treadmill and Overground Walking in Children and Adolescents. Percept. Mot. Skills 2021, 128, 988–1001. [Google Scholar] [CrossRef] [PubMed]
- Cesar, G.M.; Buster, T.W.; Mohammadzadeh Gonabadi, A.; Burnfield, J.M. Muscle demand and kinematic similarities between pediatric-modified motor-assisted elliptical training at fast speed and fast overground walking: Real-world implications for pediatric gait rehabilitation. J. Electromyogr. Kinesiol. 2022, 63, 102639. [Google Scholar] [CrossRef]
- Ready, E.A.; McGarry, L.M.; Rinchon, C.; Holmes, J.D.; Grahn, J.A. Beat perception ability and instructions to synchronize influence gait when walking to music-based auditory cues. Gait Posture 2019, 68, 555–561. [Google Scholar] [CrossRef]
- Hunter, L.C.; Hendrix, E.C.; Dean, J.C. The cost of walking downhill: Is the preferred gait energetically optimal? J. Biomech. 2010, 43, 1910–1915. [Google Scholar] [CrossRef] [PubMed]
- Olsen, A.M.; Lambrechts, N.E.; Weng, H.Y.; Kazmierczak, K.A.; Duerr, F.M.; Breur, G.J. Transference of reference intervals for variables of instrumented gait analysis in walking dogs. Am. J. Vet. Res. 2020, 81, 790–795. [Google Scholar] [CrossRef] [PubMed]
- Chow, J.W.; Hemleben, M.E.; Stokic, D.S. Effect of centerline-guided walking on gait characteristics in healthy subjects. J. Biomech. 2009, 42, 1134–1137. [Google Scholar] [CrossRef]
- Malde, D.; Pizzimenti, N.; McCamley, J.; Sumner, B. Are Age, Self-Selected Walking Speed, or Propulsion Force Predictors of Gait-Related Changes in Older Adults? J. Appl. Biomech. 2023, 39, 99–109. [Google Scholar] [CrossRef]
- Lindemann, U. Spatiotemporal gait analysis of older persons in clinical practice and research: Which parameters are relevant? Z. Gerontol. Geriatr. 2020, 53, 171–178. [Google Scholar] [CrossRef]
- Choi, J.S.; Kang, D.W.; Shin, Y.H.; Tack, G.R. Differences in gait pattern between the elderly and the young during level walking under low illumination. Acta Bioeng. Biomech. 2014, 16, 3–9. [Google Scholar] [CrossRef] [PubMed]
- Ling, J.; Yasuda, K.; Hayashi, Y.; Imamura, S.; Iwata, H. Development of a vibrotactile cueing device that implicitly increases walking speed during gait training in stroke patients: An observational case series study. J. Med. Eng. Technol. 2022, 46, 25–31. [Google Scholar] [CrossRef]
- Hollman, J.H.; Watkins, M.K.; Imhoff, A.C.; Braun, C.E.; Akervik, K.A.; Ness, D.K. A comparison of variability in spatiotemporal gait parameters between treadmill and overground walking conditions. Gait Posture 2016, 43, 204–209. [Google Scholar] [CrossRef]
- Romkes, J.; Bracht-Schweizer, K. The effects of walking speed on upper body kinematics during gait in healthy subjects. Gait Posture 2017, 54, 304–310. [Google Scholar] [CrossRef]
- Beerse, M.; Henderson, G.; Liang, H.; Ajisafe, T.; Wu, J. Variability of spatiotemporal gait parameters in children with and without Down syndrome during treadmill walking. Gait Posture 2019, 68, 207–212. [Google Scholar] [CrossRef]
- Meinders, E.; Booij, M.J.; van den Noort, J.C.; Harlaar, J. How to compare knee kinetics at different walking speeds? Gait Posture 2021, 88, 225–230. [Google Scholar] [CrossRef] [PubMed]
- Cinar, E.; McFadyen, B.J.; Gagnon, I. Relationship Between Dual-Task Walking and Level of Conflict Between Gait and Concurrent Tasks in Adolescents. J. Mot. Behav. 2023, 55, 152–161. [Google Scholar] [CrossRef]
- Albesher, R.A.; Spittle, A.J.; Dobson, F.L.; Mentiplay, B.F.; FitzGerald, T.L.; Cameron, K.L.; Zannino, D.; Josev, E.K.; Doyle, L.W.; Cheong, J.L.Y.; et al. Spatiotemporal gait variables and step-to-step variability in preschool-aged children born < 30 weeks’ gestation and at term in preferred speed, dual-task paradigm, and tandem walking. Gait Posture 2022, 92, 236–242. [Google Scholar] [CrossRef] [PubMed]
- Hayes, S.C.; White, M.; White, H.S.F.; Vanicek, N. A biomechanical comparison of powered robotic exoskeleton gait with normal and slow walking: An investigation with able-bodied individuals. Clin. Biomech. 2020, 80, 105133. [Google Scholar] [CrossRef] [PubMed]
- Krumpoch, S.; Lindemann, U.; Rappl, A.; Becker, C.; Sieber, C.C.; Freiberger, E. The effect of different test protocols and walking distances on gait speed in older persons. Aging Clin. Exp. Res. 2021, 33, 141–146. [Google Scholar] [CrossRef]
- Donlin, M.C.; Pariser, K.M.; Downer, K.E.; Higginson, J.S. Adaptive treadmill walking encourages persistent propulsion. Gait Posture 2022, 93, 246–251. [Google Scholar] [CrossRef]
- Habersack, A.; Kraus, T.; Kruse, A.; Regvar, K.; Maier, M.; Svehlik, M. Gait Pathology in Subjects with Patellofemoral Instability: A Systematic Review. Int. J. Environ. Res. Public Health 2022, 19, 10491. [Google Scholar] [CrossRef]
- Brisswalter, J.; Fougeron, B.; Legros, P. Variability in energy cost and walking gait during race walking in competitive race walkers. Med. Sci. Sports Exerc. 1998, 30, 1451–1455. [Google Scholar] [CrossRef]
- Hollman, J.H.; Kovash, F.M.; Kubik, J.J.; Linbo, R.A. Age-related differences in spatiotemporal markers of gait stability during dual task walking. Gait Posture 2007, 26, 113–119. [Google Scholar] [CrossRef]
- Huang, C.; Zhang, F.; Xu, Z.; Wei, J. The Diverse Gait Dataset: Gait Segmentation Using Inertial Sensors for Pedestrian Localization with Different Genders, Heights and Walking Speeds. Sensors 2022, 22, 1678. [Google Scholar] [CrossRef]
- Zukowski, L.A.; Tennant, J.E.; Iyigun, G.; Giuliani, C.A.; Plummer, P. Dual-tasking impacts gait, cognitive performance, and gaze behavior during walking in a real-world environment in older adult fallers and non-fallers. Exp. Gerontol. 2021, 150, 111342. [Google Scholar] [CrossRef] [PubMed]
- Renner, K.; Delaney, C.; Hill, C.; Sands, L.; Queen, R. Predicting post-total ankle arthroplasty walking speed based on preoperative gait mechanics. J. Orthop. Res. 2023, 41, 1070–1075. [Google Scholar] [CrossRef]
- Nessler, J.A.; Heredia, S.; Belair, J.; Milton, J. Walking on a vertically oscillating treadmill: Phase synchronization and gait kinematics. PLoS ONE 2017, 12, e0169924. [Google Scholar] [CrossRef] [PubMed]
- Almarwani, M.; VanSwearingen, J.M.; Perera, S.; Sparto, P.J.; Brach, J.S. Challenging the motor control of walking: Gait variability during slower and faster pace walking conditions in younger and older adults. Arch. Gerontol. Geriatr. 2016, 66, 54–61. [Google Scholar] [CrossRef] [PubMed]
- Plotnik, M.; Giladi, N.; Hausdorff, J.M. A new measure for quantifying the bilateral coordination of human gait: Effects of aging and Parkinson’s disease. Exp. Brain Res. 2007, 181, 561–570. [Google Scholar] [CrossRef]
- Plotnik, M.; Azrad, T.; Bondi, M.; Bahat, Y.; Gimmon, Y.; Zeilig, G.; Inzelberg, R.; Siev-Ner, I. Self-selected gait speed—Over ground versus self-paced treadmill walking, a solution for a paradox. J. Neuroeng. Rehabil. 2015, 12, 1–10. [Google Scholar] [CrossRef]
- Hinton, D.C.; Thiel, A.; Soucy, J.P.; Bouyer, L.; Paquette, C. Adjusting gait step-by-step: Brain activation during split-belt treadmill walking. Neuroimage 2019, 202, 116095. [Google Scholar] [CrossRef]
- Haaland, E.; Kaipust, J.; Wang, Y.; Stergiou, N.; Stoffregen, T.A. Human gait at sea while walking fore aft vs. athwart. Aerosp. Med. Hum. Perform. 2015, 86, 435–439. [Google Scholar] [CrossRef]
- Magnani, R.M.; van Dieën, J.H.; Bruijn, S.M. Effects of vestibular stimulation on gait stability when walking at different step widths. Exp. Brain Res. 2023, 241, 49–58. [Google Scholar] [CrossRef]
- Choi, J.S.; Seo, J.W.; Lee, J.S.; Kim, J.G.; Cho, J.H.; Tack, G.R. Differences in reproducibility of gait variability and fractal dynamics according to walking duration. Technol. Health Care 2020, 28, S383–S390. [Google Scholar] [CrossRef]
- Son, M.; Cheon, S.M.; Youm, C.; Kim, J.W. Turning reveals the characteristics of gait freezing better than walking forward and backward in Parkinson’s disease. Gait Posture 2022, 94, 131–137. [Google Scholar] [CrossRef] [PubMed]
- Van Bladel, A.; De Ridder, R.; Palmans, T.; Van der Looven, R.; Cambier, D. Comparing spatiotemporal gait parameters between overground walking and self-paced treadmill walking in persons after stroke. Disabil. Rehabil. 2023, 45, 1016–1021. [Google Scholar] [CrossRef] [PubMed]
- Arazpour, M.; Soleimani, F.; Sajedi, F.; Vameghi, R.; Bani, M.A.; Gharib, M.; Samadian, M. Effect of orthotic gait training with isocentric reciprocating gait orthosis on walking in children with myelomeningocele. Top. Spinal Cord Inj. Rehabil. 2017, 23, 147–154. [Google Scholar] [CrossRef]
- Feodoroff, B.; Blümer, V. Unilateral non-electric assistive walking device helps neurological and orthopedic patients to improve gait patterns. Gait Posture 2022, 92, 294–301. [Google Scholar] [CrossRef] [PubMed]
- Maezawa, H.; Koganemaru, S.; Matsuhashi, M.; Hirata, M.; Funahashi, M.; Mima, T. Entrainment of chewing rhythm by gait speed during treadmill walking in humans. Neurosci. Res. 2020, 156, 88–94. [Google Scholar] [CrossRef]
- Maslivec, A.; Bampouras, T.M.; Dewhurst, S. Head flexion and different walking speeds do not affect gait stability in older females. Hum. Mov. Sci. 2017, 55, 87–93. [Google Scholar] [CrossRef]
- Vaz, J.R.; Knarr, B.A.; Stergiou, N. Gait complexity is acutely restored in older adults when walking to a fractal-like visual stimulus. Hum. Mov. Sci. 2020, 74, 102677. [Google Scholar] [CrossRef]
- Misu, S.; Asai, T.; Murata, S.; Nakamura, R.; Isa, T.; Tsuboi, Y.; Oshima, K.; Koyama, S.; Sawa, R.; Fukumoto, Y.; et al. Association between Abnormal Gait Patterns and an Elevated Degree of Pain after Daily Walking: A Preliminary Study. Int. J. Environ. Res. Public Health 2022, 19, 2842. [Google Scholar] [CrossRef]
- Strutzenberger, G.; Claußen, L.; Schwameder, H. Analysis of sloped gait: How many steps are needed to reach steady-state walking speed after gait initiation? Gait Posture 2021, 83, 167–173. [Google Scholar] [CrossRef]
- Demura, T.; Demura, S.I. Relationship among gait parameters while walking with varying loads. J. Physiol. Anthropol. 2010, 29, 29–34. [Google Scholar] [CrossRef]
- Gieysztor, E.; Kowal, M.; Paprocka-Borowicz, M. Primitive Reflex Factors Influence Walking Gait in Young Children: An Observational Study. Int. J. Environ. Res. Public Health 2022, 19, 4070. [Google Scholar] [CrossRef] [PubMed]
- Nohelova, D.; Bizovska, L.; Vuillerme, N.; Svoboda, Z. Article gait variability and complexity during single and dual-task walking on different surfaces in outdoor environment. Sensors 2021, 21, 4792. [Google Scholar] [CrossRef] [PubMed]
- McCrum, C.; Willems, P.; Karamanidis, K.; Meijer, K. Stability-normalised walking speed: A new approach for human gait perturbation research. J. Biomech. 2019, 87, 48–53. [Google Scholar] [CrossRef]
- Lu, C.; Louie, K.H.; Twedell, E.L.; Vitek, J.L.; MacKinnon, C.D.; Cooper, S.E. Overground versus treadmill walking in Parkinson’s disease: Relationship between speed and spatiotemporal gait metrics. Gait Posture 2022, 93, 96–101. [Google Scholar] [CrossRef]
- O’Callaghan, B.P.F.; Doheny, E.P.; Goulding, C.; Fortune, E.; Lowery, M.M. Adaptive gait segmentation algorithm for walking bout detection using tri-axial accelerometers. In Proceedings of the 2020 42nd Annual International Conference of the IEEE Engineering in Medicine & Biology Society (EMBC), Montreal, QC, Canada, 20–24 July 2020; Volume 2020, pp. 4592–4595. [Google Scholar] [CrossRef]
- Hoffmann, R.; Brodowski, H.; Steinhage, A.; Grzegorzek, M. Detecting walking challenges in gait patterns using a capacitive sensor floor and recurrent neural networks. Sensors 2021, 21, 1086. [Google Scholar] [CrossRef]
- Yang, X.; Jiang, L.; Giri, S.; Ostadabbas, S.; Abdollah Mirbozorgi, S. A Wearable Walking Gait Speed-Sensing Device using Frequency Bifurcations of Multi-Resonator Inductive Link. In Proceedings of the 2021 43rd Annual International Conference of the IEEE Engineering in Medicine & Biology Society (EMBC), Virtual Conference, 1–5 November 2021; pp. 7272–7275. [Google Scholar] [CrossRef]
- Fan, Y.; Li, Z.; Han, S.; Lv, C.; Zhang, B. The influence of gait speed on the stability of walking among the elderly. Gait Posture 2016, 47, 31–36. [Google Scholar] [CrossRef] [PubMed]
- Hagoort, I.; Vuillerme, N.; Hortobágyi, T.; Lamoth, C.J. Outcome-dependent effects of walking speed and age on quantitative and qualitative gait measures. Gait Posture 2022, 93, 39–46. [Google Scholar] [CrossRef]
- Balasukumaran, T.; Gottlieb, U.; Springer, S. Spatiotemporal gait characteristics and ankle kinematics of backward walking in people with chronic ankle instability. Sci. Rep. 2020, 10, 11515. [Google Scholar] [CrossRef]
- Huijben, B.; van Schooten, K.S.; van Dieën, J.H.; Pijnappels, M. The effect of walking speed on quality of gait in older adults. Gait Posture 2018, 65, 112–116. [Google Scholar] [CrossRef]
- Prosser, L.A.; Atkinson, H.L.; Alfano, J.M.; Kessler, S.K.; Ichord, R.B. Walking speed influences spatiotemporal but not symmetry measures of gait in children and adolescents with hemiplegia. Gait Posture 2022, 98, 233–236. [Google Scholar] [CrossRef]
- Jordan, K.; Challis, J.H.; Newell, K.M. Walking speed influences on gait cycle variability. Gait Posture 2007, 26, 128–134. [Google Scholar] [CrossRef] [PubMed]
- Hausdorff, J.M. Gait variability: Methods, modeling and meaning. J. Neuroeng. Rehabil. 2005, 2, 19. [Google Scholar] [CrossRef] [PubMed]
- Armitano-Lago, C.; Davis-Wilson, H.C.; Evans-Pickett, A.; Lisee, C.; Kershner, C.E.; Blackburn, T.; Franz, J.R.; Kiefer, A.W.; Nissman, D.; Pietrosimone, B. Gait Variability Structure Linked to Worse Cartilage Composition Post-ACL Reconstruction. Med. Sci. Sport. Exerc. 2023, 55, 1499–1506. [Google Scholar] [CrossRef] [PubMed]
- Padulo, J.; Ayalon, M.; Barbieri, F.A.; Di Capua, R.; Doria, C.; Ardigò, L.P.; Dello Iacono, A. Effects of Gradient and Speed on Uphill Running Gait Variability. Sports Health 2023, 15, 67–73. [Google Scholar] [CrossRef] [PubMed]
- Vieira, M.F.; Rodrigues, F.B.; de Sá e Souza, G.S.; Magnani, R.M.; Lehnen, G.C.; Campos, N.G.; Andrade, A.O. Gait stability, variability and complexity on inclined surfaces. J. Biomech. 2017, 54, 73–79. [Google Scholar] [CrossRef]
- Kim, B.; Youm, C.; Park, H.; Lee, M.; Noh, B. Characteristics of Gait Variability in the Elderly While Walking on a Treadmill with Gait Speed Variation. Int. J. Environ. Res. Public Health 2021, 8, 4704. [Google Scholar] [CrossRef]
- Dasilva, S.G.; Guidetti, L.; Buzzachera, C.F.; Elsangedy, H.M.; Krinski, K.; De Campos, W.; Goss, F.L.; Baldari, C. Psychophysiological responses to self-paced treadmill and overground exercise. Med. Sci. Sports Exerc. 2011, 43, 1114–1124. [Google Scholar] [CrossRef] [PubMed]
- Padulo, J.; Chamari, K.; Ardigò, L.P. Walking and running on treadmill: The standard criteria for kinematics studies. Muscles. Ligaments Tendons J. 2014, 4, 159–162. [Google Scholar] [CrossRef]
- Owings, T.M.; Grabiner, M.D. Measuring step kinematic variability on an instrumented treadmill: How many steps are enough? J. Biomech. 2003, 36, 1215–1218. [Google Scholar] [CrossRef]
- Gilgen-Ammann, R.; Schweizer, T.; Wyss, T. Accuracy of distance recordings in eight positioning-enabled sport watches: Instrument validation study. JMIR mHealth uHealth 2020, 8, e17118. [Google Scholar] [CrossRef]
- Perri, M.G.; Anton, S.D.; Durning, P.E.; Ketterson, T.U.; Sydeman, S.J.; Berlant, N.E.; Kanasky, W.F.; Newton, R.L.; Limacher, M.C.; Daniel Martin, A. Adherence to exercise prescriptions: Effects of prescribing moderate versus higher levels of intensity and frequency. Health Psychol. 2002, 21, 452–458. [Google Scholar] [CrossRef]
- García-Pinillos, F.; Latorre-Román, P.A.; Soto-Hermoso, V.M.; Párraga-Montilla, J.A.; Pantoja-Vallejo, A.; Ramírez-Campillo, R.; Roche-Seruendo, L.E. Agreement between the spatiotemporal gait parameters from two different wearable devices and high-speed video analysis. PLoS ONE 2019, 14, e0222872. [Google Scholar] [CrossRef]
- Koo, T.K.; Li, M.Y. A Guideline of Selecting and Reporting Intraclass Correlation Coefficients for Reliability Research. J. Chiropr. Med. 2016, 15, 155–163. [Google Scholar] [CrossRef]
- Cohen, J. Statistical Power Analysis for the Behavioral Sciences; Routledge: London, UK, 2013; ISBN 9780203771587. [Google Scholar]
- Chung, M.J.; Wang, M.J.J. The change of gait parameters during walking at different percentage of preferred walking speed for healthy adults aged 20-60 years. Gait Posture 2010, 31, 131–135. [Google Scholar] [CrossRef] [PubMed]
- Sloot, L.H.; van der Krogt, M.M.; Harlaar, J. Self-paced versus fixed speed treadmill walking. Gait Posture 2014, 39, 478–484. [Google Scholar] [CrossRef] [PubMed]
- Foster, C.; Florhaug, J.A.; Franklin, J.; Gottschall, L.; Hrovatin, L.A.; Parker, S.; Doleshal, P.; Dodge, C. A New Approach to Monitoring Exercise Training. J. Strength Cond. Res. 2001, 15, 109–115. [Google Scholar] [CrossRef] [PubMed]
- Norris, B.J.; Wenning, A.; Wright, T.M.; Calabrese, R.L. Constancy and variability in the output of a central pattern generator. J. Neurosci. 2011, 31, 4663–4674. [Google Scholar] [CrossRef]
- Marks, R. The effect of restricting arm swing during normal locomotion. Biomed. Sci. Instrum. 1997, 33, 209–215. [Google Scholar]


| Variables | SS − 20 | SS | SS + 20 |
|---|---|---|---|
| CT (s) | 0.80 ± 0.07 †,‡ | 0.68 ± 0.06 $ | 0.59 ± 0.06 |
| ST (s) | 0.40 ± 0.03 | 0.39 ± 0.03 | 0.40 ± 0.03 |
| SL (cm) | 131 ± 11 †,‡ | 147 ± 10 $ | 163 ± 11 |
| SC (s) | 1.14 ± 0.21 ‡ | 1.08 ± 0.07 | 0.99 ± 0.07 |
| Variables | SS − 20 | SS | SS + 20 |
|---|---|---|---|
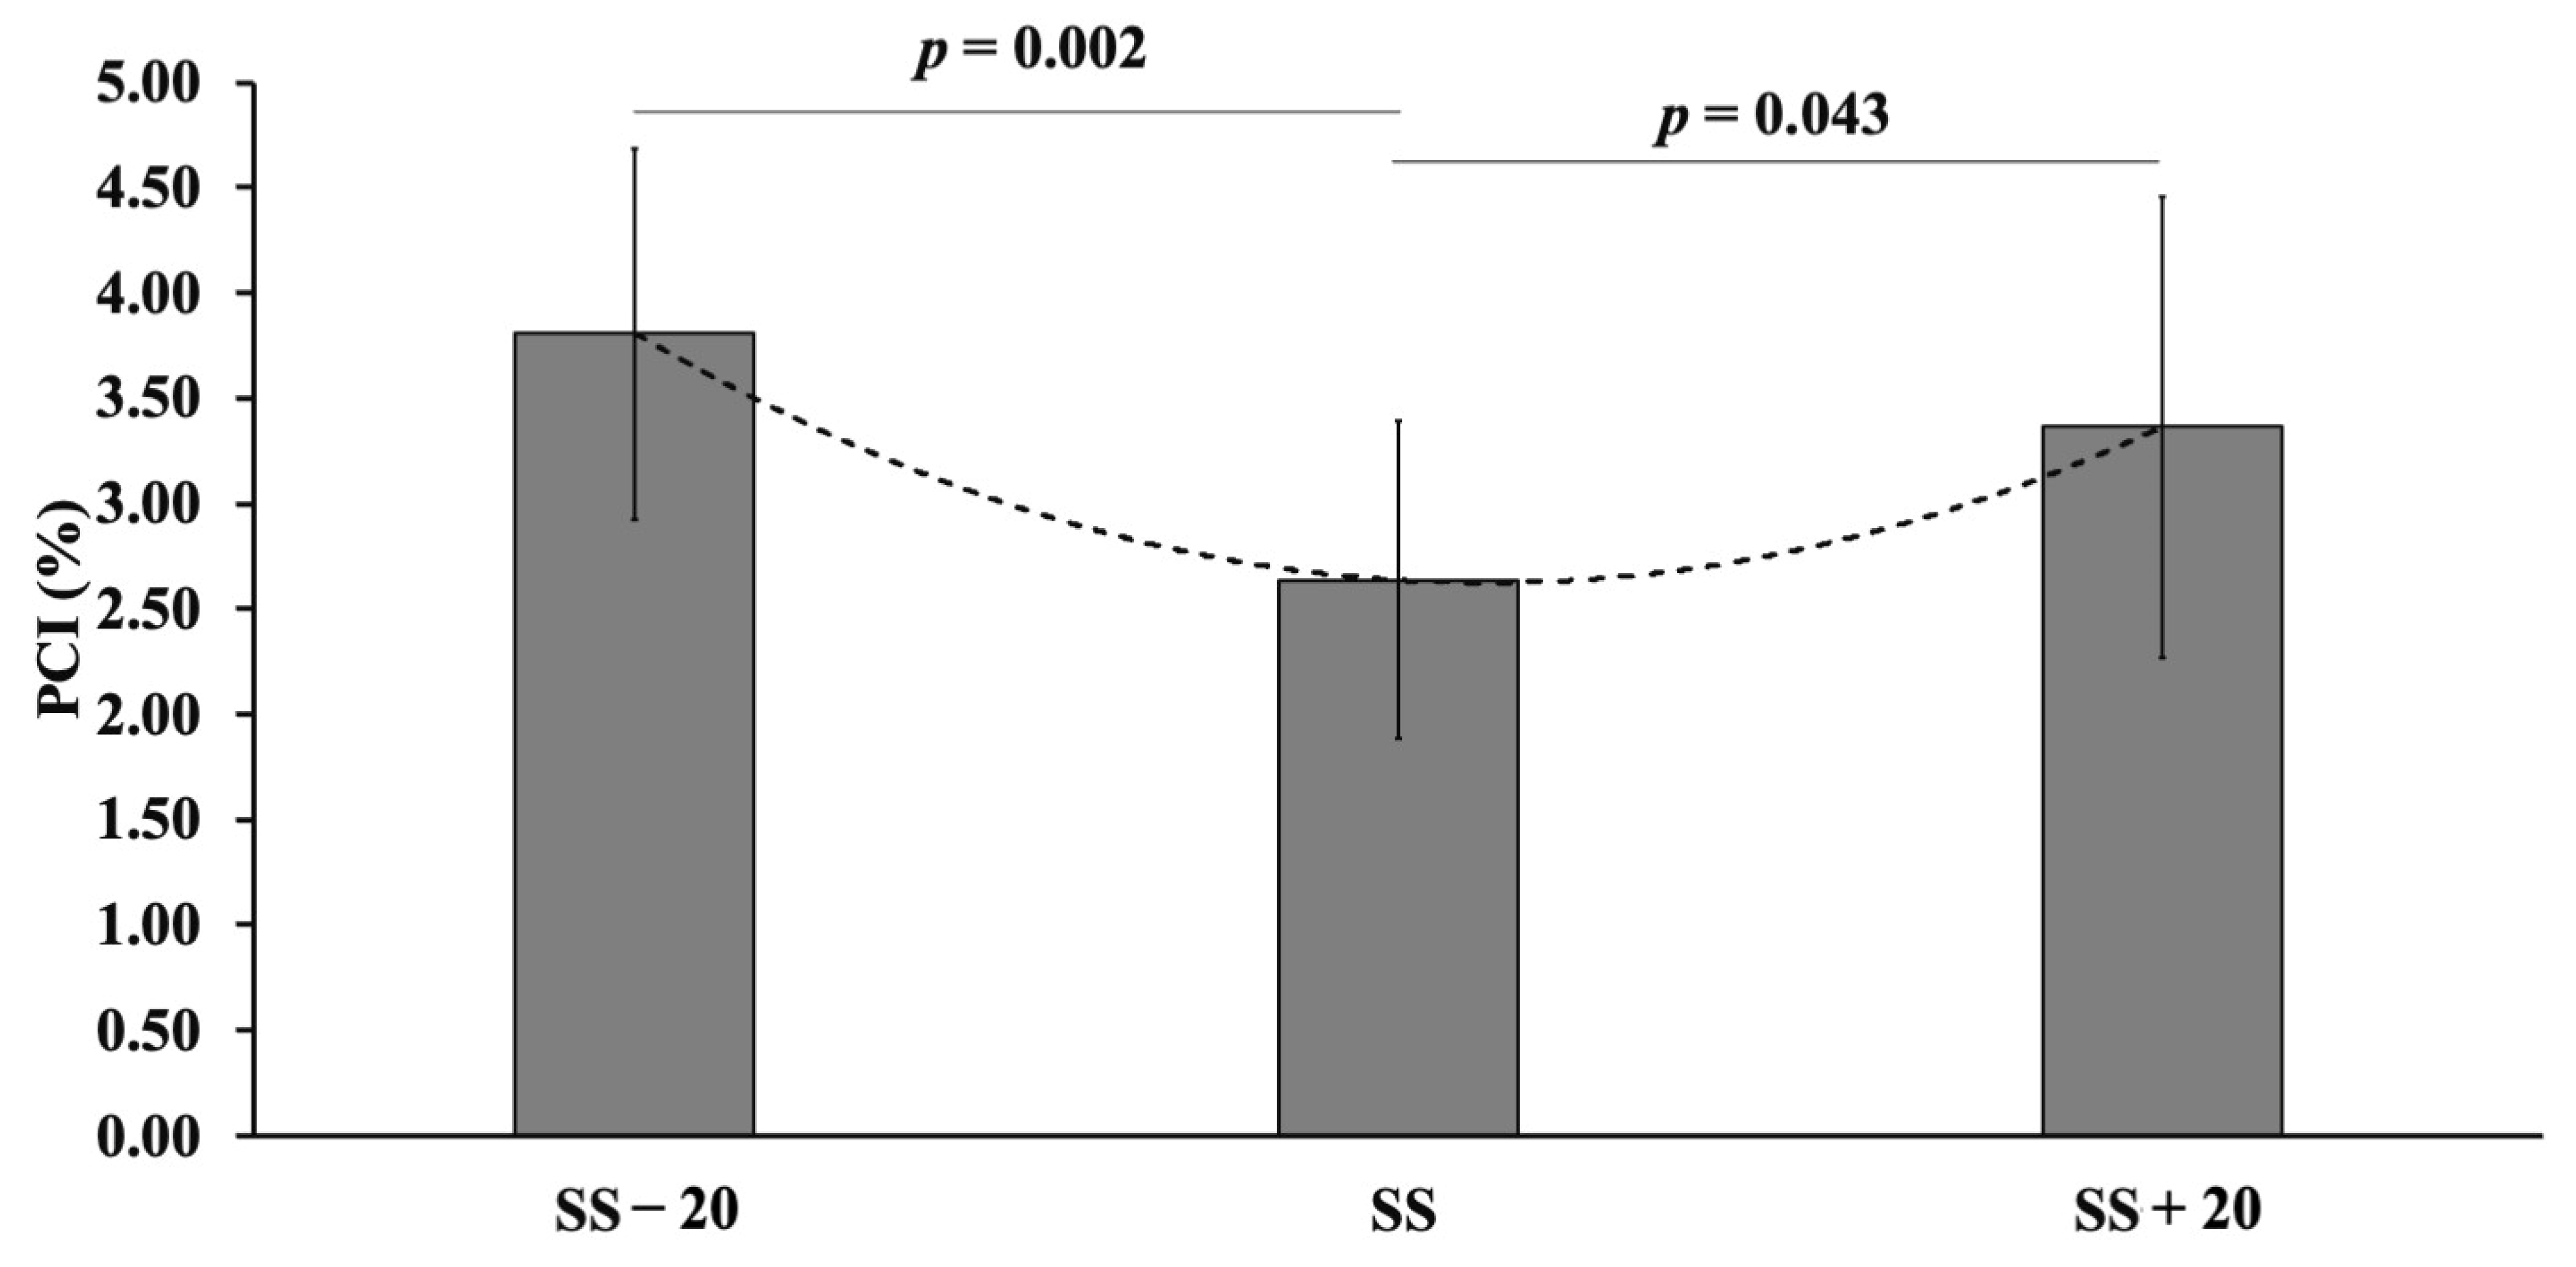
| PCI (%) | 3.81 ± 0.88 † | 2.64 ± 0.75 $ | 3.36 ± 1.09 |
| ϕ_CV (%) | 2.04 ± 0.47 † | 1.45 ± 1.83 $ | 1.83 ± 0.58 |
| ϕ_ABS (deg) | 1.77 ± 0.42 † | 1.19 ± 0.33 $ | 1.55 ± 0.51 |
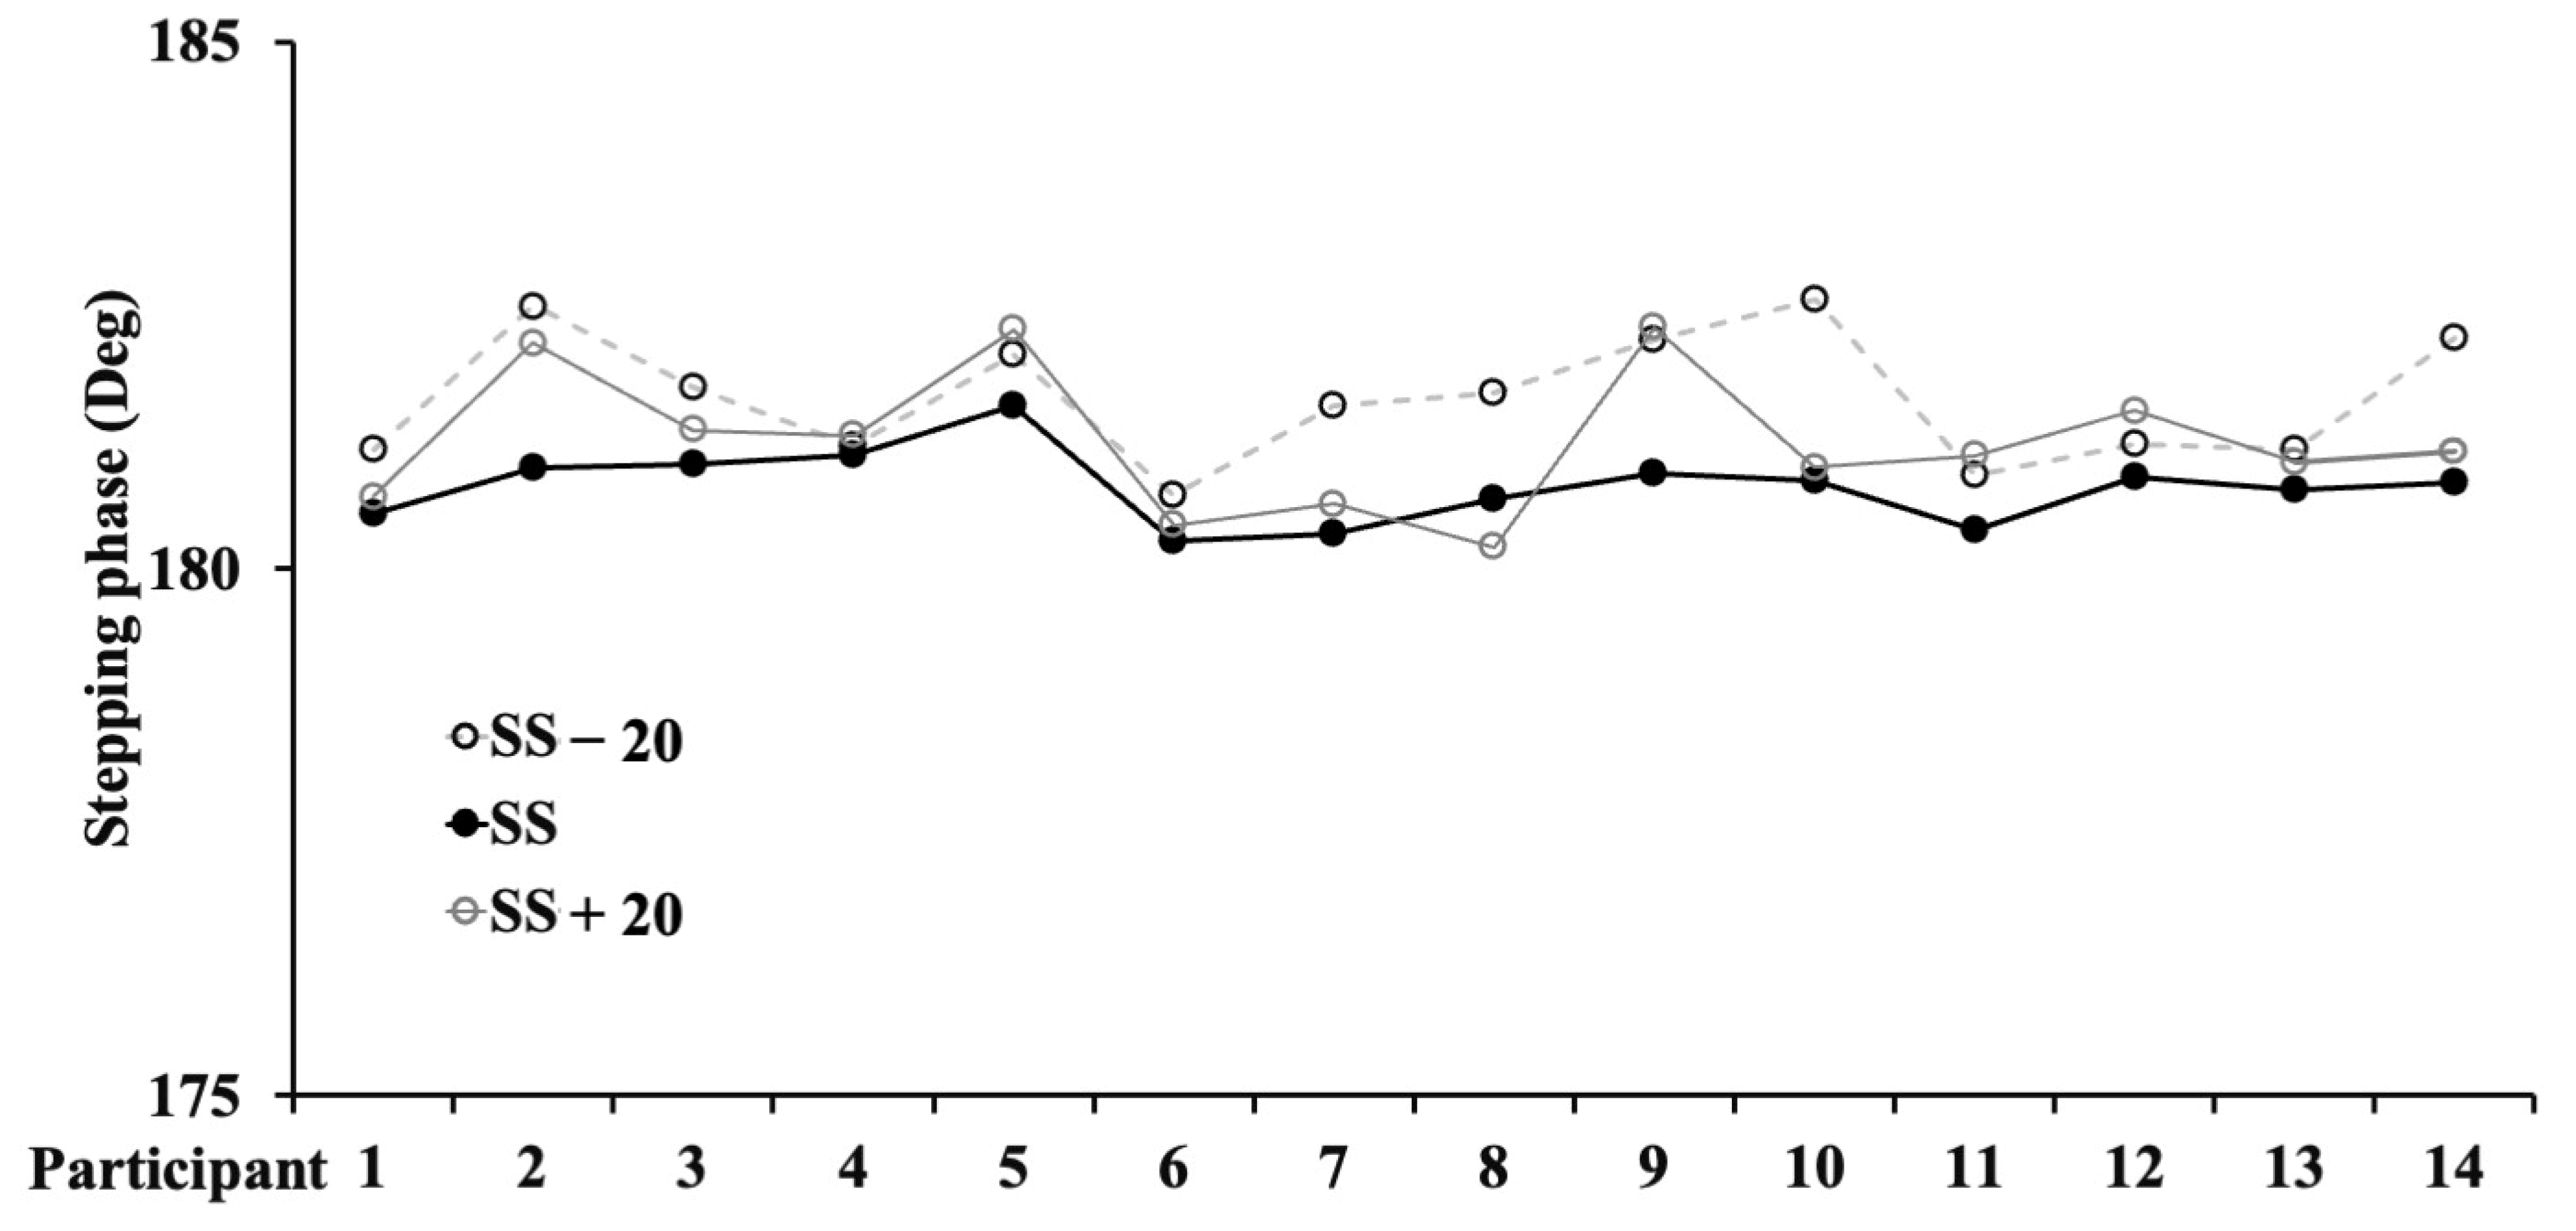
| ϕ (deg) | 182 ± 0.6 † | 181 ± 0.3 $ | 181 ± 0.7 |
Disclaimer/Publisher’s Note: The statements, opinions and data contained in all publications are solely those of the individual author(s) and contributor(s) and not of MDPI and/or the editor(s). MDPI and/or the editor(s) disclaim responsibility for any injury to people or property resulting from any ideas, methods, instructions or products referred to in the content. |
© 2023 by the authors. Licensee MDPI, Basel, Switzerland. This article is an open access article distributed under the terms and conditions of the Creative Commons Attribution (CC BY) license (https://creativecommons.org/licenses/by/4.0/).
Share and Cite
Padulo, J.; Rampichini, S.; Borrelli, M.; Buono, D.M.; Doria, C.; Esposito, F. Gait Variability at Different Walking Speeds. J. Funct. Morphol. Kinesiol. 2023, 8, 158. https://doi.org/10.3390/jfmk8040158
Padulo J, Rampichini S, Borrelli M, Buono DM, Doria C, Esposito F. Gait Variability at Different Walking Speeds. Journal of Functional Morphology and Kinesiology. 2023; 8(4):158. https://doi.org/10.3390/jfmk8040158
Chicago/Turabian StylePadulo, Johnny, Susanna Rampichini, Marta Borrelli, Daniel Maria Buono, Christian Doria, and Fabio Esposito. 2023. "Gait Variability at Different Walking Speeds" Journal of Functional Morphology and Kinesiology 8, no. 4: 158. https://doi.org/10.3390/jfmk8040158