

Reliability, Validity, and Comparison of Barbell Velocity Measurement Devices during the Jump Shrug and Hang High Pull


Abstract
:1. Introduction
2. Materials and Methods
2.1. Participants
2.2. Design
2.3. 1RM Hang Power Clean and Exercise Familiarization
2.4. Exercise Testing Sessions
2.5. Data Analyses
2.6. Statistical Analyses
3. Results
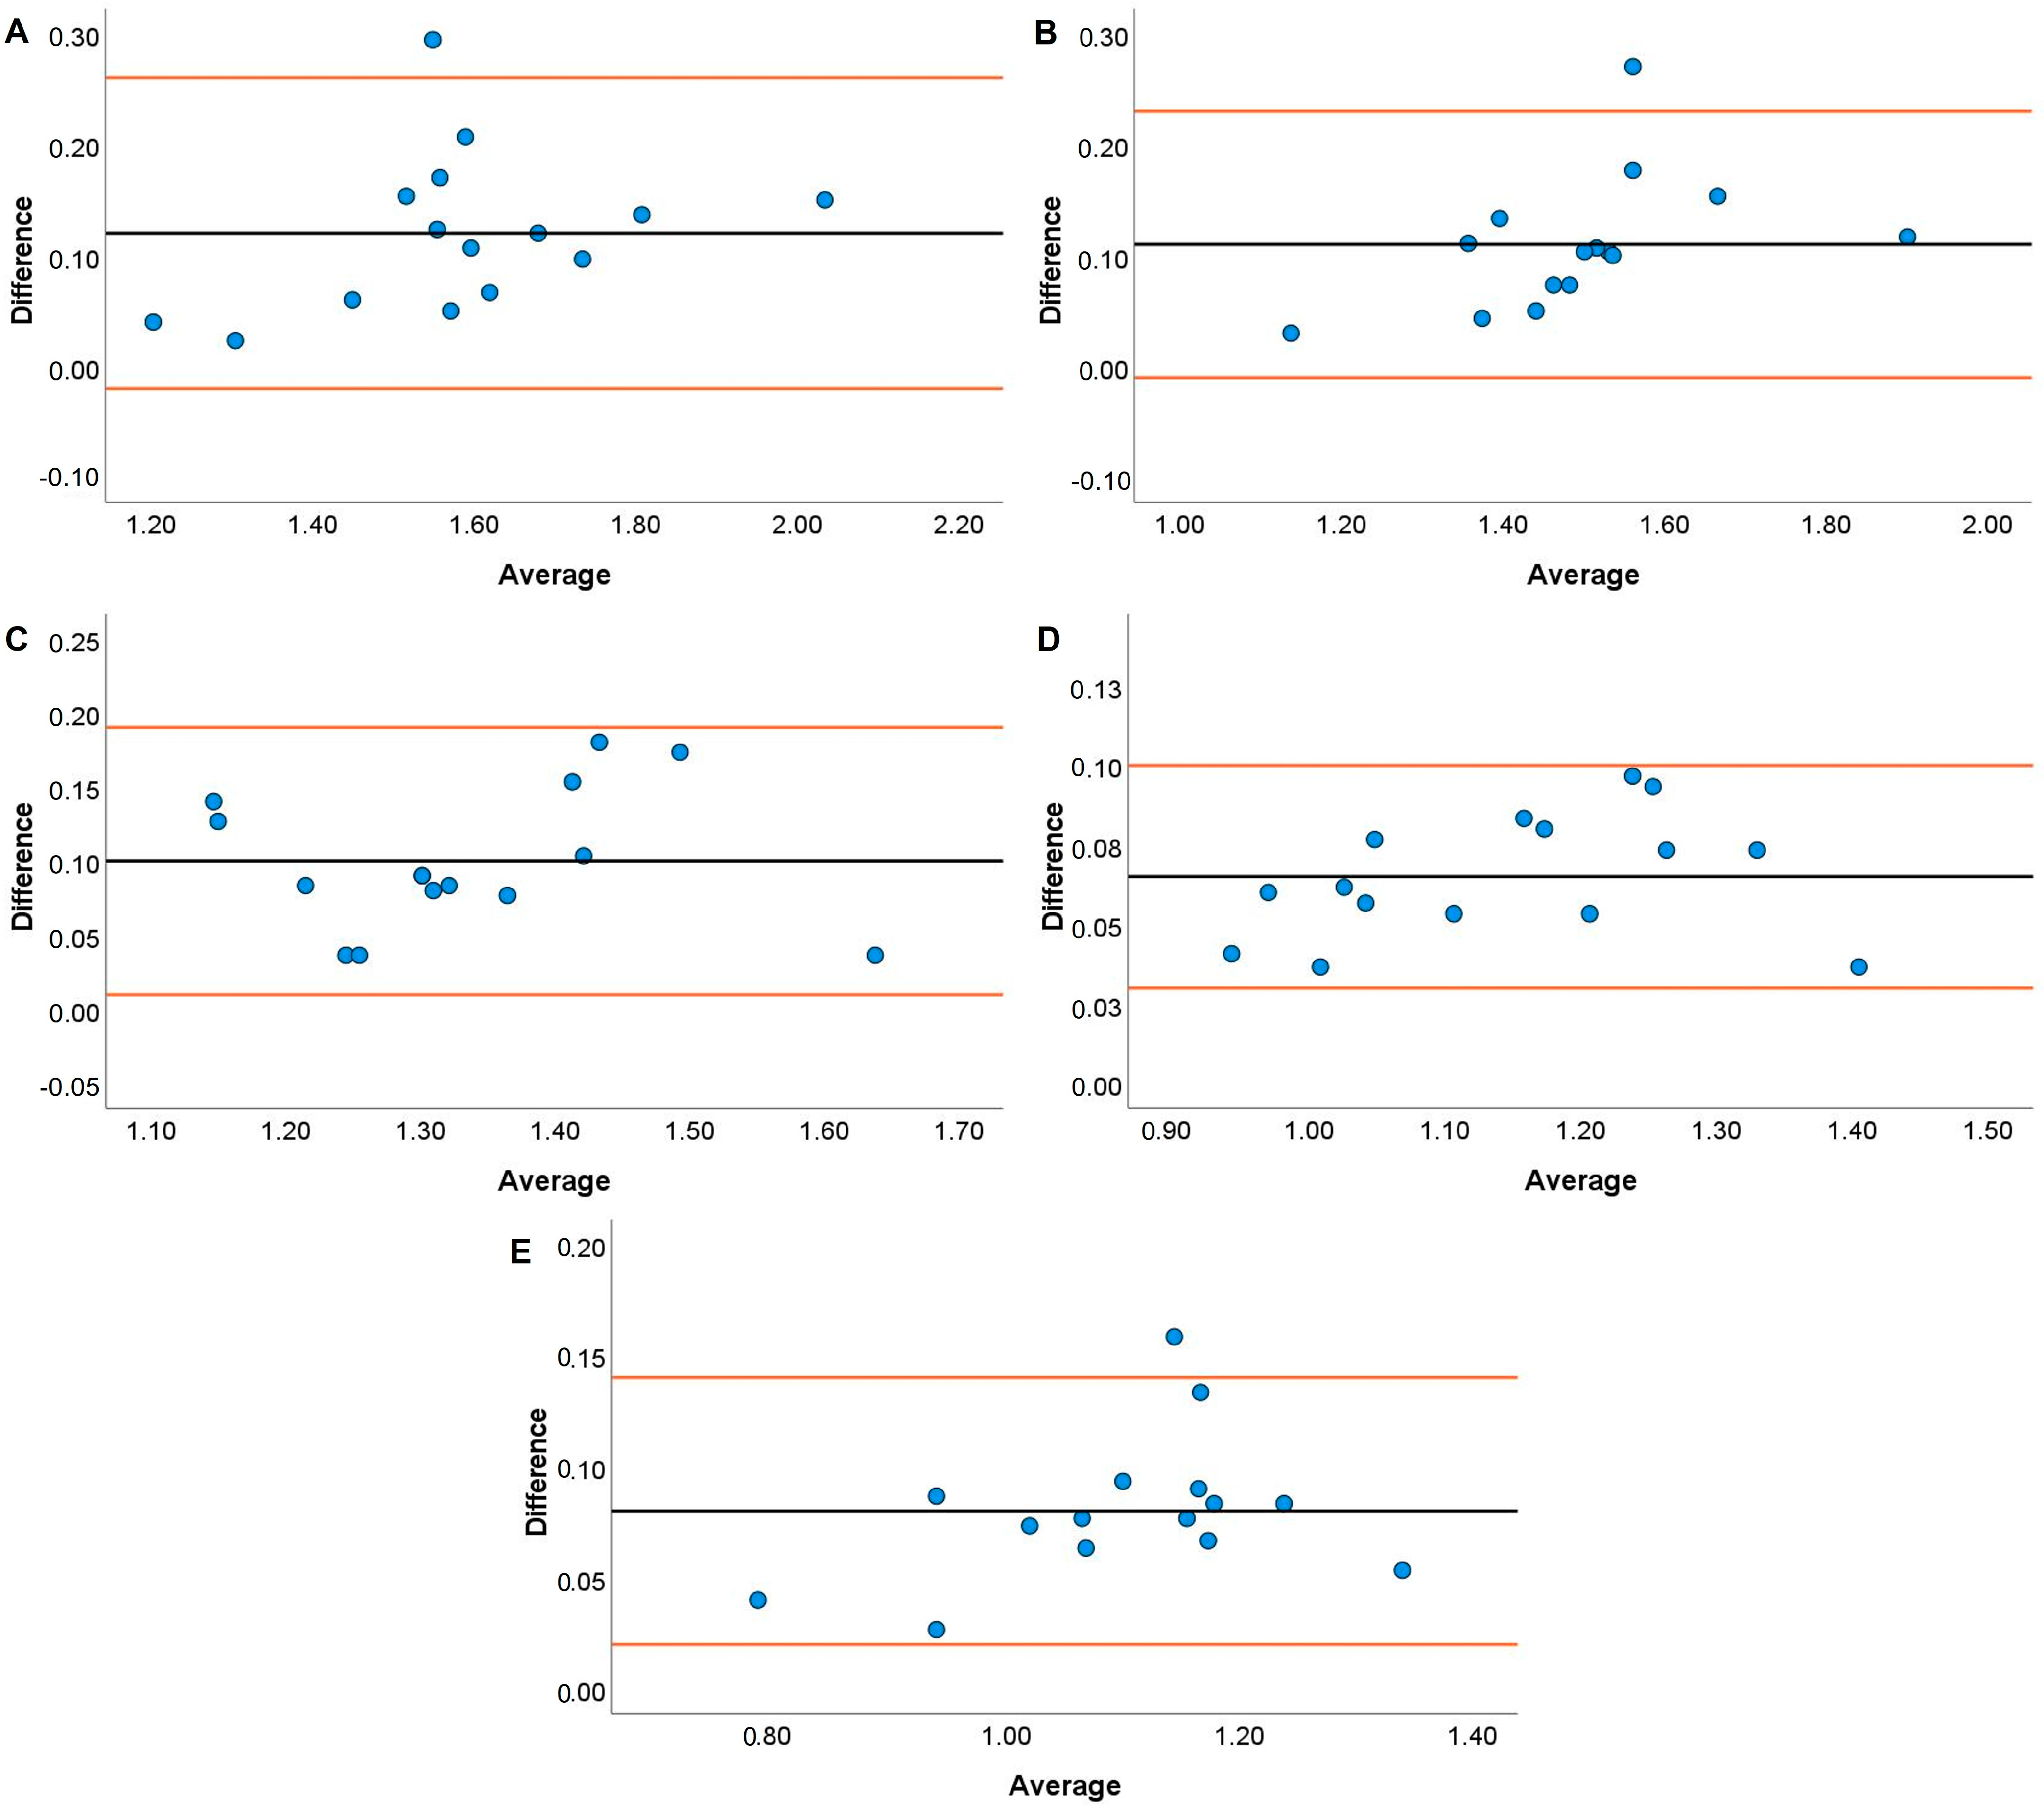
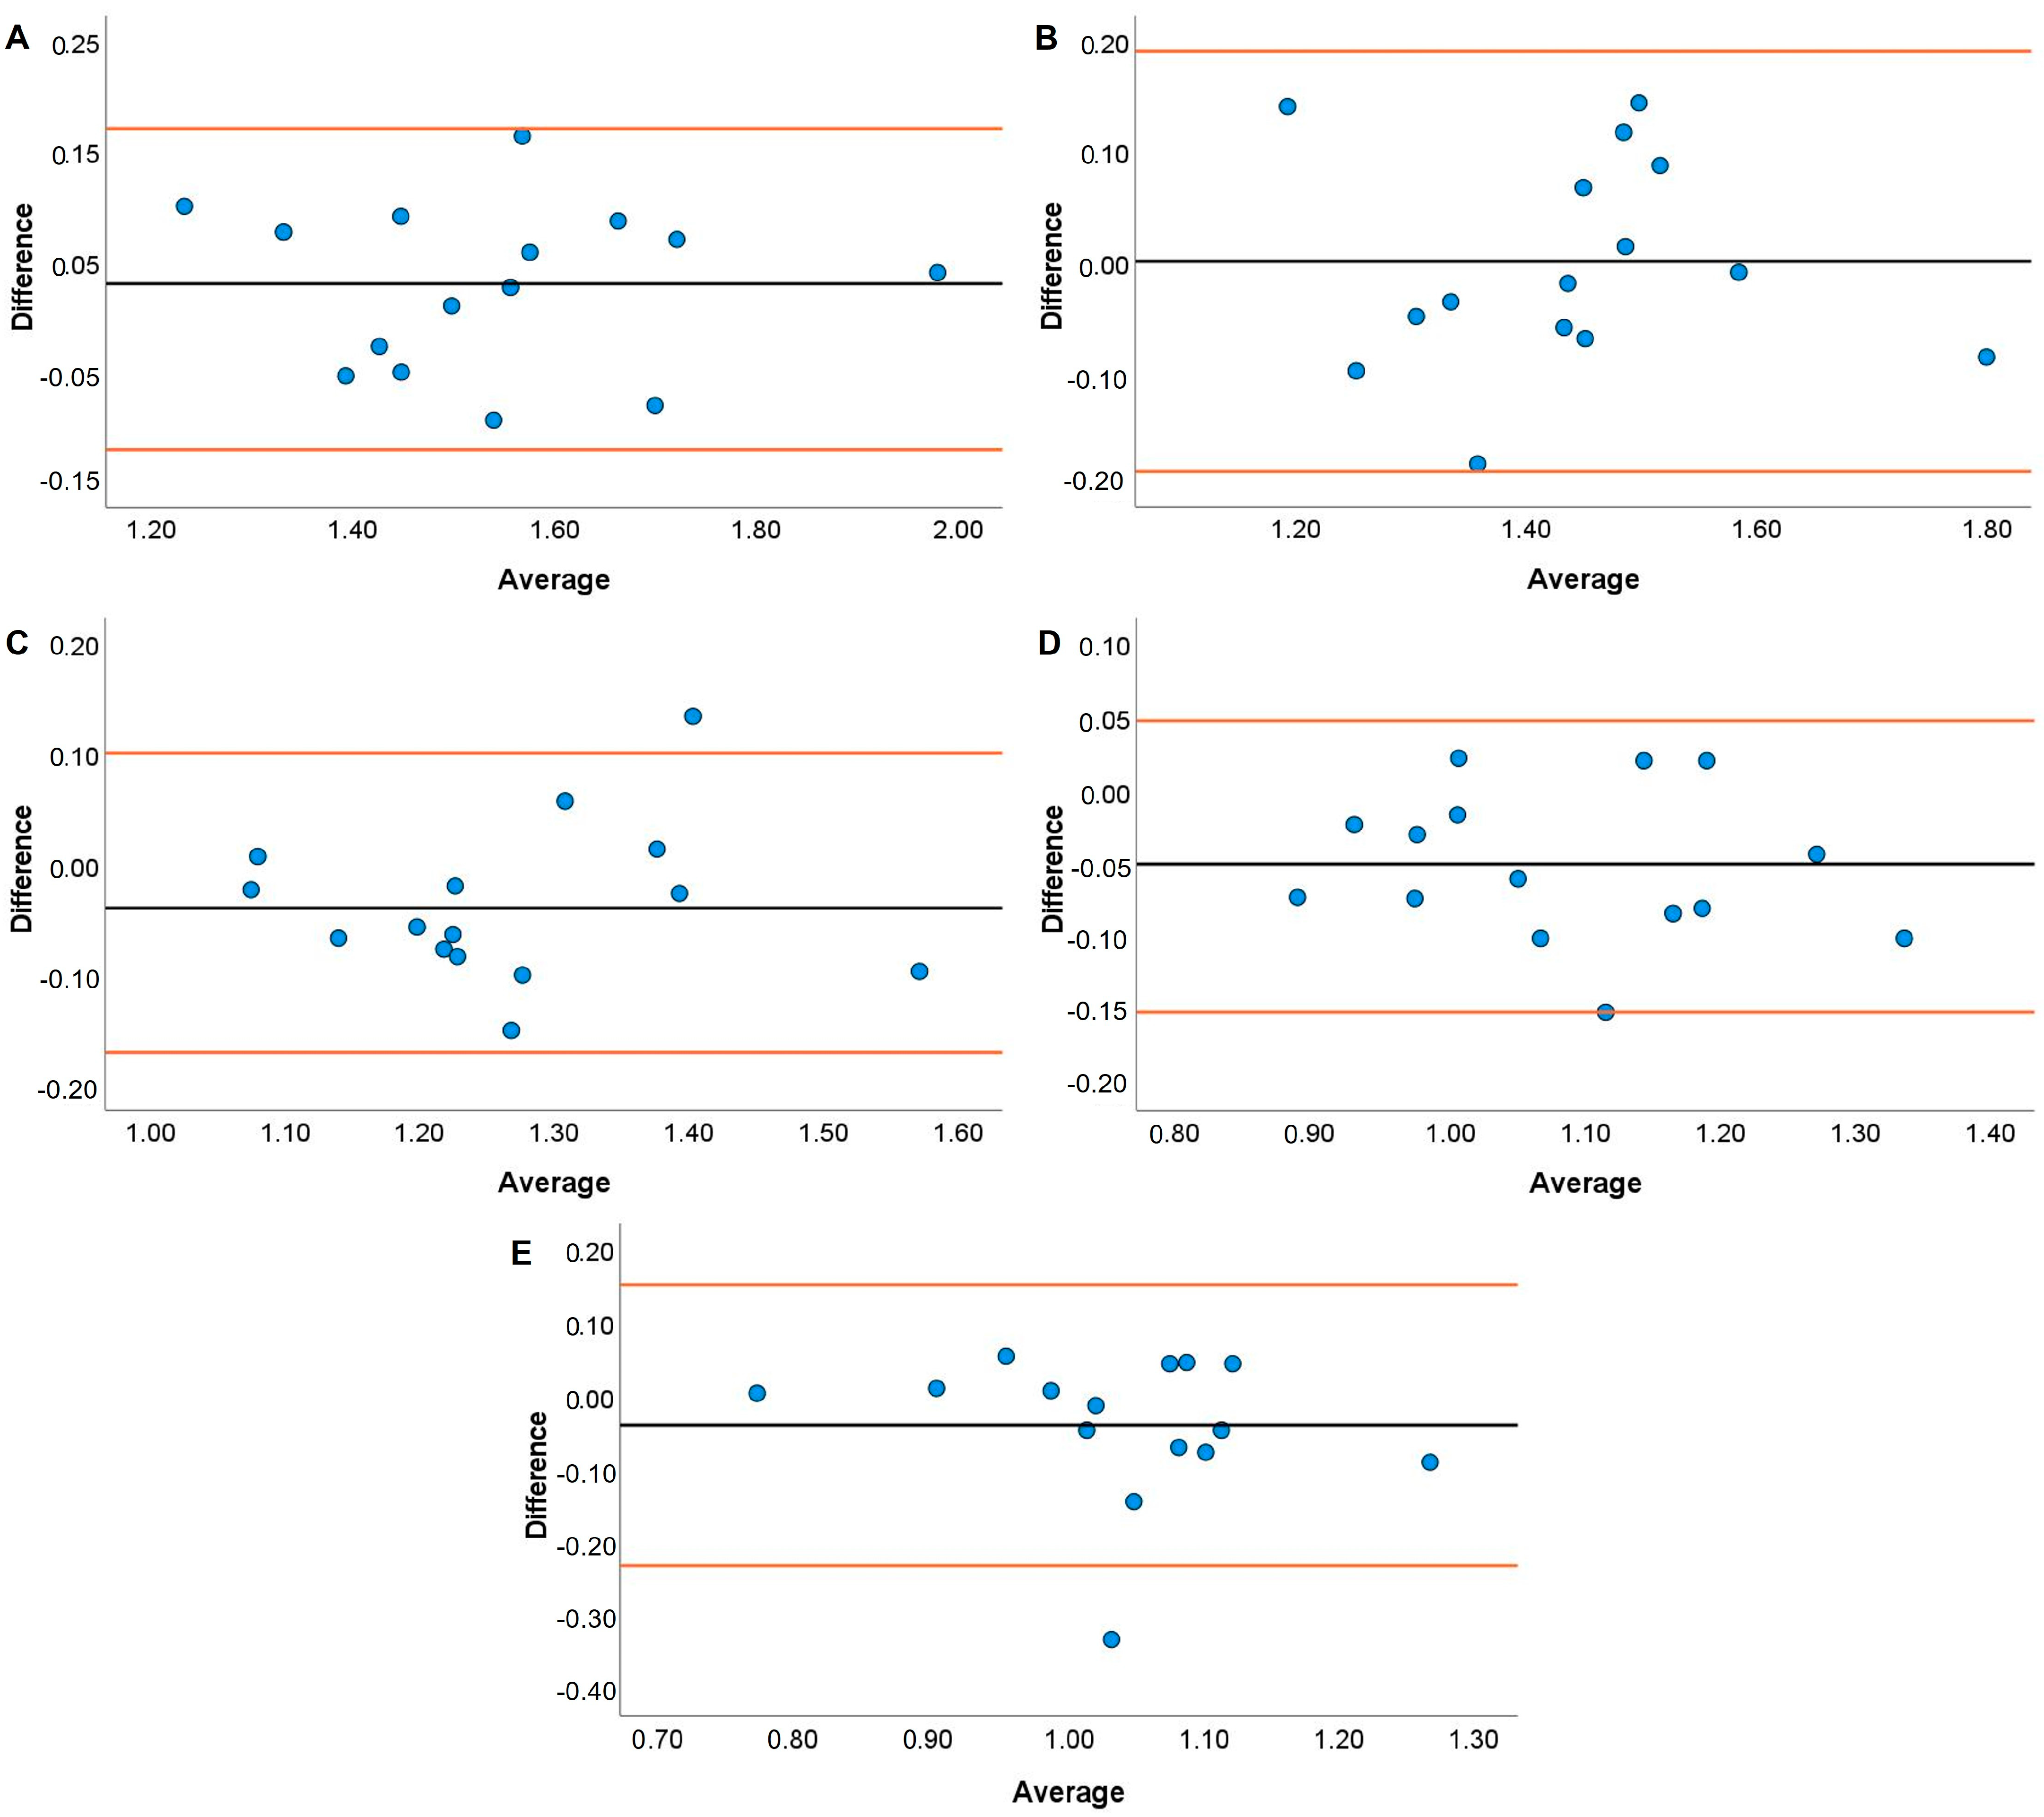
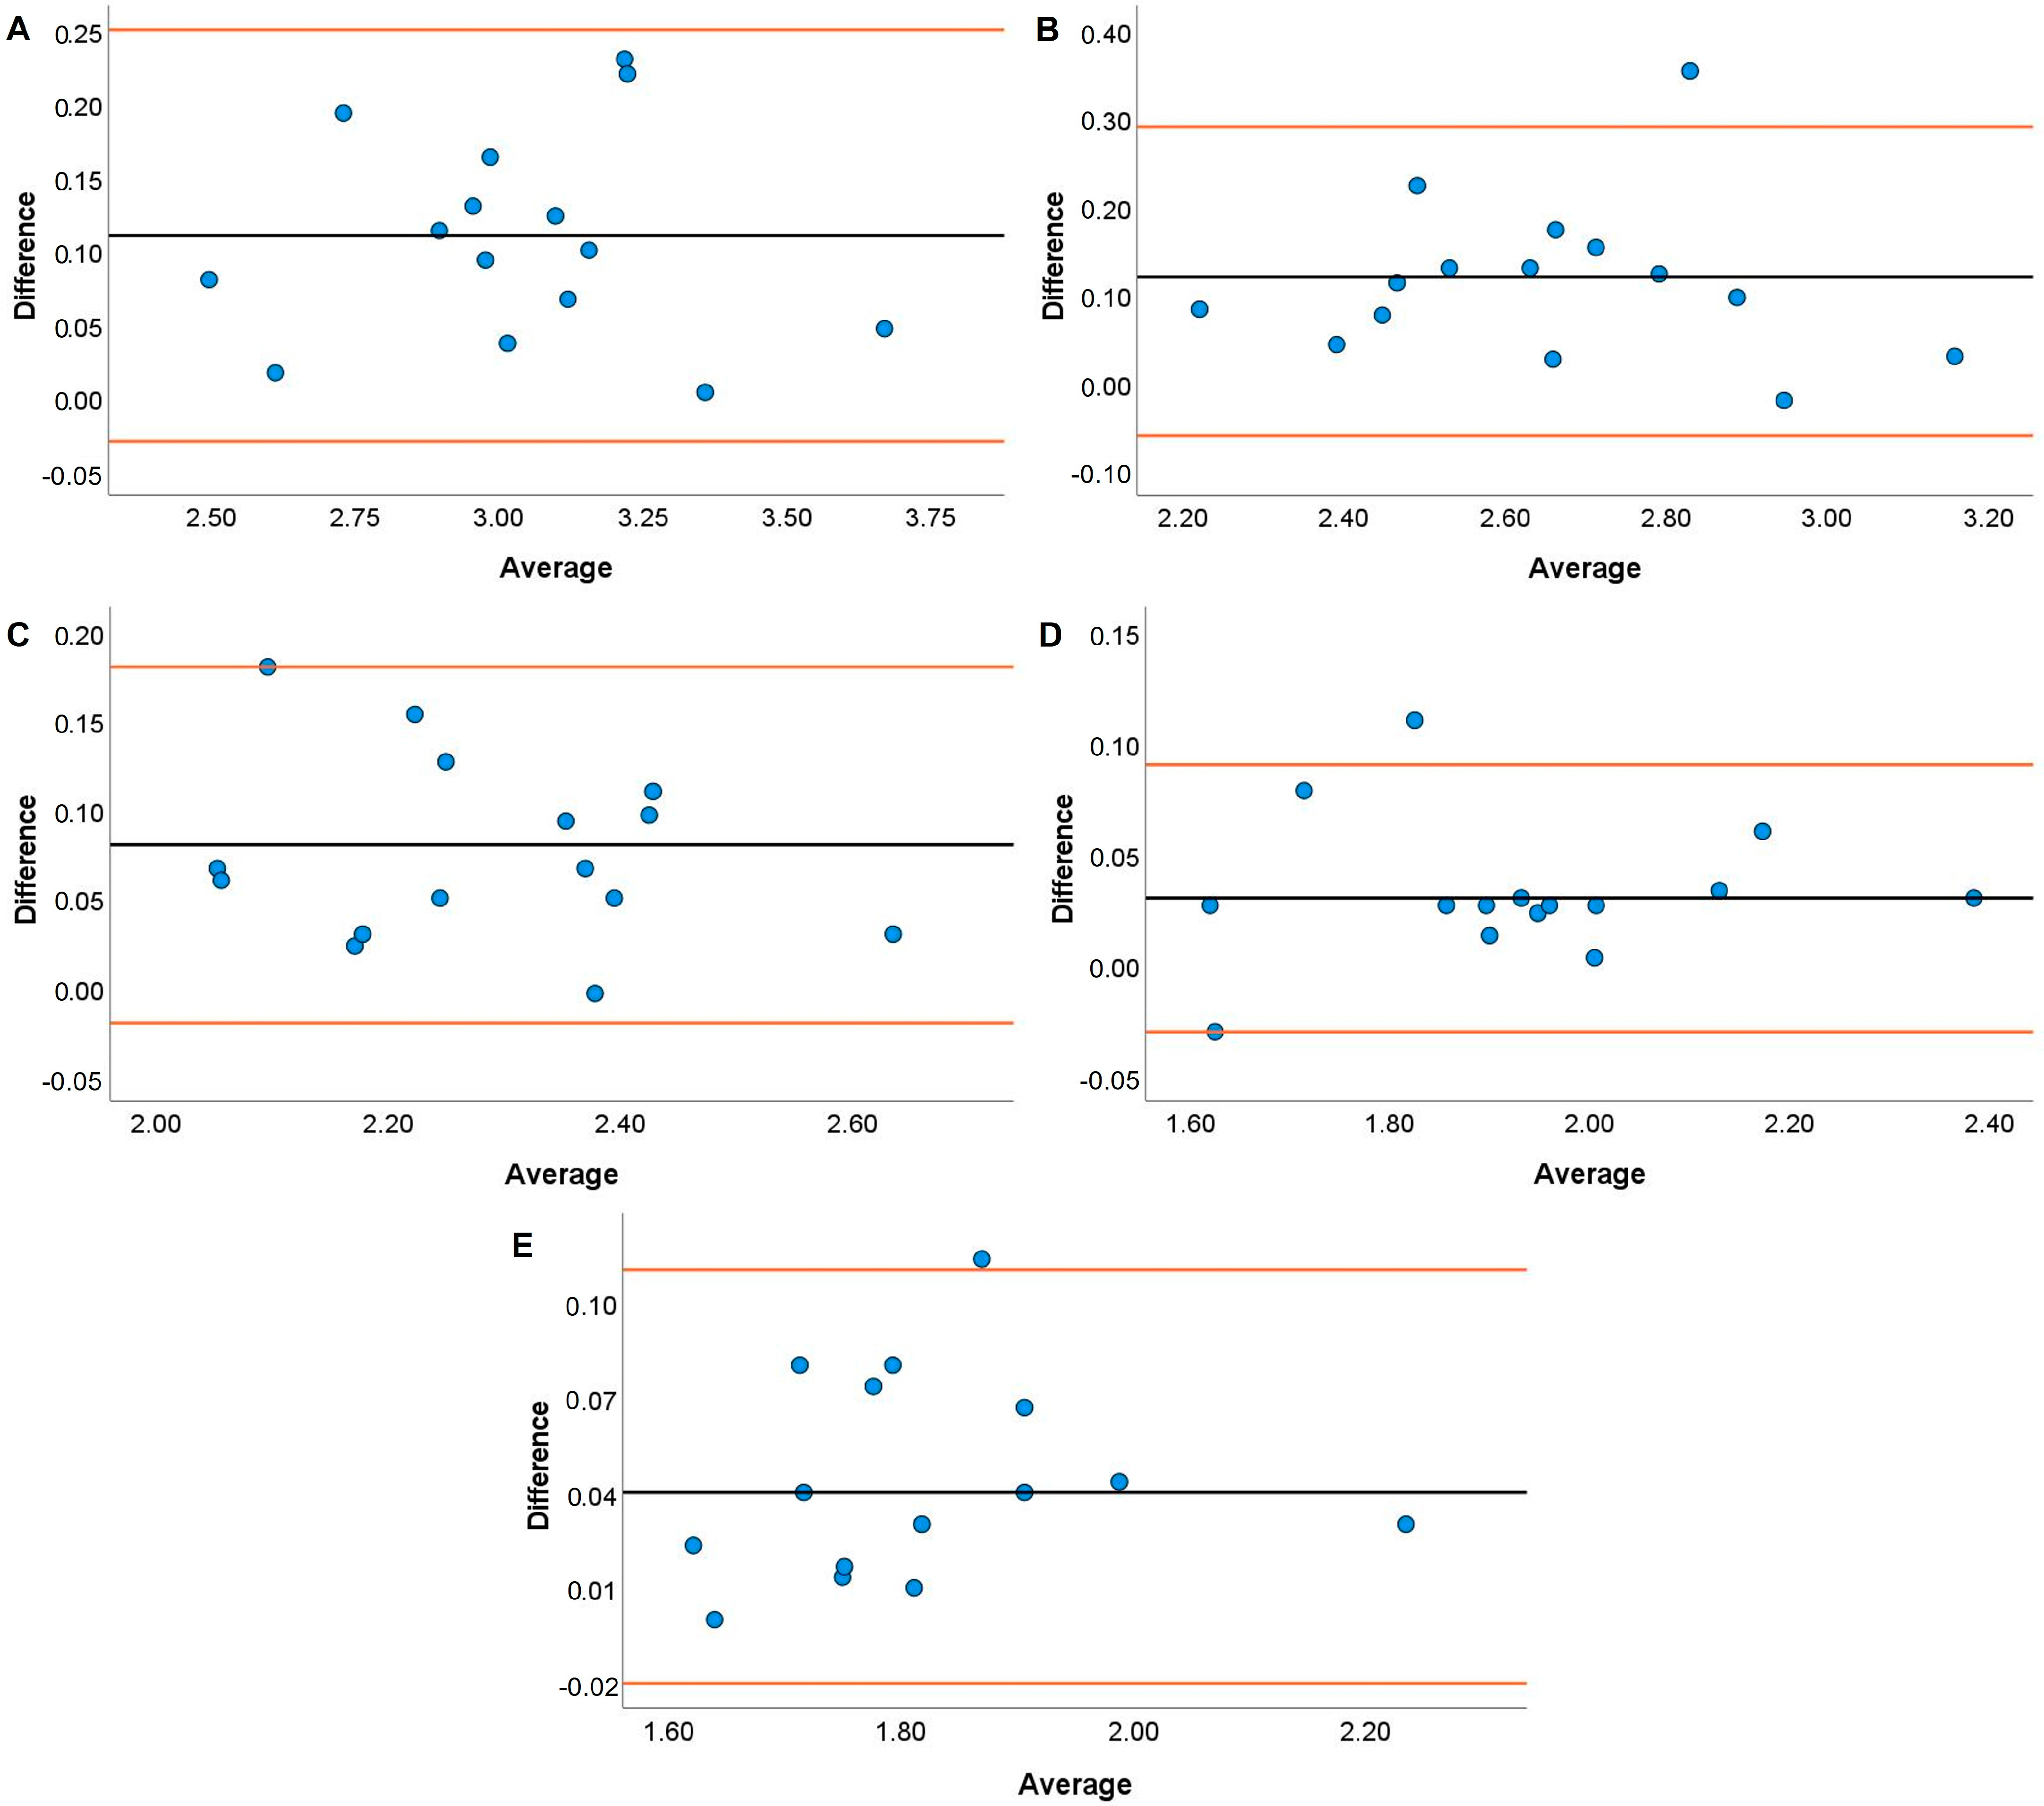
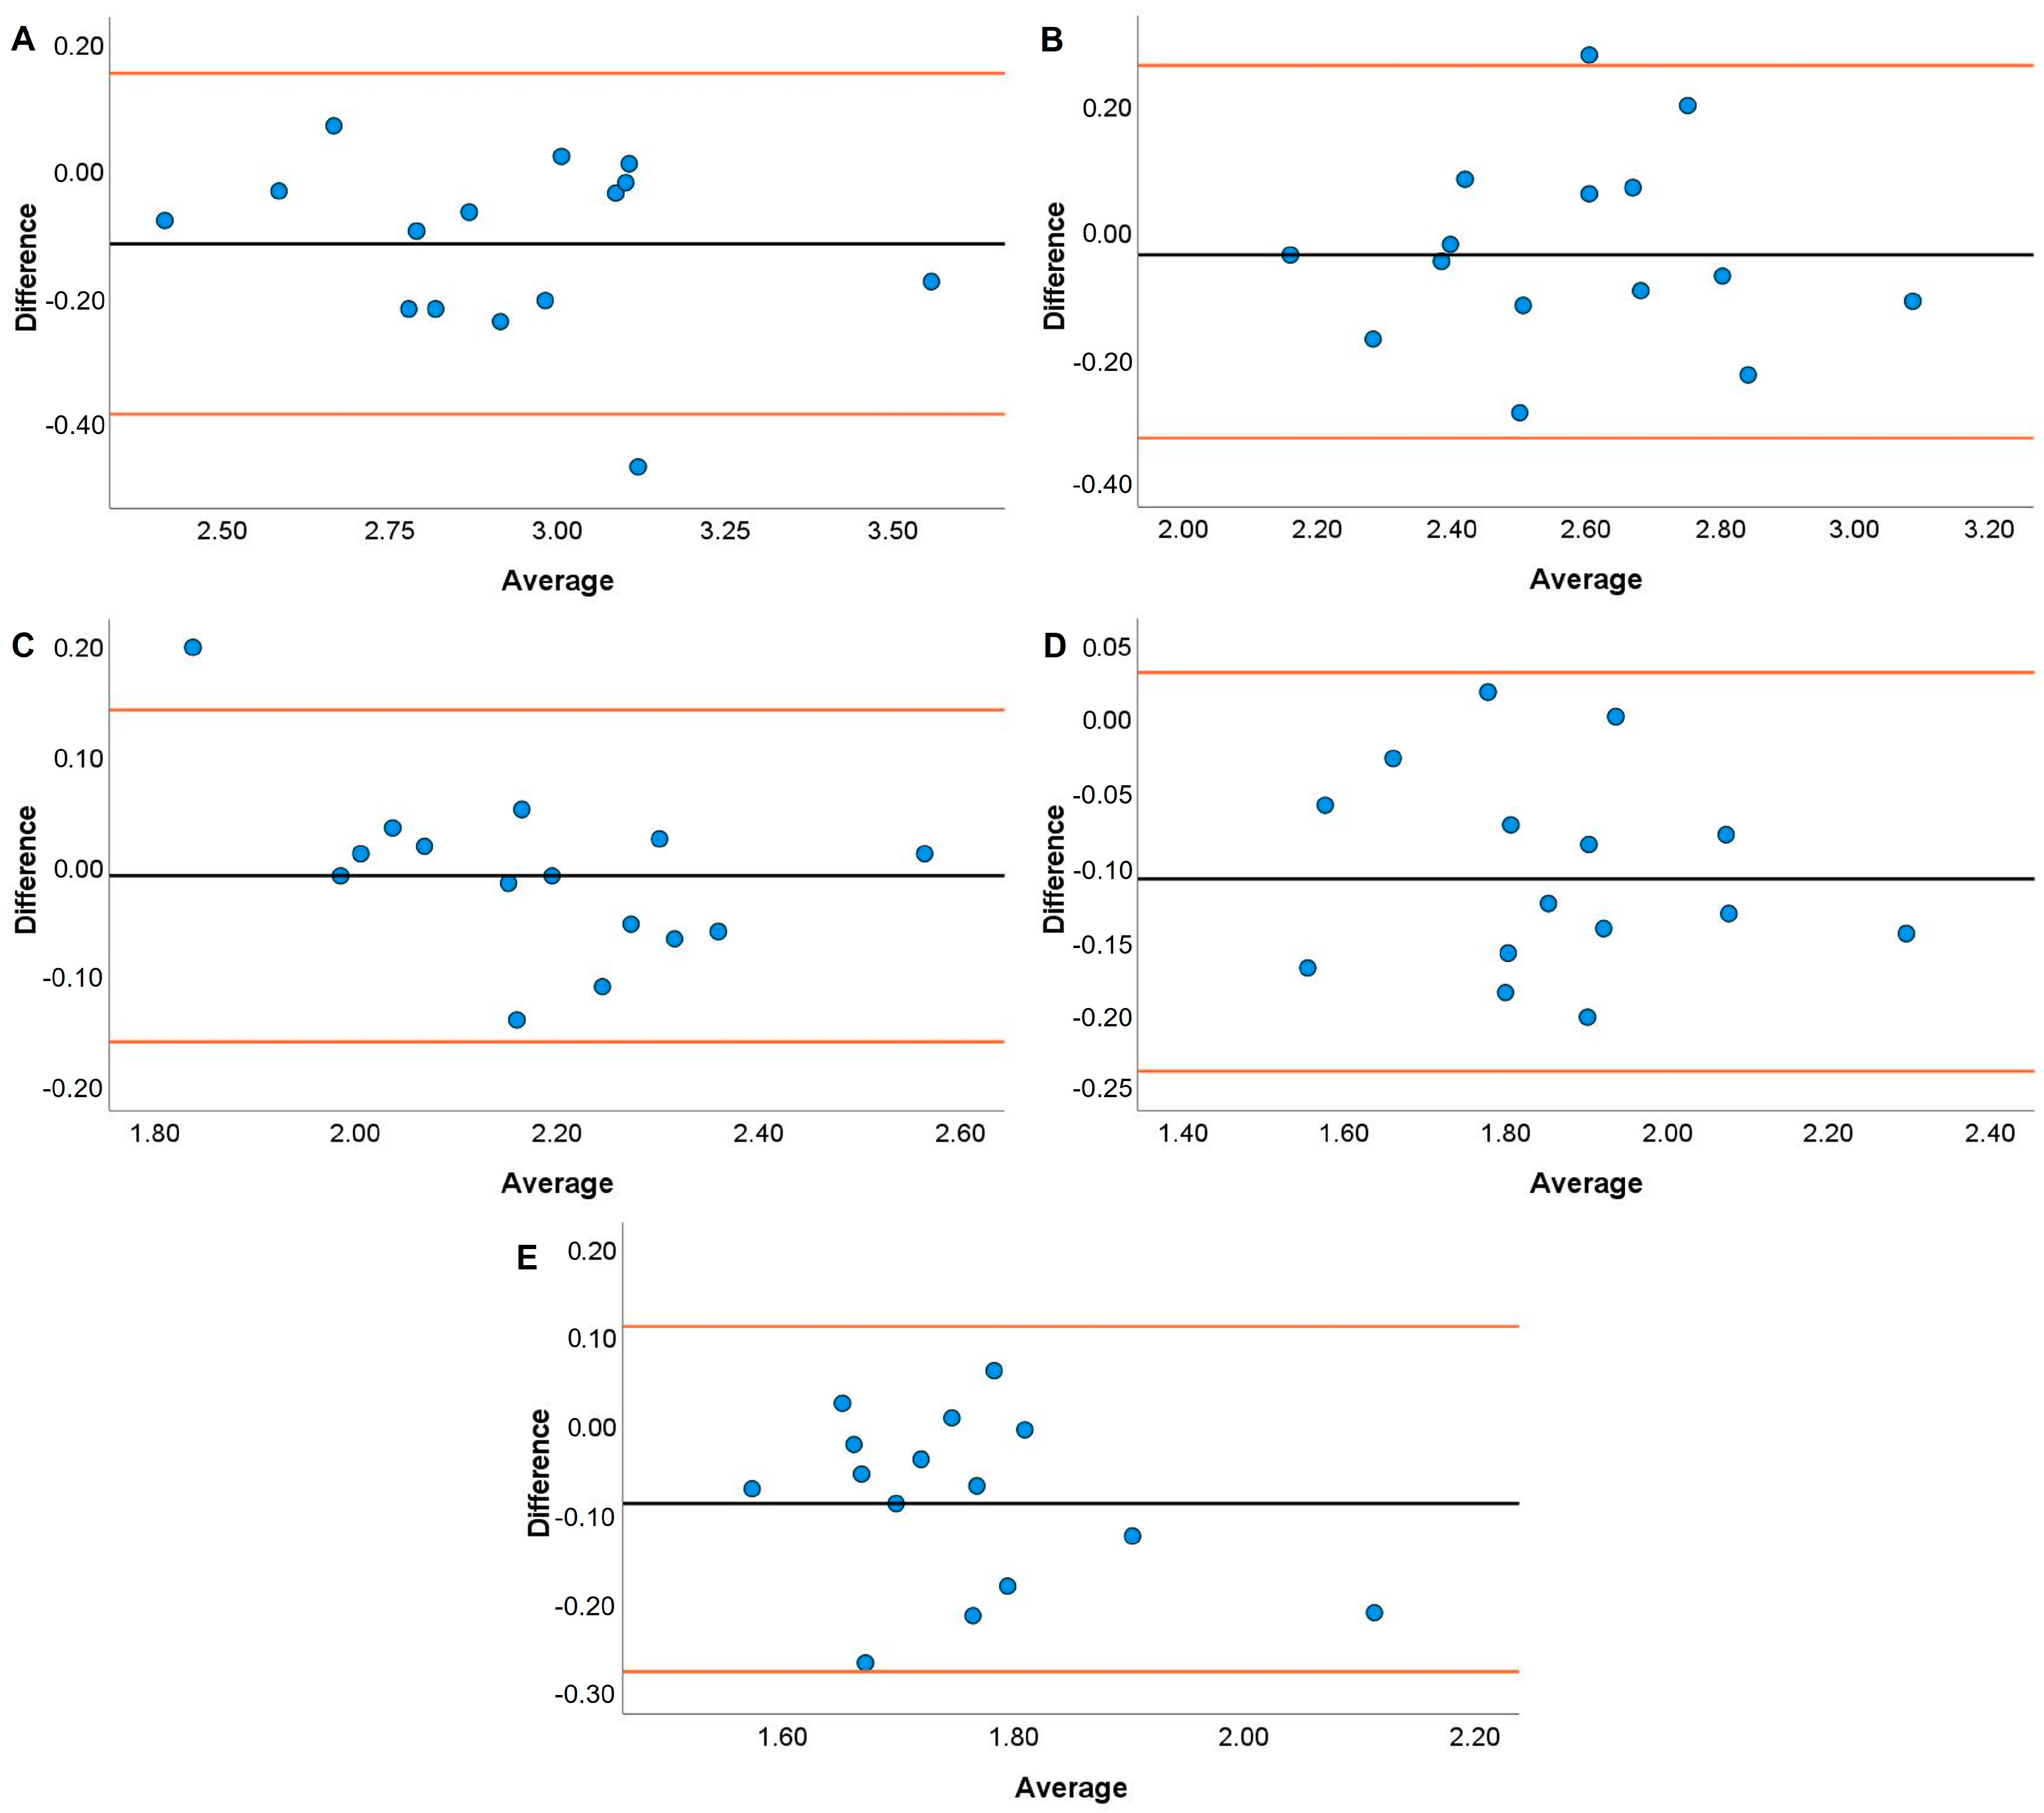
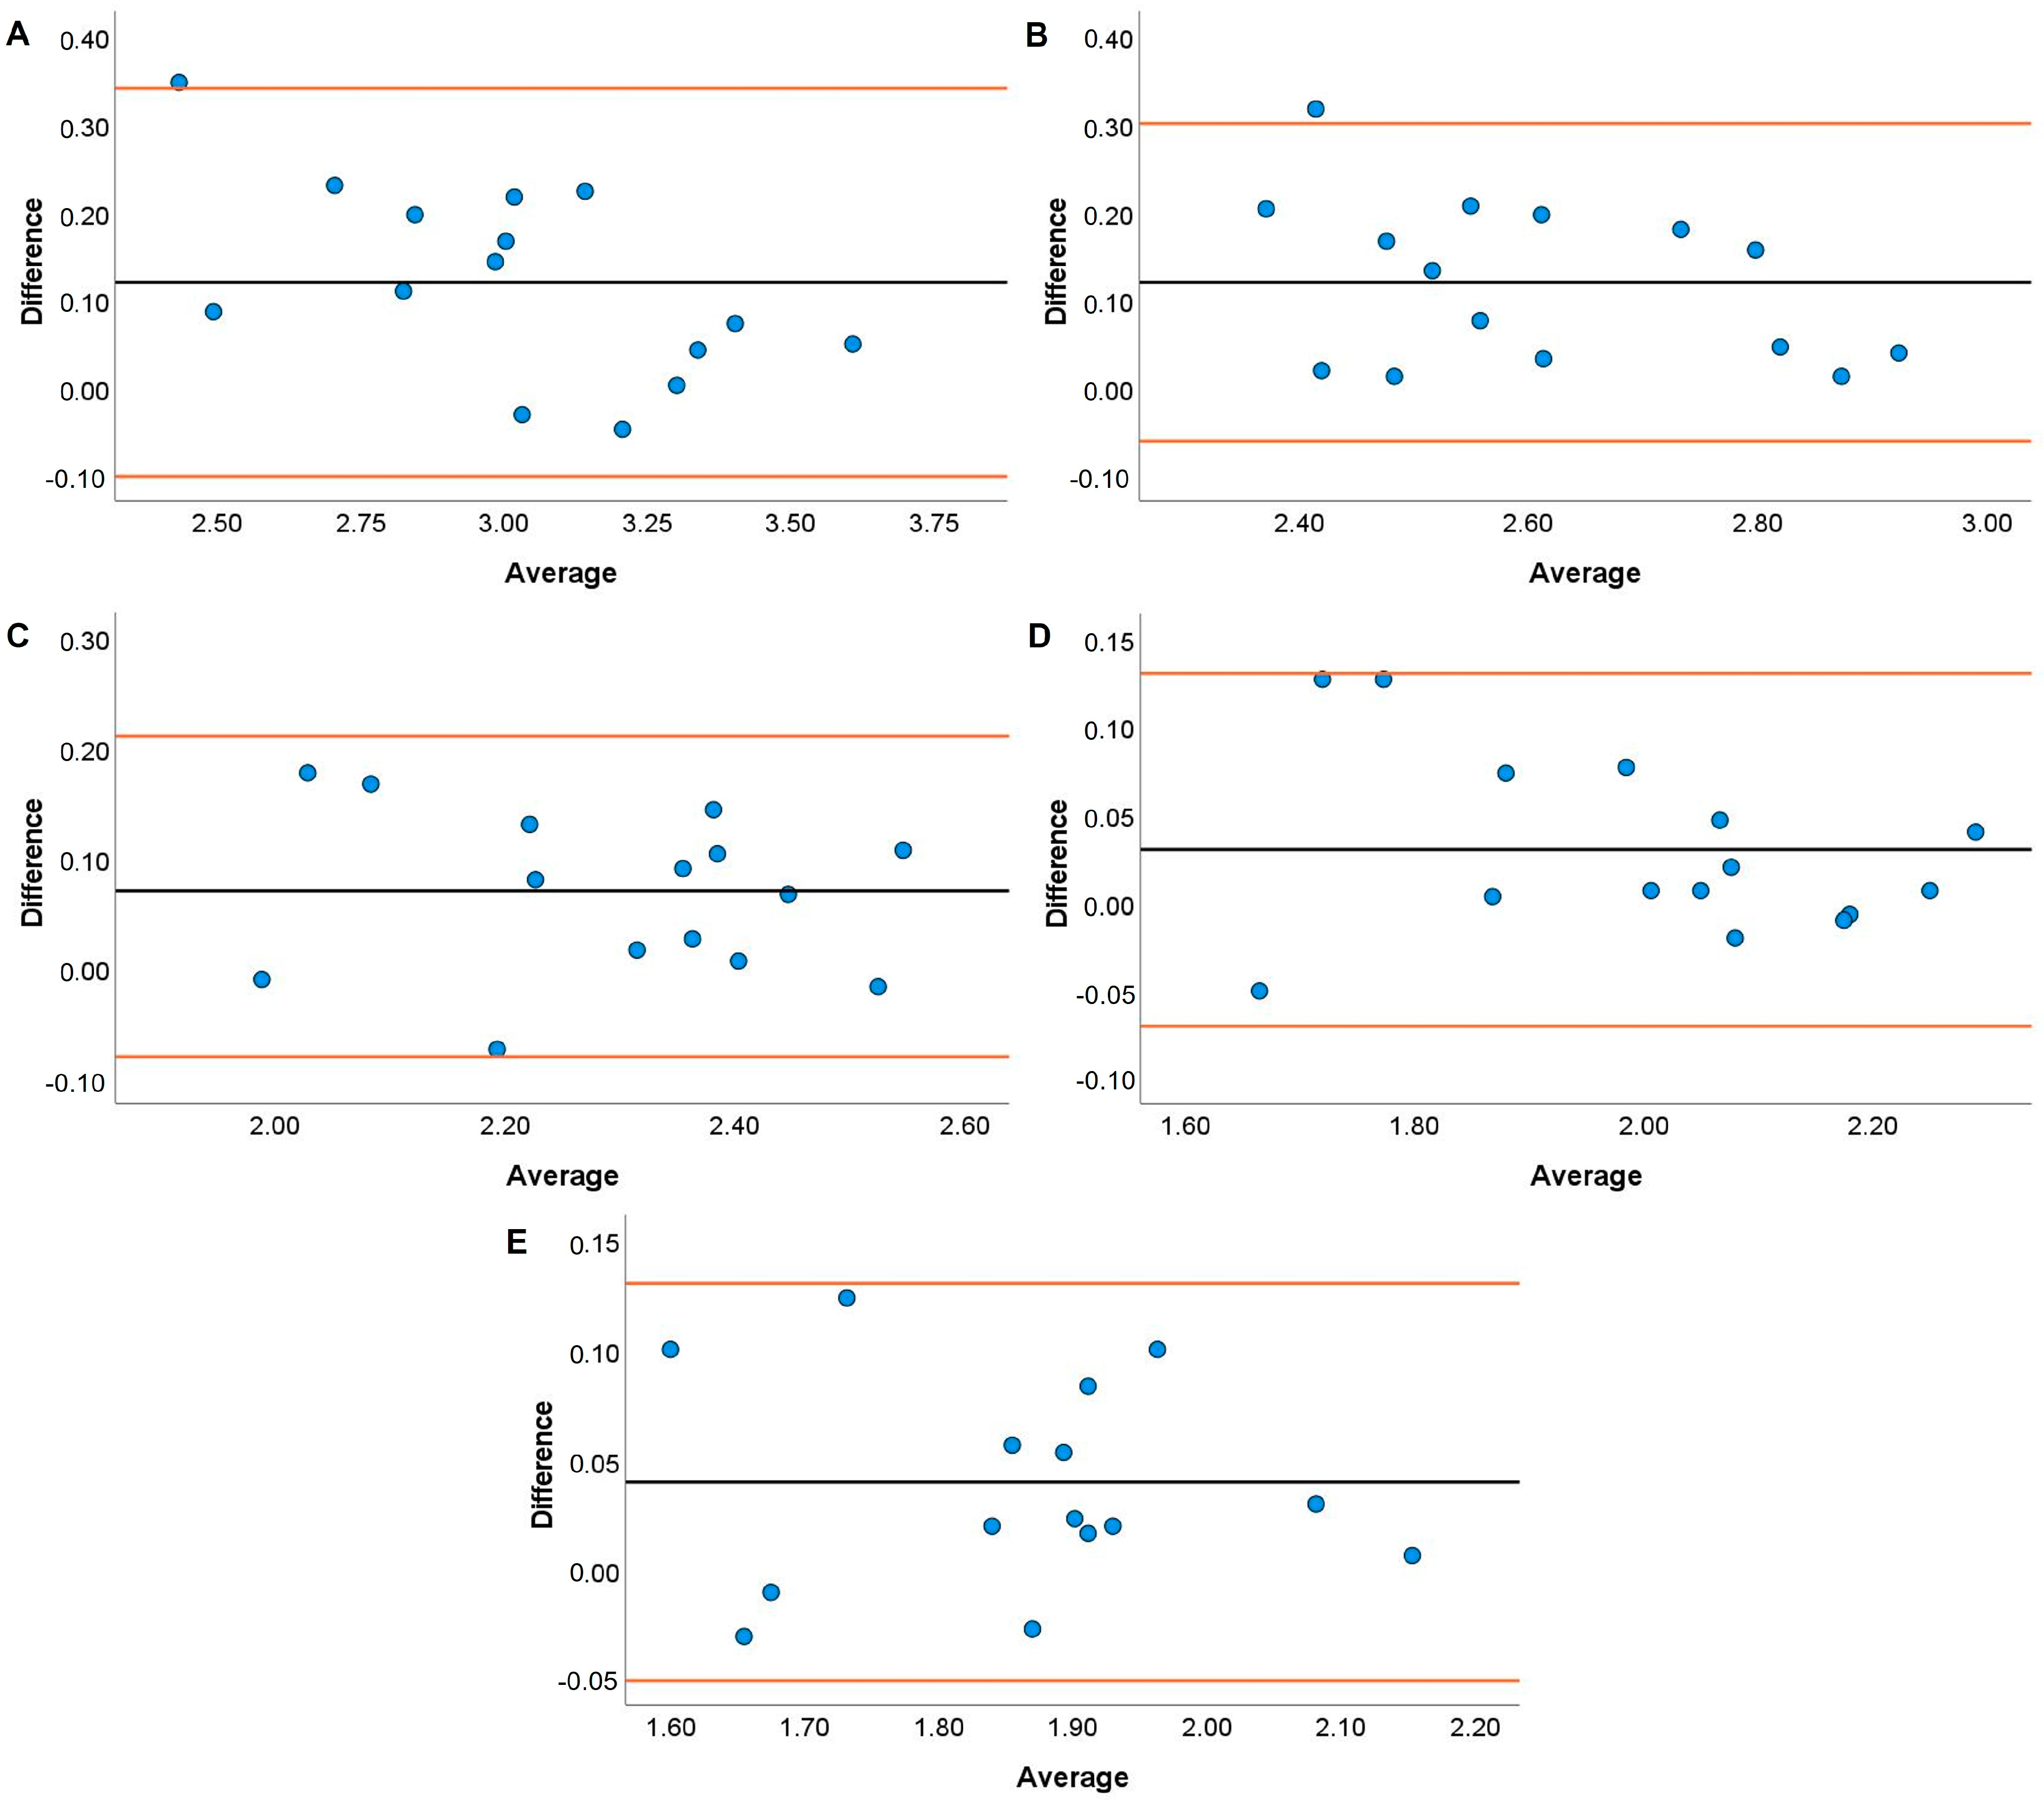
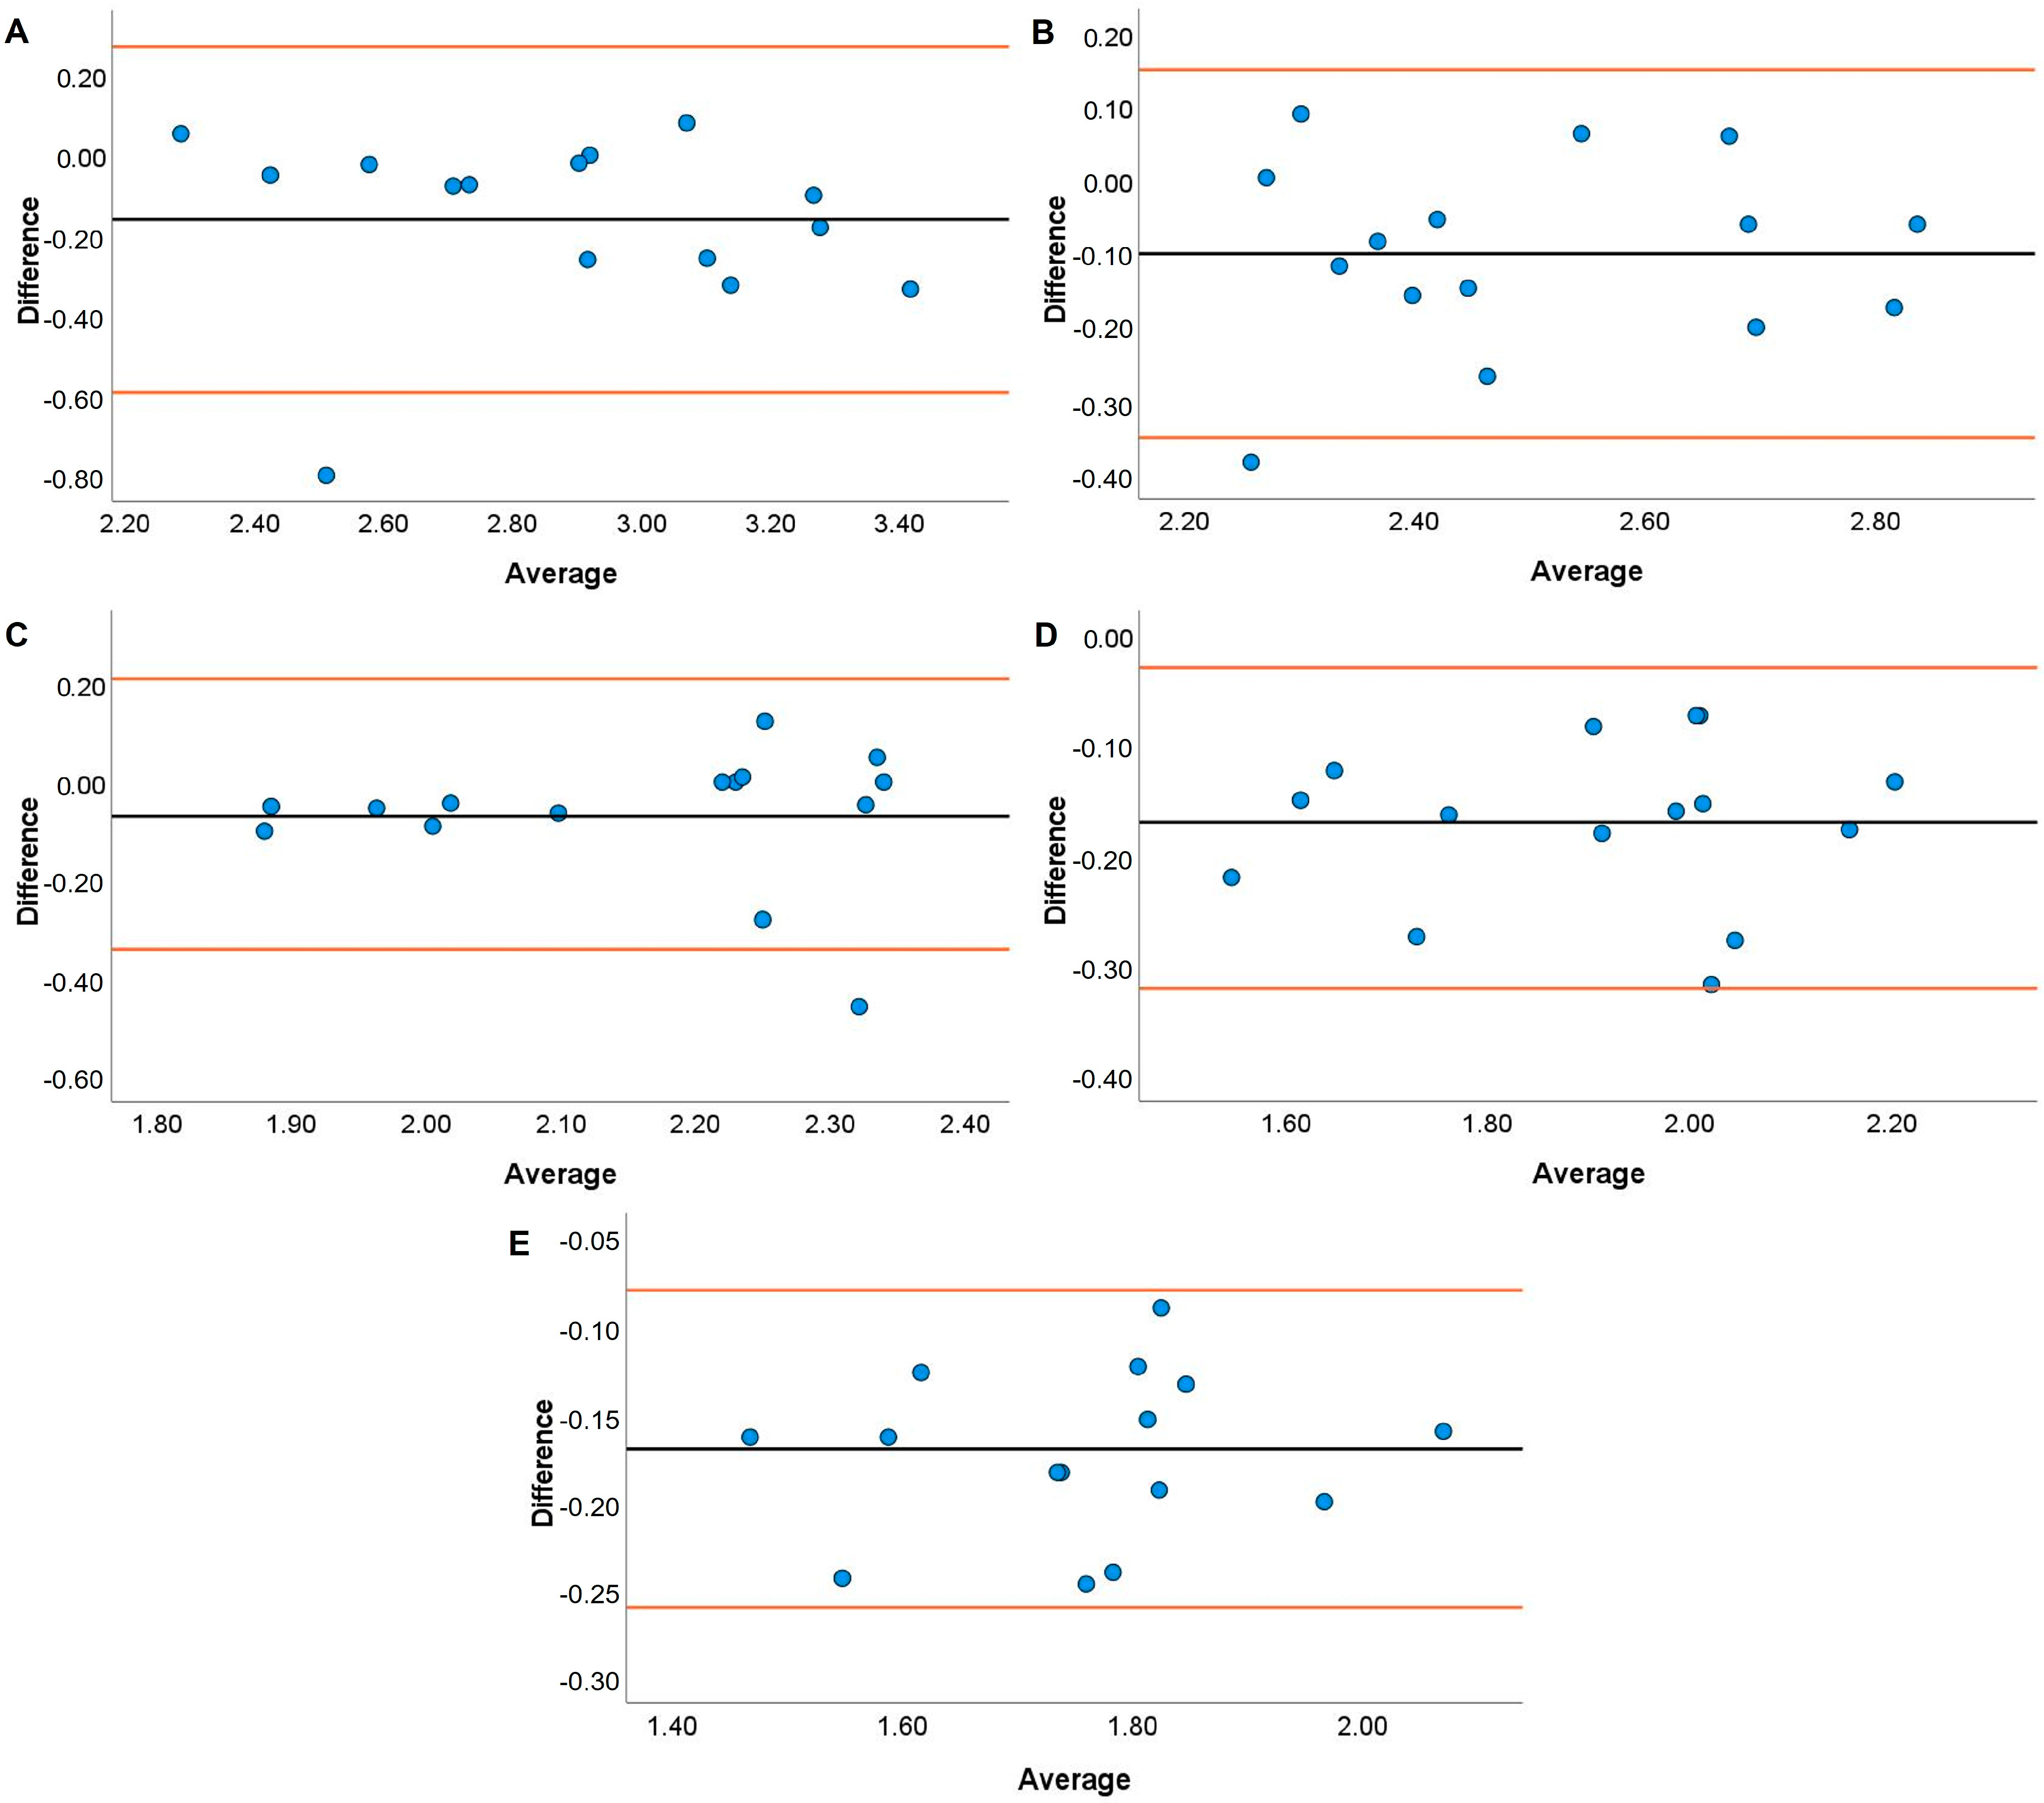
3.1. Jump Shrug
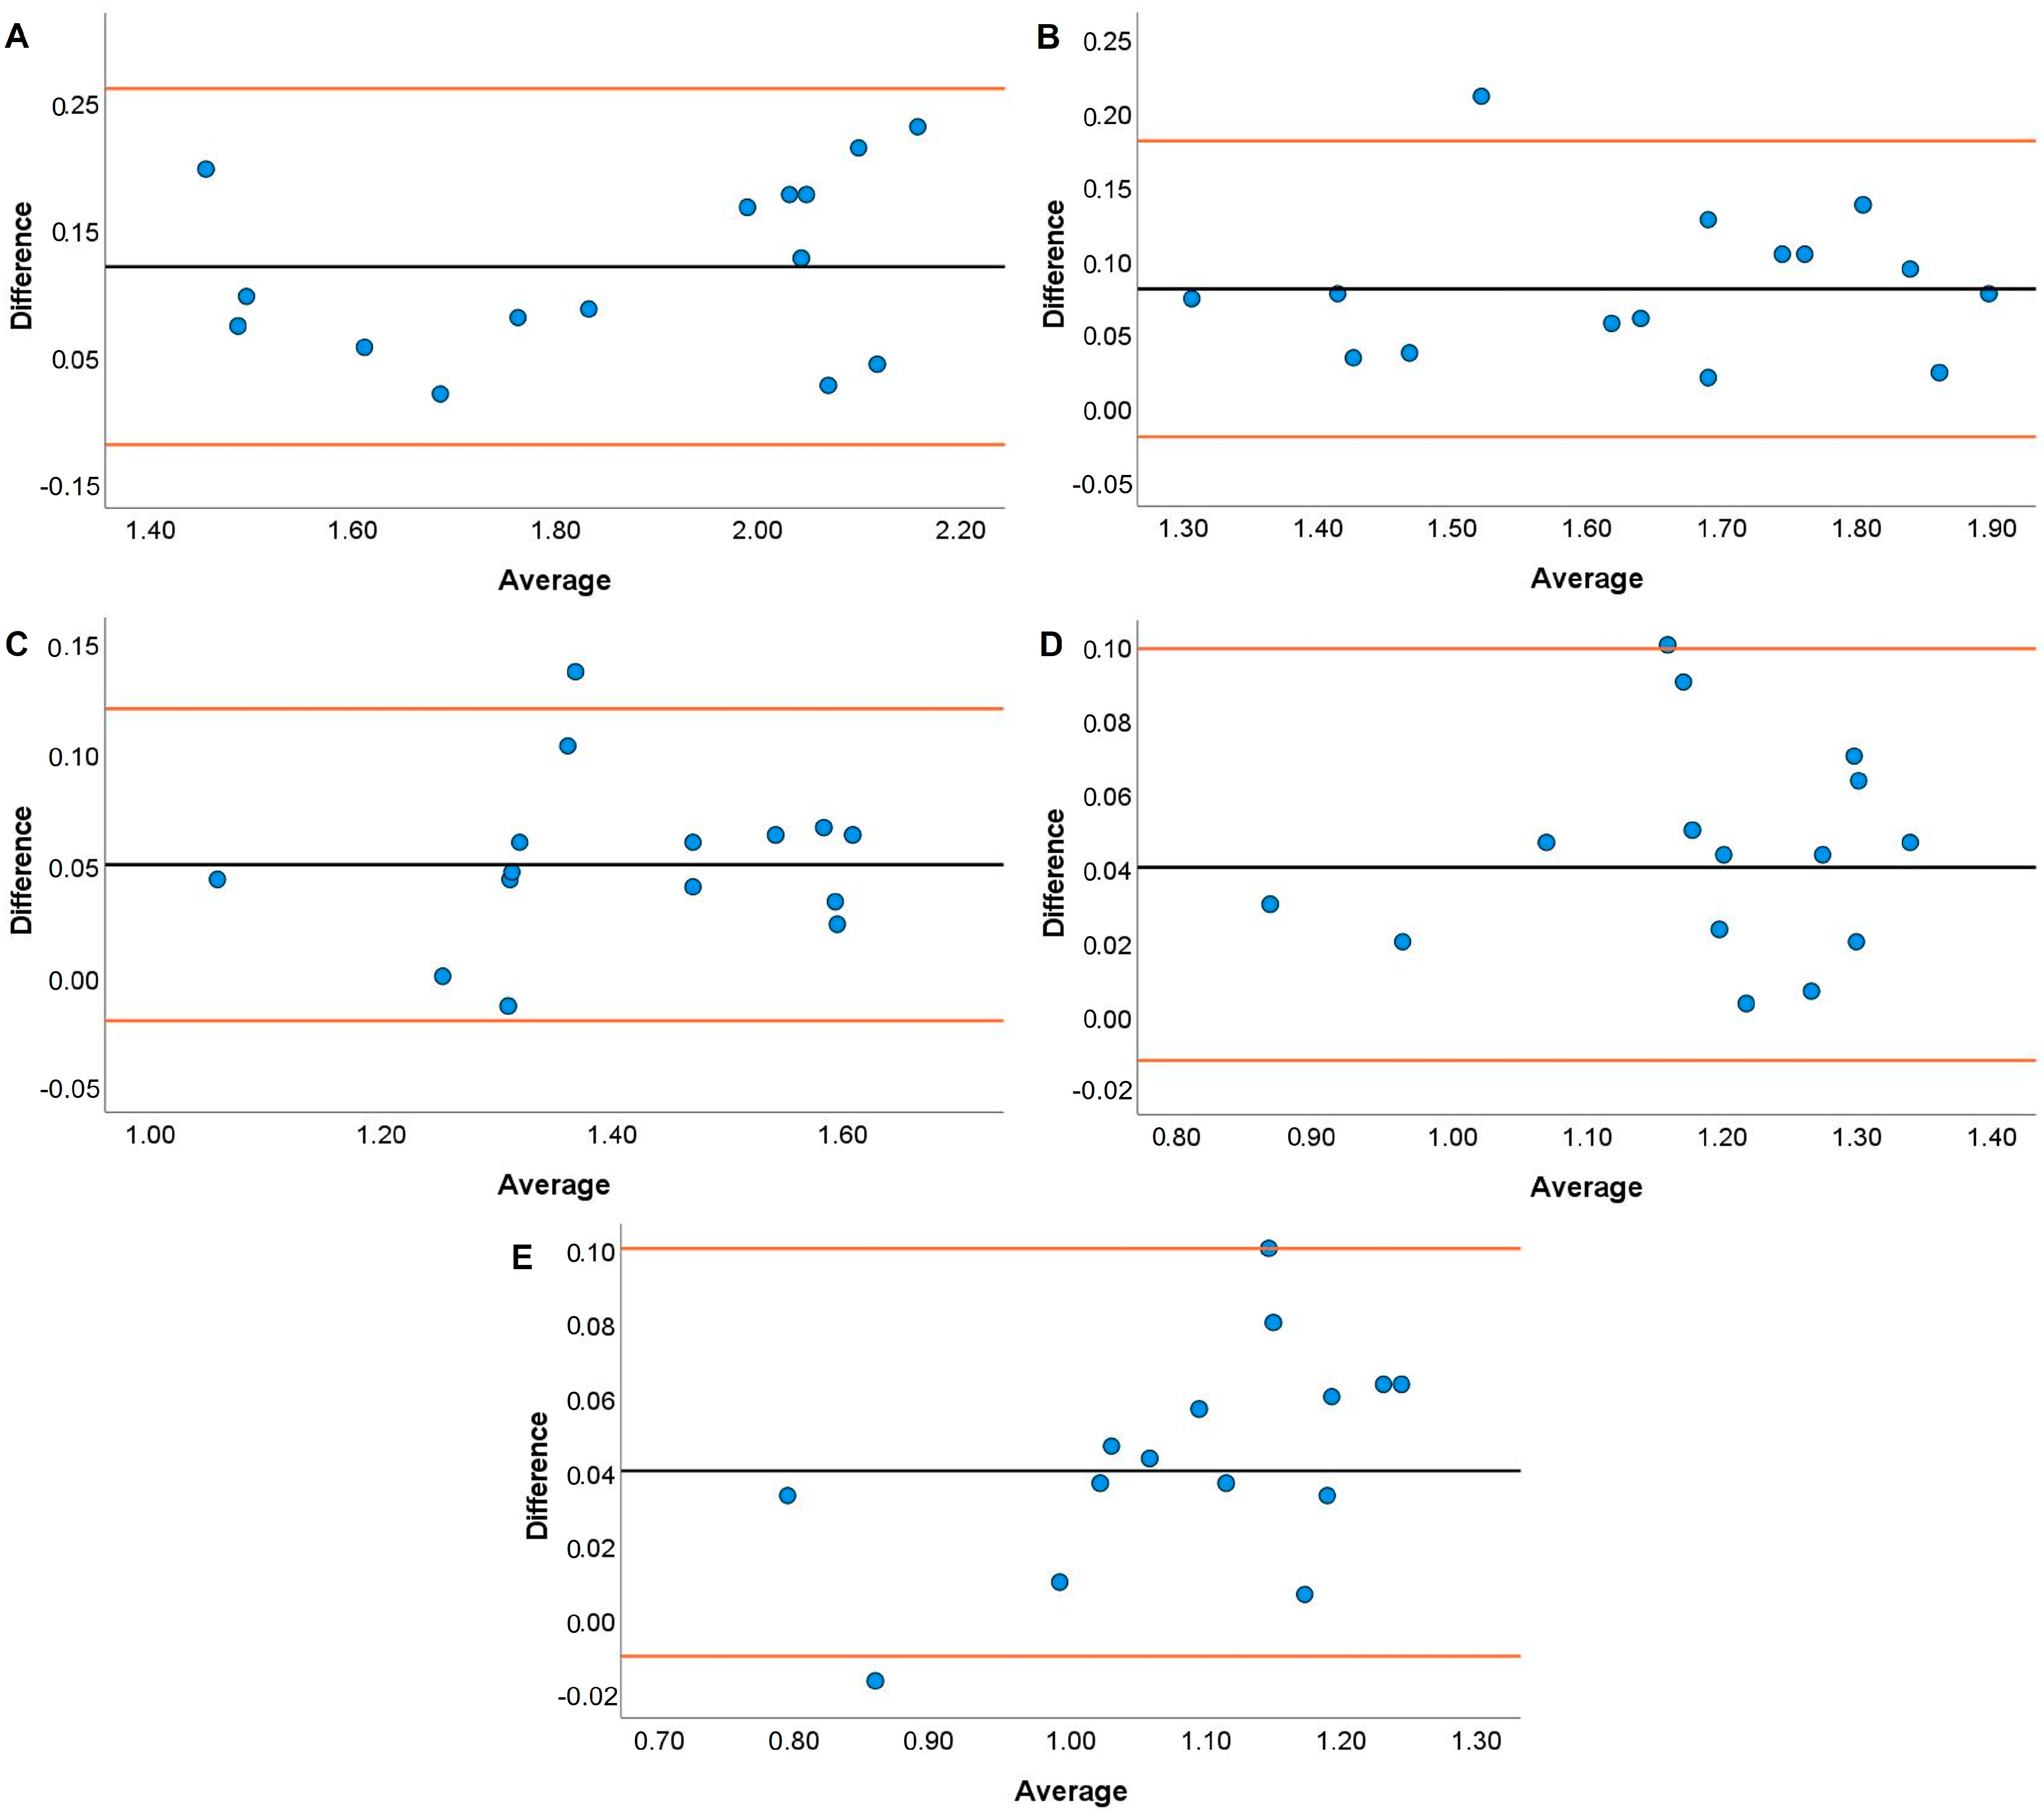
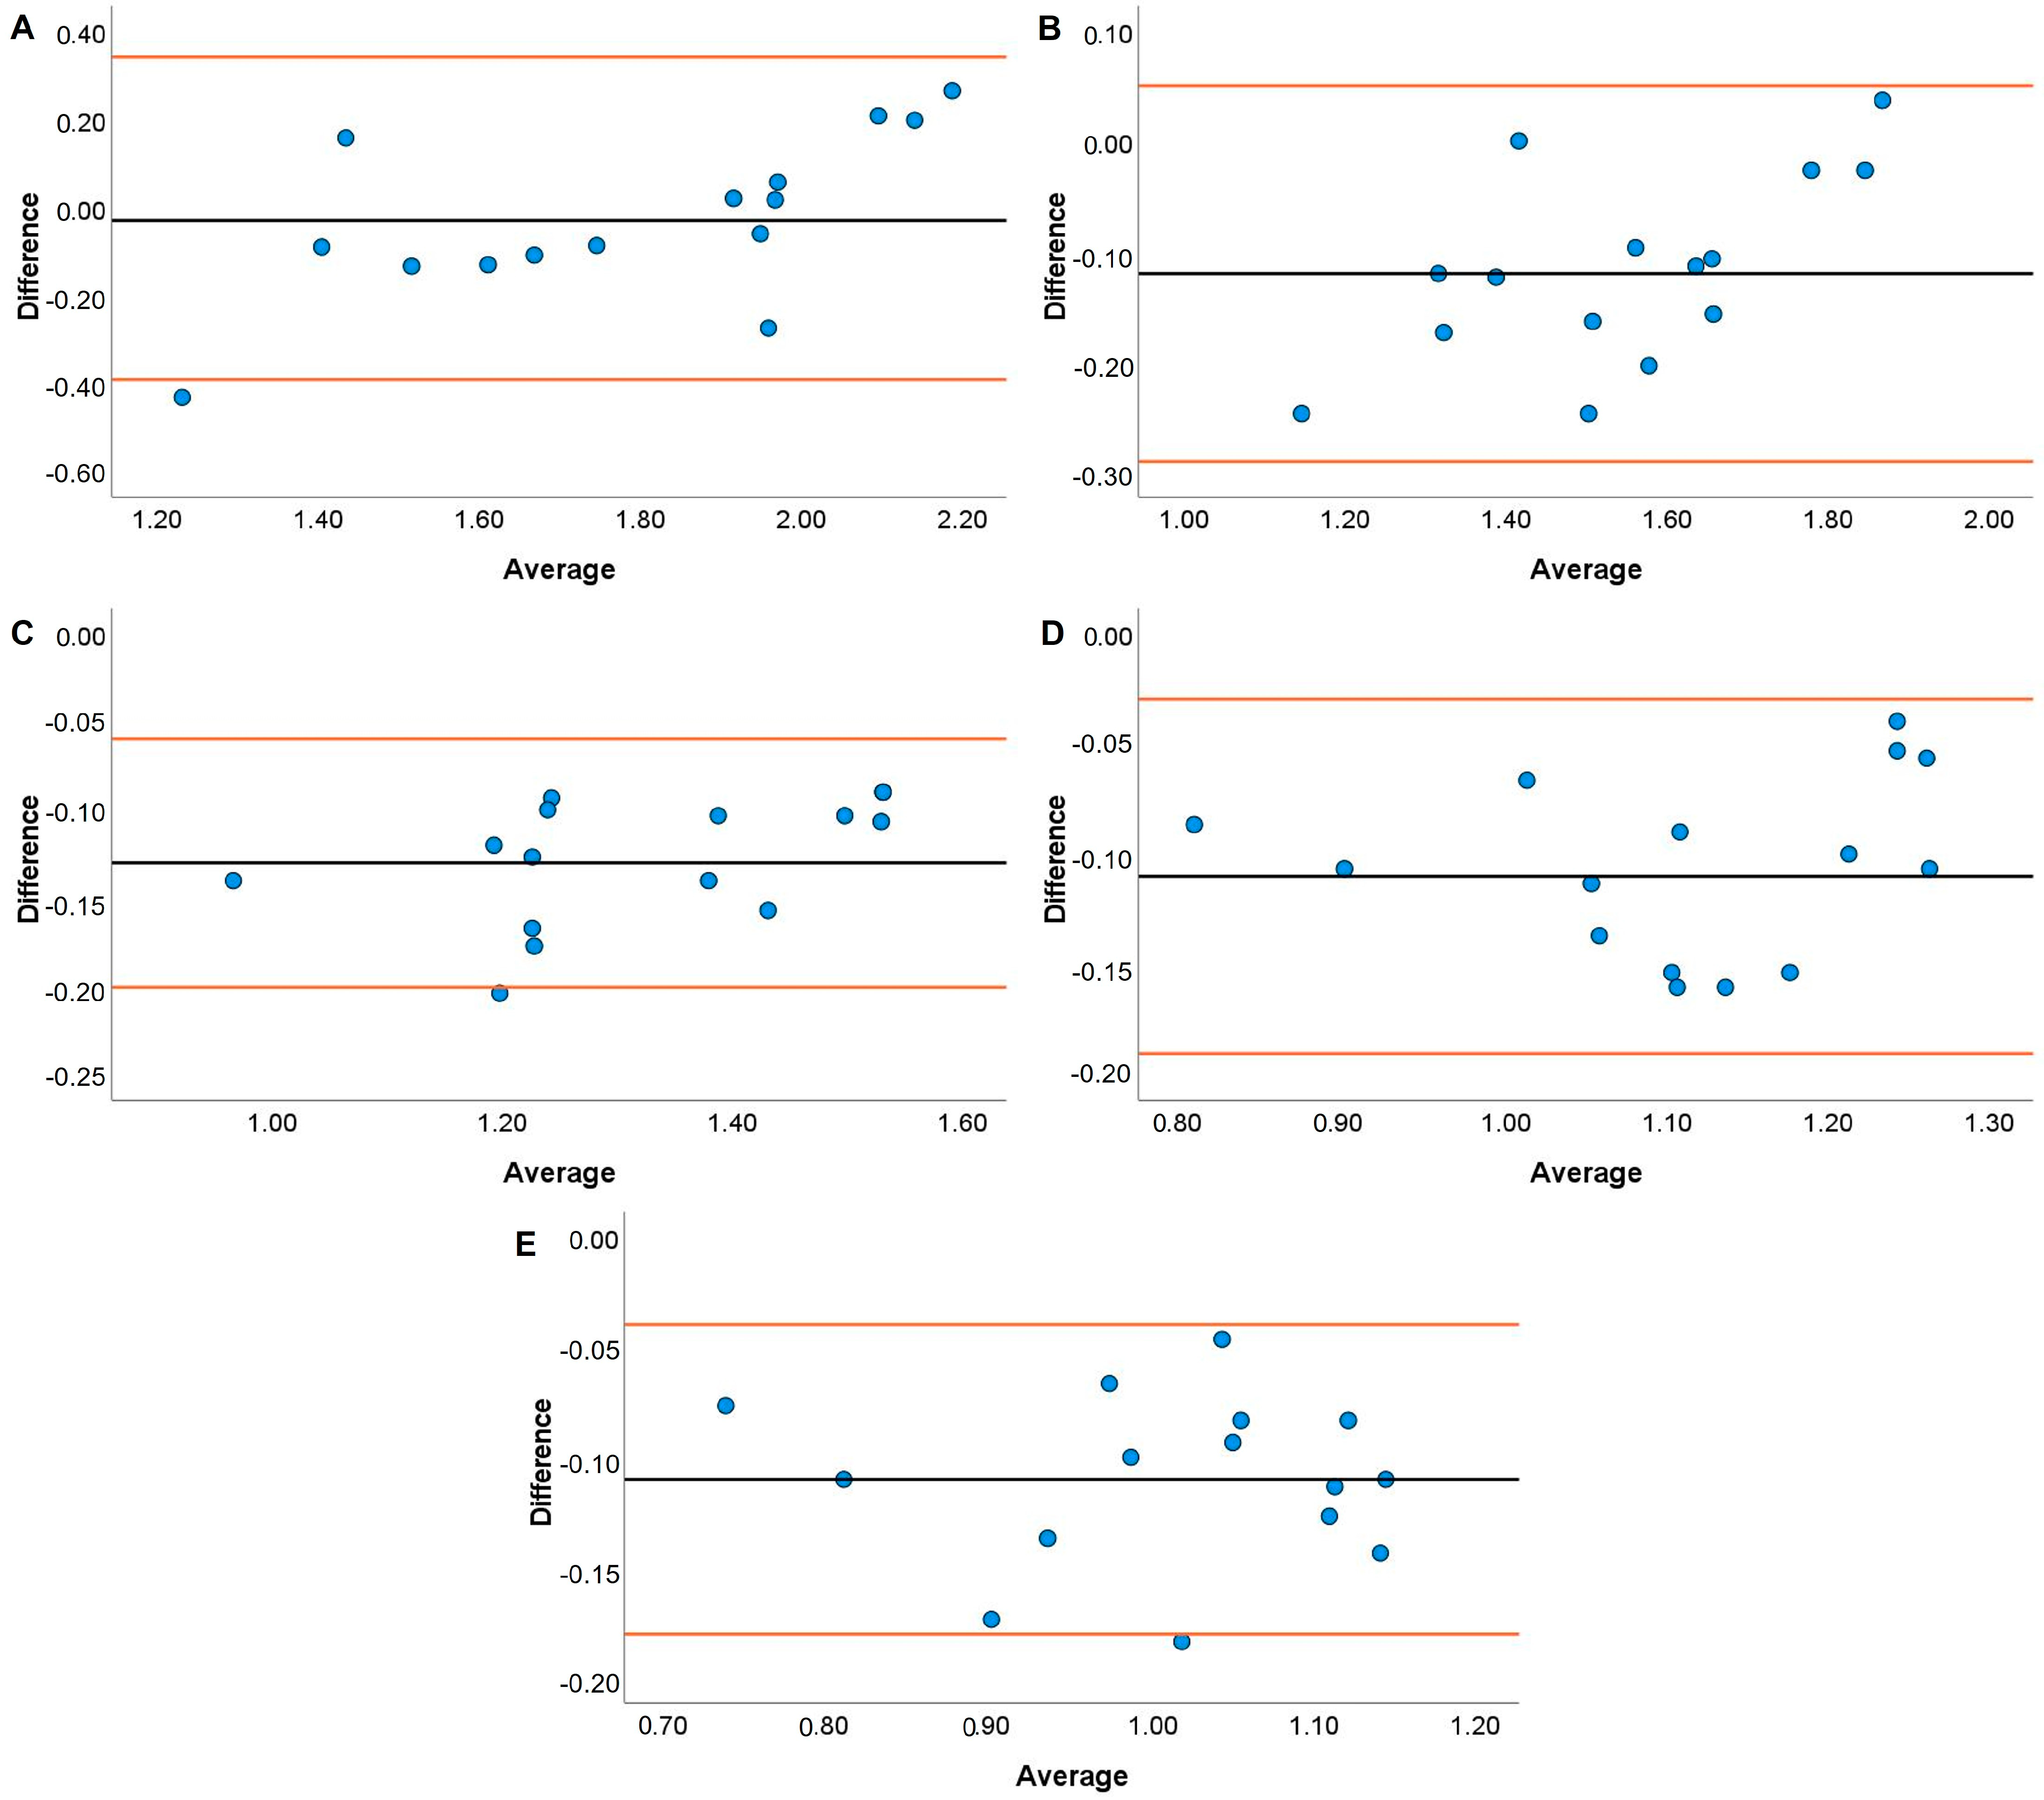
3.2. Hang High Pull
3.3. Effect Size Comparisons
4. Discussion
5. Conclusions
Author Contributions
Funding
Institutional Review Board Statement
Informed Consent Statement
Data Availability Statement
Conflicts of Interest
References
- Morris, S.J.; Oliver, J.L.; Pedley, J.S.; Haff, G.G.; Lloyd, R.S. Comparison of weightlifting, traditional resistance training and plyometrics on strength, power and speed: A systematic review with meta-analysis. Sport. Med. 2022, 52, 1533–1554. [Google Scholar] [CrossRef]
- García-Valverde, A.; Manresa-Rocamora, A.; Hernández-Davó, J.L.; Sabido, R. Effect of weightlifting training on jumping ability, sprinting performance and squat strength: A systematic review and meta-analysis. Int. J. Sport. Sci. Coach. 2022, 17, 917–939. [Google Scholar] [CrossRef]
- Suchomel, T.J.; Comfort, P.; Stone, M.H. Weightlifting pulling derivatives: Rationale for implementation and application. Sport. Med. 2015, 45, 823–839. [Google Scholar] [CrossRef]
- Suchomel, T.J.; McKeever, S.M.; Nolen, J.D.; Comfort, P. Muscle architectural and force-velocity curve adaptations following 10 weeks of training with weightlifting catching and pulling derivatives. J. Sport. Sci. Med. 2022, 21, 504–516. [Google Scholar] [CrossRef] [PubMed]
- Suchomel, T.J.; McKeever, S.M.; Comfort, P. Training with weightlifting derivatives: The effects of force and velocity overload stimuli. J. Strength Cond. Res. 2020, 34, 1808–1818. [Google Scholar] [CrossRef]
- Suchomel, T.J.; McKeever, S.M.; McMahon, J.J.; Comfort, P. The effect of training with weightlifting catching or pulling derivatives on squat jump and countermovement jump force-time adaptations. J. Funct. Morphol. Kines. 2020, 5, 28. [Google Scholar] [CrossRef]
- Comfort, P.; Dos’Santos, T.; Thomas, C.; McMahon, J.J.; Suchomel, T.J. An investigation into the effects of excluding the catch phase of the power clean on force-time characteristics during isometric and dynamic tasks: An intervention study. J. Strength Cond. Res. 2018, 32, 2116–2129. [Google Scholar] [CrossRef]
- Suchomel, T.J. The gray area of programming weightlifting exercises. Natl. Strength Cond. Assoc. Coach. 2020, 7, 6–14. [Google Scholar]
- Suchomel, T.J.; Comfort, P.; Lake, J.P. Enhancing the force-velocity profile of athletes using weightlifting derivatives. Strength Cond. J. 2017, 39, 10–20. [Google Scholar] [CrossRef]
- Meechan, D.; Suchomel, T.J.; McMahon, J.J.; Comfort, P. A comparison of kinetic and kinematic variables during the mid-thigh pull and countermovement shrug, across loads. J. Strength Cond. Res. 2020, 34, 1830–1841. [Google Scholar] [CrossRef]
- Meechan, D.; McMahon, J.J.; Suchomel, T.J.; Comfort, P. A comparison of kinetic and kinematic variables during the pull from the knee and hang pull, across loads. J. Strength Cond. Res. 2020, 34, 1819–1829. [Google Scholar] [CrossRef]
- Comfort, P.; Jones, P.A.; Udall, R. The effect of load and sex on kinematic and kinetic variables during the mid-thigh clean pull. Sport. Biomech. 2015, 14, 139–156. [Google Scholar] [CrossRef]
- Comfort, P.; Udall, R.; Jones, P.A. The effect of loading on kinematic and kinetic variables during the midthigh clean pull. J. Strength Cond. Res. 2012, 26, 1208–1214. [Google Scholar] [CrossRef]
- Kipp, K.; Comfort, P.; Suchomel, T.J. Comparing biomechanical time series data during the hang-power clean and jump shrug. J. Strength Cond. Res. 2021, 35, 2389–2396. [Google Scholar] [CrossRef] [PubMed]
- Kipp, K.; Malloy, P.J.; Smith, J.; Giordanelli, M.D.; Kiely, M.T.; Geiser, C.F.; Suchomel, T.J. Mechanical demands of the hang power clean and jump shrug: A joint-level perspective. J. Strength Cond. Res. 2018, 32, 466–474. [Google Scholar] [CrossRef] [PubMed]
- Suchomel, T.J.; Wright, G.A.; Kernozek, T.W.; Kline, D.E. Kinetic comparison of the power development between power clean variations. J. Strength Cond. Res. 2014, 28, 350–360. [Google Scholar] [CrossRef] [PubMed]
- Suchomel, T.J.; Wright, G.A.; Lottig, J. Lower Extremity Joint Velocity Comparisons during the Hang Power Clean and Jump Shrug at Various Loads. In Proceedings of the XXXIInd International Conference of Biomechanics in Sports, Johnson City, TN, USA, 12–16 July 2014; Sato, K., Sands, W.A., Mizuguchi, S., Eds.; ISBS: Johnson City, TN, USA, 2014; pp. 749–752. [Google Scholar]
- Suchomel, T.J.; Beckham, G.K.; Wright, G.A. Lower body kinetics during the jump shrug: Impact of load. J. Trainol. 2013, 2, 19–22. [Google Scholar] [CrossRef] [Green Version]
- Takei, S.; Hirayama, K.; Okada, J. Comparison of the power output between the hang power clean and hang high pull across a wide range of loads in weightlifters. J. Strength Cond. Res. 2021, 35, S84–S88. [Google Scholar] [CrossRef]
- Suchomel, T.J.; Beckham, G.K.; Wright, G.A. Effect of various loads on the force-time characteristics of the hang high pull. J. Strength Cond. Res. 2015, 29, 1295–1301. [Google Scholar] [CrossRef] [Green Version]
- McBride, J.M.; Haines, T.L.; Kirby, T.J. Effect of loading on peak power of the bar, body, and system during power cleans, squats, and jump squats. J. Sport. Sci. 2011, 29, 1215–1221. [Google Scholar] [CrossRef]
- Cormie, P.; McCaulley, G.O.; McBride, J.M. Power versus strength-power jump squat training: Influence on the load-power relationship. Med. Sci. Sport. Exerc. 2007, 39, 996–1003. [Google Scholar] [CrossRef] [PubMed] [Green Version]
- Wicki, B.; Culici, J.; DeMarco, N.; Moran, M.; Miller, J. Comparison of rate of force development during a light and moderate load snatch pull. J Undergrad. Kinesiol. Res. 2014, 9, 20–30. [Google Scholar]
- Meechan, D.; McMahon, J.J.; Suchomel, T.J.; Comfort, P. The effect of rest redistribution on kinetic and kinematic variables during the countermovement shrug. J. Strength Cond. Res. 2022; in press. [Google Scholar]
- Suchomel, T.J.; Giordanelli, M.D.; Geiser, C.F.; Kipp, K. Comparison of joint work during load absorption between weightlifting derivatives. J. Strength Cond. Res. 2021, 35, S127–S135. [Google Scholar] [CrossRef]
- Suchomel, T.J.; Lake, J.P.; Comfort, P. Load absorption force-time characteristics following the second pull of weightlifting derivatives. J. Strength Cond. Res. 2017, 31, 1644–1652. [Google Scholar] [CrossRef] [PubMed] [Green Version]
- Comfort, P.; Williams, R.; Suchomel, T.J.; Lake, J.P. A comparison of catch phase force-time characteristics during clean derivatives from the knee. J. Strength Cond. Res. 2017, 31, 1911–1918. [Google Scholar] [CrossRef] [PubMed] [Green Version]
- Suchomel, T.J.; Sole, C.J. Force-time curve comparison between weightlifting derivatives. Int. J. Sport. Physiol. Perform. 2017, 12, 431–439. [Google Scholar] [CrossRef] [PubMed]
- Suchomel, T.J.; Sole, C.J. Power-time curve comparison between weightlifting derivatives. J. Sport. Sci. Med. 2017, 16, 407–413. [Google Scholar]
- Suchomel, T.J.; Taber, C.B.; Wright, G.A. Jump shrug height and landing forces across various loads. Int. J. Sport. Physiol. Perform. 2016, 11, 61–65. [Google Scholar] [CrossRef]
- Haff, G.G.; Whitley, A.; McCoy, L.B.; O’Bryant, H.S.; Kilgore, J.L.; Haff, E.E.; Pierce, K.; Stone, M.H. Effects of different set configurations on barbell velocity and displacement during a clean pull. J. Strength Cond. Res. 2003, 17, 95–103. [Google Scholar]
- Lopes dos Santos, M.; Jagodinsky, A.; Lagally, K.M.; Tricoli, V.; Berton, R. Determining the peak power output for weightlifting derivatives using body mass percentage: A practical approach. Front. Sport. Act. Living 2021, 3, 88. [Google Scholar] [CrossRef]
- Lopes dos Santos, M.; Berton, R.; Jagodinsky, A.E.; Torry, M.R.; Lagally, K.M. The effect of load based on body mass percentage on peak power output in the hang power clean, hang high pull, and mid-thigh clean pull. J. Sport. Med. Phys. Fit. 2021, 62, 457–466. [Google Scholar] [CrossRef] [PubMed]
- Suchomel, T.J.; Nimphius, S.; Bellon, C.R.; Hornsby, W.G.; Stone, M.H. Training for muscular strength: Methods for monitoring and adjusting training intensity. Sport. Med. 2021, 51, 2051–2066. [Google Scholar] [CrossRef]
- Weakley, J.J.S.; Mann, J.B.; Banyard, H.; McLaren, S.; Scott, T.; Garcia-Ramos, A. Velocity-based training: From theory to application. Strength Cond. J. 2021, 43, 31–49. [Google Scholar] [CrossRef]
- Banyard, H.G.; Tufano, J.J.; Delgado, J.; Thompson, S.W.; Nosaka, K. Comparison of the effects of velocity-based training methods and traditional 1rm-percent-based training prescription on acute kinetic and kinematic variables. Int. J. Sport. Physiol. Perform. 2019, 14, 246–255. [Google Scholar] [CrossRef] [Green Version]
- Dorrell, H.F.; Smith, M.F.; Gee, T.I. Comparison of velocity-based and traditional percentage-based loading methods on maximal strength and power adaptations. J. Strength Cond. Res. 2020, 34, 46–53. [Google Scholar] [CrossRef] [PubMed]
- Weakley, J.J.S.; Ramirez-Lopez, C.; McLaren, S.; Dalton-Barron, N.; Weaving, D.; Jones, B.; Till, K.; Banyard, H. The effects of 10%, 20%, and 30% velocity loss thresholds on kinetic, kinematic, and repetition characteristics during the barbell back squat. Int. J. Sport. Physiol. Perform. 2020, 15, 180–188. [Google Scholar] [CrossRef] [PubMed] [Green Version]
- Jiménez-Reyes, P.; Castaño-Zambudio, A.; Cuadrado-Peñafiel, V.; González-Hernández, J.M.; Capelo-Ramírez, F.; Martínez-Aranda, L.M.; González-Badillo, J.J. Differences between adjusted vs. Non-adjusted loads in velocity-based training: Consequences for strength training control and programming. PeerJ 2021, 9, e10942. [Google Scholar] [CrossRef]
- Banyard, H.G.; Nosaka, K.; Sato, K.; Haff, G.G. Validity of various methods for determining velocity, force, and power in the back squat. Int. J. Sport. Physiol. Perform. 2017, 12, 1170–1176. [Google Scholar] [CrossRef]
- Fritschi, R.; Seiler, J.; Gross, M. Validity and effects of placement of velocity-based training devices. Sports 2021, 9, 123. [Google Scholar] [CrossRef]
- Balsalobre-Fernández, C.; Kuzdub, M.; Poveda-Ortiz, P.; del Campo-Vecino, J. Validity and reliability of the push wearable device to measure movement velocity during the back squat exercise. J. Strength Cond. Res. 2016, 30, 1968–1974. [Google Scholar] [CrossRef] [PubMed]
- Merrigan, J.J.; Martin, J.R. Is the output sports unit reliable and valid when estimating back squat and bench press concentric velocity? J. Strength Cond. Res. 2022, 36, 2069–2076. [Google Scholar] [CrossRef] [PubMed]
- Jukic, I.; Tufano, J.J. Rest redistribution functions as a free and ad-hoc equivalent to commonly used velocity-based training thresholds during clean pulls at different loads. J. Hum. Kinet. 2019, 68, 5–16. [Google Scholar] [CrossRef] [PubMed] [Green Version]
- Thompson, S.W.; Rogerson, D.; Dorrell, H.F.; Ruddock, A.; Barnes, A. The reliability and validity of current technologies for measuring barbell velocity in the free-weight back squat and power clean. Sports 2020, 8, 94. [Google Scholar] [CrossRef] [PubMed]
- Suchomel, T.J.; DeWeese, B.H.; Beckham, G.K.; Serrano, A.J.; Sole, C.J. The jump shrug: A progressive exercise into weightlifting derivatives. Strength Cond. J. 2014, 36, 43–47. [Google Scholar] [CrossRef] [Green Version]
- Suchomel, T.J.; DeWeese, B.H.; Beckham, G.K.; Serrano, A.J.; French, S.M. The hang high pull: A progressive exercise into weightlifting derivatives. Strength Cond. J. 2014, 36, 79–83. [Google Scholar] [CrossRef] [Green Version]
- Koo, T.K.; Li, M.Y. A guideline of selecting and reporting intraclass correlation coefficients for reliability research. J. Chiropr. Med. 2016, 15, 155–163. [Google Scholar] [CrossRef] [Green Version]
- Cormack, S.J.; Newton, R.U.; McGuigan, M.R.; Doyle, T.L.A. Reliability of measures obtained during single and repeated countermovement jumps. Int. J. Sport. Physiol. Perform. 2008, 3, 131–144. [Google Scholar] [CrossRef] [Green Version]
- Lake, J.P.; Augustus, S.; Austin, K.; Mundy, P.D.; McMahon, J.J.; Comfort, P.; Haff, G.G. The validity of the push band 2.0 during vertical jump performance. Sports 2018, 6, 140. [Google Scholar] [CrossRef] [Green Version]
- Ludbrook, J. Comparing methods of measurement. Clin. Exp. Pharmacol. Physiol. 1997, 24, 198–203. [Google Scholar] [CrossRef]
- Hopkins, W.G. A Scale of Magnitude for Effect Statistics. 2014. Available online: http://www.sportsci.org/resource/stats/effectmag.html (accessed on 1 December 2022).
- Goldsmith, J.A.; Trepeck, C.; Halle, J.L.; Mendez, K.M.; Klemp, A.; Cooke, D.M.; Haischer, M.H.; Byrnes, R.K.; Zoeller, R.F.; Whitehurst, M. Validity of the open barbell and tendo weightlifting analyzer systems versus the optotrak certus 3d motion-capture system for barbell velocity. Int. J. Sport. Physiol. Perform. 2019, 14, 540–543. [Google Scholar] [CrossRef] [PubMed]
- Lake, J.P.; Augustus, S.; Austin, K.; Comfort, P.; McMahon, J.J.; Mundy, P.D.; Haff, G.G. The reliability and validity of the bar-mounted push bandtm 2.0 during bench press with moderate and heavy loads. J. Sport. Sci. 2019, 37, 2685–2690. [Google Scholar] [CrossRef] [PubMed]
- Weakley, J.; Morrison, M.; García-Ramos, A.; Johnston, R.; James, L.; Cole, M.H. The validity and reliability of commercially available resistance training monitoring devices: A systematic review. Sport. Med. 2021, 51, 443–502. [Google Scholar] [CrossRef] [PubMed]
- Suchomel, T.J.; McKeever, S.M.; Sijuwade, O.; Carpenter, L.; McMahon, J.J.; Loturco, I.; Comfort, P. The effect of load placement on the power production characteristics of three lower extremity jumping exercises. J. Hum. Kinet. 2019, 68, 109–122. [Google Scholar] [CrossRef] [Green Version]


| Load (%) | Jump Shrug | Hang High Pull | ||||||
|---|---|---|---|---|---|---|---|---|
| ICC | CV% | ICC | CV% | |||||
| MBV | PBV | MBV | PBV | MBV | PBV | MBV | PBV | |
| GA | ||||||||
| 20 | 0.91 (0.78–0.97) | 0.97 (0.93–0.99) | 7.1 (5.2–11.5) | 3.4 (2.5–5.4) | 0.95 (0.89–0.98) | 0.96 (0.92–0.99) | 5.8 (4.2–9.2) | 4.6 (3.4–7.4) |
| 40 | 0.96 (0.91–0.99) | 0.97 (0.93–0.99) | 4.1 (3.0–6.5) | 3.0 (2.2–4.7) | 0.97 (0.93–0.99) | 0.95 (0.87–0.98) | 3.1 (2.3–5.0) | 3.1 (2.3–5.0) |
| 60 | 0.96 (0.89–0.98) | 0.97 (0.92–0.99) | 3.6 (2.6–5.7) | 2.1 (1.5–3.3) | 0.96 (0.90–0.98) | 0.95 (0.89–0.98) | 4.6 (3.3–7.3) | 3.0 (2.2–4.8) |
| 80 | 0.95 (0.87–0.98) | 0.96 (0.90–0.99) | 4.9 (3.6–7.8) | 3.4 (2.5–5.5) | 0.98 (0.94–0.99) | 0.98 (0.96–0.99) | 3.2 (2.3–5.1) | 2.5 (1.8–3.9) |
| 100 | 0.97 (0.93–0.99) | 0.96 (0.89–0.98) | 3.8 (2.8–6.0) | 3.3 (2.4–5.3) | 0.98 (0.95–0.99) | 0.98 (0.95–0.99) | 3.2 (2.3–5.1) | 2.2 (1.6–3.5) |
| TENDO | ||||||||
| 20 | 0.94 (0.85–0.98) | 0.98 (0.94–0.99) | 5.9 (4.3–9.4) | 2.5 (1.8–4.0) | 0.97 (0.92–0.99) | 0.92 (0.82–0.97) | 5.5 (4.0–8.8) | 6.0 (4.4–9.7) |
| 40 | 0.95 (0.87–0.98) | 0.97 (0.94–0.99) | 5.0 (3.7–8.1) | 2.5 (1.8–4.0) | 0.97 (0.93–0.99) | 0.93 (0.83–0.97) | 3.1 (2.3–5.0) | 2.9 (2.1–4.6) |
| 60 | 0.96 (0.90–0.98) | 0.93 (0.84–0.98) | 3.4 (2.5–5.5) | 2.9 (2.1–4.6) | 0.96 (0.90–0.99) | 0.94 (0.86–0.98) | 3.9 (2.9–6.3) | 3.3 (2.4–5.3) |
| 80 | 0.97 (0.93–0.99) | 0.96 (0.90–0.98) | 3.8 (2.8–6.1) | 3.6 (2.6–5.7) | 0.96 (0.92–0.99) | 0.97 (0.93–0.99) | 4.0 (2.9–6.4) | 2.9 (2.1–4.7) |
| 100 | 0.98 (0.97–0.99) | 0.95 (0.88–0.98) | 2.7 (2.0–4.4) | 3.6 (2.7–5.8) | 0.97 (0.92–0.99) | 0.96 (0.90–0.99) | 4.2 (3.0–6.6) | 3.1 (2.3–5.0) |
| PUSH | ||||||||
| 20 | 0.91 (0.77–0.97) | 0.96 (0.91–0.99) | 5.8 (4.2–9.3) | 3.0 (2.2–4.8) | 0.90 (0.75–0.96) | 0.65 (0.14–0.88) | 5.0 (3.6–8.0) | 5.1 (3.7–8.2) |
| 40 | 0.90 (0.77–0.96) | 0.96 (0.91–0.99) | 6.1 (4.4–9.8) | 3.4 (2.5–5.4) | 0.88 (0.73–0.96) | 0.38 (−0.47–0.78) | 11.2 (8.1–18.3) | 12.0 (8.6–19.7) |
| 60 | 0.89 (0.73–0.96) | 0.89 (0.75–0.96) | 5.5 (4.0–8.9) | 4.0 (2.9–6.4) | 0.94 (0.85–0.98) | 0.90 (0.76–0.96) | 6.3 (4.6–10.1) | 5.5 (4.0–8.8) |
| 80 | 0.94 (0.86–0.98) | 0.96 (0.91–0.99) | 5.3 (3.8–8.5) | 3.4 (2.4–5.3) | 0.94 (0.84–0.98) | 0.88 (0.70–0.96) | 6.2 (4.5–9.9) | 6.3 (4.6–10.3) |
| 100 | 0.79 (0.49–0.92) | 0.69 (0.26–0.89) | 13.2 (9.5–21.5) | 8.6 (6.3–14.0) | 0.94 (0.86–0.98) | 0.92 (0.81–0.97) | 5.3 (3.9–8.5) | 4.7 (3.4–7.5) |
| Load (%) | R2 | Slope (95% CI) | Intercept (95% CI) | |||
|---|---|---|---|---|---|---|
| MBV | PBV | MBV | PBV | MBV | PBV | |
| TENDO | ||||||
| 20 | 0.89 | 0.94 | 0.882 (0.767–0.998) † | 1.007 (0.866–1.148) | 0.074 (−0.124–0.272) | −0.128 (−0.550–0.293) |
| 40 | 0.90 | 0.87 | 0.850 (0.674–1.027) | 1.024 (0.804–1.244) | 0.123 (−0.153–0.398) | −0.181 (−0.759–0.396) |
| 60 | 0.88 | 0.91 | 0.977 (0.724–1.231) | 1.073 (0.929–1.218) | −0.068 (−0.413–0.277) | −0.246 (−0.592–0.100) |
| 80 | 0.98 | 0.98 | 0.959 (0.877–1.040) | 0.988 (0.887–1.090) | −0.016 (−0.108–0.076) | −0.010 (−0.220–0.201) |
| 100 | 0.95 | 0.96 | 0.920 (0.795–1.045) | 0.970 (0.855–1.086) | 0.011 (−0.123–0.145) | 0.011 (−0.196–0.217) |
| PUSH | ||||||
| 20 | 0.84 | 0.78 | 1.009 (0.837–1.181) | 1.117 (0.693–1.541) | −0.042 (−0.309–0.226) | −0.213 (−1.334–0.908) |
| 40 | 0.64 | 0.66 | 1.006 (0.610–1.402) | 0.994 (0.691–1.297) | −0.005 (−0.575–0.565) | 0.051 (−0.690–0.791) |
| 60 | 0.75 | 0.89 | 0.949 (0.697–1.202) | 1.042 (0.845–1.238) | 0.100 (−0.194–0.394) | −0.018 (−0.432–0.395) |
| 80 | 0.86 | 0.89 | 1.064 (0.901–1.227) | 1.054 (0.900–1.207) | −0.016 (−0.184–0.152) | 0.008 (−0.283–0.300) |
| 100 | 0.47 | 0.58 | 1.152 (0.926–1.378) | 1.248 (0.992–1.504) | −0.114 (−0.378–0.150) | −0.340 (−0.790–0.109) |
| Load (%) | R2 | Slope (95% CI) | Intercept (95% CI) | |||
|---|---|---|---|---|---|---|
| MBV | PBV | MBV | PBV | MBV | PBV | |
| TENDO | ||||||
| 20 | 0.93 | 0.93 | 0.921 (0.755–1.087) | 1.215 (0.982–1.449) | 0.033 (−0.283–0.350) | −0.785 (−1.522–−0.048) ‡ |
| 40 | 0.93 | 0.79 | 0.982 (0.888–1.076) | 1.214 (0.959–1.470) | −0.052 (−0.208–0.104) | −0.693 (−1.398–0.012) |
| 60 | 0.95 | 0.83 | 0.973 (0.819–1.127) | 1.064 (0.797–1.331) | −0.013 (−0.253–0.227) | −0.217 (−0.849–0.415) |
| 80 | 0.96 | 0.94 | 0.978 (0.890–1.066) | 1.094 (0.898–1.290) | −0.017 (−0.122–0.088) | −0.220 (−0.630–0.189) |
| 100 | 0.96 | 0.91 | 0.886 (0.791–0.981) † | 1.029 (0.842–1.216) | 0.082 (−0.022–0.187) | −0.092 (−0.457–0.273) |
| PUSH | ||||||
| 20 | 0.77 | 0.65 | 0.681 (0.442–0.921) † | 1.059 (0.617–1.501) | 0.592 (0.149–1.034) ‡ | −0.008 (−1.321–1.305) |
| 40 | 0.89 | 0.65 | 0.779 (0.604–0.954) † | 0.948 (0.661–1.235) | 0.446 (0.185–0.708) ‡ | 0.226 (−0.501–0.953) |
| 60 | 0.96 | 0.62 | 0.905 (0.825–0.985) † | 1.009 (0.689–1.328) | 0.247 (0.141–0.353) ‡ | 0.121 (−0.534–0.777) |
| 80 | 0.91 | 0.87 | 0.953 (0.752–1.155) | 0.971 (0.838–1.104) | 0.155 (−0.062–0.372) | 0.223 (−0.011–0.458) |
| 100 | 0.91 | 0.92 | 1.010 (0.798–1.222) | 0.966 (0.832–1.100) | 0.101 (−0.111–0.312) | 0.230 (0.012–0.448) ‡ |
| Load (%) | MBV | ||||
| TENDO | PUSH | GA | TENDO-GA g | PUSH-GA g | |
| 20 | 1.64 ± 0.21 | 1.55 ± 0.18 | 1.53 ± 0.19 | 0.59 (−0.14–1.32) | 0.15 (−0.57–0.86) |
| 40 | 1.55 ± 0.18 | 1.44 ± 0.15 | 1.44 ± 0.15 | 0.64 (−0.10–1.37) | −0.02 (−0.74–0.69) |
| 60 | 1.38 ± 0.14 | 1.25 ± 0.14 | 1.28 ± 0.13 | 0.72 (−0.02–1.46) | −0.26 (−0.98–0.45) |
| 80 | 1.18 ± 0.14 | 1.06 ± 0.13 | 1.11 ± 0.14 | 0.46 (−0.27–1.18) | −0.38 (−1.10–0.34) |
| 100 | 1.14 ± 0.14 | 1.02 ± 0.11 | 1.06 ± 0.13 | 0.57 (−0.16–1.30) | −0.32 (−1.04–0.40) |
| Load (%) | PBV | ||||
| TENDO | PUSH | GA | TENDO-GA g | PUSH-GA g | |
| 20 | 3.09 ± 0.29 | 2.86 ± 0.26 | 2.98 ± 0.30 | 0.36 (−0.37–1.08) | −0.42 (−1.14–0.30) |
| 40 | 2.71 ± 0.24 | 2.56 ± 0.25 | 2.60 ± 0.25 | 0.46 (−0.27–1.18) | −0.14 (−0.85–0.58) |
| 60 | 2.32 ± 0.16 | 2.17 ± 0.16 | 2.25 ± 0.17 | 0.45 (−0.28–1.17) | −0.43 (−1.15–0.30) |
| 80 | 1.95 ± 0.20 | 1.81 ± 0.19 | 1.92 ± 0.20 | 0.16 (−0.56–0.87) | −0.52 (−1.25–0.21) |
| 100 | 1.84 ± 0.16 | 1.71 ± 0.12 | 1.80 ± 0.15 | 0.28 (−0.44–1.00) | −0.61 (−1.34–0.12) |
| Load (%) | MBV | ||||
| TENDO | PUSH | GA | TENDO-GA g | PUSH-GA g | |
| 20 | 1.92 ± 0.27 | 1.77 ± 0.36 | 1.80 ± 0.25 | 0.45 (−0.28–1.17) | −0.08 (−0.80–0.63) |
| 40 | 1.69 ± 0.19 | 1.49 ± 0.23 | 1.60 ± 0.18 | 0.43 (−0.29–1.16) | −0.55 (−1.28–0.18) |
| 60 | 1.44 ± 0.16 | 1.26 ± 0.17 | 1.38 ± 0.16 | 0.31 (−0.41–1.03) | −0.75 (−1.49–−0.01) * |
| 80 | 1.21 ± 0.13 | 1.06 ± 0.14 | 1.17 ± 0.13 | 0.32 (−0.40–1.04) | −0.76 (−1.50–−0.02) * |
| 100 | 1.11 ± 0.14 | 0.95 ± 0.12 | 1.06 ± 0.12 | 0.32 (−0.40–1.04) | −0.86 (−1.61–−0.11) * |
| Load (%) | PBV | ||||
| TENDO | PUSH | GA | TENDO-GA g | PUSH-GA g | |
| 20 | 3.08 ± 0.30 | 2.80 ± 0.34 | 2.96 ± 0.36 | 0.35 (−0.37–1.07) | −0.43 (−1.16–0.29) |
| 40 | 2.67 ± 0.17 | 2.45 ± 0.21 | 2.55 ± 0.20 | 0.64 (−0.10–1.37) | −0.47 (−1.19–0.26) |
| 60 | 2.33 ± 0.17 | 2.12 ± 0.18 | 2.26 ± 0.18 | 0.38 (−0.34–1.10) | −0.76 (−1.50–−0.02) * |
| 80 | 2.02 ± 0.18 | 1.82 ± 0.21 | 1.99 ± 0.20 | 0.15 (−0.57–0.87) | −0.82 (−1.56–−0.07) * |
| 100 | 1.88 ± 0.15 | 1.67 ± 0.16 | 1.85 ± 0.16 | 0.24 (−0.48–0.96) | −1.07 (−1.84–−0.31) * |
Disclaimer/Publisher’s Note: The statements, opinions and data contained in all publications are solely those of the individual author(s) and contributor(s) and not of MDPI and/or the editor(s). MDPI and/or the editor(s) disclaim responsibility for any injury to people or property resulting from any ideas, methods, instructions or products referred to in the content. |
© 2023 by the authors. Licensee MDPI, Basel, Switzerland. This article is an open access article distributed under the terms and conditions of the Creative Commons Attribution (CC BY) license (https://creativecommons.org/licenses/by/4.0/).
Share and Cite
Suchomel, T.J.; Techmanski, B.S.; Kissick, C.R.; Comfort, P. Reliability, Validity, and Comparison of Barbell Velocity Measurement Devices during the Jump Shrug and Hang High Pull. J. Funct. Morphol. Kinesiol. 2023, 8, 35. https://doi.org/10.3390/jfmk8010035
Suchomel TJ, Techmanski BS, Kissick CR, Comfort P. Reliability, Validity, and Comparison of Barbell Velocity Measurement Devices during the Jump Shrug and Hang High Pull. Journal of Functional Morphology and Kinesiology. 2023; 8(1):35. https://doi.org/10.3390/jfmk8010035
Chicago/Turabian StyleSuchomel, Timothy J., Baylee S. Techmanski, Cameron R. Kissick, and Paul Comfort. 2023. "Reliability, Validity, and Comparison of Barbell Velocity Measurement Devices during the Jump Shrug and Hang High Pull" Journal of Functional Morphology and Kinesiology 8, no. 1: 35. https://doi.org/10.3390/jfmk8010035