1. Introduction
In current cosmology, the Comic Microwave Background (CMB) is an invaluable observable that can give information to probe and complete the standard cosmological model, since the statistical properties of its anisotropies are closely related to the conditions of the early stages of the Universe, as well as to the material and energetic content that governs its dynamics. These anisotropies have been characterized with high precision by experiments such as Planck [
1].
However, the CMB is partially polarized and the characterization of the properties of the polarization modes is one of the main goals of future experiments (e.g., [
2,
3,
4]), which have as a common primary objective the eventual indirect detection of the primordial gravitational wave background predicted by the cosmic inflation mechanism. Such a primordial background is proportional to the amplitude of the CMB polarization B-mode, which is typically parameterized by the
r parameter, which defines the ratio between the amplitude of the density fluctuations (which essentially define the temperature and polarization E-mode anisotropies) and the tensor fluctuations (generators of the B-mode). The current best limit is
at
confidence [
5].
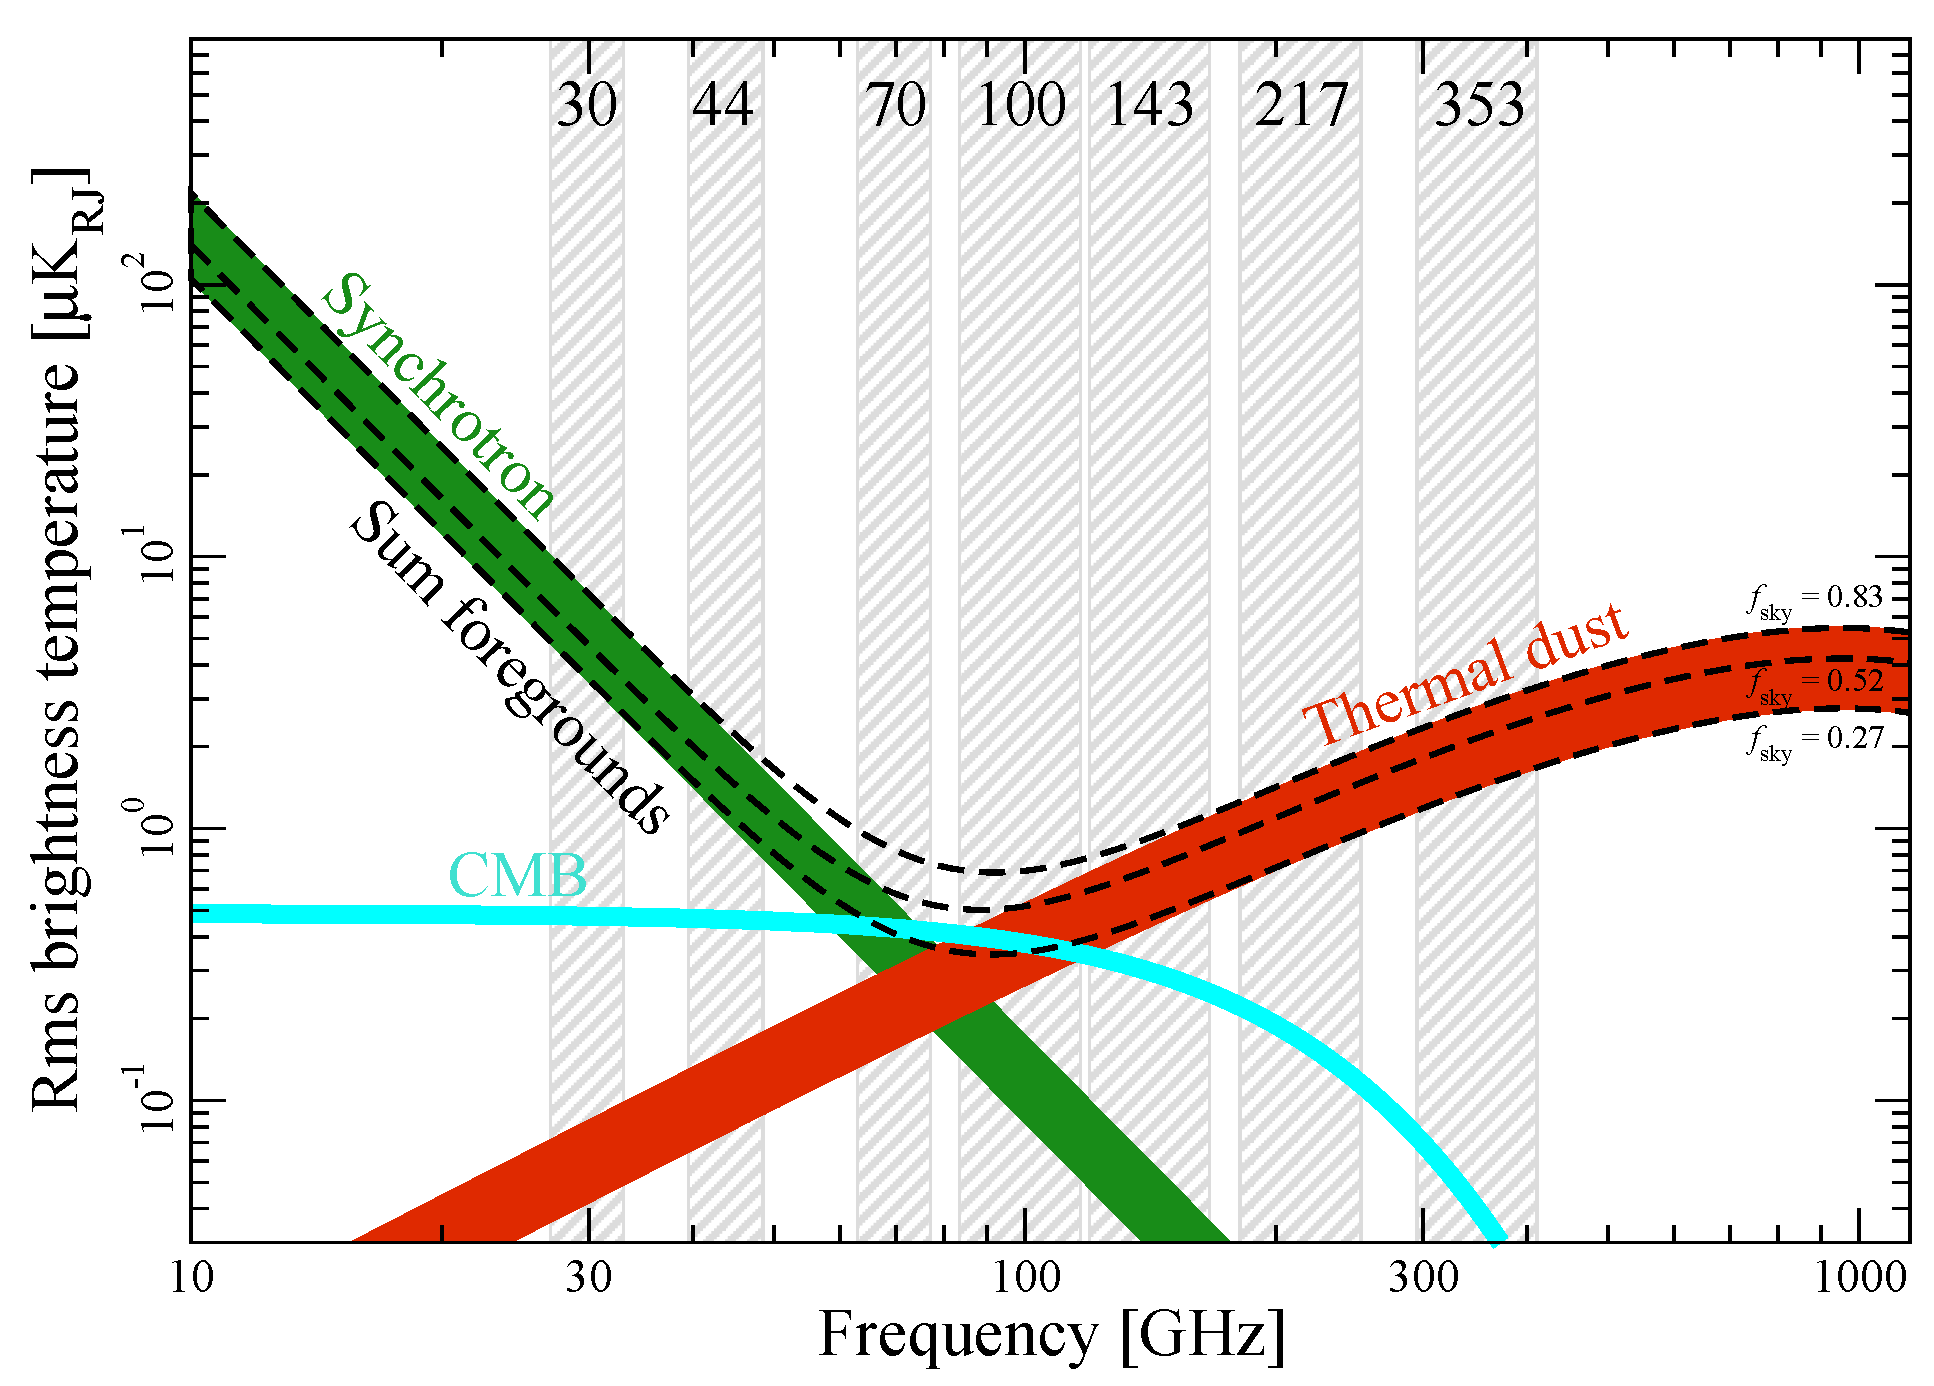
The anisotropies of these polarized signals are very weak and are contaminated by other dominant emissions in the microwave range. The main contaminants are thermal emission from galactic dust at frequencies above 200 GHz and synchrotron radiation at frequencies below 50 GHz. As can be seen in
Figure 1 obtained from [
6], the CMB E-mode polarized signal is subdominant in almost all bands. The situation is worse for the B-mode, which essentially carries the information related to primordial gravitational waves. This is why multi-frequency experiments with high sensitivity are needed in order to apply component separation techniques to separate the primordial emission from that of the contaminants.
Microwave telescopes usually work with direct imaging instruments that have a strong limitation on the maximum number of detectors due to limited focal plane spacing. This is especially critical at low frequencies (less than 50 GHz), as the antennas have larger sizes. Therefore, direct imaging instruments face certain limitations, particularly for the 10 to 50 GHz range, as the sensitivity required for CMB polarization experiments is continually increasing.
One solution to this problem is to use interferometric designs, where the focal plane spacing is no longer a limiting factor. The resolution and sensitivity of the interferometer are limited by the maximum baseline of the configuration and the number of different baselines, respectively. However, wide-band interferometers face limitations related to the phase control and routing of a large number of microwave signals.
In previous works [
7,
8,
9], heterodyne polarimeters with electro-optical modulators and simple optical configurations to correlate all signals following a Fizzeau interferometric scheme were already proposed as promising alternatives in terms of cost and sensitivity.
In this work, an InP photonic integrated circuit (PIC) version of the photonic part of the optimized polarimeter shown in [
9] is proposed and simulated. The main idea is to have an external microwave front-end module (FEM) to receive the microwave signals and to implement all the modules of the electro-optical back-end module (EOBEM, see [
9]), responsible for the upconversion and correlation of the signals, in a small InP chip using integrated photonics technology. Some of the components that have been used for the designed chip are similar to those that can be found in [
10] for SiN technology. Other examples of this alternative technology’s application can be found in [
11,
12].
Implementing the EOBEM in small chips brings a number of advantages related to size reduction, the scaling of the number of detectors, power consumption, phase stability and better control of the systematics.
While waiting to obtain additional funding to fabricate and test the proposed PIC, we have used specific commercial software to acquire a performance forecast of the designed PIC.
This paper is organized as follows. After this Introduction, in
Section 2, the design of the PIC is shown and described. Then, in
Section 3, we present some simulations of the PIC’s behavior using specific software. Finally, the conclusions obtained from this work are shown in
Section 4.
2. Photonic Integrated Circuit Design
In order to design a PIC replicating the EOBEM shown in [
9], a Python open-source framework called NAZCA [
13] has been used. However, in order to achieve a functional design, adequate to be fabricated in a further step, it is important to acquire a commercial Process Design Kit (PDK) that allows the use of commercial library designs from a certain company. These designs allow the implementation of specific photonic modules with quite restricted design rules. In this case, we have purchased the HHI-Fraunhoffer Institute’s [
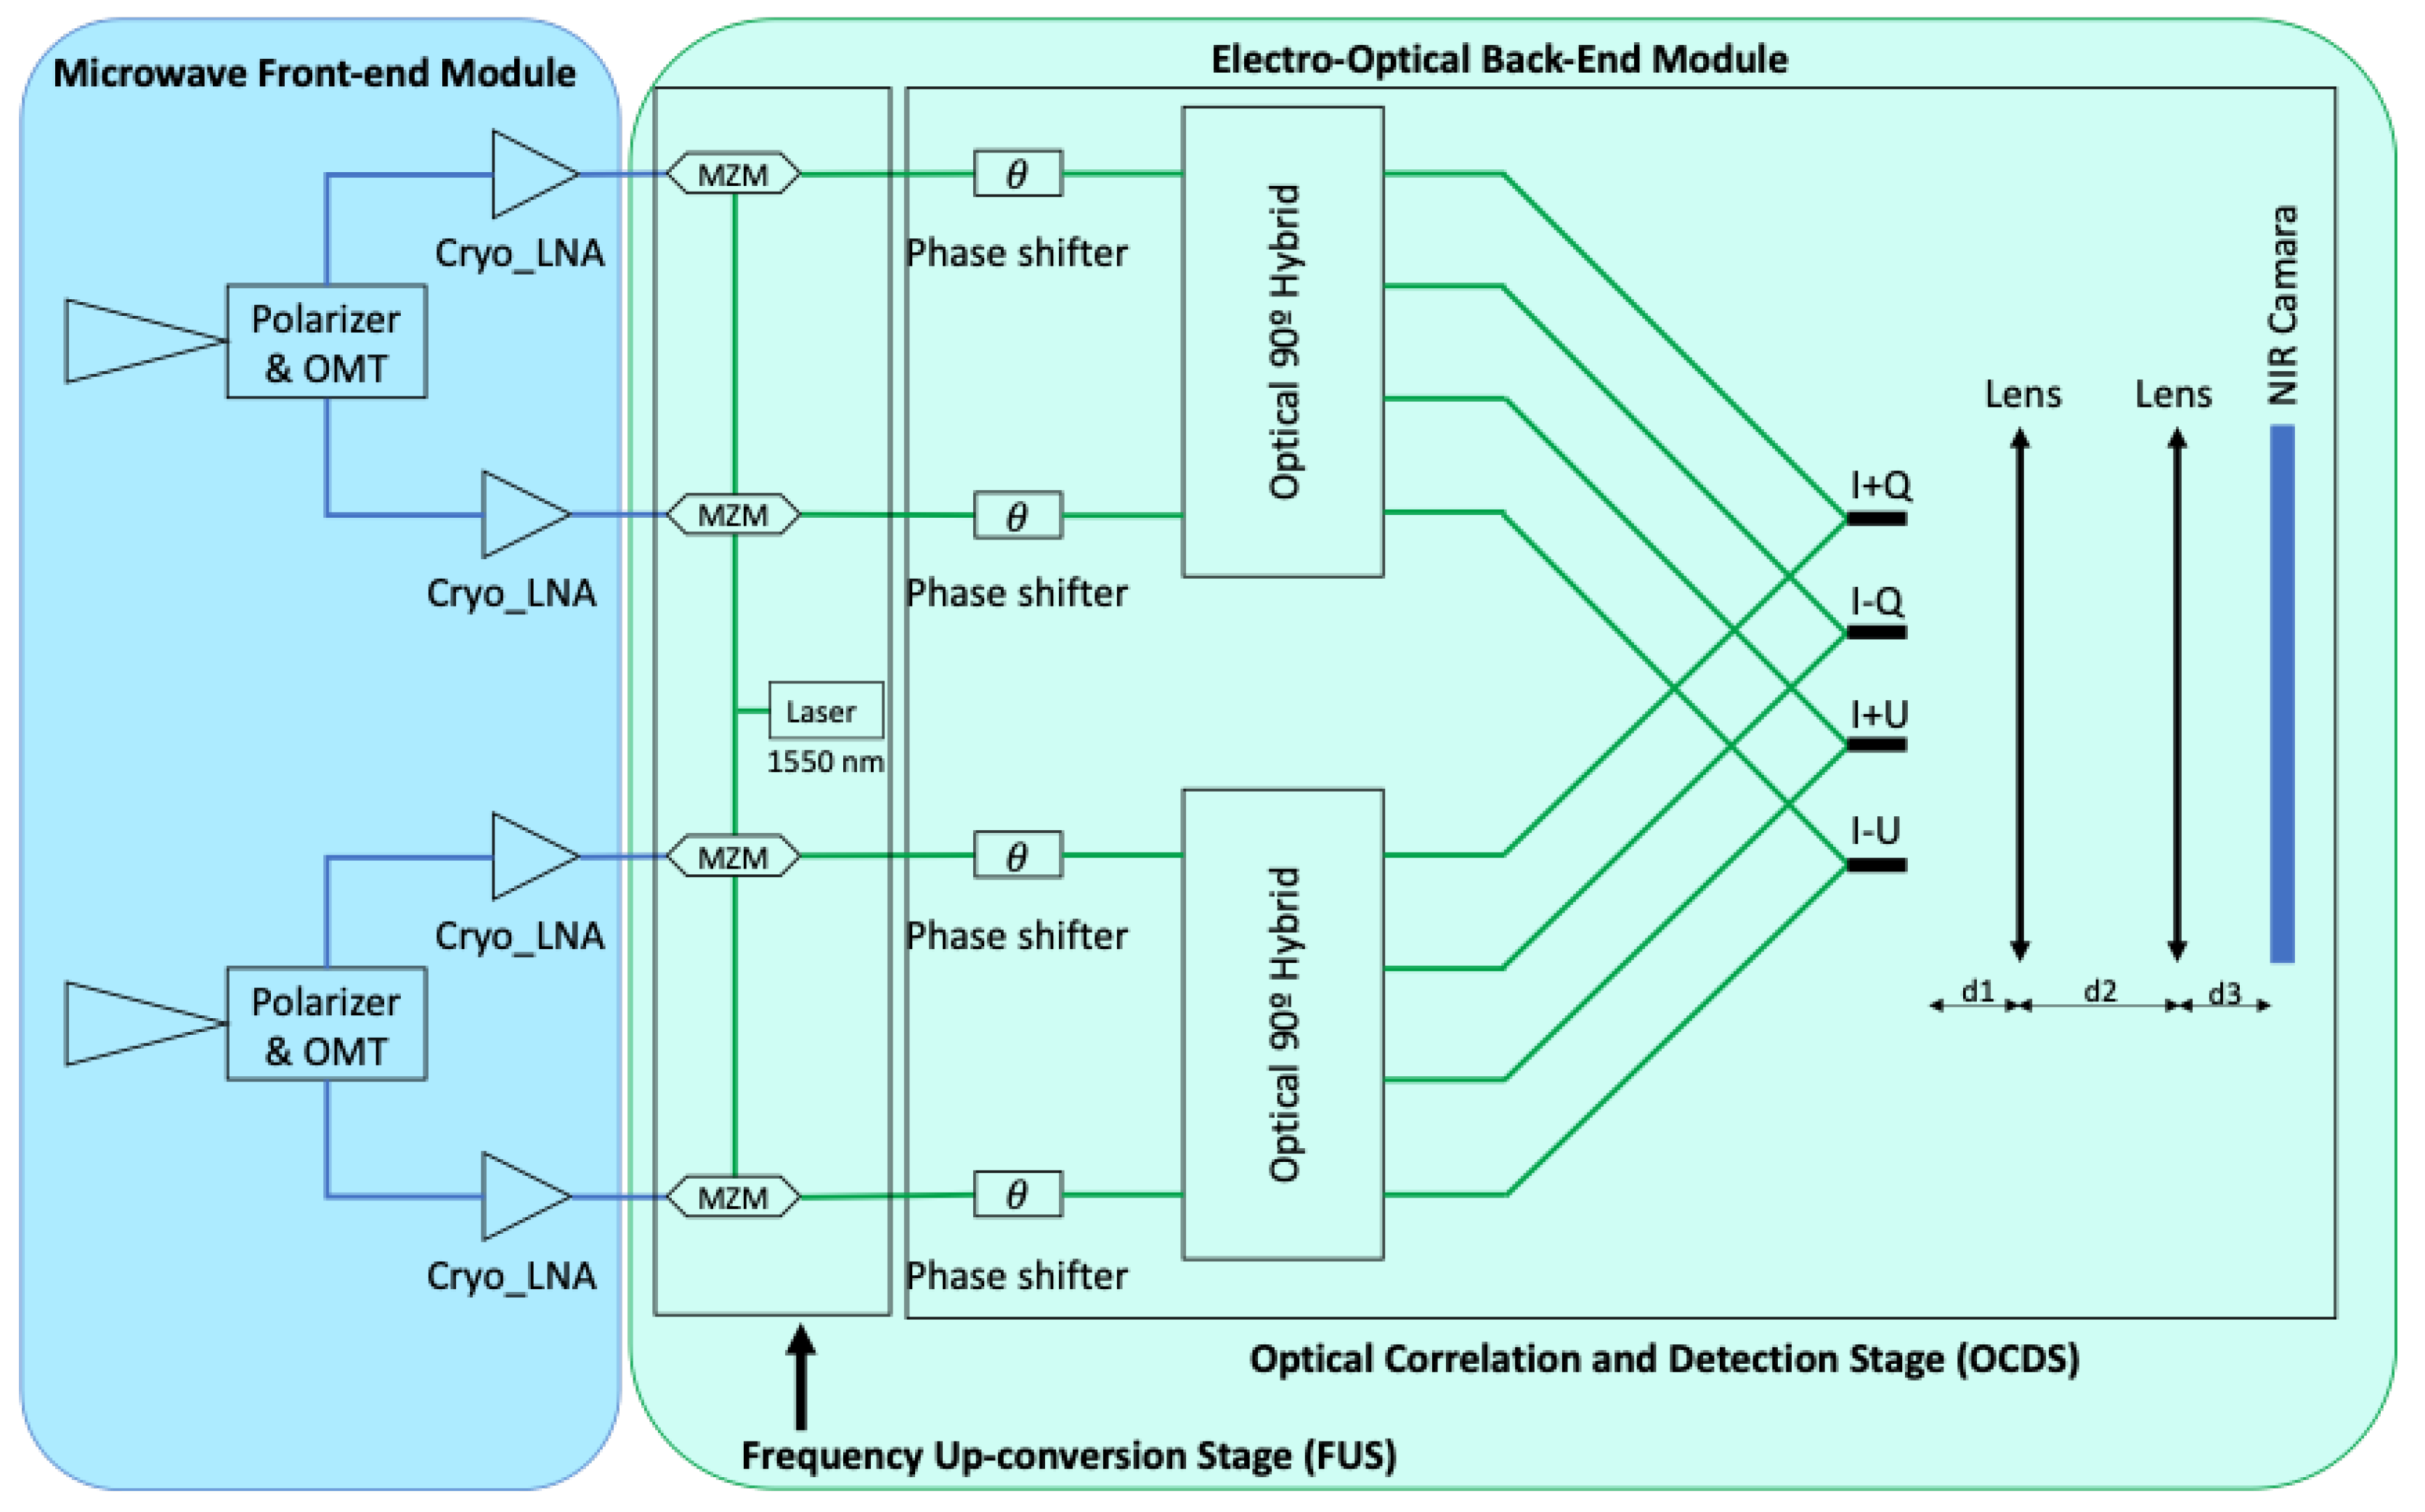
14] PDK because they have developed InP technology-integrated versions of all the modules (known as building blocks, BB), needed to design a PIC replicating the EOBEM shown in [
9] (the scheme can be also seen in
Figure 2) while allowing the user to introduce active modules such as Mach–Zenhder modulators (MZM), like the ones already presented in a recent work [
15].
The design of the circuit was obtained following all the design rules established by the HHI-Fraunhoffer Institute, so that it can be perfectly fabricated during a Multi-Project Wafer (MPW) run set by them. In brief, there are several constraints related to the size of the chip, the separation and curvature radius of the waveguides and DC and RF tracks and other specific requirements related to each BB. Most of these constraints arise from the tolerances related to the involved mechanical processes in chip fabrication. For instance, HHI proves the total accuracy of 5% in the thickness of the grown layers and ±100 nm tolerance in the etching of the used waveguides.
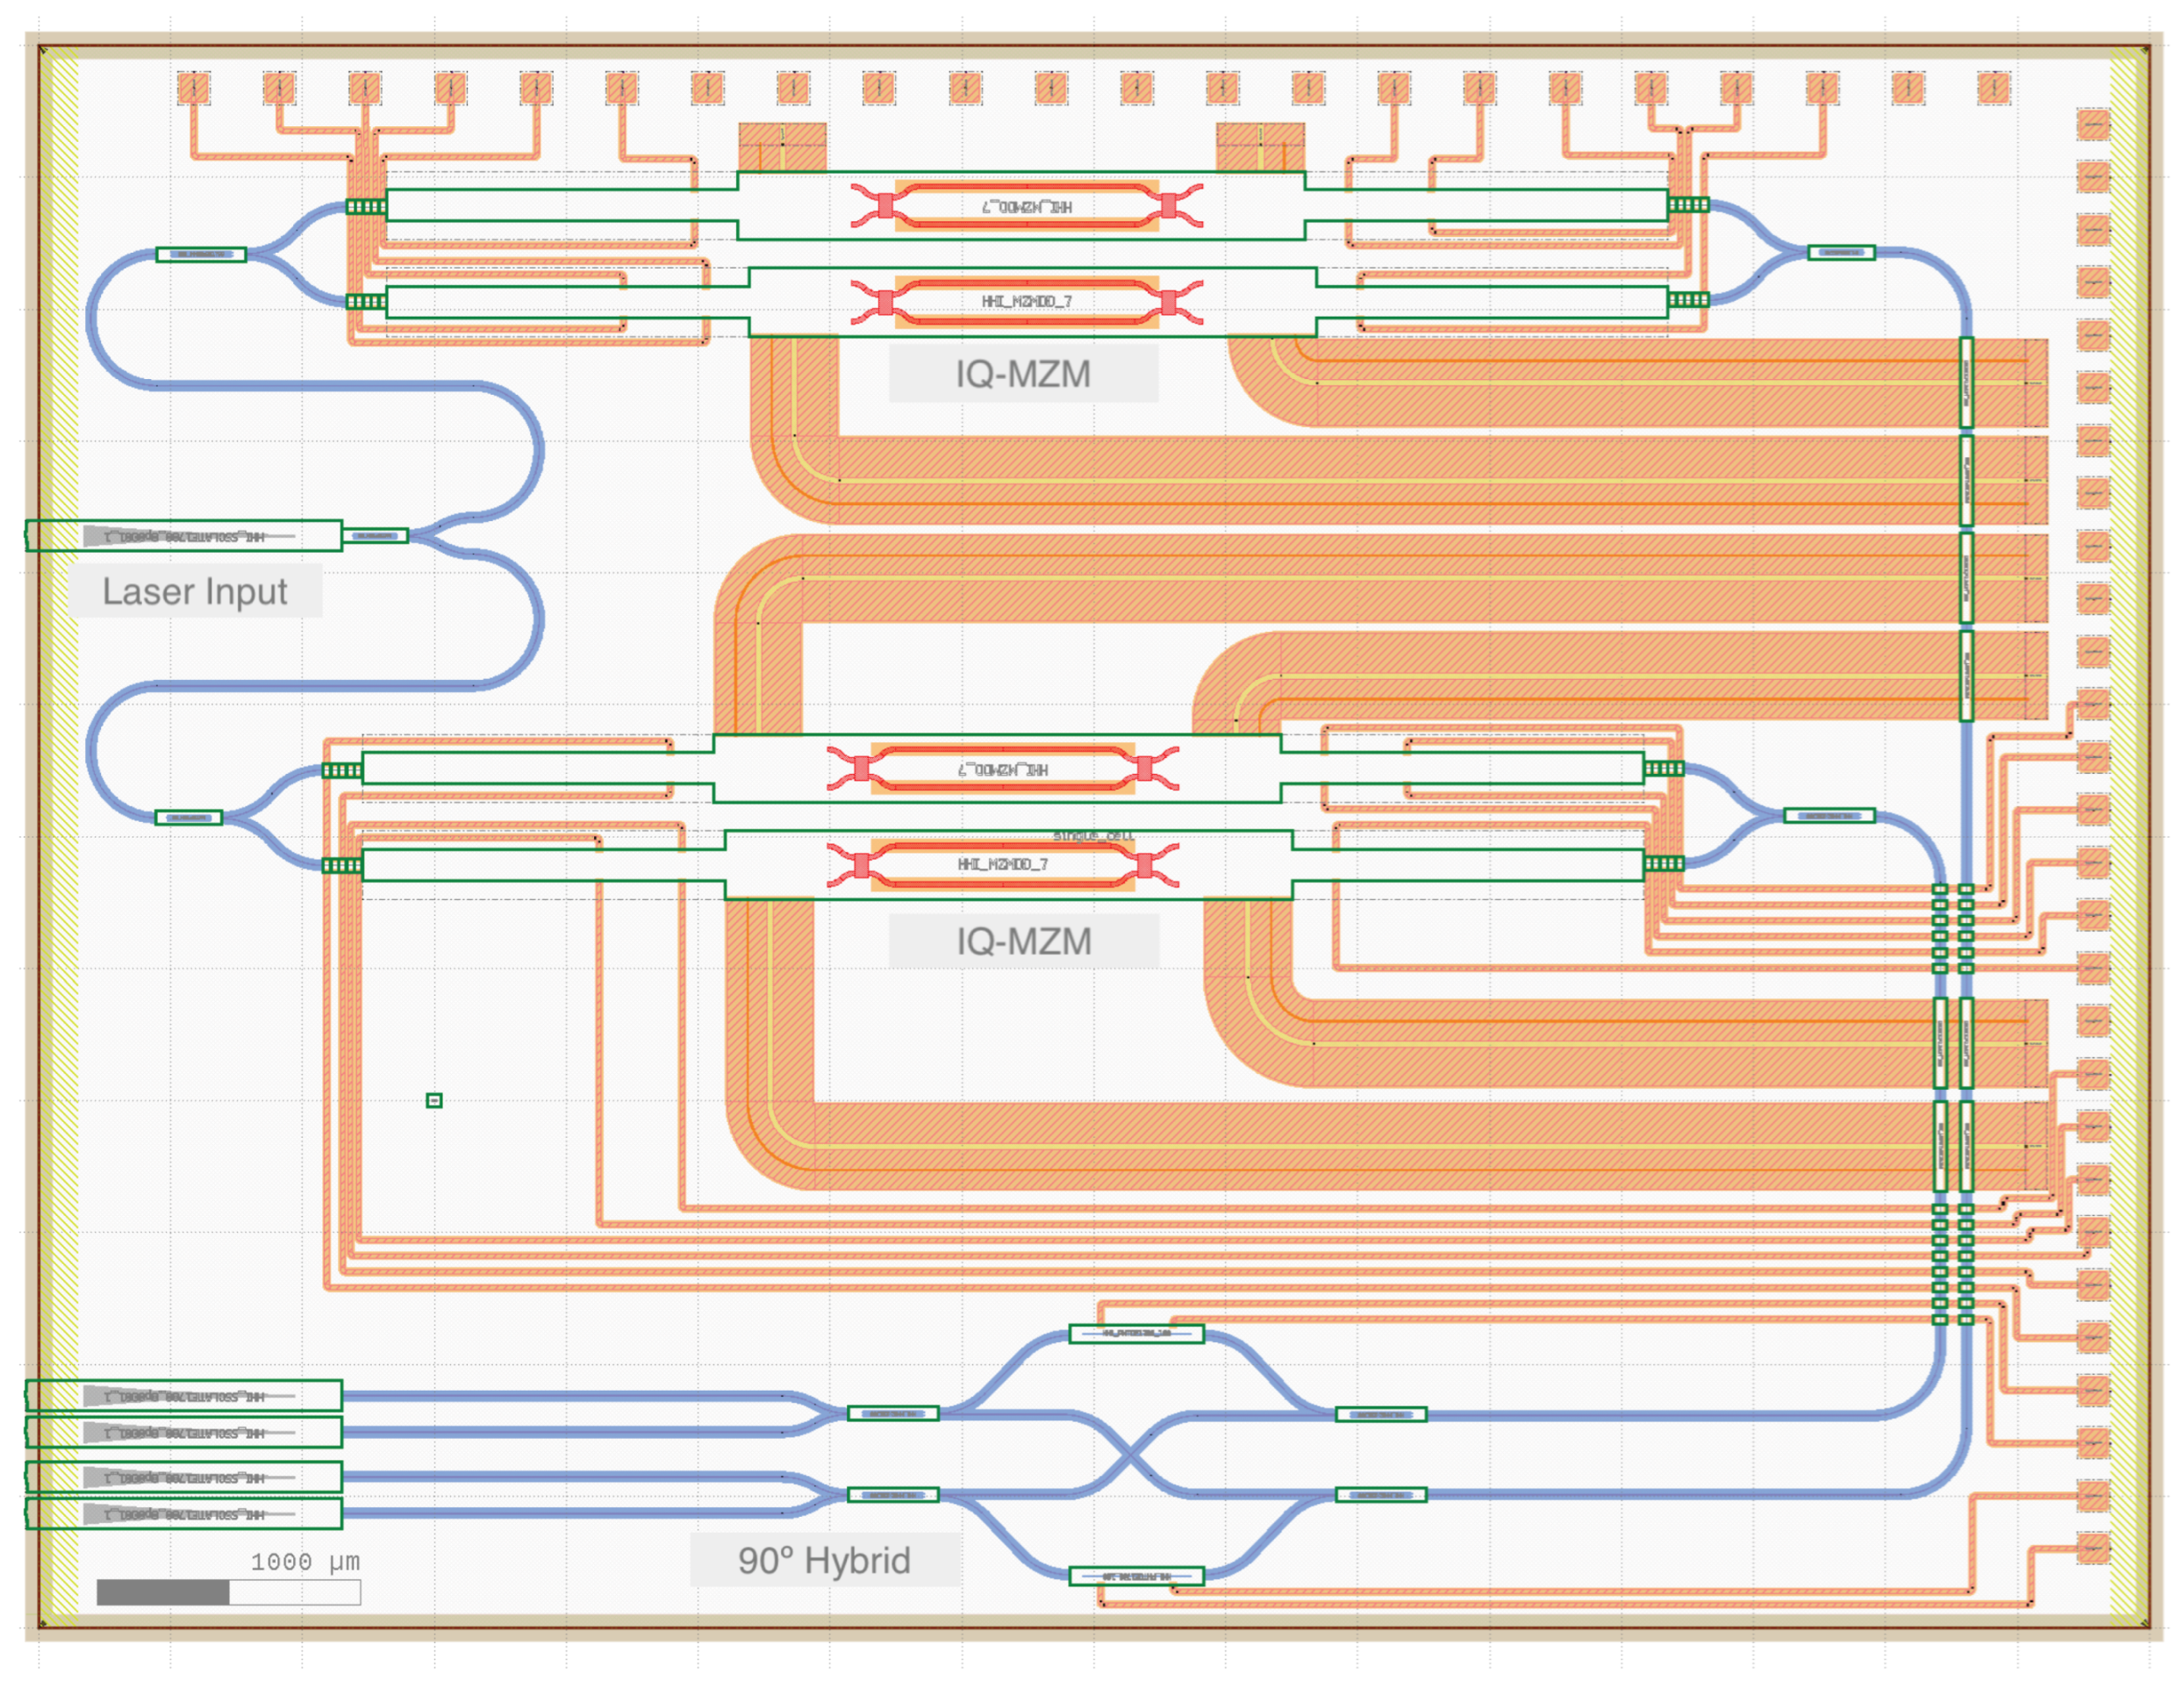
The final design of the PIC is shown in
Figure 3, where a small chip of 8 × 6 mm with different integrated modules can be seen. In the design, 3 different types of paths can be found.
The narrow blue paths correspond to the HHI waveguides (E1700 geometry was used in this design). These waveguides have a width of 2 μm and their propagation losses are less than 3 dB/cm.
The orange wide tracks correspond to ground-signal (GS) radio-frequency (RF) waveguides.
The orange narrow tracks are related to the electrical DC connections.
Next, every module of the design is explained in detail.
2.1. Laser Input
Our PIC needs an external near-infrared (NIR) laser signal to modulate the microwave signals coming from the FEM of the polarimeter. The proposed design considers the use of one PIC per receiver, for the later correlation of the up-converted signals using Fizeau interferometry. Therefore, we need to introduce a coherent optical signal in all the chips. The input for the NIR laser is located at the upper-left part of the chip.
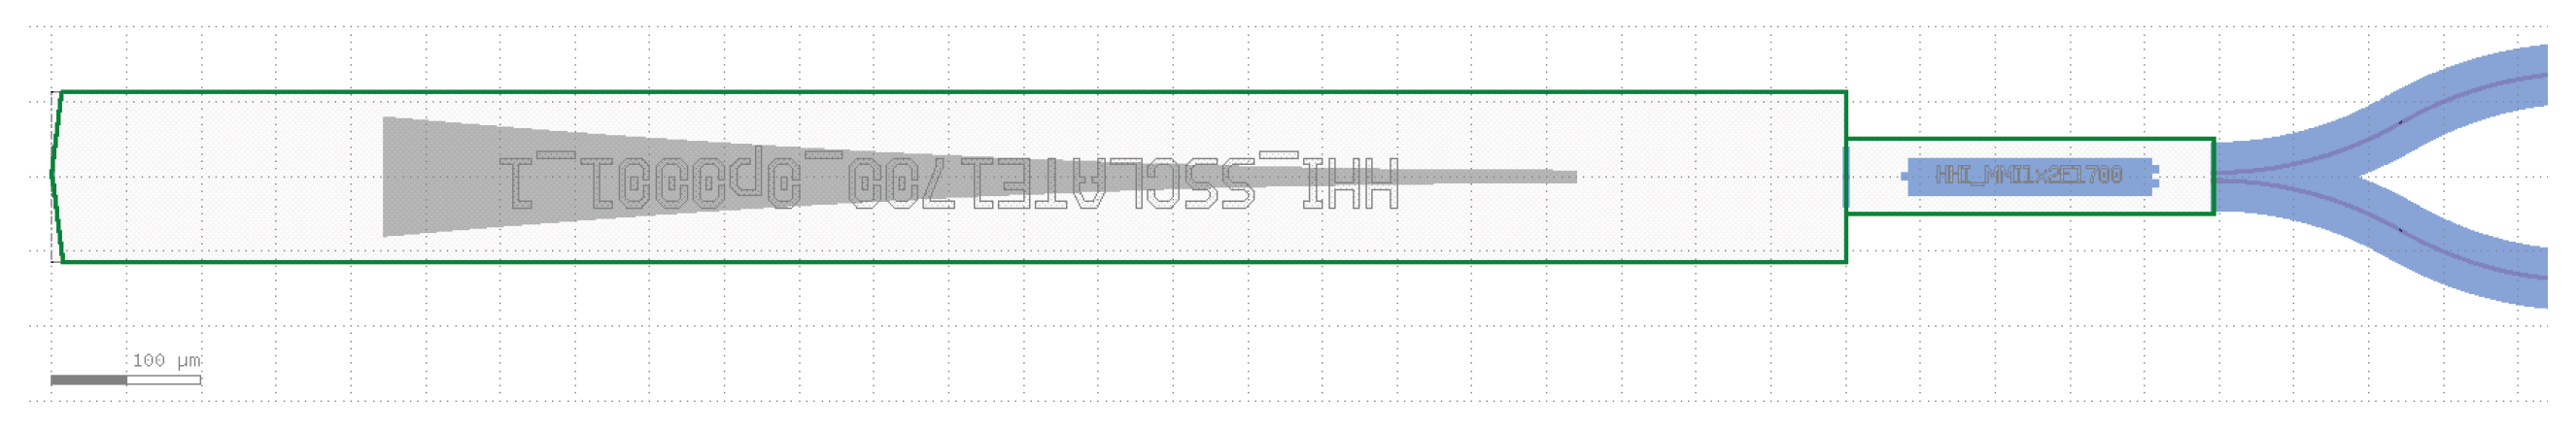
As can be seen in
Figure 4, it is composed of a spot-size converter (SSC), which allows the coupling of the NIR signal in and out of the chip with less than 2 dB signal loss, and a 1 × 2 multi-mode interference (MMI) coupler, working as a power divider, to split the input signal into 2 different outputs with less than 1 dB insertion losses.
Finally, these signals are introduced in two different IQ-MZMs.
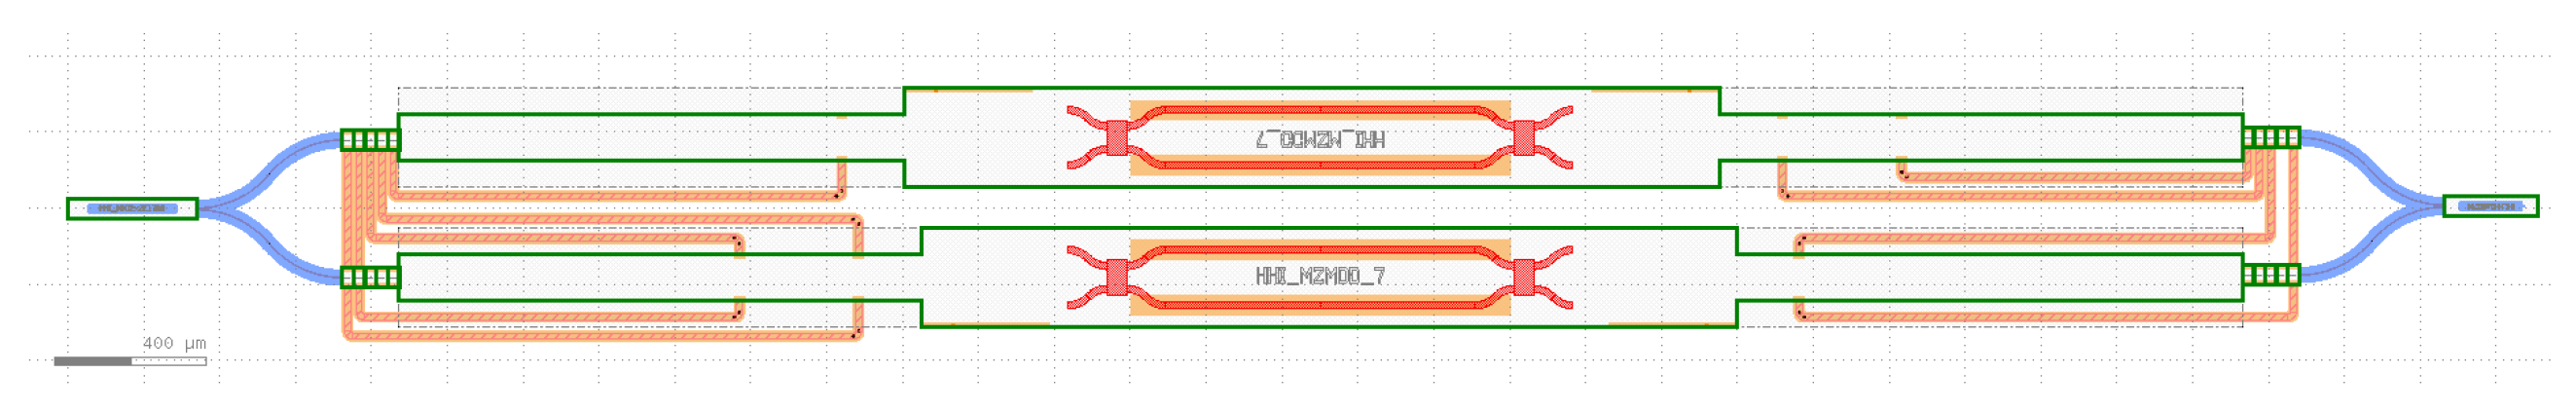
2.2. IQ Mach–Zehnder Modulators
HHI provides a complex design of a dual-drive Mach–Zehnder modulator (DD-MZM) based on traveling wave electrode (TWE) technology, which is expected to have similar behavior to the ones shown in [
15]. These DD-MZM are expected to have an extinction ratio higher than 20 dB and introduce less than 6 dB insertion losses.
However, we wish to use this heterodyne polarimeter in Fizzeau interferometry configurations, which means that we should be able to achieve mono-frequency modulated signals. One way to generate them is to use an IQ-MZM working under the single-sideband suppressed carrier (SSB-SC) modulation regime.
For this reason, an IQ-MZM has been implemented using two of the dual-drive MZMs provided by HHI, as can be seen in
Figure 5.
The input signal is divided using a 2 × 2 MMI that has the same functionality as a 90 coupler (the phase difference between the two output paths is 90 when only one input path is used to feed the module) and then the output signals from the MZM are combined with a 2 × 1 MMI coupler. As before, the insertion losses of each MMI are expected to be less than 1 dB.
As can be seen in [
16], this design is equivalent to an IQ modulator that, with the proper combination of bias voltages and RF inputs, can produce carrier-suppressed SSB modulation, which is especially interesting for interferometric configurations. For a more detailed description of the SSB modulation regime, please see [
17,
18,
19].
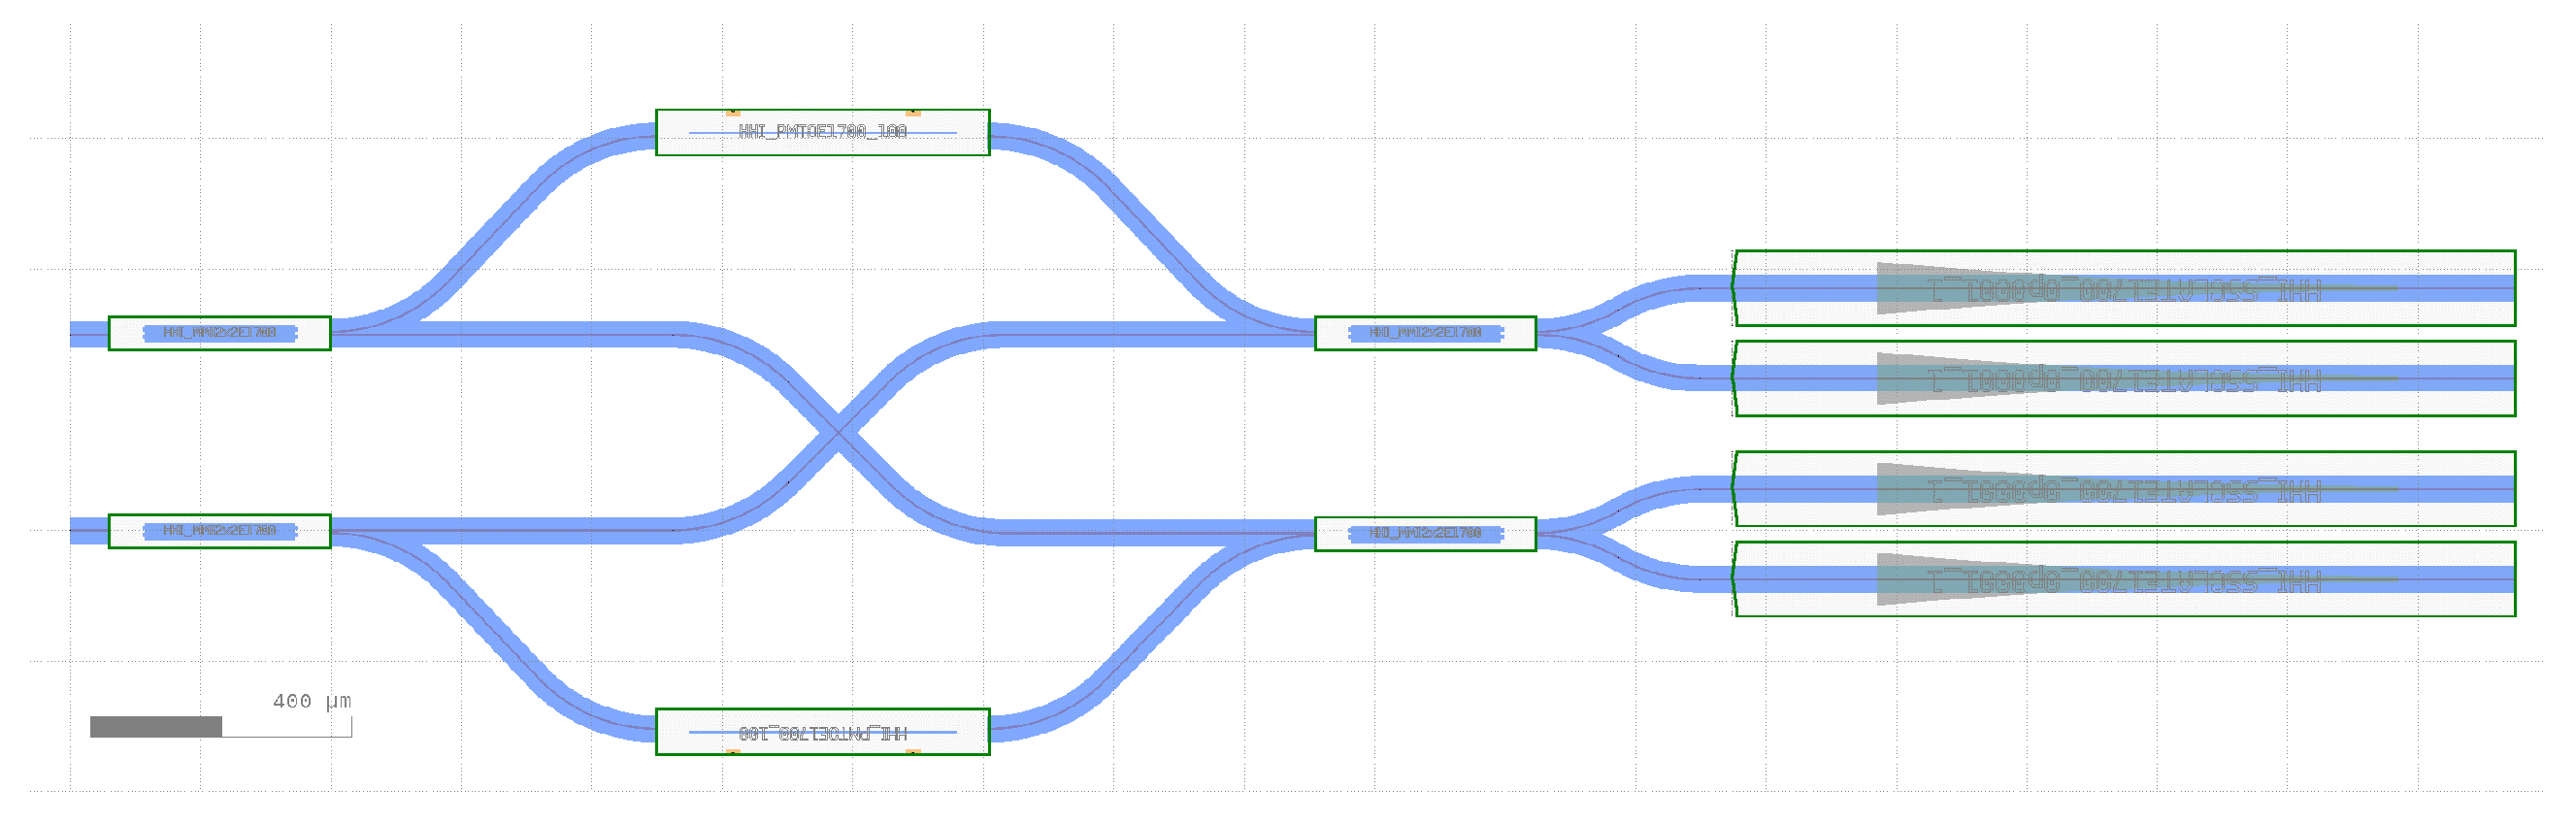
2.3. Optical 90 Hybrid
Following the scheme proposed by [
20], a 90
optical hybrid has been developed (see
Figure 6). It is composed of several MMIs, which are responsible for dividing and combining the 2 input signals, and two 100 μm long thermo-optical phase shifters that allow us to modify the phases of the two external branches by means of an external DC signal. This configuration allows us to obtain the 4 desired polarimeter outputs proportional to different combinations of the Stokes parameters [
7,
8,
9]. These phase shifters have very low insertion losses, less than 2 dB/cm, which are similar to the waveguides’ losses, so every branch of the 90
optical hybrid should be well balanced.
The proposed design allows us to avoid the implementation of the phase shifters proposed in [
9], as we can already modify the phases between branches to obtain all the combinations of the Stokes parameters on every single output. This allows the great simplification and compaction of the final EOBEM design.
Finally, every optical output is taken outside from the lower-left side of the chip, using the same SSC modules used for the laser input.
2.4. Summary of PIC Module Parameters
The values of the previously reported parameters for the different PIC modules used in the design are summarized in
Table 1. The main parameter provided by the foundry is related to the insertion losses introduced by each module. In the case of the Mach–Zehnder modulators, the extinction ratio is also provided. More information on the design rules and the data sheets of every module can be obtained from FHI-HHI [
14] upon direct request.
3. Design Simulation
After finishing the design, the next step is to perform some simulations to test its behavior. A specific commercial software program for electro-optic simulations, called VPIphotonics Design suite [
21], has been used. It allows the creation of electro-optical circuits with predefined blocks whose parameters can be easily modified, followed by the simulation of the whole circuit.
VPIphotonics also has the corresponding PDK from the HHI-Fraunhoffer Institute, which adds some new blocks replicating the behavior and properties of the PIC components used in the design. This allows us to perform accurate simulations, providing a realistic representation of the InP chip’s behavior.
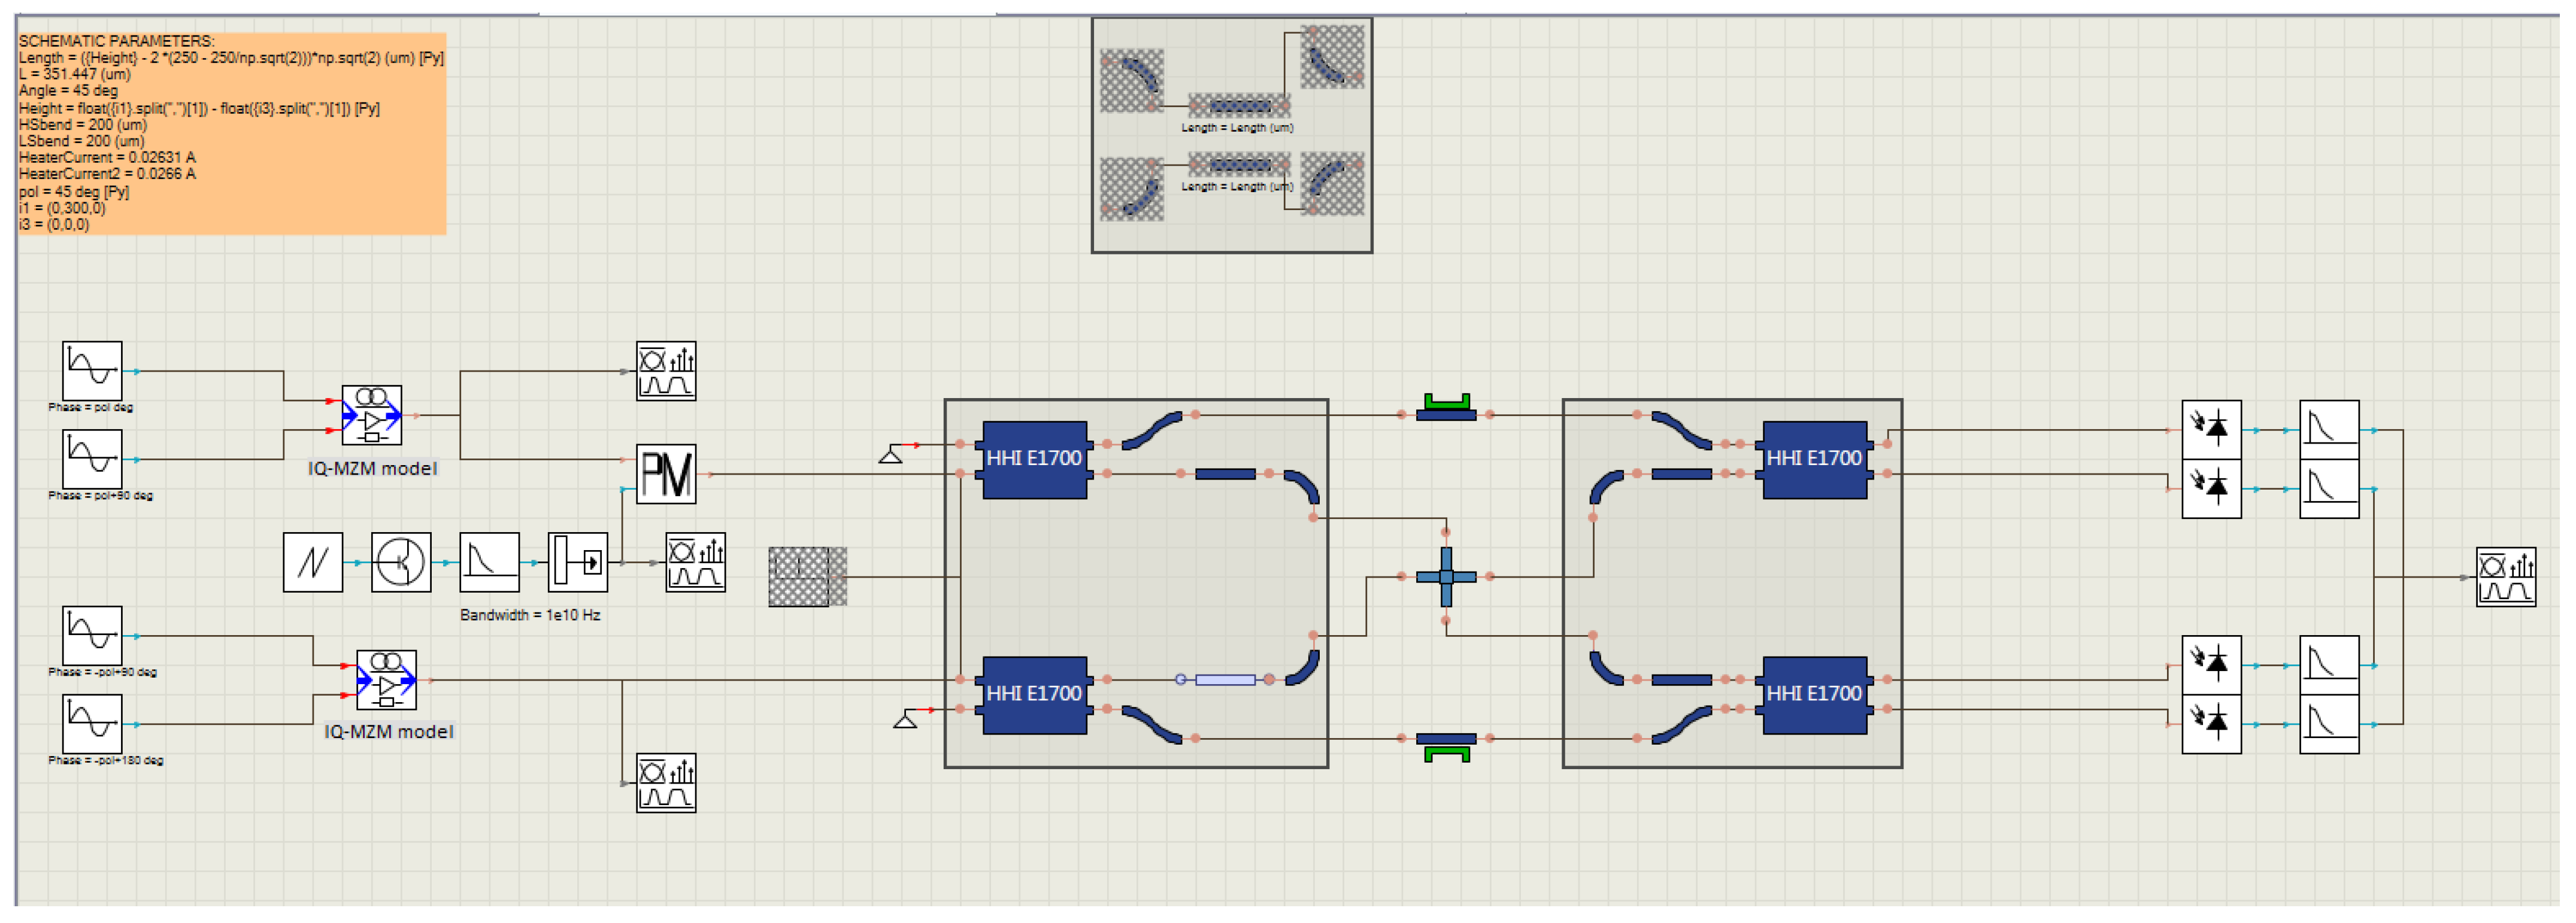
Figure 7 shows the implemented PIC scheme for the chip simulation. From left to right, we can see the input RF signals connected to a user-developed block to simulate the IQ-MZM (indicated by “IQ-MZM model”), which will be later explained in detail (
Figure 8), to produce the modulated SSB-SC IR signals. Then, the upper IQ-MZM is connected to a phase modulator that includes saw-tooth phase modulation between 0
and 360
in order to measure the full polarization state on every output of the PIC (as seen in [
9]). Later, the phase-modulated output and lower IQ-MZM output are connected to HHI blocks that represent the developed 90
hybrid [
20], and, finally, the signals are detected by a photo-detector and low-pass-filtered to replicate the behavior of an infrared camera.
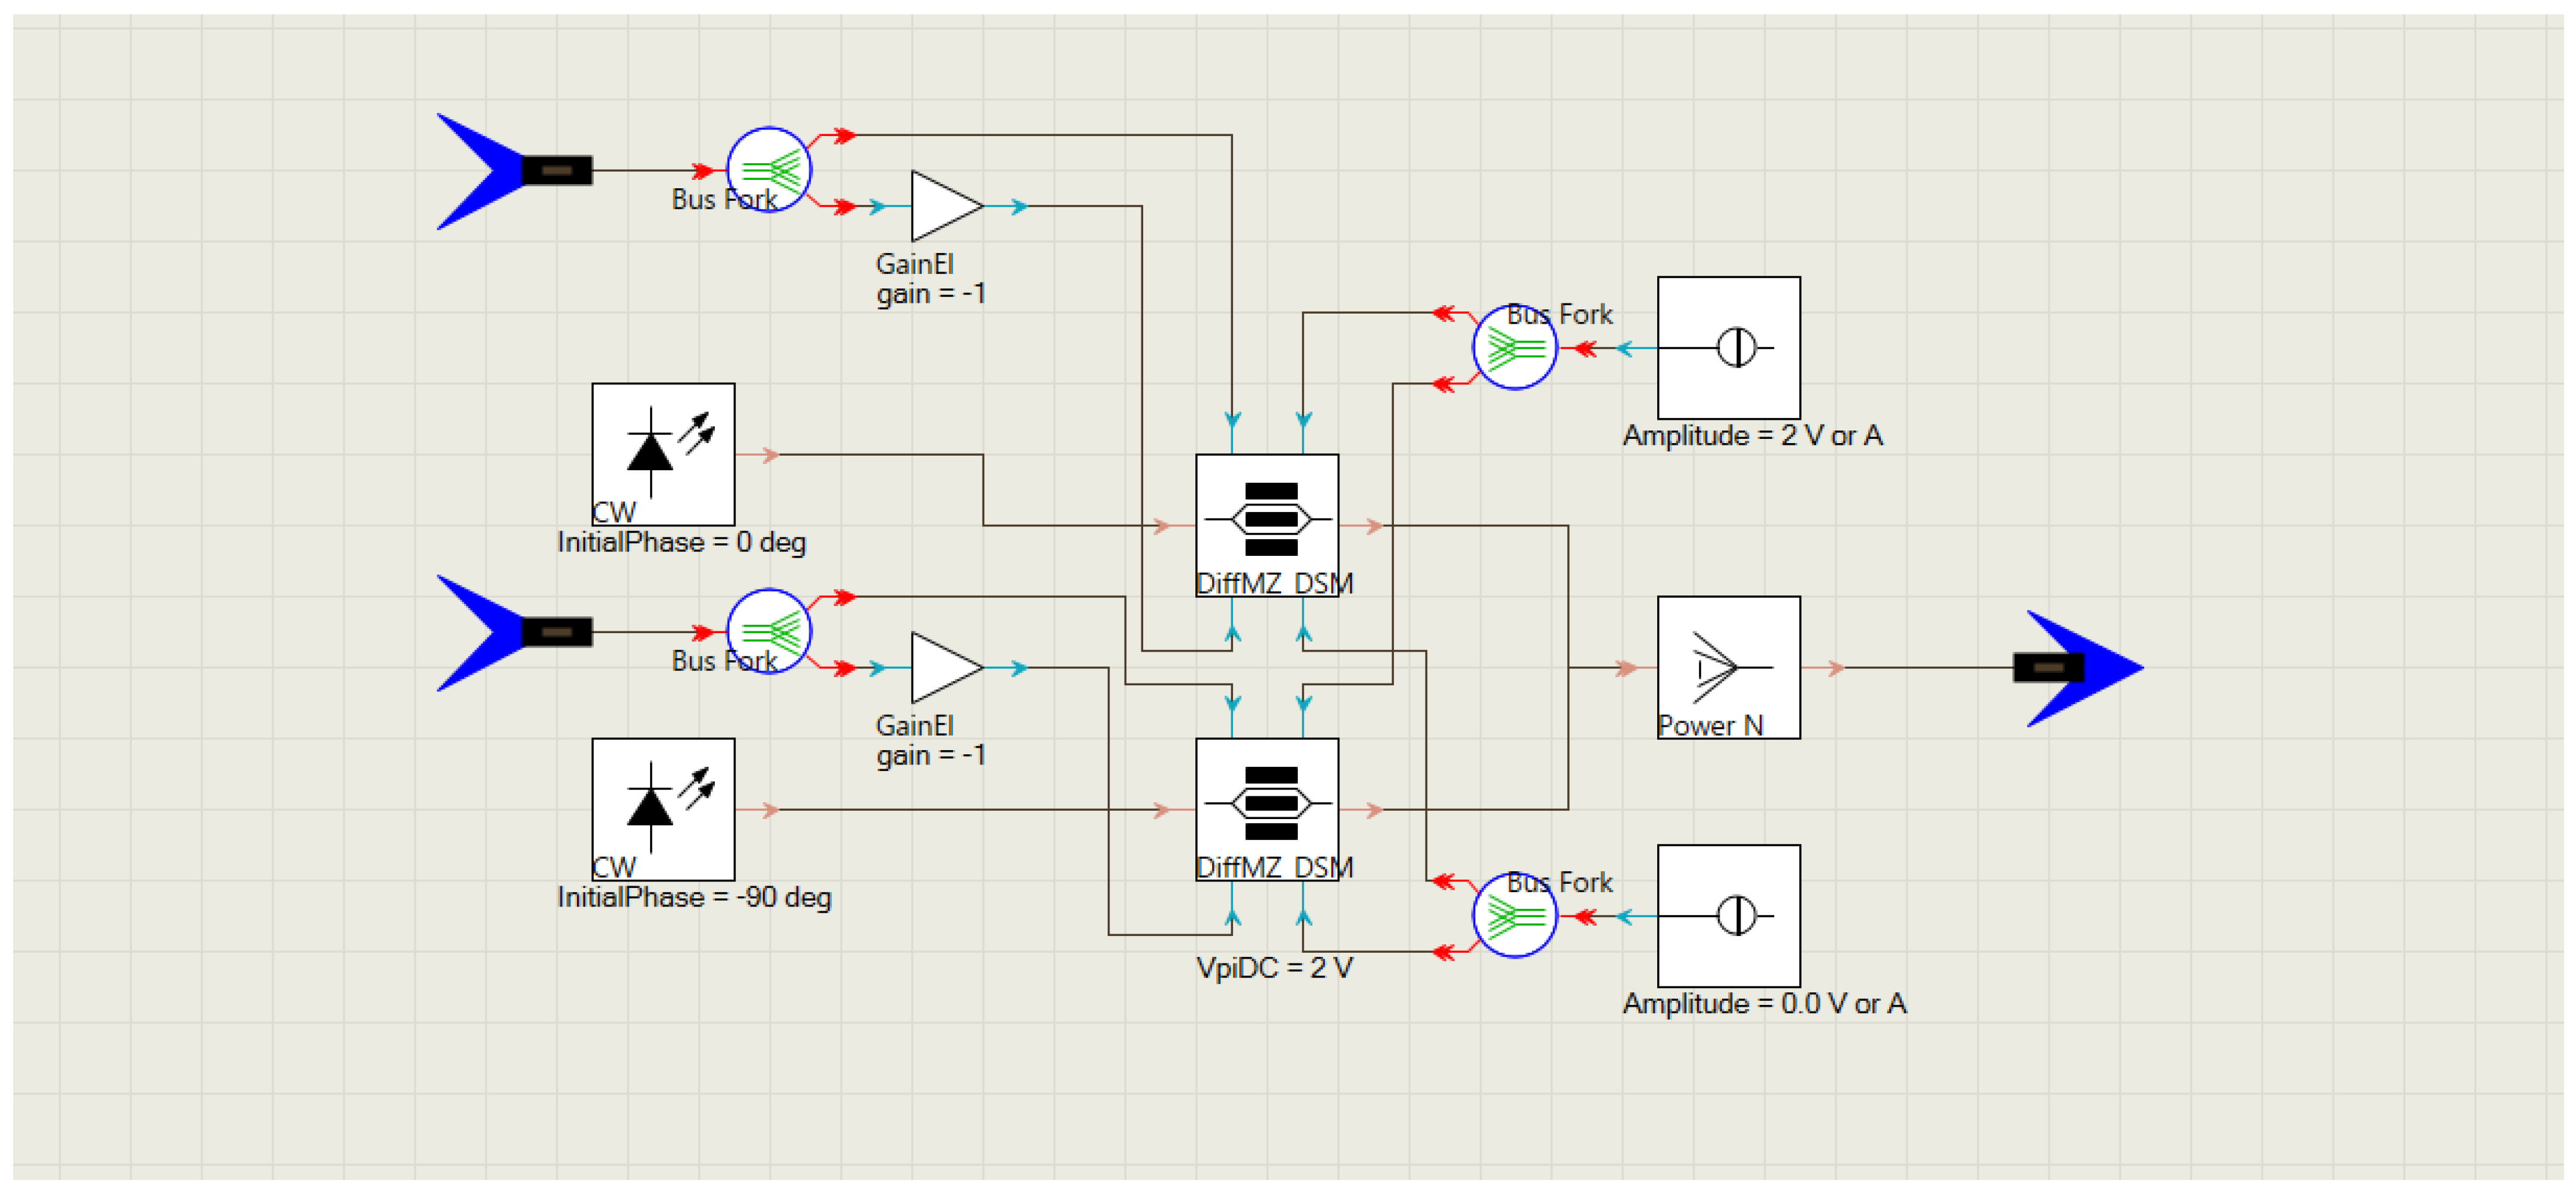
The user-defined block used to simulate the IQ-MZM is shown in
Figure 8. It can be appreciated that it follows the scheme described in
Figure 5, where we have 2 DD-MZMs whose IR inputs have a phase difference of 90
. Then, by applying the specific RF signals with the corresponding bias voltages, the desired SSB-SC modulation can be achieved. These DD-MZMs are simulated using a generic block provided by VPI, as HHI does not provide a building block for the simulation of their specific DD-MZM.
First of all, we must configure the voltages of the thermal-phase modulators so that the outputs are equal to those of a 90 optical hybrid. In order to achieve this, a mono-frequency test signal is introduced on the hybrid and the input voltage of the phase modulation is swept until we find the ones that generate the desired in-phase and quadrature combinations. This means that the output power of one channel is null (180), another one is equal to 2 times the input power (0) and the other 2 channels have output power equal to the input one (90 and 270).
Once we have set the voltages, a period equal to 2 times the period of the saw-tooth modulating voltage is simulated, ensuring that every component is working properly. The time-ordered data (TOD) are then obtained from the 4 different 90 hybrid outputs for different values of the input polarization signal.
Finally, the TODS are further analyzed with the final aim of recovering their amplitudes and phases and thus (after taking into account the specific phase corrections per channel; Equation (11) in [
9]) recovering the input polarization angle and degree and their accuracy.
Results
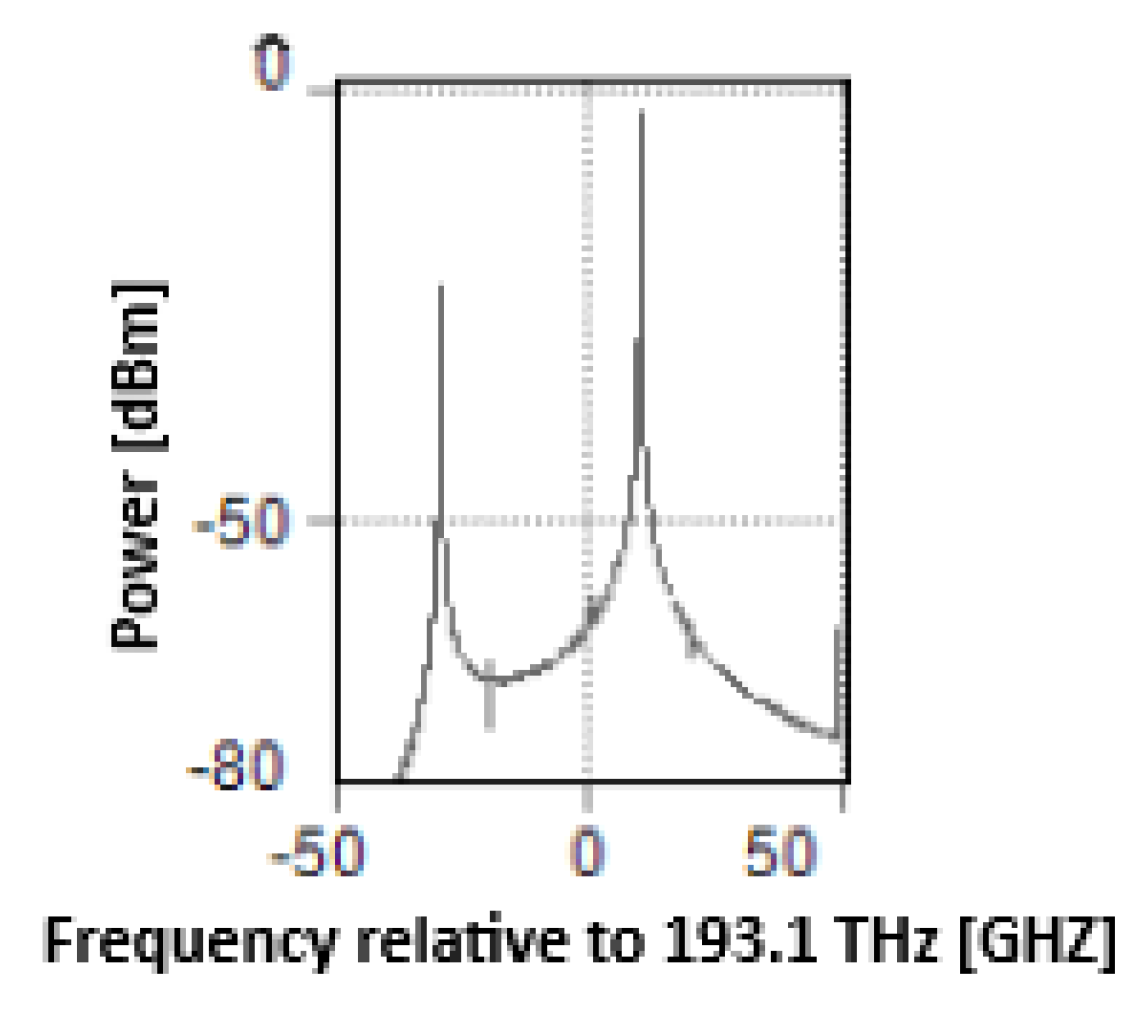
For completeness, before showing the final results related to the polarization sensitivity, we show the results obtained in different parts of the simulated circuit with VPIphotonics when the polarization angle of the input signal is equal to 0.
Figure 9 shows the spectra generated by the modulators, where two different tones can be seen, but none of them are related to the carrier frequency. In fact, the main tone is the modulated one at 10 GHz from the center frequency, while the other is a second harmonic and its power presents approximately 20 dB suppression with respect to the main tone. Thus, one of the main objectives has been accomplished, which is the creation of an SSB-SC MZM using photonic integrated technology.
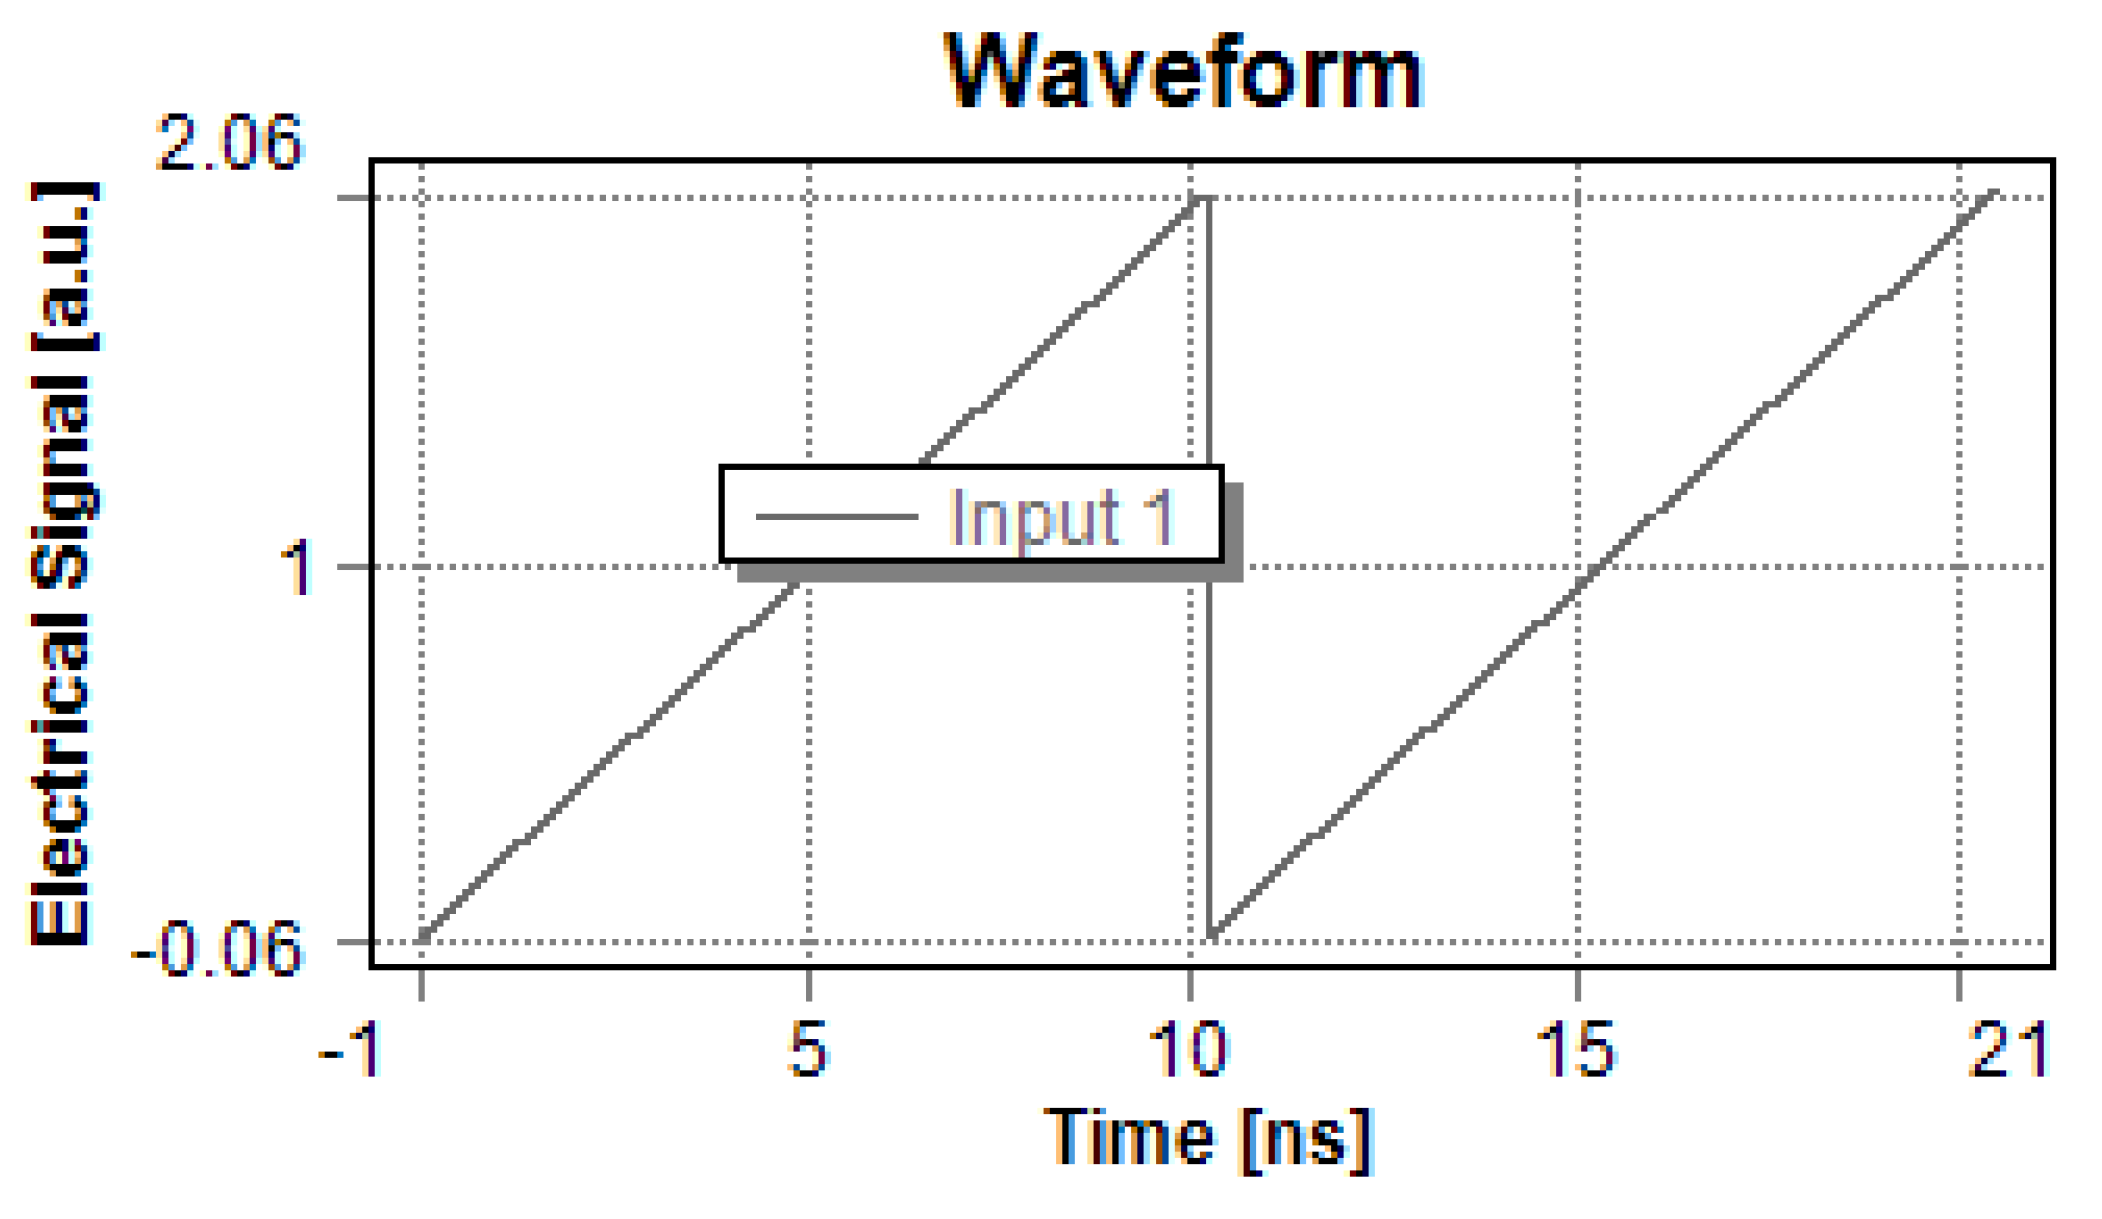
Figure 10 shows the saw-tooth voltage driving the phase modulation. As the reader may notice, the modulation frequency is around 100 MHz, which may be considered very fast for the realistic implementation of a phase modulator. However, we made this choice to reduce the computation time without having an impact on the results, as this frequency value does not affect the modulation results of our model.
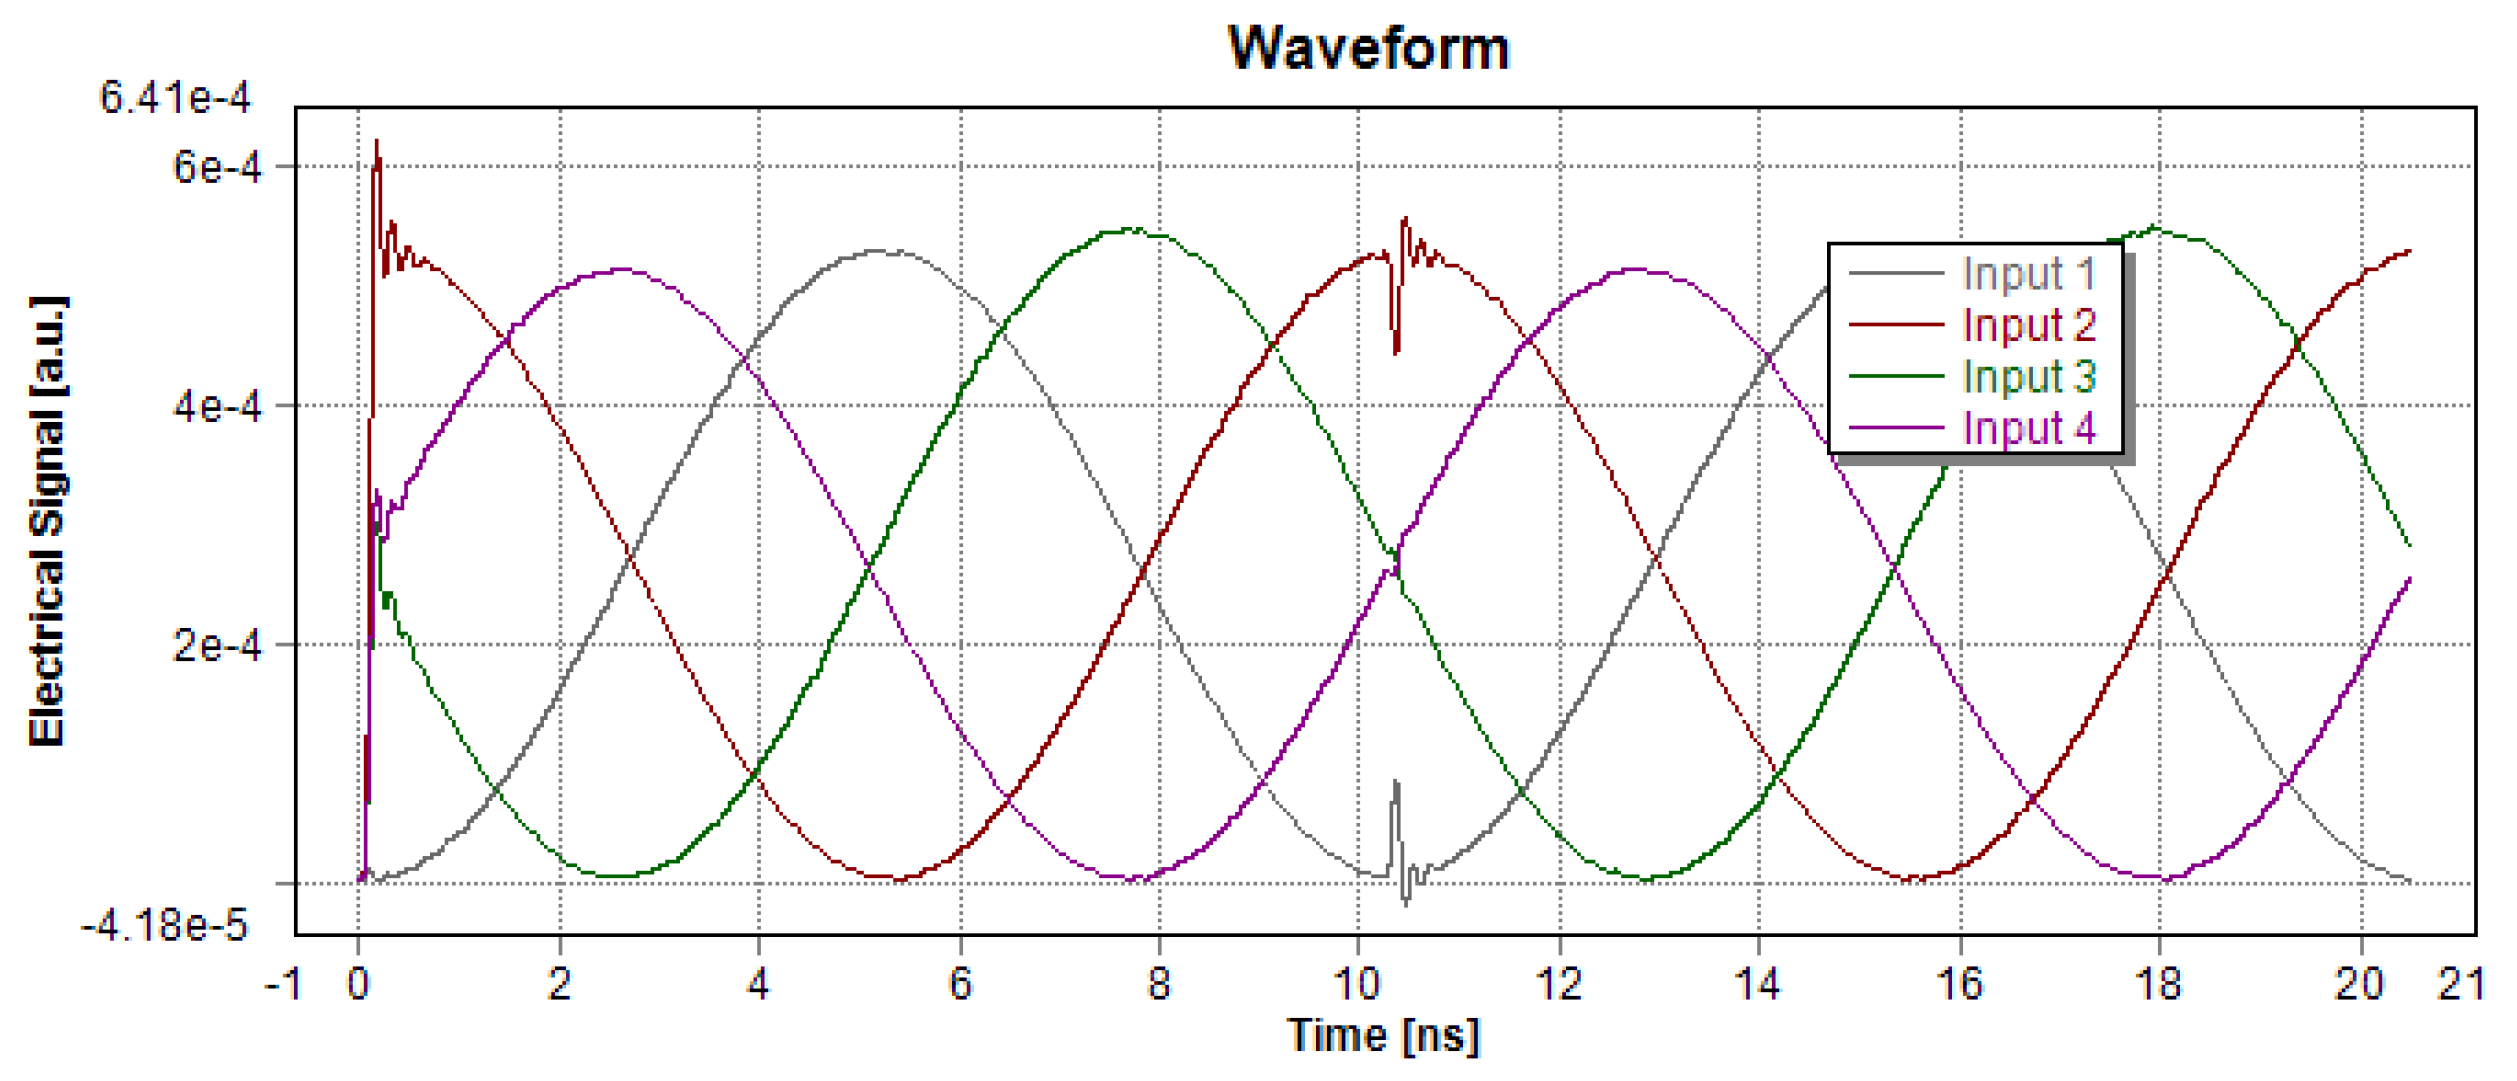
Finally, the simulated TOD corresponding to the four different outputs can be seen in
Figure 11. These output signals follow the expected sinusoidal phase modulation that should be found in an actual implementation of the polarimeter. It can be checked that the phase difference between every output is a multiple of 90
. Moreover, as expected for the 0
input polarization angle case, the measured phases of each channel is close to 0, 90, 180 and 270
. It is also possible to see that the mean level of the signals is not 0. This can be caused by power imbalances between the 90
optical hybrid branches, which can be generated by the slightly different insertion losses of the phase shifters.
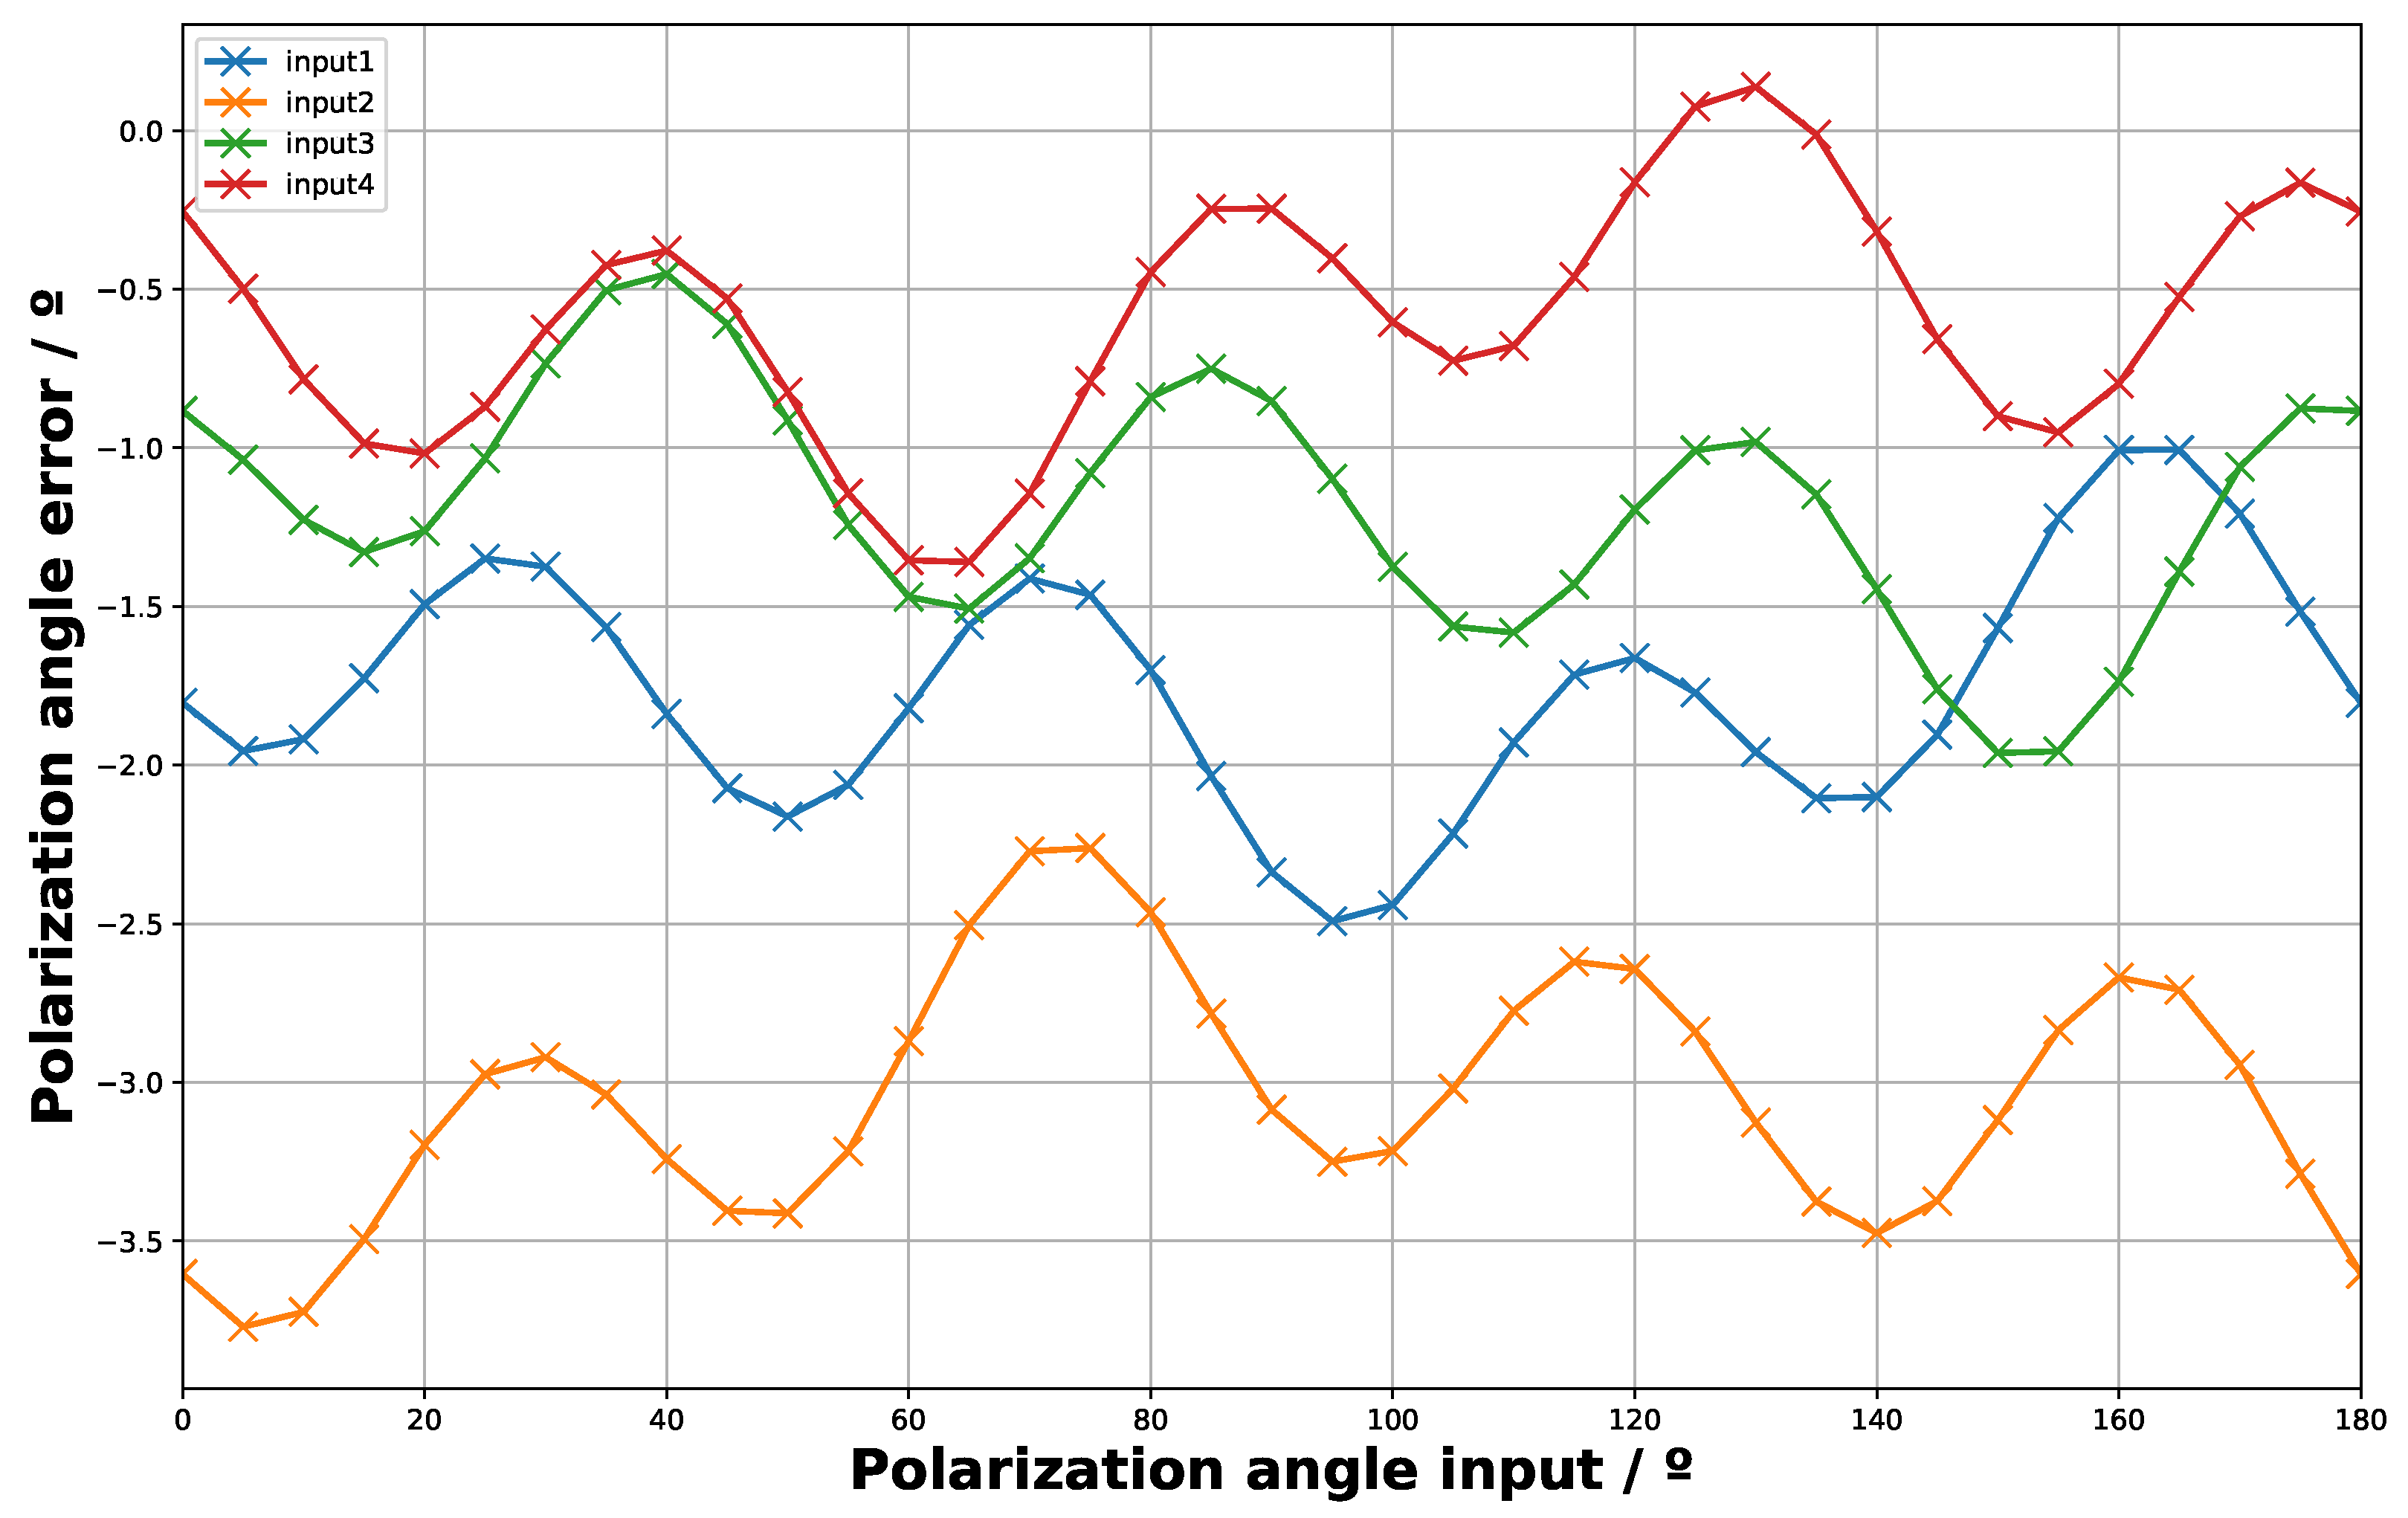
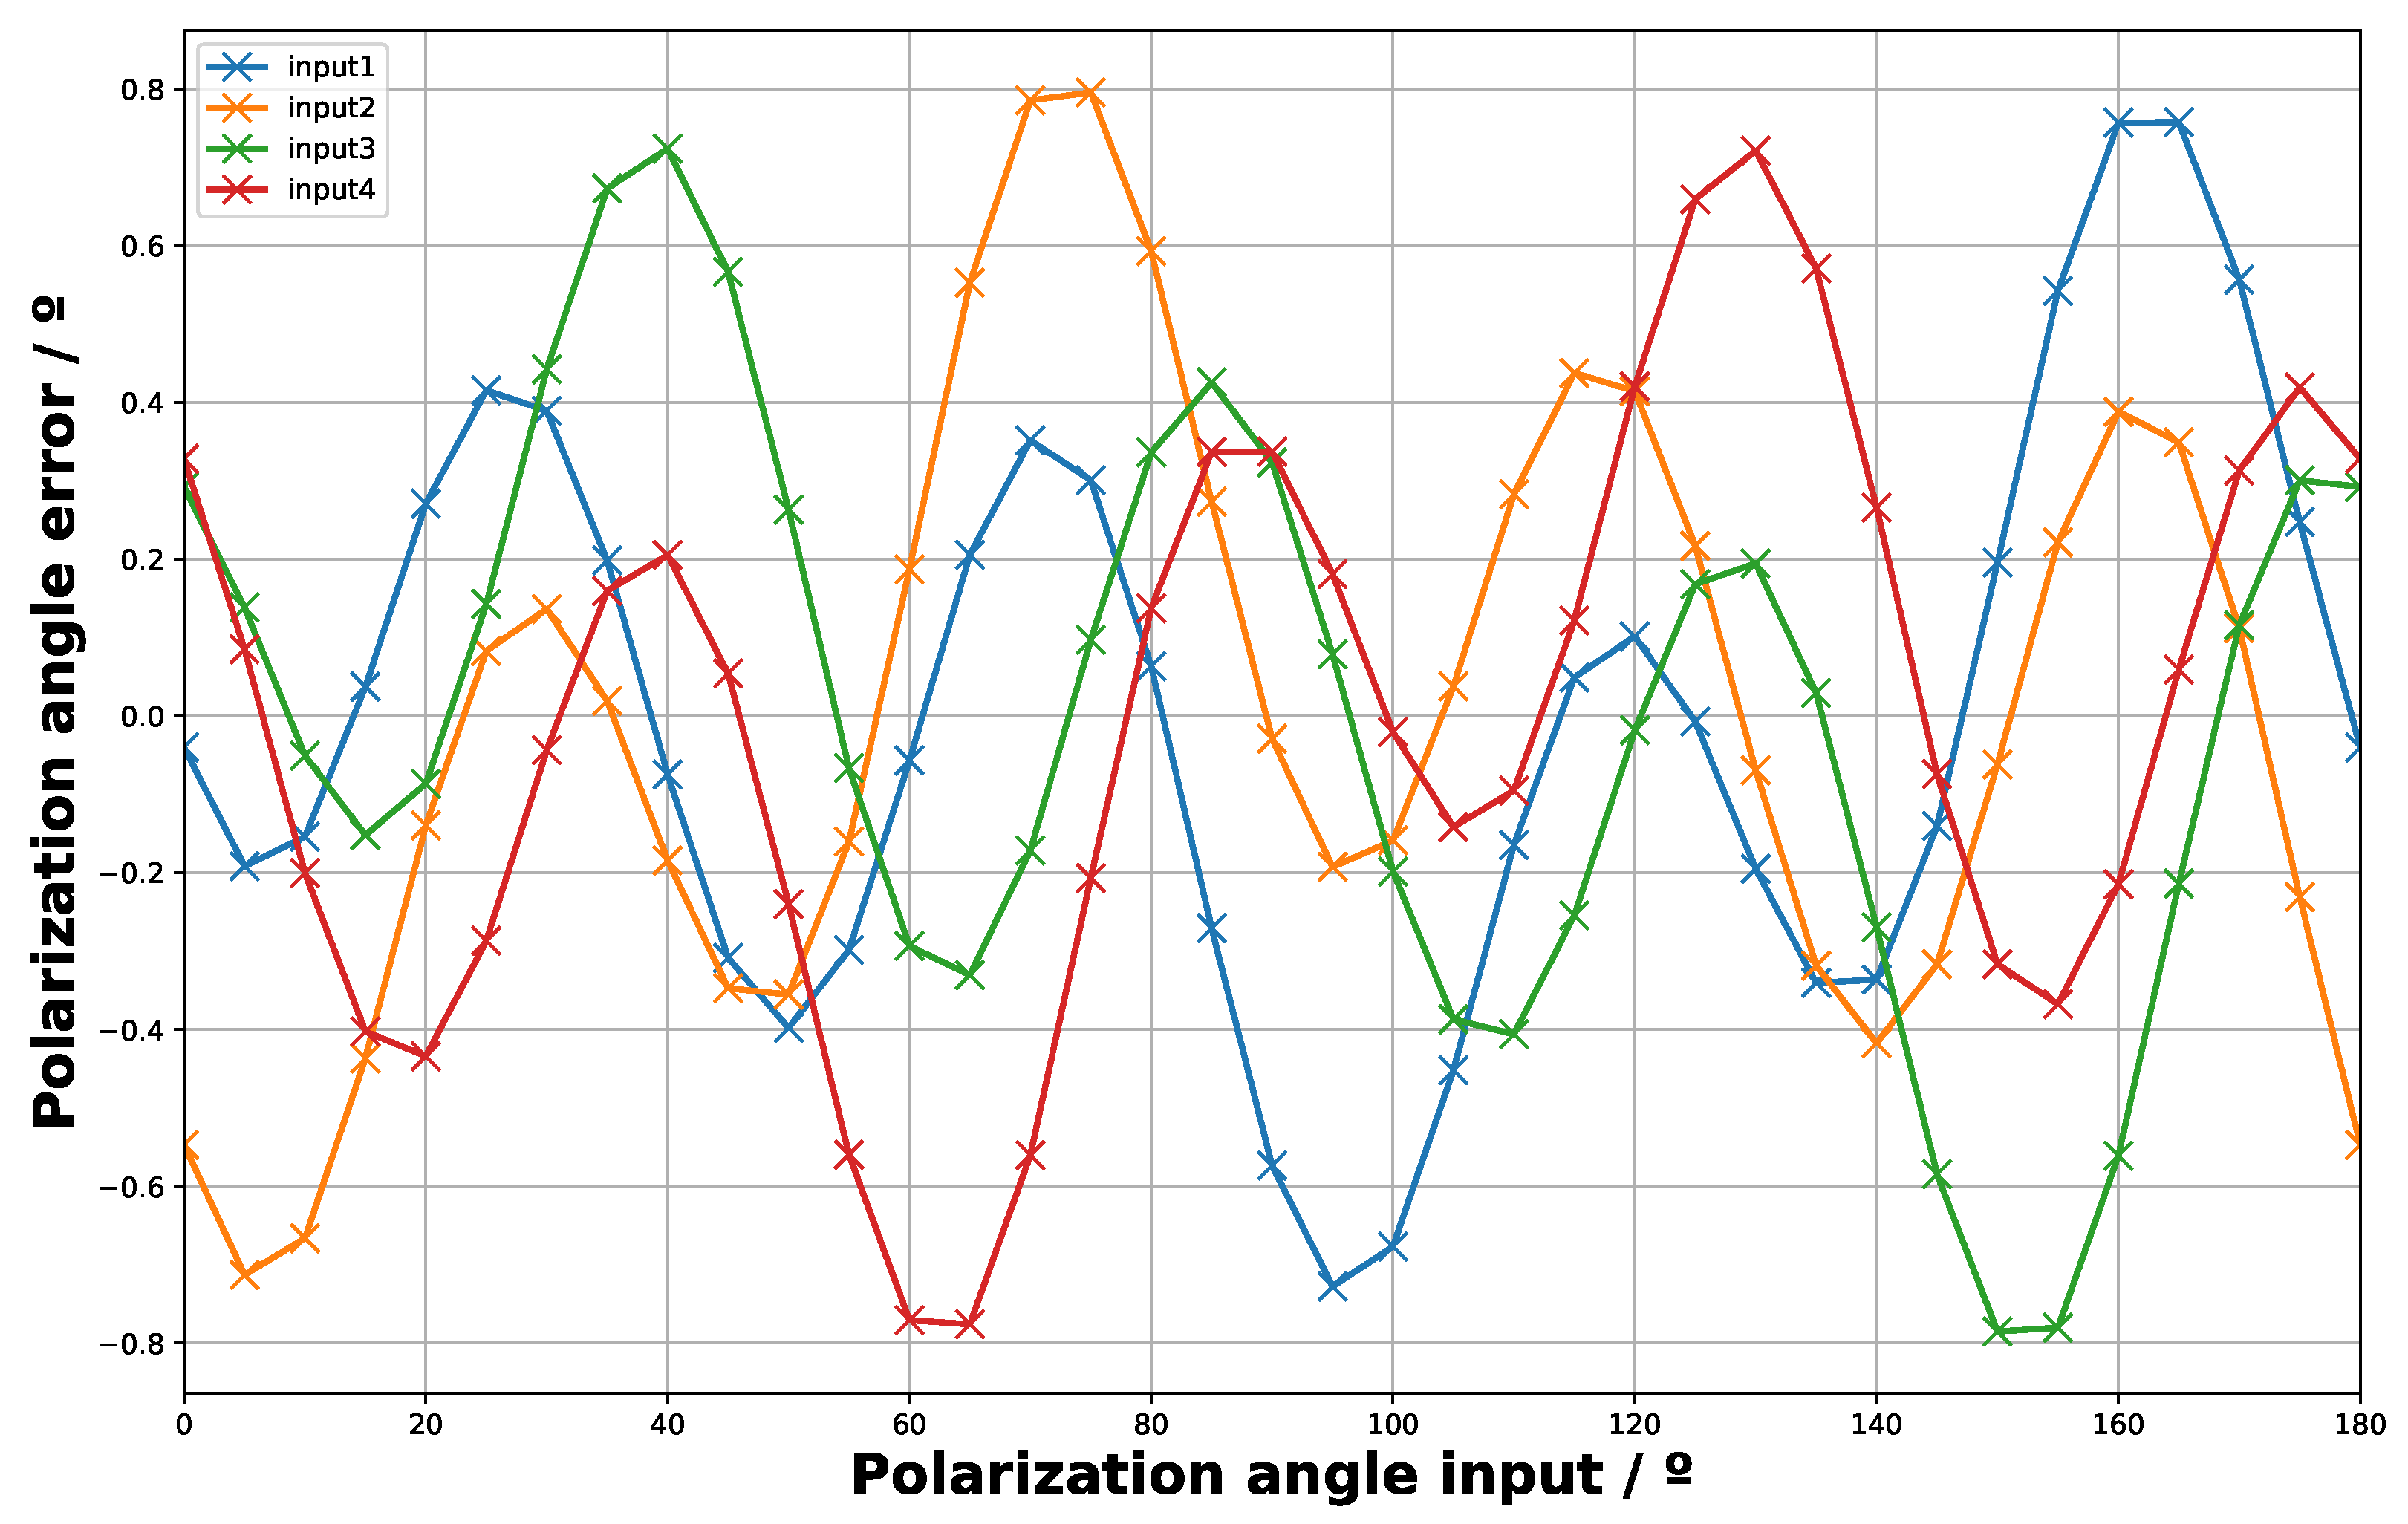
Then, this study was repeated for different polarization angle inputs (every 5
), obtaining the residuals on the recovered polarization angles; see
Figure 12. As can be seen, every channel has a different systematic level, which can be easily corrected by applying a mean filter on every output, obtaining
Figure 13.
The error found in the achieved polarization angle has a maximum value of 0.8
, which is already an acceptable value for actual CMB experiments, and it can be further improved by using already known calibration methods (see, for instance, [
8]).
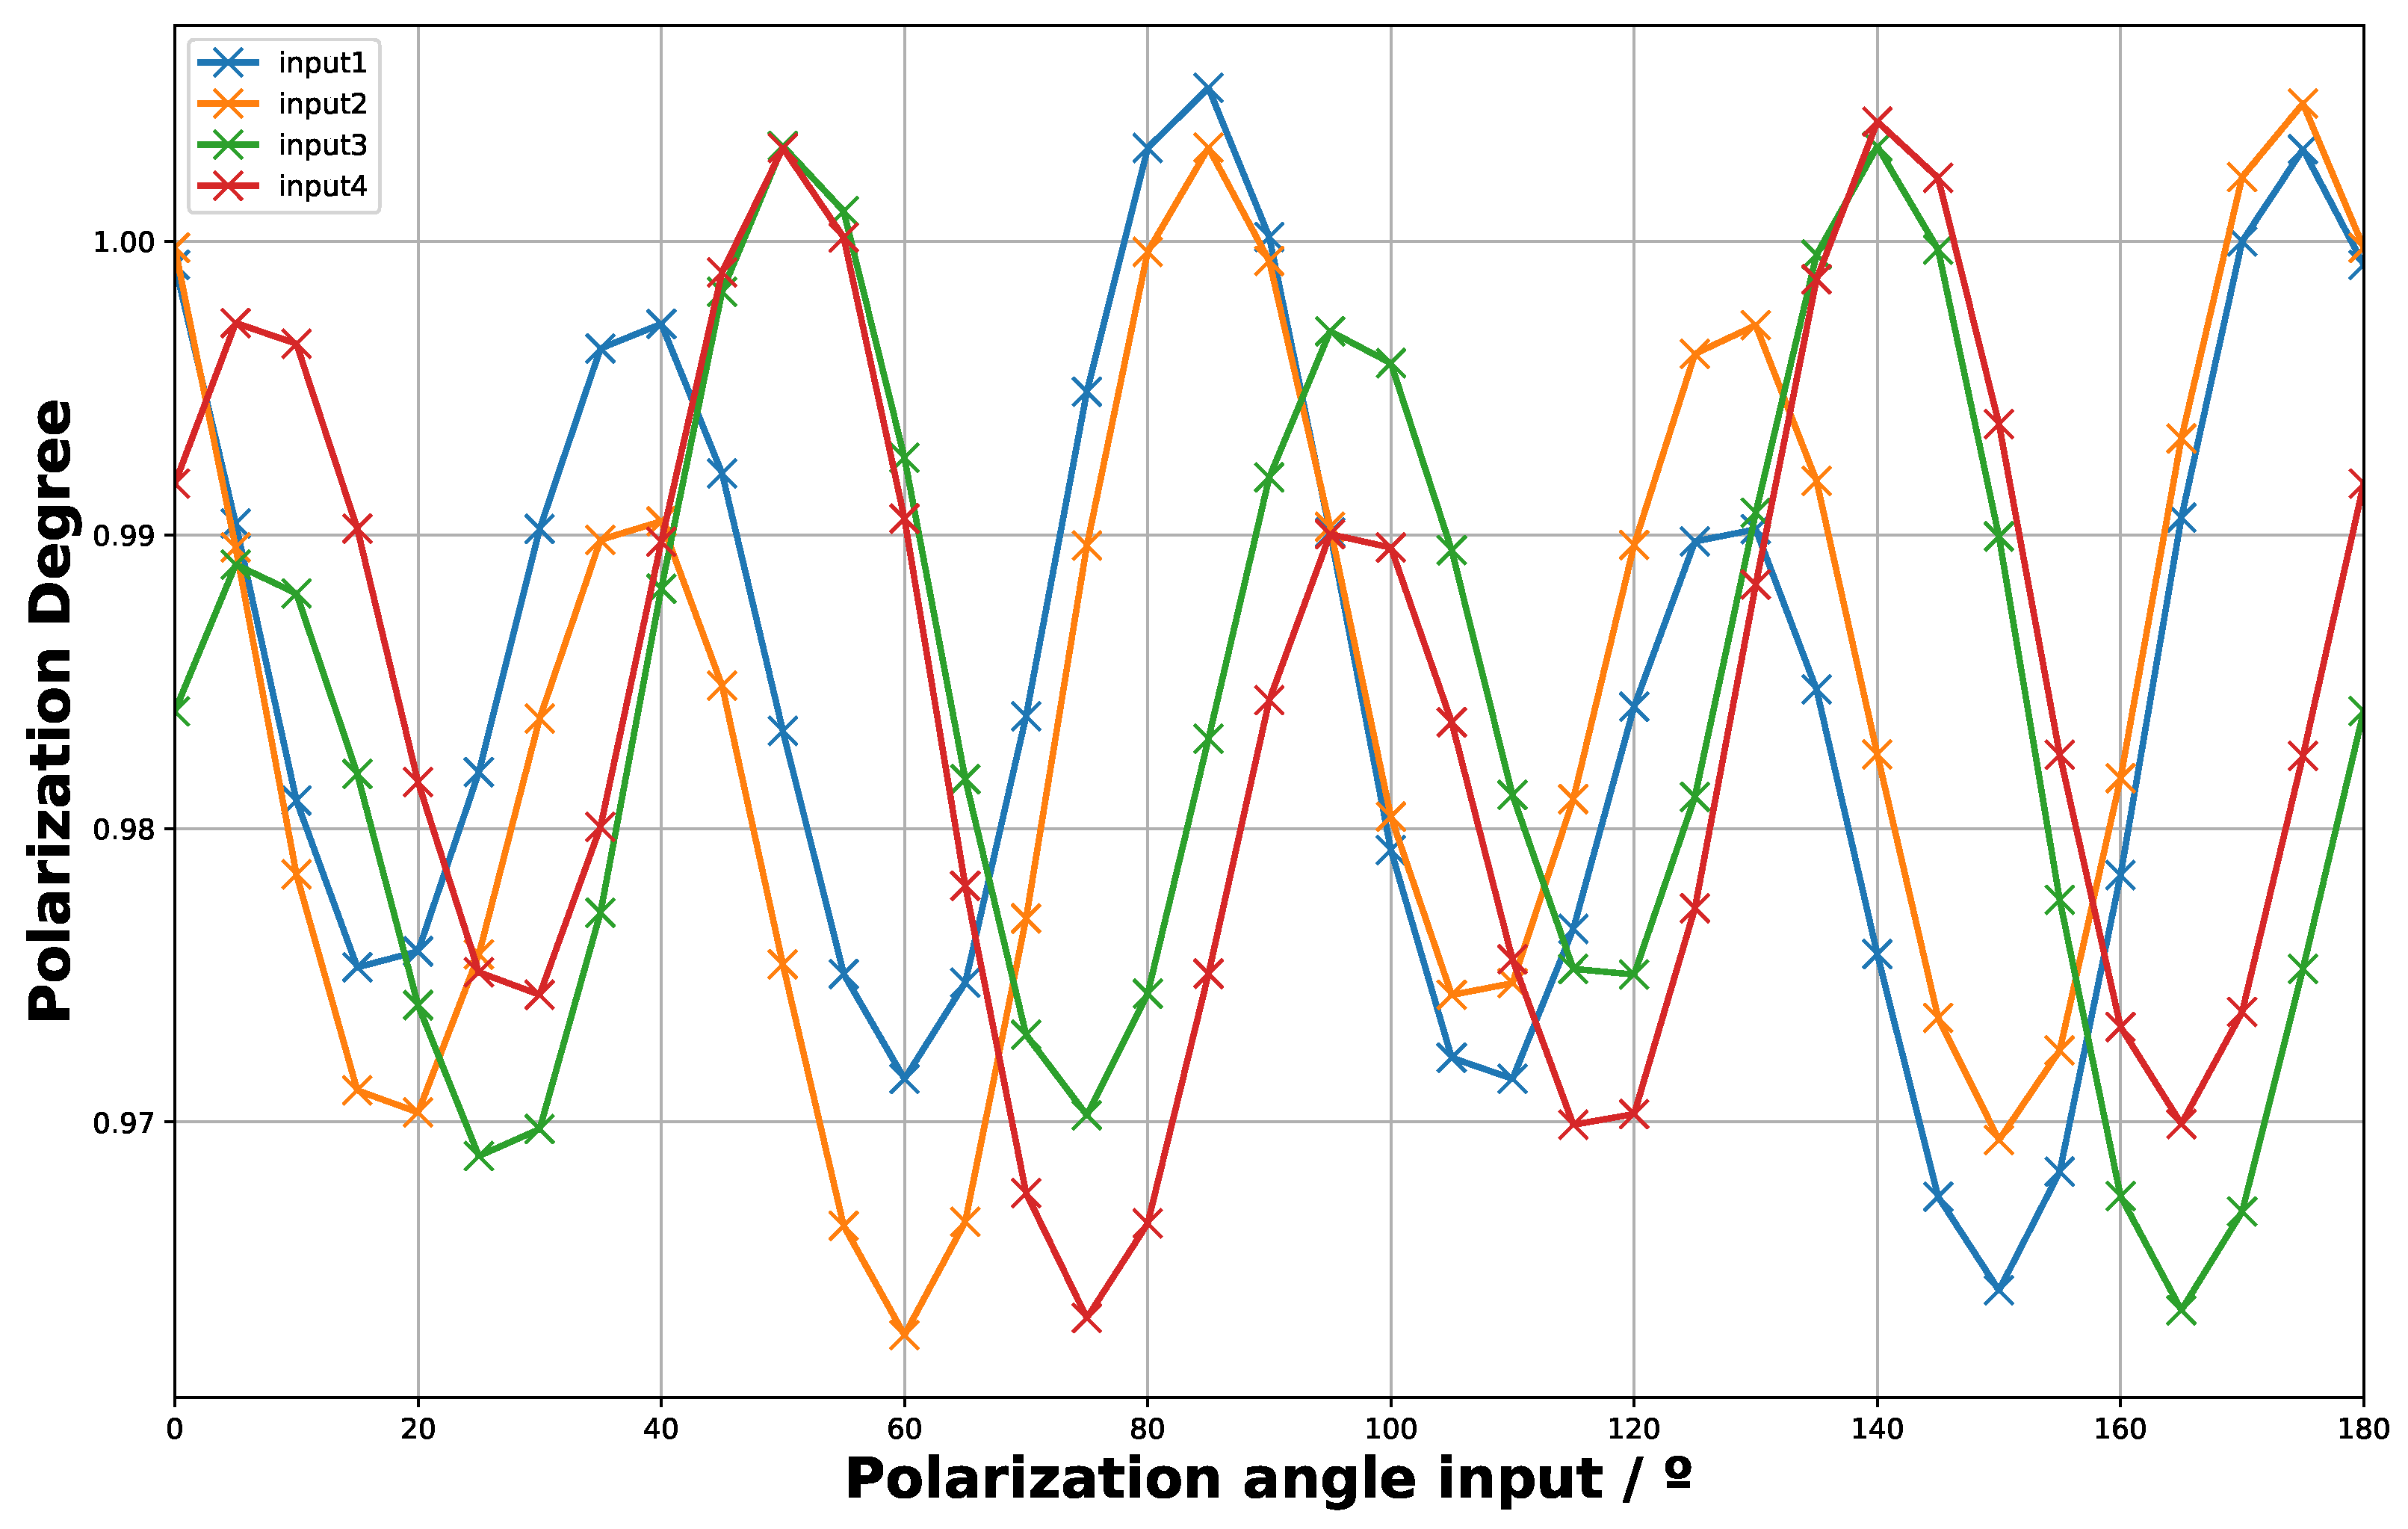
Furthermore, the recovered polarization degree (note that the input is 100% polarized) can be obtained with this analysis—see
Figure 14—finding a good match (the error is less than a 4%). In order to achieve this, the amplitudes of the sinusoidal modulated outputs are compared with respect to the mean level of the output signals.
The presented level of systematic error in the previous figures would be acceptable in an actual microwave polarimeter, even without using further calibration methods, such as the one presented in [
8]. Moreover, these results seem to be a good alternative in terms of avoiding the 1/f noise that appeared in the optimized polarimeter version shown in [
9], mainly because all the components and waveguides are placed in a small chip and well adapted. In addition, these huge size reductions will allow the better control of environmental parameters such as vibration and temperature and pressure variations.
4. Conclusions
We have designed and simulated a novel InP photonic integrated chip, using the HHI-Fraunhoffer InP technology, with the same functionalities and components as the EOBEM of the heterodyne polarimeter shown in a previous work [
9]. Although the design is very similar, the polarimeter’s implementation in a small chip using the reported photonic integrated technology has several advantages. The main one is the remarkable size reduction that is achieved, which means that the induced systematic effects from environmental factors such as vibration and temperature and pressure variations are lower and can be further suppressed by a potential improvement in the thermal and mechanical stability control. Additionally, a significant reduction in cost and power consumption is achieved, which will allow us to increase the number of detectors in an experiment, with a corresponding increase in sensitivity.
In order to test the design behavior and sensitivity, the PIC circuit has been simulated with specific electro-optical commercial software (VPIphotonics), obtaining very promising results without the use of any calibration method. The maximum error in the determination of the polarization angle is 0.8
, and it is 4% in the determination of the polarization degree, which are already acceptable values for a ground-based CMB polarimeter. Considering the application of calibration techniques such as the one proposed in a previous work by the authors [
8], these values are promising for ground-based CMB experiments, particularly for the ones dedicated to low-frequency (from approximately 5 to 50 GHz) foreground characterization.
Finally, it is important to note that, at the time of writing, the authors are waiting to obtain funds for the PIC’s fabrication and testing in the laboratory. However, due to the accurate and realistic simulation results provided by the commercial software used in this work, it is possible to conclude that the InP PIC technology is very promising and interesting in terms of its application to instrumentation for ground-based CMB polarization experiments.


