Article

A Modified Phase-Transition Model for Multi-Oscillations of Spark-Generated Bubbles

1
College of Nuclear Science and Technology, Harbin Engineering University, Harbin 150001, China
2
China Nuclear Power Technology Research Institute Co., Ltd., Shenzhen 518000, China
*
Author to whom correspondence should be addressed.
Inventions 2023, 8(5), 131; https://doi.org/10.3390/inventions8050131
Submission received: 31 August 2023 / Revised: 10 October 2023 / Accepted: 12 October 2023 / Published: 23 October 2023

Abstract

:
The main composition within a spark-generated bubble primarily consists of vapor, accompanied by a minor presence of noncondensable gases. The phase transition exerts a substantial influence on bubble dynamics throughout various stages, a facet that has been frequently overlooked in prior research. In this study, we introduce a modified theoretical model aimed at accurately predicting the multiple oscillations of spark-generated bubbles. Leveraging the Plesset equation, which integrates second-order corrections for compressibility and non-equilibrium evaporation, we further incorporate the thermal boundary layer approximation for bubbles, as proposed by Zhong et al. We employ an adjusted phase transition duration tailored to the unique characteristics of spark-generated bubbles. Furthermore, we meticulously ascertain initial conditions through repeated gas content measurements within the bubble. Our proposed theoretical model undergoes rigorous validation through quantitative comparisons with experimental data, yielding commendable agreement in modeling the dynamic behavior of bubbles across multiple cycles. Remarkably, we uncover that the condensation rate significantly governs the behavior of spark bubbles during their initial two cycles. Finally, we investigate the dependence of spark-generated bubble dynamics on the phase transition and the presence of air. Air content exhibits a minimal impact on bubble motion prior to the initial bubble collapse, but plays a role in the bubble’s rebound thereafter.

1. Introduction

The cavitation phenomenon is the process of formation, development and collapse of vapor or gas holes inside the liquid or at the liquid–solid interface when the local pressure in the liquid drops below the saturated vapor pressure, which widely exists in nature and engineering applications [1,2,3,4,5]. In the cavitation process, cavitation bubble dynamics as an academic research topic is of great significance for many industrial applications. Due to the rapid generation, expansion and collapse of cavitation, shock waves and high-speed microjets are generated, and the impact of the metal material will accelerate the electrochemical corrosion process and cause material ablation. Additionally, because a large number of gas molecules gather inside the very small cavitation bubble within a very short collapse phase, it can even produce local high temperature of thousands of degrees and high pressure of thousands of standard atmospheric pressures. All of the above may cause severe damage to structures.
Researchers have conducted many experiments to explore cavitation bubbles dynamics. There are generally three methods to generate cavitation bubbles in the laboratory: ultrasound, pulsed laser, and electric discharge [5,6,7]. Underwater electric discharge is more commonly used because of its controllability and economy, and generated bubbles are often called spark-generated bubble. The content inside a spark-generated bubble is mainly vapor and some special non-condensable gas may also exists [8]. Luo and Xu [9] used low voltage discharge method to produce cavitation bubbles, and the combination of high-speed photography and a pressure measurement system allowed for simultaneous observation and measurement of the evolution of the shock wave and the change in shock wave strength with the presence of the air bubble in the vicinity. The high-speed imaging revealed the predominant roles of the relative distance and relative size between the cavitation and air bubbles in the determination of the stratification effect that the air bubble exerted on the shock wave produced from the first collapse of the cavitation bubble.
The development of theoretical models is also an important part of studying the dynamic behavior of bubbles, and the current research on cavitation bubbles mainly focuses on the formation of bubbles, the influence of shock waves and boundary conditions on the collapse characteristics of bubbles [10,11,12]. Fujikawa and Akamastu [13] considered the compressibility, heat transfer, and non-equilibrium evaporation and condensation of vapors, and proposed an analytical model that showed that evaporation and condensation strongly affect the bubble dynamics. Han [14] experimentally, numerically and theoretically investigate the nonlinear interaction between a spark cavitation bubble and the interface of two immiscible fluids (oil and water) on multiple time scales, but she also only focused on the first cycle of bubble motion. Thereafter, Zhang [15] established a novel theory for the dynamics of oscillating bubbles that can simultaneously take into consideration the effects of boundaries, bubble interaction, ambient flow field, gravity, bubble migration, fluid compressibility, viscosity, and surface tension, but his theory still does not consider the effect of phase transitions in vapor.
With the development of bubble dynamics, people began to pay attention to the condensation of vapor in bubbles [16,17,18,19,20,21,22,23,24]. Phan [19] used the two-phase heterogeneous mixing model to simulate the bubble motion of spark-generated cavitation containing vapor, and by comparing with the experimental data, the results showed that the condensation phenomenon mainly occurs at the vapor–water interface with a thin boundary layer, the evaporation phenomenon mainly occurs in the bubble, and the temperature change of the flow field has little effect on the first two cycles of bubble motion. However, his model can only predict the first two cycles of bubble motion, and according to our results, the difference between the predicted radius and experimental data of different models mainly occurs after two cycles of motion, taking into account the condensation and evaporation of vapor. Zhong [20] established a laser cavitation bubble model, adopted the modified Rayleigh–Plesset equation, and established an interpolation function to try to obtain the optimal initial motion conditions of the bubble for many times, the numerical results were consistent with the evolution of laser cavitation bubble, and the influence of condensation coefficient on the bubble motion radius, the maximum temperature and pressure peak at collapse were discussed, but the model was only applicable to laser cavitation bubbles. Mustafin [22] presented a numerical technique for studying the collapse and rebound of a spherical cavitation bubble in an unbounded volume of water. The dynamics of the vapor in the bubble and the surrounding liquid is governed by the equations of gas dynamics with allowing for the heat conductivity of the fluids, the heat and mass exchange across the bubble surface. His theory focuses on verifying the reliability of computational methods for the new setting of non-reflecting boundary conditions.
As the non-condensable gas in the bubble has damping effects, which can weaken the pressure wave when the bubble collapses and enhance the bubble rebound, Trummler [25] used a uniform mixing model with the coupled equation of the state of all components to study this damping effect, and the numerical results proved that the free air in the vapor bubble will cause the bubble to bounce stronger and weaken the emitted shock wave strength. In addition, Sato [26] proved through experiments that hydrogen molecules will be generated when cavitation bubbles are induced by laser or electric sparks, and the hydrogen content of different types of cavitation bubbles is determined by monitoring the dissolved hydrogen concentration in water, and it was found that the mass of dissolved hydrogen is proportional to the potential energy of the rebound bubbles, indicating that different types of gas content may change the dynamic behavior of bubbles. Kerboua [27] considered the heat loss caused by the chemical reaction during the bubble motion, and the results showed that considering the chemical reaction leads to a decrease in the temperature in the bubble and an increase in the pressure peak during collapse. However, none of them quantified the magnitude of the effect of these non-condensable gases on bubble motion.
In the present study, a modified theoretical model is proposed to accurately predict multi-oscillations of spark-generated bubbles. This paper is structured as follows. In Section 2, details about the modified theoretical model and experimental setup are given. In Section 3, the proposed theoretical model is validated by quantitative comparison with our experiments. And then the effects of phase transition duration and air content on the bubble motion are discussed in detail in Section 4. Finally, conclusions are made.

2. Methodology

2.1. A Modified Theoretical Model

First, we assume a spherical bubble with evenly distributed internal temperature and pressure. Regardless of the change in the density of the liquid medium caused by the propagation of sound in the liquid, gravity and the chemical reactions that may occur in the bubbles are ignored. Based on Yasui’s theoretical results [28], it is assumed that there are two thin hot layers on the surface of the bubble, i.e., inner and outer hot layers, as shown in Figure 1. The thickness of the inner and outer hot layers are δ 1 and δ 2 , respectively. The heat conduction, evaporation and condensation between the gas inside the bubble and the flow field only occur in the inner hot layer, and the temperature changes linearly from T inside the bubble surface T to T B at the bubble surface in the inner hot layer. We assume that the temperature T l in the outer hot layer is the same as the flow field temperature at infinity T , then there is a temperature difference between the two hot layers.
A second-order modified Rayleigh–Plesset equation is used, with non-equilibrium evaporative condensation taken into consideration [29].
R R ¨ m ¨ ρ l 1 1 c 2 R ˙ m ˙ ρ l + 1 c 2 23 R ˙ 2 10 31 m ˙ R ˙ 10 ρ l m ˙ 2 5 ρ l 2 + 3 2 R ˙ m ˙ ρ l R ˙ + m ˙ 3 ρ l 4 R ˙ 2 3 c + 1 c 2 7 R ˙ 3 5 49 m ˙ R ˙ 2 30 ρ l 14 m ˙ 2 R ˙ 15 ρ l m ¨ 3 6 ρ l 3 + 1 ρ l p p B , 2 R p ˙ B , 1 c + 1 c 2 2 R ˙ m ˙ ρ l R p ˙ B , 1 c + p p B , 1 R ˙ 2 2 3 m ˙ R ˙ 2 ρ l m ˙ 2 ρ l 2 + 3 p p B , 1 2 ρ l = 0
in which
p B , 1 = p 2 σ R 4 μ R R ˙ m ˙ ρ l m ˙ 2 1 ρ l 1 ρ g
p B , 2 = p B , 1 + 4 μ 3 c 2 3 m ˙ 2 ρ l R R ˙ m ˙ ρ l 2 p ˙ B , 1 ρ l + m ˙ p p B , 1 ρ l 2 R
Among them, R, c, ρ l , σ , μ , p and p are bubble radius, sound velocity in water, water density, surface tension coefficient, viscosity, bubble internal pressure, and flow field pressure at infinity, respectively. m ˙ is the net rate of evaporation per unit area per unit time of bubbles. ρ g is the average density of the gas in the bubble, satisfying
ρ g = M vapor n vapor + M air n air V N A
In which, M vapor , M air , n vapor and n air are the molar mass of vapor in the bubble, the molar mass of air, the molecular number of vapor and the number of air molecules, respectively, and N A is the Avogadro constant.
With the Van der Waals equation, the pressure inside the bubble can be calculated using the number of vapor molecules and the number of air molecules inside the bubble [28,29].
p + a v 2 v b = R g T
in which
a = a air n air n t 2 + 2 a air a vapor n air n t n vapor n t + a vapor n vapor n t 2
b = b air n air n t 2 + 2 b air b vapor n air n t n vapor n t + b vapor n vapor n t 2
R g and T are the gas constant and the temperature inside the bubble. v is the molar volume v = N A V / n t , n t is the total number of molecules in the bubble n t = n air + n vapor , and V is the bubble volume. The non-equilibrium evaporation and condensation processes of vapor in the bubble are modeled by a modified Hertz–Knudsen–Langmuir relationship [23].
m ˙ = m ˙ eva m ˙ con
m ˙ eva = α M 2 π R v p v * T liquid T liquid
m ˙ con = α M 2 π R v Γ p v T B
m ˙ eva and m ˙ con are the evaporation rate and condensation rate per unit area of bubbles; respectively; α M is the ratio of the number of vapor molecules penetrating the bubble wall to the number of vapor molecules hitting the bubble wall, and α M = 0.04 [30]. The saturated vapor pressure of water is obtained by p v * T liquid = exp ( 77.345 + 0.0057 T liquid 7235 / T liquid ) / T liquid 8.2 . R v is the vapor gas constant, and p v is the actual vapor partial pressure in the bubble. Γ is the correction factor, which is set as 1.
The temperature change at the gas-liquid interface is expressed as
T B T liquid = Λ T l r r = R
Λ = 1 2 k n π m ¯ 2 k T B 2 a α e α e κ
In which a = 0.827 . α e , κ and k are the thermal containment coefficient, the thermal conductivity of vapor and the Boltzmann constant, respectively. n = n t / V indicates the density of molecules within a bubble. m ¯ = n vapor M vapor + n air M air / N A n t indicates the average molecular mass inside the bubble. T l / r r = R represents the temperature gradient in the inner hot layer δ 1 on the surface of the bubble. Yasui assumes that the temperature in the thermosphere varies linearly and can therefore be simplified to [27,31,32]
T liquid r r = R T B T δ 1
The thermal boundary layer δ 1 thickness is the molecular free path. Plesset and Prosperetti theorize that the thickness of the thermal boundary layer is related to the change of the radius during the violent collapse of the bubble, and T l / r r = R becomes larger only when the internal temperature of the bubble is high, and the radius of the bubble is small and about to collapse. In order to calculate the bubble motion period more completely, in the present study, it is assumed that the temperature of the second thermal layer is equal to the surrounding temperature, i.e., T liquid = T . The main reason is that the specific heat capacity of water is large compared with the internal gas. Additionally, Jebali and Francois [33] demonstrated that the thermal resistance on the liquid side of the interface can be neglected. Therefore, T liquid T is always equal to 0 during the bubble motion, taking the moment when the bubble radius reaches its maximum as the starting point, and the thickness of the hot layer δ 2 is inversely proportional to the square of the bubble radius, which is δ 2 1 / R 2 , while assuming that the heat flux through the liquid–vapor interface is continuous, i.e., [20]
κ T liquid r r = R = k l T 2 r r = R = 2 k l T T liquid δ 2
T l r r = R T B T R 2 δ 1 0 R 0 2
which indicates the thickness of the thermal layer δ 1 at the initial moment. The temperature in the bubble is updated according to the energy change [18],
E ˙ = 4 π R 2 R ˙ P + 4 π R 2 m ˙ eva e vapor T l m ˙ con e vapor T B N A M vapor + 4 π R 2 κ T 1 r r = R + σ r 4 π R 2 T B 4 T 4
On the right side of the equation, the first term represents the work carried out by the flow field on the bubble when it moves, the second term represents the energy reduced by vapor evaporation condensation, the third term represents the energy of the heat conduction change between the gas and the flow field in the bubble, and the fourth term represents the energy change caused by thermal radiation.
The formula for calculating the temperature change in the bubble is
T ˙ = E ˙ M c v
where c v = M air c vair + M vapor c vvapor / M air + M vapor is the average specific heat capacity of the gas in the bubble.
Sato’s [26] experiments found that due to the collision dissociation and electrolysis of the spark-generated bubble, the hydrogen mass of the spark-generated bubble is 2.7 times that of the laser bubble, and the rebound potential energy of the spark-generated bubble is significantly greater than that of the laser bubble because the potential energy of the rebound bubble is proportional to the mass of dissolved hydrogen. Therefore, the laser bubble model that always considers vapor condensation in the calculation process will overpredict the effect of condensation on the spark-generated bubble, so that the predicted bubble rebound radius is too small. In our model, when the bubble moves to the maximum radius in the second cycle of the spark-generated bubble, that is, the corresponding condensation rate is the minimum. After that, the mass transfer between the bubble and the flow field is ignored, and the gas in the bubble is considered to be an ideal gas, satisfying the ideal gas equation of state, that is
P = M total R g T V
where M total is the total mass of the bubble, including air and vapor. Since it is believed that the vapor no longer condenses in the subsequent cycle, only considering the influence of liquid compressibility, the bubble dynamics equation is replaced with a spherical bubble dynamics equation that only considers compressibility [29,34,35,36]
1 1 c R ˙ R R ¨ + 3 2 1 1 3 c R ˙ R ˙ 2 = 1 + 1 c R ˙ 1 ρ P P + R ρ c P ˙
where P ˙ is the derivative of pressure in the bubble over time. At this time, the energy in the bubble changes to
E ˙ = 4 π R 2 R ˙ P κ a ( T T )
The second term on the right side of the equation indicates the energy change caused by the heat conduction between the bubble and the flow field, κ a is the heat transfer coefficient between the bubble and the water, which is generally 2000∼7000 W / m 2 · K . The bubble temperature can still be updated according to Equation (17).

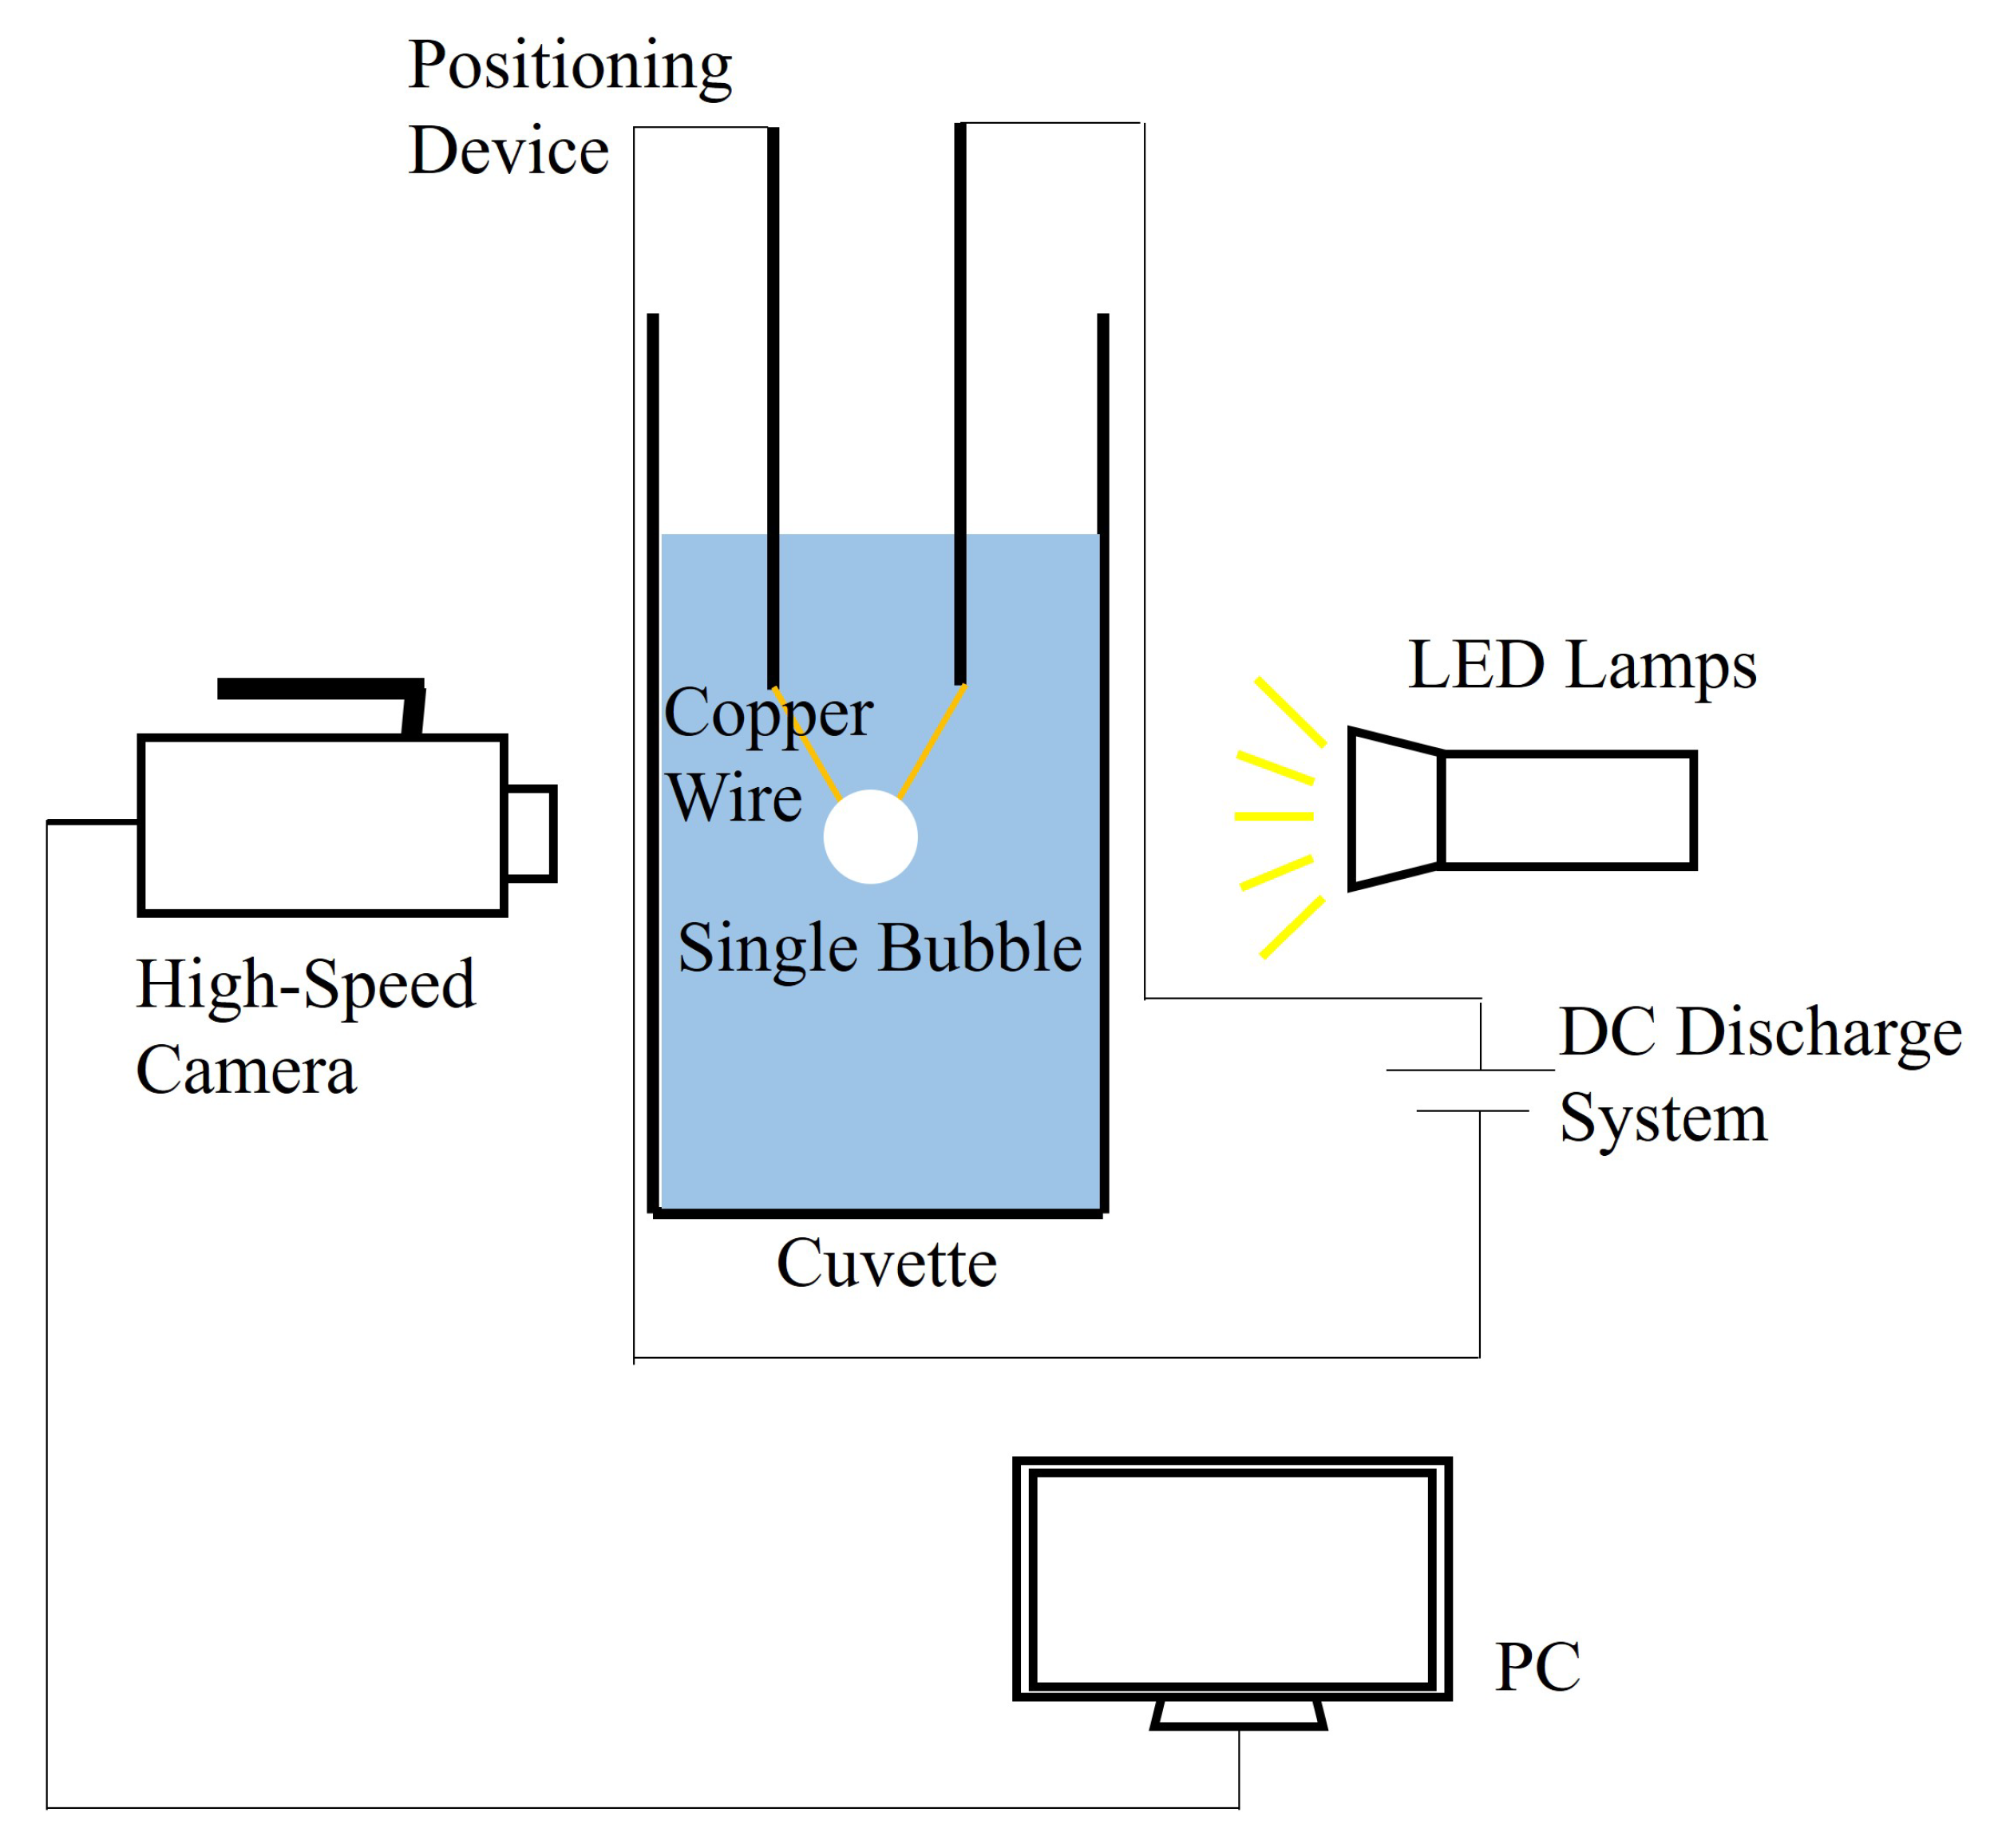
2.2. Experimental Set-Up

As shown in Figure 2, the present experimental devices include: a high-voltage discharge system, a high-speed camera, an adjustable structure positioning device and lighting source and a series of equipment [14,37]. We conducted experiments in a transparent water tank of 30 × 30 × 60 c m 3 , using a DC voltage discharge box. When the voltage reaches the set working conditions, electric discharge occurs and the liquid vaporized by short circuit of lapping 0.25 mm diameter thin copper wire. And thus a spark-generated bubbles is formed.
Under this discharge voltage condition, the maximum radius of the oscillating bubble is about 15∼20 mm, and the radius of the copper wire is about 1.25∼1.67% of the maximum bubble radius, indicating a minor effect on the bubble motion. The distance from the bubble center to the nearest tank wall is greater than 10 times of the maximum bubble radius, so the bubble can be considered to oscillate in a free field. A high-speed camera with a resolution of 1 million pixels (Phantom, TMX 6410, form AMETEX, Paoli, Madison, WI, USA) is used to capture the bubble motion, illuminated by a supplementary light source placed on the other side of the tank. Two frosted glasses are placed between the tank and the light source to provide uniform illumination.
We use a combination of a small funnel and a test tube in the water above the copper wire cross point to collect the air after the bubble collapses. Instead of data fitting to obtain the initial number of molecules, the initial conditions for spark-generated bubbles are determined by repeatedly measuring the air content inside a bubble, which is a key factor to accurately capture the dynamics of a spark-generated bubble during multi-oscillations. Air in ten same experiments is collected together, and then an average air volume is obtained, in order to reduce the experimental error. The molecular weight of air is determined by using the ideal gas equation of state. At the beginning, the pressure in the bubble is considered to be equal to atmospheric pressure, and the molecular weight of the vapor can be obtained by calculating the saturated vapor pressure at this time. In order to ensure the reliability of the experiment, we performed a series of experiments under the same working conditions. The multi-oscillations of a spark-generated bubble is given in Figure 3. Obviously, in the fourth cycle, the bubble shape is no longer regular and begins to break.

3. Validation

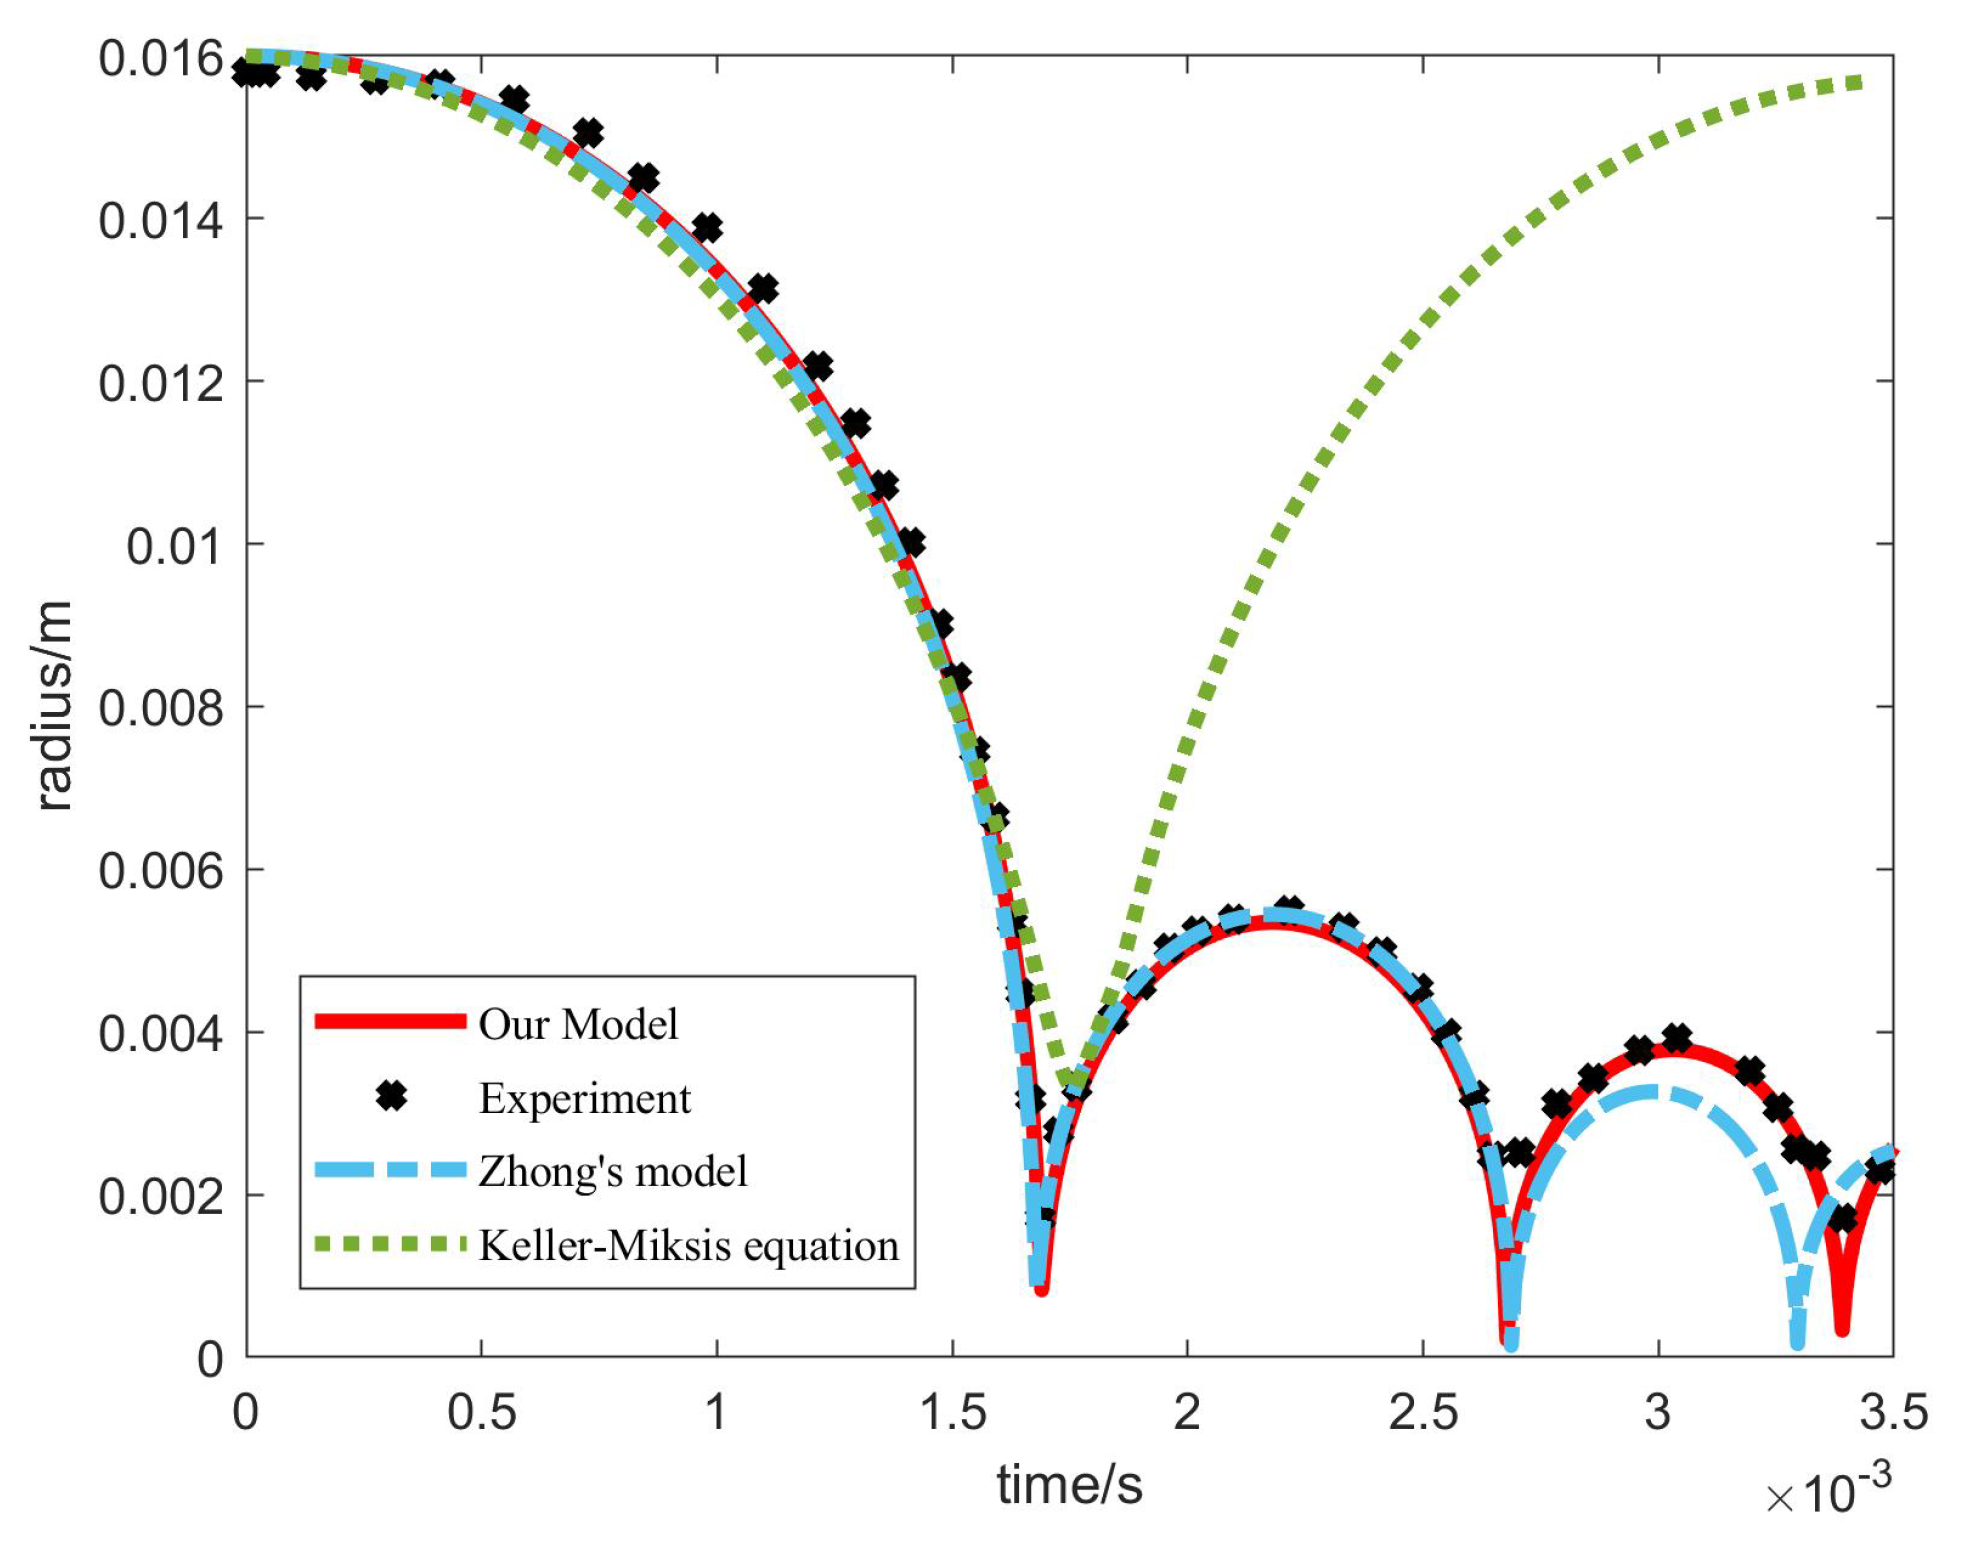
3.1. Comparison of Experiments and Theoretical Results

In the present study, equations are solved using the fourth-order Runge–Kutta method. In all cases considered in this paper, we take the moment when the bubble radius reaches maximum R m as the start. The other required physical parameters in the model are listed in Table 1. It is supposed that both the bubble temperature and flow field temperature at this time are equal to the ambient temperature of 293 K. Because the specific heat capacity of water is much greater than that of vapor, it can be considered that during the entire bubble motion T liquid = T . Since the thermal layer thickness cannot be measured experimentally, we assume that δ l ( 0 ) = 0.45 (μm) based on Zhong’s hypothesis [20].
Figure 4 compares the experimental results with the Keller–Miksis equation, the Zhong model, and the present modified theoretical model. In the experiments, the uncertainty of the measurement is about one pixel (0.04 mm), which is much smaller than the maximum bubble radius. The Keller–Miksis equation takes fluid compressibility into account during bubble motion [34]. The bubble radius change in the first period is well predicted by the three models, which indicates that the energy dissipation is mainly due to the compressibility. But in the subsequent motion, the prediction by Keller–Miksis equation significantly underestimates the energy dissipation, it suggests that mass and heat transfer becomes the dominant factor for the energy dissipation in the multi-oscillations of the spark-generated bubble. In the Zhong model, the compressibility, heat conduction and energy dissipation caused by equilibrium evaporation and condensation are considered at the same time, and the model matches well with the first two cycles of bubble motion in the experiment, but the results begins to deviate from the experimental data in the third cycle. It is believed that dissolved hydrogen content of spark-generated bubbles differs from that of laser-induced bubbles, leading to the difference in bubble rebound potential energy. Given this, liquid compressibility, heat conduction and non-equilibrium evaporation and condensation are considered in the first two cycles, while heat conduction and non-equilibrium evaporation and condensation are neglected in the subsequent motion. As shown in Figure 4, the predicted radius with the present modified model agrees well with the experimental data during the multi-oscillations of the spark-generated bubble, with a maximum error of 2%. It is believed that the modified theoretical model can better predict multi-oscillations of spark-generated bubbles. From the comparison above, it is noted that the effect of heat and mass transfer becomes weaker on the energy dissipation after two cycles of spark-generated bubble motion. It is believed to be caused by the reduction of vapor molecules in the bubble, which will be discussed in detail later.

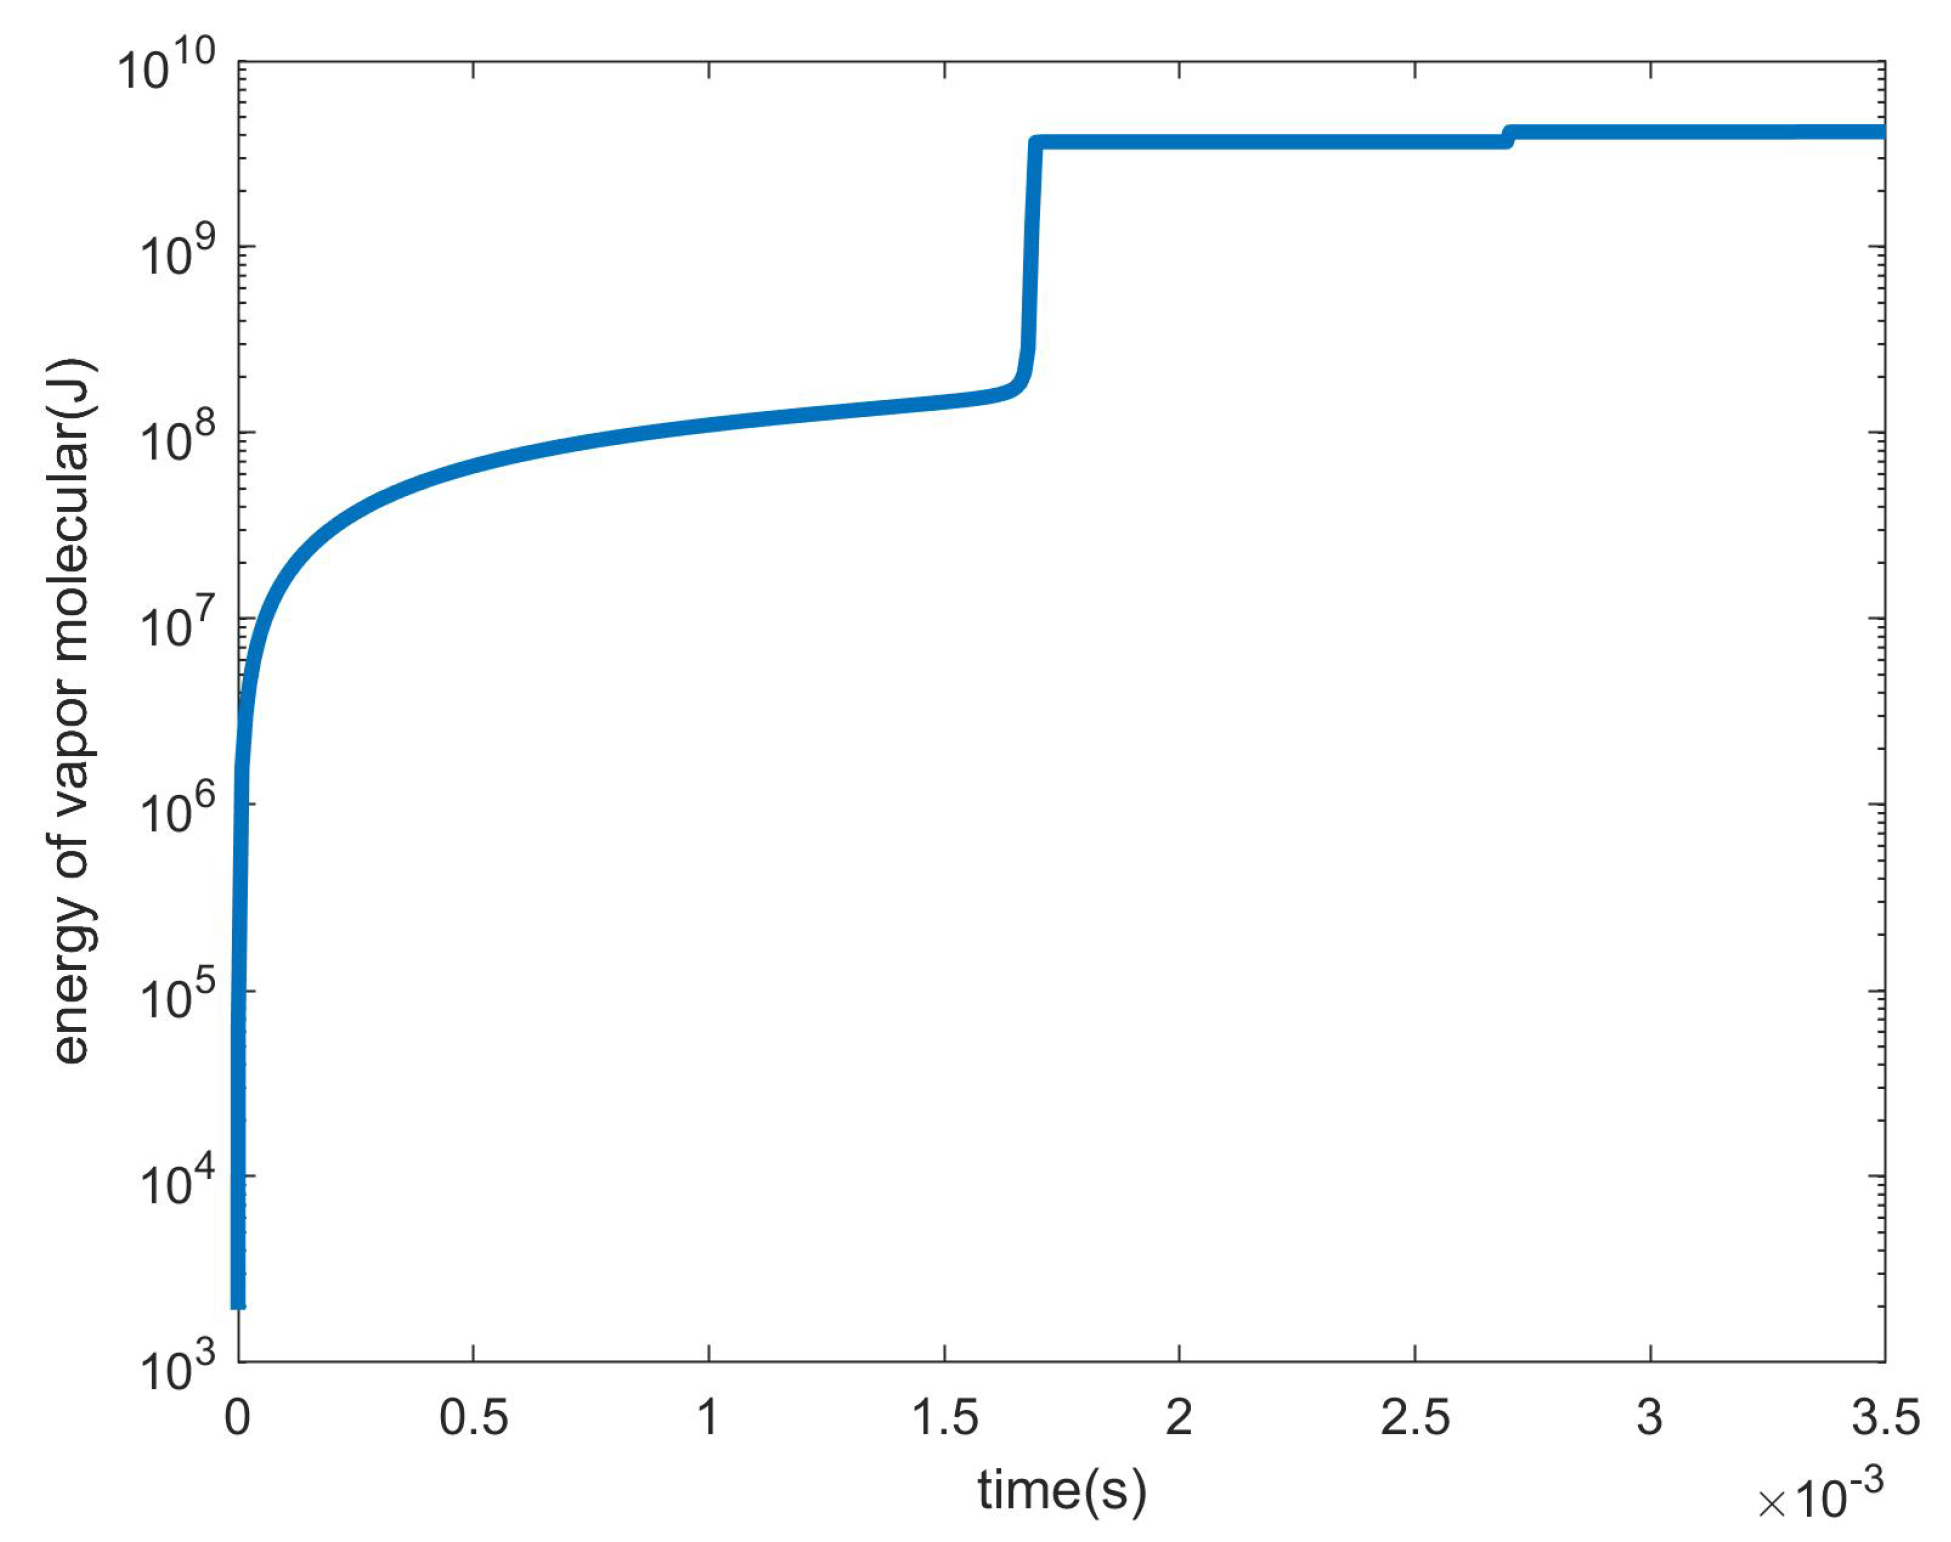
3.2. Further Discussions

Yasui [28] gives an equation for approximating the energy carried by each vapor molecule, and the energy carried by the non-equilibrium evaporation of the vapor molecule can be calculated by
e v a p o r ( T ) 6.272 × 10 23 T 5.247 × 10 21 ( J )
Figure 5 shows time histories of the total energy taken away by the reduced vapor molecules if condensation is taken into account during the entire process. It is noted that the energy loss due to the reduction of vapor molecules in the first collapse is over 100 times that of the second collapse. In the second collapse, the work carried out by the flow field on the bubbles is not much different from the energy taken away by the vapor condensation, but if the vapor condensation is considered, the radius of rebound for the bubbles is too small.
Figure 6 compares the predicted time histories of bubble radius with the experimental results at different voltages, and the calculation method of air molecular number is determined in the same way as in Figure 4. The standard evaporation coefficient is α M = 0.04 ± 0.005 , and the thickness of the vapor thermal layer is δ l ( 0 ) = 0.45 μ m . It can be seen that the experimental results in the first three cycles are well reproduced using the present modified model.

4. Results and Discussion

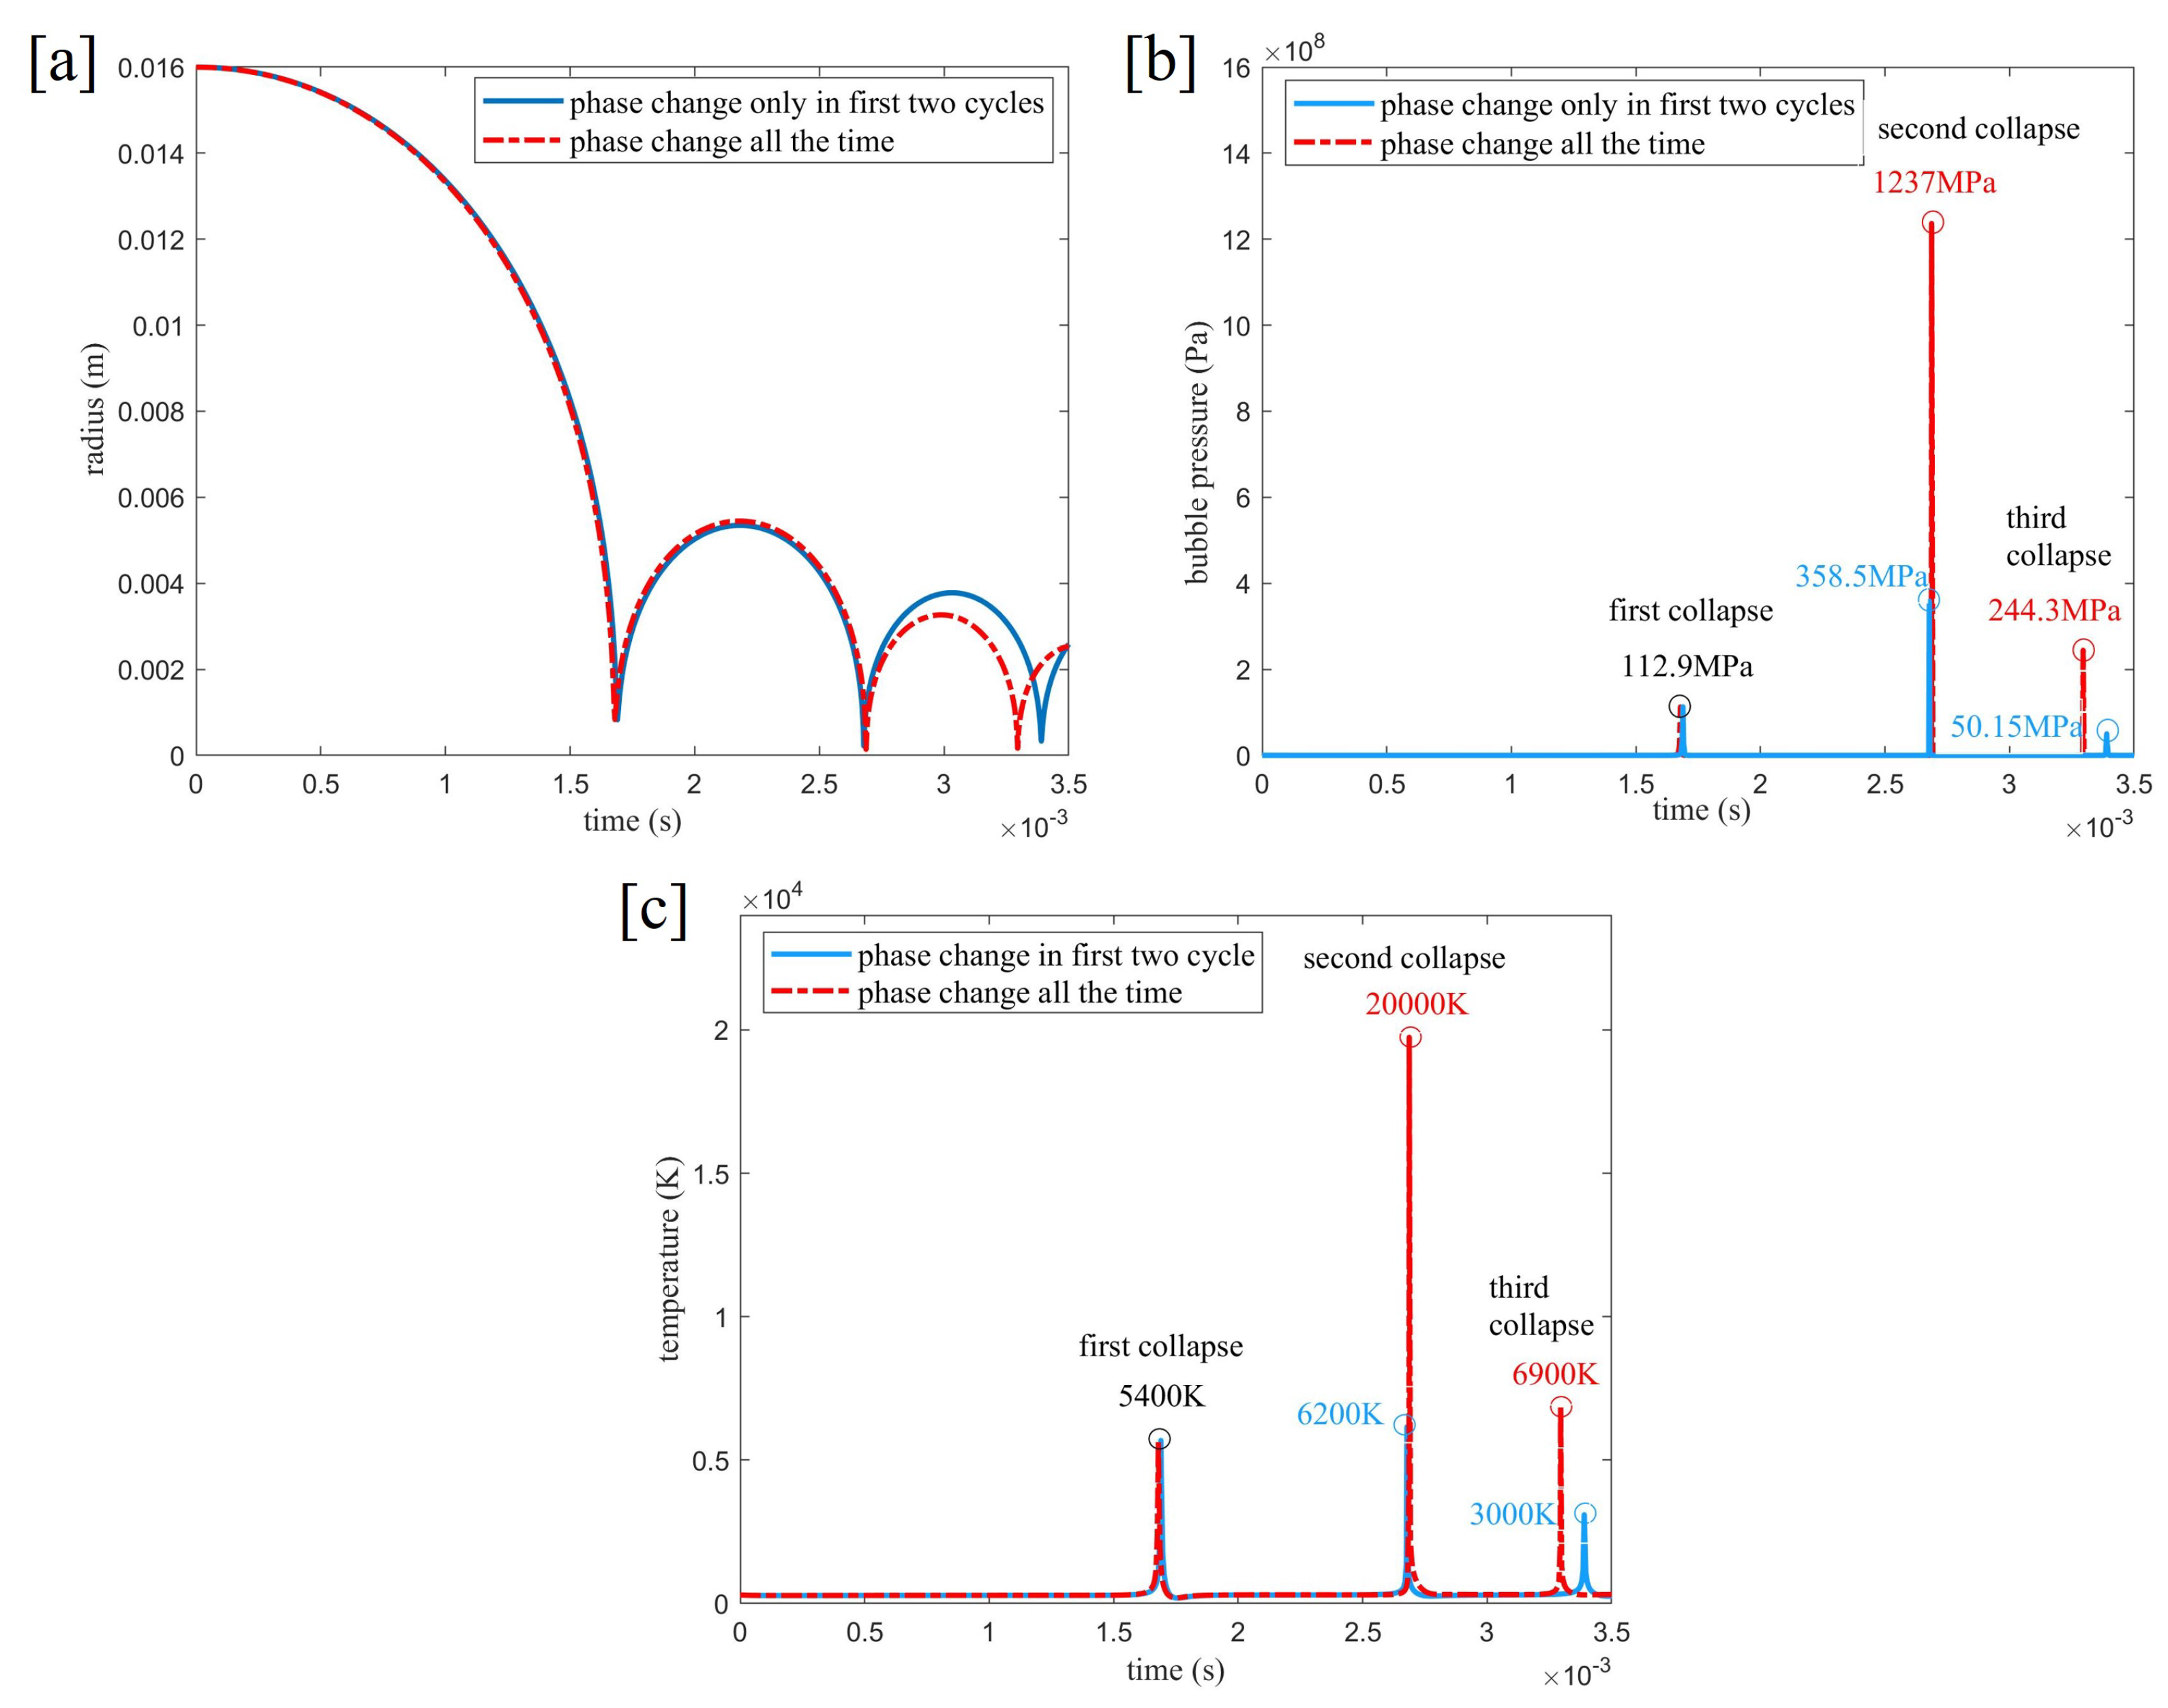
4.1. Effect of Phase Transition Duration

We take the spark-generated bubble with an initial radius of R 0 = 16 mm induced by voltage 450 V DC as an example to study the motion of bubbles containing 0.25% air content in a free field. In the model prediction result plot, the maximum temperature and maximum pressure in the bubble reach their maximum at the second collapse moment. To meet the initial conditions for the application of the Rayleigh–Plesset equation, the phase transition process is taken into account after the bubble reaches the maximum radius for the first time [19]. According to the Hertz–Knudsen–Langmuir modified relationship, the evaporation process is mainly determined by the ambient temperature. The temperature change of flow field during the transient bubble motion can be ignored, and Phan’s research [19] proves that the evaporation process has little effect on the bubble motion compared with the condensation process; therefore, it is assumed that the evaporation rate remains constant during the entire phase transition process, taking m ˙ eva = 0.04 kg / ( m 2 · s ) .
The model assumes that the gas inside the bubble is composed only of condensable vapor and non-condensable air. But in practice, N 2 , O 2 and H 2 O in extreme cases, such as extremely high pressure and temperature conditions when bubbles collapse, chemical reactions and recombination processes will occur to generate N O 2 , N O , etc., which may lead to a decrease in pressure peaks in the bubble movement cycle. These reaction products are soluble in water, and their presence may reduce the pressure peak when the bubble collapses, that is the occurrence of chemical reaction at the collapse moment can enhance the rebound potential energy of the bubble [25]. However, it is hard to quantitatively calculate the influence of chemical reactions on bubble motion, according to the work by Zhong and Phan et al. [19,20], the highest temperature and pressure is reached at the second bubble collapse. Presumably, it is considered that chemical reactions occur at the end of the second cycle, we consider this effect by ignoring vapor non-equilibrium evaporation and condensation after the bubble reaches the maximum radius of the second cycle, as is shown of the condensation rate curve in Figure 7.
Effect of phase transition duration on radius, pressure and temperature of the bubble multi-cycles motion are given in Figure 8a–c. The pressure and temperature peaks inside the bubble are observed at the second collapse moment. If the phase transition is considered during the whole bubble motion, the pressure and temperature in the bubble can reach a maximum of 1237 MPa and 20,000 K, respectively. Because if the phase transition keeps happening, the number of vapor molecules undergoing phase transition at the bubble collapse moment will increase significantly, it causes a stronger energy change. The stronger energy change obviously may lead to a sharp increase in the pressure and temperature peaks, far greater than the pressure and temperature peaks of 358.5 MPa and 6200 K in the present model. It is believed that the pressure and temperature peaks predicted by the present model are more reasonable.

4.2. Effect of Air Content

Time histories of bubble radius, temperature and pressure with different air contents are given in Figure 9a–c. As the total number of gas molecules in all working conditions remains unchanged, the increase in air content indicates the decrease in the number of vapor molecules. As shown in Figure 9, the curves before the first collapse are basically coincident, indicating that air content has little effect on the bubble motion before the first collapse, and phase transition (the decrease in the number of vapor molecules) mainly occurs at the collapse moment.
As air content increases, the mix-gases bubble motion tends to be similar to an air bubble. The decrease in the vapor molecules leads to a slower energy dissipation, so a larger rebound bubble potential energy and increased rebound radius are expected. Since the maximum pressure and temperature at the collapse moment are mainly determined by the intensity of energy change, a larger air content (a decrease in the vapor molecules) leads to a decrease in the intensity of the energy change. Therefore, the pressure and temperature peaks at the first and second collapse moments decrease with the increase in the air content. It is also noted that the bubble oscillation period increases with the air content.
Since the mixture in the bubble is considered an ideal gas after the vapor condensation is stopped, the pressure and temperature of the bubble are updated using the ideal gas state formula. As air content increases, the mix-gases bubble motion tends to be similar to an air bubble. The decrease in the vapor molecules leads to a slower energy dissipation, so a larger rebound bubble potential energy and increased rebound radius are expected. Since the maximum pressure and temperature at the collapse moment are mainly determined by the intensity of the energy change, a larger air content (the decrease in the vapor molecules) leads to a decrease in the intensity of the energy change. Therefore, the pressure and temperature peaks at the first and second collapse moments decrease with the increase in the air content. It is also noted that the bubble oscillation period increases with the air content.

5. Conclusions

In this study, we have introduced a modified theoretical model designed to capture the multi-oscillation behavior of spark-generated bubbles. Tailoring our approach to the unique characteristics of these bubbles, we have incorporated a modified phase transition duration. Our model builds upon the Plesset bubble dynamics equation, which has been augmented by Fujikawa and Akamatsu, and also integrates the surface temperature gradient approximation proposed by Zhong et al. Additionally, we have diligently determined the initial conditions through repeated measurements of gas content within the bubble. Through rigorous validation involving quantitative comparisons with experimental data, our proposed theoretical model has demonstrated commendable accuracy in simulating the dynamic behavior of bubbles across multiple cycles.
Our calculations have revealed that when factoring in the phase change effect, bubble collapse becomes highly energetic, with rapid increases in internal pressure and temperature at the finally stage of the bubble. Notably, the vapor condensation rate experiences fluctuations during both the collapse and rebound stages of the bubble. As the concentration of air within the bubble increases, it fosters more pronounced rebound behavior. Starting from the second cycle, we observe a decrease in the rate of maximum radius decay. This phenomenon is attributed to the rising air content, diminishing vapor concentration, and a lower energy decay rate per bubble collapse compared to pure vapor bubbles. This, in turn, accounts for the decreasing peak pressure and temperature of the bubble with increasing air content.
It is important to acknowledge that our model employs a uniform thermal boundary layer thickness across different bubbles, chosen to optimize simulation results according to Zhong et al. However, this choice may not precisely mirror real-world conditions. In future work, we aim to refine our model, considering variations in thermal boundary layer thickness for different bubble scenarios, which could impact the heat conduction efficiency of bubbles and their flow dynamics.

Author Contributions

Conceptualization, J.C. and R.H.; methodology, J.C.; software, J.C.; validation, J.C., R.H. and T.G.; formal analysis, J.C.; investigation, J.C.; resources, J.C.; data curation, J.C.; writing—original draft preparation, J.C.; writing—review and editing, R.H.; visualization, J.C.; supervision, R.H.; project administration, R.H.; funding acquisition, R.H. All authors have read and agreed to the published version of the manuscript.

Funding

This work was funded by the National Natural Science Foundation of China (12072087) and the Heilongjiang Postdoctoral Fund (LBH-Q19094, LBH-Q20016).

Data Availability Statement

The results of the work are new, some of the known results are in the available sources, which are cited in the article.

Acknowledgments

This work was supported by the National Natural Science Foundation of China (12072087) and the Heilongjiang Postdoctoral Fund (LBH-Q19094, LBH-Q20016).

Conflicts of Interest

The authors declare no conflict of interest.

References

  1. Johnsen, E.; Colonius, T. Numerical simulations of non-spherical bubble collapse. J. Fluid Mech. 2009, 629, 231–262. [Google Scholar] [CrossRef]
  2. Philipp, A.; Lauterborn, W. Cavitation erosion by single laser-produced bubbles. J. Fluid Mech. 1998, 361, 75–116. [Google Scholar] [CrossRef]
  3. Wang, S.P.; Zhang, A.M.; Liu, Y.L. Bubble dynamics and its applications. J. Hydrodyn. 2018, 30, 975–991. [Google Scholar] [CrossRef]
  4. Melissaris, T.; Schenke, S.; Bulten, N.; Terwisga, T.J. On the accuracy of predicting cavitation impact loads on marine propellers. Wear 2020, 456, 203393. [Google Scholar] [CrossRef]
  5. Han, B.; Kohler, K. Dynamics of laser-induced bubble pairs. J. Fluid Mech 2015, 771, 706–742. [Google Scholar] [CrossRef]
  6. Zhang, Y.N.; Gao, Y.H.; Du, X.Z. Stability mechanisms of oscillating vapor bubbles in acoustic fields. Ultrason. Sonochem. 2018, 40, 808–814. [Google Scholar] [CrossRef]
  7. Ma, X.J.; Huang, B.; Zhao, X. Comparisons of spark-charge bubble dynamics near the elastic and rigid boundaries. Ultrason. Sonochem. 2018, 43, 80–90. [Google Scholar] [CrossRef]
  8. Shan, M.L.; Chen, B.Y.; Yao, C. Electric characteristic and cavitation bubble dynamics using underwater pulsed discharge. Plasma Sci. Technol. 2019, 21, 16–22. [Google Scholar] [CrossRef]
  9. Luo, J.; Xu, W.L.; Khoo, B.C. Stratification effect of air bubble on the shock wave from the collapse of cavitation bubble. J. Fluid Mech. 2021, 919, A16. [Google Scholar] [CrossRef]
  10. Huang, G.; Zhang, M.; Ma, X. Dynamic behavior of a single bubble between the free surface and rigid wall. Ultrason. Sonochem. 2020, 67, 105147. [Google Scholar] [CrossRef]
  11. Xu, W.L. Interaction of a Cavitation Bubble and an Air Bubble with a Rigid Boundary. J. Hydrodyn. 2010, 22, 503–512. [Google Scholar] [CrossRef]
  12. Zhang, A.M. Experiments on Bubble Dynamics between a Free Surface and a Rigid Wall. Exp. Fluids 2013, 54, 1602. [Google Scholar] [CrossRef]
  13. Fujikawa, S.; Akamatsu, T. Effects of the non-equilibrium condensation of vapour on the pressure wave produced by the collapse of a bubble in a liquid. J. Fluid Mech. 1980, 97, 481–512. [Google Scholar] [CrossRef]
  14. Han, R.; Zhang, A.M.; Tan, S.; Li, S. Interaction of cavitation bubbles with the interface of two immiscible fluids on multiple time scales. J. Fluid Mech. 2022, 932, A8. [Google Scholar] [CrossRef]
  15. Zhang, A.M.; Li, S.M.; Cui, P.; Li, S.; Liu, Y.L. A unified theory for bubble dynamics. Phys. Fluids 2023, 35, 033323. [Google Scholar] [CrossRef]
  16. Zein, A.; Hantke, M.; Warnecke, G. On the modeling and simulation of a laser-induced cavitation bubble. Int. J. Numer. Methods Fluids 2013, 73, 172–203. [Google Scholar] [CrossRef]
  17. Lee, H.; Gojani, A.B.; Han, T.; Yoh, J.J. Dynamics of laser-induced bubble collapse visualized by time-resolved optical shadowgraph. J. Vis. 2011, 14, 331–337. [Google Scholar] [CrossRef]
  18. Sagar, H.; Moctar, O. Numerical simulation of a laser-induced cavitation bubble near a solid boundary considering phase change. Ship Technol. Res. 2018, 65, 1–17. [Google Scholar] [CrossRef]
  19. Phan, T.H.; Nguyen, V.T.; Duy, T.N. Influence of phase-change on the collapse and rebound stages of a single spark-generated cavitation bubble. Int. J. Heat Mass Transf. 2022, 184, 122270. [Google Scholar] [CrossRef]
  20. Zhong, X.X.; Eshraghi, J.; Vlachos, P. A model for a laser-induced cavitation bubble. Int. J. Multiph. Flow. 2020, 132, 103433. [Google Scholar] [CrossRef]
  21. Aganin, A.A.; Khismatullina, A.N. Influence of the phase interface mass transfer characteristics on the cavitation bubble collapse in water. Ocean Eng. 2023, 283, 115013. [Google Scholar] [CrossRef]
  22. Mustafin, N.I. Numerical Simulation of Collapse and Rebound of a Cavitation Bubble in Water. Lobachevskii J. Math. 2023, 44, 1771–1777. [Google Scholar] [CrossRef]
  23. Li, S.; Meer, D.V.d.; Zhang, A.M.; Prosperetti, A.; Lohse, D. Modelling large scale airgun-bubble dynamics with highly non-spherical features. International Journal of Multiphase Flow. Int. J. Multiph. Flow. 2020, 122, 103143. [Google Scholar] [CrossRef]
  24. Li, S.; Zhang, A.M.; Han, R.; Ma, Q. 3D full coupling model for strong interaction between a pulsating bubble and a movable sphere. J. Comput. Phys. 2019, 392, 713–731. [Google Scholar] [CrossRef]
  25. Trummler, T.; Schmidt, S.J.; Adams, N.A. Numerical investigation of non-condensable gas effect on vapor bubble collapse. Phys. Fluids 2021, 33, 096107. [Google Scholar] [CrossRef]
  26. Sato, T.; Tinguely, M.; Oizumi, M.; Farhat, M. Evidence for hydrogen generation in laser- or spark-induced cavitation bubbles. Appl. Phys. Lett. 2013, 102, 074105. [Google Scholar] [CrossRef]
  27. Kaouther, K.; Hamdaoui, O. Influence of reactions heats on variation of radius, temperature, pressure and chemical species amounts within a single acoustic cavitation bubble. Ultrason. Sonochem. 2018, 41, 449–457. [Google Scholar]
  28. Yasui, K. Alternative model of single-bubble sonoluminescence. Phys. Rev. E 1997, 56, 6750. [Google Scholar] [CrossRef]
  29. Plesset, M.S.; Pasadena, C. The dynamics of cavitation bubbles. J. Appl. Mech. 1949, 48, 277–282. [Google Scholar] [CrossRef]
  30. Alty, T.; Mackay, C.A. The accommodation coefficient and the evaporation coefficient of water. Proc. R. Soc. 1935, 149, 104–116. [Google Scholar]
  31. Yasui, K. Effects of thermal conduction on bubble dynamics near the sonolu- minescence threshold. J. Acoust. Soc. Am. 1995, 98, 2772–2782. [Google Scholar] [CrossRef]
  32. Prosperetti, A.; Lezzi, A. Bubble dynamics in a compressible liquid. Part 1. First-order theory. J. Fluid Mech. 1986, 168, 457–478. [Google Scholar] [CrossRef]
  33. Jebali, F.; Francois, M.X. Thermal resistance of a vapor-liquid He II interface. Phy. B Condensed Matter 1994, 194, 599–600. [Google Scholar] [CrossRef]
  34. Grunt, K.; Lewkowicz, M.; Pietrowicz, S.; Takada, S.; Kimura, N.; Murakami, M. Dynamics of vapour bubbles induced during the boiling of superfluid helium under microgravity conditions. Int. J. Heat Mass Trans. 2019, 134, 1073–1083. [Google Scholar] [CrossRef]
  35. Keller, J.; Miksis, M. Bubble oscillations of large amplitude. J. Acoust. Soc. Am. 1980, 68, 628–633. [Google Scholar] [CrossRef]
  36. Cui, P.; Zhang, A.M.; Wang, S.; Khoo, B.C. Ice breaking by a collapsing bubble. J. Fluid Mech. 2018, 841, 287–309. [Google Scholar] [CrossRef]
  37. Akhatov, L.; Lindau, O.; Topolnikov, A.; Vlachos, R. Collapse and rebound of a laser-induced cavitation bubble. Phys. Fluids 2001, 13, 2805–2819. [Google Scholar] [CrossRef]
Figure 1. Two thermal boundary layers on the bubble surface.
Inventions 08 00131 g001
Figure 2. Schematic diagram of the experimental setup.
Inventions 08 00131 g002
Figure 3. Growth and collapse of spark bubbles. Voltage = 450 V.
Inventions 08 00131 g003
Figure 4. Comparison of bubble radii (Black dots: experimental data points. Green dotted line: Keller–Miksis equation result. Blue dot line: Zhong model results, where n t ( 0 ) = 1.4 × 10 20 , n air ( 0 ) = 4 × 10 16 , α M = 0.04 . Red line: This paper model results, where n t ( 0 ) = 1.4 × 10 20 , n air ( 0 ) = 4 × 10 16 , α M = 0.04 , δ 1 ( 0 ) = 0.45 μm. In the Keller–Miksis equation, it is assumed that the bubble movement process is adiabatic and the initial gas pressure is 101,000 Pa. Zhong model parameters are obtained by best fitting the measured data of experimental bubble radius).
Inventions 08 00131 g004
Figure 5. Total energy loss caused by condensation of vapor molecules.
Inventions 08 00131 g005
Figure 6. Comparison of experimental measurement radius and predicted radius (Black dots: experimental data points. Blue dot line: our model results, (a) voltage = 450 V, R max 1 = 14.2 mm, T c o l l a p s e 1 = 1.38 ms, R max 2 = 4.96 mm, T c o l l a p s e 2 = 2.24 ms, R max 3 = 4.96 mm, T c o l l a p s e 3 = 2.83 ms; (b) voltage = 450 V, R max 1 = 12 mm, T c o l l a p s e 1 = 1.18 ms, R max 2 = 4.12 mm, T c o l l a p s e 2 = 2.04 ms, R max 3 = 3.24 mm, T c o l l a p s e 3 = 2.83 ms; (c) voltage = 450 V, R max 1 = 14.4 mm, T c o l l a p s e 1 = 1.42 ms, R max 2 = 3.86 mm, T c o l l a p s e 2 = 2.2 ms, R max 3 = 2.46 mm, T c o l l a p s e 3 = 2.88 ms; (d) voltage = 450 V, R max 1 = 16 mm, T c o l l a p s e 1 = 1.68 ms, R max 2 = 4.82 mm, T c o l l a p s e 2 = 2.66 ms, R max 3 = 3.16 mm, T c o l l a p s e 3 = 3.32 ms).
Inventions 08 00131 g006
Figure 7. Prediction of mass transfer rate during bubble motion.
Inventions 08 00131 g007
Figure 8. Effect of condensation duration on bubble motion (Initial conditions: n t ( 0 ) = 1.4 × 10 20 , n air ( 0 ) = 4 × 10 16 , α M = 0.04 , δ 1 ( 0 ) = 0.45 μ m).
Inventions 08 00131 g008
Figure 9. Effect of air content on bubble motion (Initial conditions: n t ( 0 ) = 1.4 × 10 20 , α M = 0.04 , δ 1 ( 0 ) = 0.45 μm).
Inventions 08 00131 g009
Table 1. Physical properties at 1 (atm) and 20 (°C).
Physical PropertySymbolValueUnit
Sound speed in waterc1483 m · s 1
Water density ρ l 1000 kg · m 3
Surface tension coefficient σ 0.072 N · m 1
Water viscosity μ 0.001Pa·s
Molar weight of vapor M vapor 0.018 kg · mol 1
Molar weight of air M air 0.02897 kg · mol 1
Avogadro constant N A 6.02 × 10 23 mo l 1
Gas constant R g 8.314 J · mo l 1 · K 1
Intermolecular attraction of air a air 0.1402 J · m 3 · mo l 2
Intermolecular attraction of vapor a vapor 0.5536 J · m 3 · mo l 2
Volume occupied by air molecules b air 3.753 × 10 5 m 3 · mo l 1
Volume occupied by vapor molecules b vapor 3.049 × 10 5 m 3 · mo l 1
Gas constant of vapor R v 461.52 J · k g 1 · K 1
Thermal accommodation coefficient α e 1-
Thermal conductivity of vapor κ 0.02 W · m 1 · K 1
Thermal conductivity of water k l 0.55 W · m 1 · K 1
Boltzmann constantk 1.38 × 10 23 J · K 1
Stefan-Boltzmann constant σ r 5.67 × 10 8 W · m 2 · K 4
Flow field temperature T liquid 293.15K
Vapor specific heat capacity at constant volume c vair 1089 J · k g 1 · K 1
Specific heat capacity of air at constant volume c vvapor 717 J · k g 1 · K 1
Disclaimer/Publisher’s Note: The statements, opinions and data contained in all publications are solely those of the individual author(s) and contributor(s) and not of MDPI and/or the editor(s). MDPI and/or the editor(s) disclaim responsibility for any injury to people or property resulting from any ideas, methods, instructions or products referred to in the content.

