Article

A New Random Positioning Machine Modification Applied for Microgravity Simulation in Laboratory Experiments with Rats

1
Department of Medical Physics and Biophysics, Medical University of Plovdiv, 4000 Plovdiv, Bulgaria
2
Faculty of Physics and Technology, University of Plovdiv Paisii Hilendarski, 24 Tzar Asen, 4000 Plovdiv, Bulgaria
*
Author to whom correspondence should be addressed.
Inventions 2022, 7(3), 85; https://doi.org/10.3390/inventions7030085
Submission received: 21 August 2022 / Revised: 9 September 2022 / Accepted: 15 September 2022 / Published: 19 September 2022

Abstract

:
The study presents a newly constructed modification of a random positioning machine (RPM) used in 3D-clinostat and in random mode. The main purpose is to provide an RPM animal model that uses up to four experimental animals simultaneously. In order to validate our RPM, the gravity dispersion and its magnitude are compared with the ones of a traditional machine. The results showed no crucial deviations in gravity dispersion and its time-averaged value in all sets of parameters. Furthermore, a posteriori stress tests are conducted on three Wistar male rats groups in order to estimate the level of stress from the setup. The social trait results suggest that the group exposed to our device has no increase in anxiety.

1. Introduction

Space exploration is becoming the primary aim of scientists in the ‘space industry’. It has managed to achieve a particular goal—Mars, and the participants in it are trying their best to send a human spaceflight. A round trip mission to the Red planet would take about 450 days on average [1]. Such long-term exposure to microgravity impacts different systems in the body. The holder of the record for the longest single space flight, Valeri Polyakov, endured 437 days. In the first six months of the mission, his health status was similar to other astronauts’ in terms of changes in autonomic regulation of circulation and cardiac contractility. But after this period, adaptive mechanisms had been activated [2]. In fact, the long-lasting exposure to low gravity leads to changes in bone density and muscle mass loss [3,4,5]. Furthermore, short and long-term microgravity exposure leads to alterations in behavioral reactions, memory, and neuroplasticity [6,7,8,9,10]. Various researches simulating microgravity or hypogravity conditions have been conducted as experiments in ground–based conditions due to the excessive cost of space experiments. An example of such an engineering solution is the random positioning machine (RPM) which is a device that changes the gravity direction by acting on an object placed at the geometrical center of two independently rotating perpendicular frames (inner and outer frame). It distributes the gravitational force and eventually offsets the sum of the integrated gravity vector during its operating time. Even though randomization of the gravity vector is the main idea behind the RPM, some pivotal limitations occur [11]. The primary disadvantage is that if the vector sum of acceleration is close to zero, hypogravity may be truthful for a point, but it is not so for a whole object. Another issue is the usage of high rotation speeds and large samples, or probes displaced from the center. Such situation will cause residual accelerations [12]. However, if the rotational speeds, the distance from the center of rotation and dimensions of the experimental area are restricted, then such a machine could provide an acceptably accurate model. In addition, by reducing the angular velocities of the frames and the distance from the center, the centrifugal force will become negligible. In this manner, RPM could be used for simulating both microgravity and hypogravity.
One of the first prototypes of RPM was reported by Scano in 1963 [13]. Later, an upgrade has been proposed by Murakami, Yamada and Hoson [14,15], while a random walk of angular velocities has been incorporated by a Dutch group [16,17]. The main idea is the randomization of the gravity vector over time. The direction of the time-averaged gravity vector is changing and decreasing its effective value in terms of the object (see e.g., [12]). Moreover, the geometrical centers of both frames should coincide. In addition, the location of the sample is assumed to be at the rotational center.
The main application of the RPM is to simulate the effects of long-term hypo- or microgravity on living objects. Cell cultures are more widely used in such type of experiments [18] while studies with experimental animals, especially with rats, are quite rare. It is known that rats are social animals which is related to conspecific cooperative interactions showing elaborate prosocial behaviors [19,20,21]. Rats in isolation are not able to coordinate their behavior with conspecifics [22]. Furthermore, laboratory rats housed in isolation show behavioral, neurobiological, physiological and psychological changes [23,24,25,26,27]. It must be mentioned that the physiological similarities between rats and humans allow the extrapolation of the results [28]. So, producing such outcomes will give vital information about the human physiological reaction to that kind of stimuli and better understanding of in-flight and post-flight changes in astronauts. A validation of the RPM operating mode for such experiments is required at this point. The randomization in time of the gravity vector is affected by different combinations between angular velocities, random or pattern change in parameters and directions [16,29,30]. Another proposed method is the time-averaged simulated microgravity (taSMG), which has been used to demonstrate the inhibition in the proliferation of cells [31]. It was suggested that the ratio between the angular velocities of the frames is crucial for the uniform dispersion of the gravity [29].
The aim of this study is twofold. First, we present a new RPM design to simulate microgravity and hypogravity on up to four experimental animals simultaneously (Section 2). Second, we apply our RPM to three different groups of rats (in vivo experiment) and make a stress evaluation (Section 3) of the tested animals. To the best of our knowledge, no such animal model has been attempted with the RPM machine so far. However, different teams have tested the stress evaluation with other microgravity analogs.

2. Description of the Machine

In this section, we provide a technical and theoretical description of our RPM. The construction of our design allows us to reduce the experimental time for the required number of animals and to produce uniform conditions for the subjects. Although the machine is constructed for rats, it can be used on mice and other animals as well. As far as we are aware, no such proposal has been made so far. A similar experimental set-up has been proposed by Peana et al. [32] and later by Saba et al. [33], but both teams used the RPM on only one experimental animal. To ensure the correct operating mode of the machine, we compare it with some existing ones.

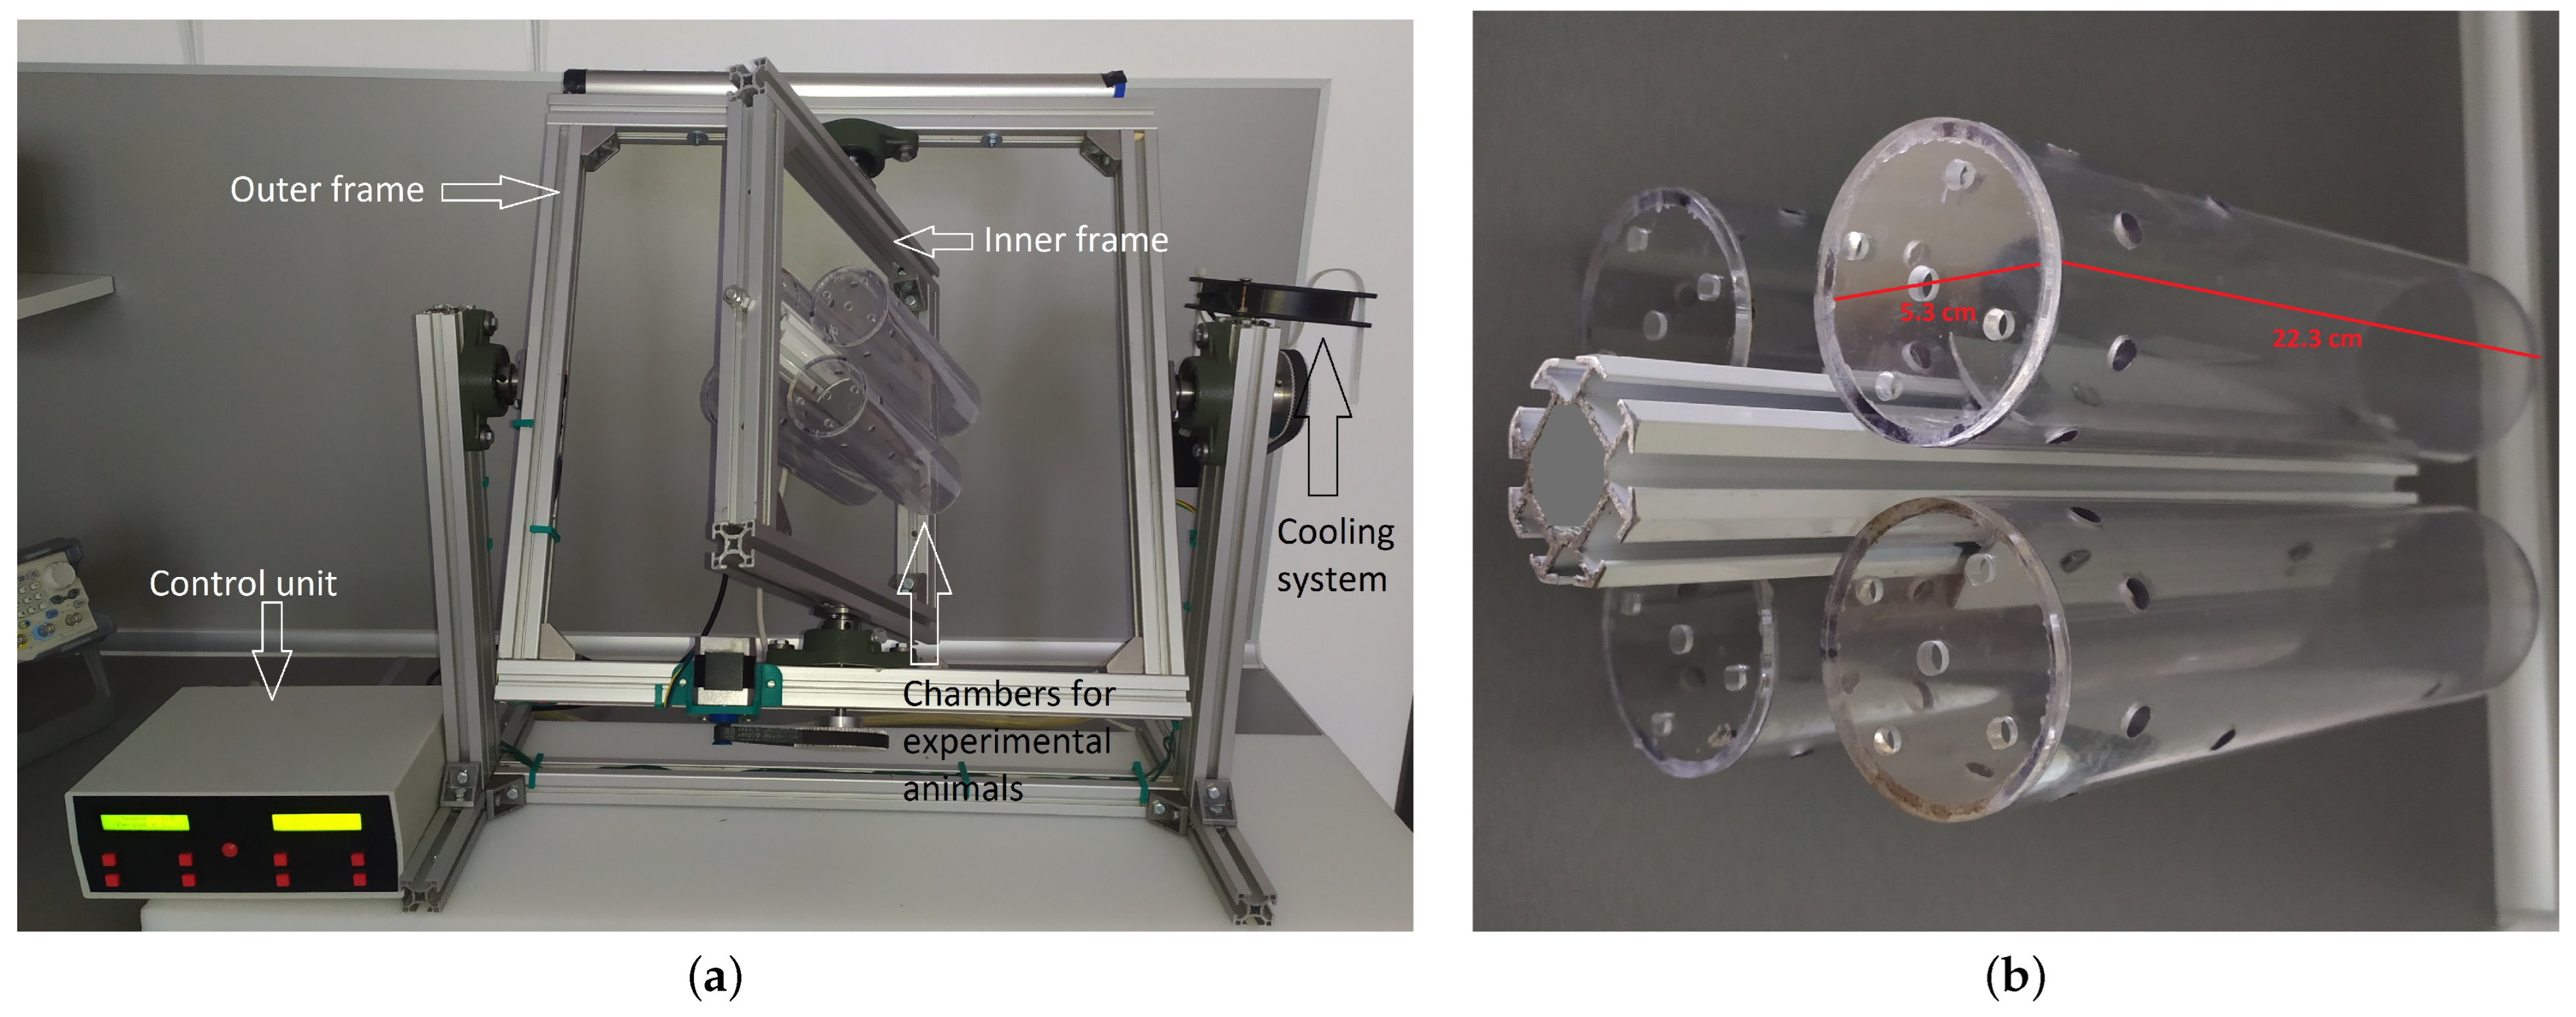
2.1. Design of the Machine

The considered modification of RPM consists of two square-shaped frames (inner and outer) with dimensions of 36 cm and 50 cm, respectively, which rotate perpendicularly and independently from each other (Figure 1). The inner dimensions of the chambers are as follows—length of 22.3 cm and diameter of 5.3 cm. The distance from every chamber axis center to the main one is precisely 3.5 cm, corresponding to the average distance to the longitudinal body axis of the animal.
The control unit regulates the rotational parameters (angular velocities, direction of rotation and periods of rotation) of the frames. Variations of fixed rotational parameters (Table 1) based on literature references are chosen to ensure objective testing of the prototype in 3D mode. For the random mode, all parameters were randomly selected from a range of values by a software algorithm.
For comparison of the proposed model with the traditional ones, we apply a theoretical description of it and an experimental measurement of the gravity dispersion and its magnitude at the chosen spatial points. We specifically chose to compare the following two points: at the geometric center of the machine and at 3.5 cm from the center—a distance to the object according to our model. The measurement tests were performed using an acceleration sensor (MBIENTLAB INC, San Francisco, CA, USA). The obtained data are analyzed and represented using ParaView Software [34], and are compared with reported ones in the area of simulated microgravity.

2.2. Theoretical Description

For the mathematical description of the experimental environment, we consider a fixed coordinate system O X Y Z with standard basis ( e X , e Y , e Z ) and with the origin located at the rotational center of our RPM. Also, we consider two coordinate systems O x y z ( i , j , k ) and O x y z ( e x , e y , e z ) attached to the outer and inner frames of the RPM, respectively (Figure 2).
We assume that the outer frame executes rotation about Y-axis at angle φ while the inner frame rotates about Z-axis at angle ϕ . Therefore, to represent the relation between the standard basis of the spaces described by the considered coordinate systems, we shall use the rotational matrices.
R Y = cos φ 0 sin φ 0 1 0 sin φ 0 cos φ and R Z = cos ϕ sin ϕ 0 sin ϕ cos ϕ 0 0 0 1 .
Thus, we get the following relations between the bases:
i j k = R Z · e x e y e z = cos ϕ e x sin ϕ e y sin ϕ e x + cos ϕ e y e z
and
e X e Y e Z = R Y · i j k = cos φ ( cos ϕ e x sin ϕ e y ) + sin φ e z sin ϕ e x + cos ϕ e y sin φ ( cos ϕ e x sin ϕ e y ) + cos φ e z .
Since the unit gravity vector e g has the same direction as e Z , then from (1) we obtain
e g = sin φ cos ϕ e x + sin φ sin ϕ e y + cos φ e z .
Further, the angular velocities of the inner and outer frames can be defined by the unit vectors in their respective coordinate systems as follows:
ω ϕ = ω ϕ e z and ω φ = ω φ j ,
where ω ϕ = d ϕ / d t and ω φ = d φ / d t . Thus, the angular velocity of the gravity vector in terms of the inner frame coordinate system is given by
ω = ω φ + ω ϕ = ω φ sin ϕ e x + ω φ cos ϕ e y + ω ϕ e z .
Now, from (2) and (3) the linear velocity of the gravity vector tip is obtained on the unit sphere attached to the inner frame as follows:
v g = ω × e g = ( ω φ cos ϕ cos φ ω ϕ sin ϕ sin φ ) e x ( ω φ sin ϕ cos φ + ω ϕ sin φ cos ϕ ) e y + ω φ sin φ e z .
Finally, the ratio of the revolutions over time is converted to the ratio of the angular velocities (see e.g., [29]):
γ = ω ϕ ω φ .
To ensure the correctness of the simulation of decreased gravity, the fixed velocities have been randomly chosen between 0.05 [rads/s] and 0.4 [rads/s] as in the papers [12,35]. However, the velocities range alone does not guarantee the reproduction of microgravity conditions. If there is a strong path repetition over time for the gravity vector tip, this leads to unevenly distributed gravity effects for the object, thus we reproduce only hypogravity conditions at best. Avoiding such a scenario can increase the uniform spreading of gravity in all directions. Kim [29] suggests that if γ defined by (5) is closer to an irrational number rather than to a rational one, the chances to obtain even distribution and replicate microgravity state are better. Our rotational parameters have been selected so that both conditions can be tested and the machine can be compared with the reported ones.

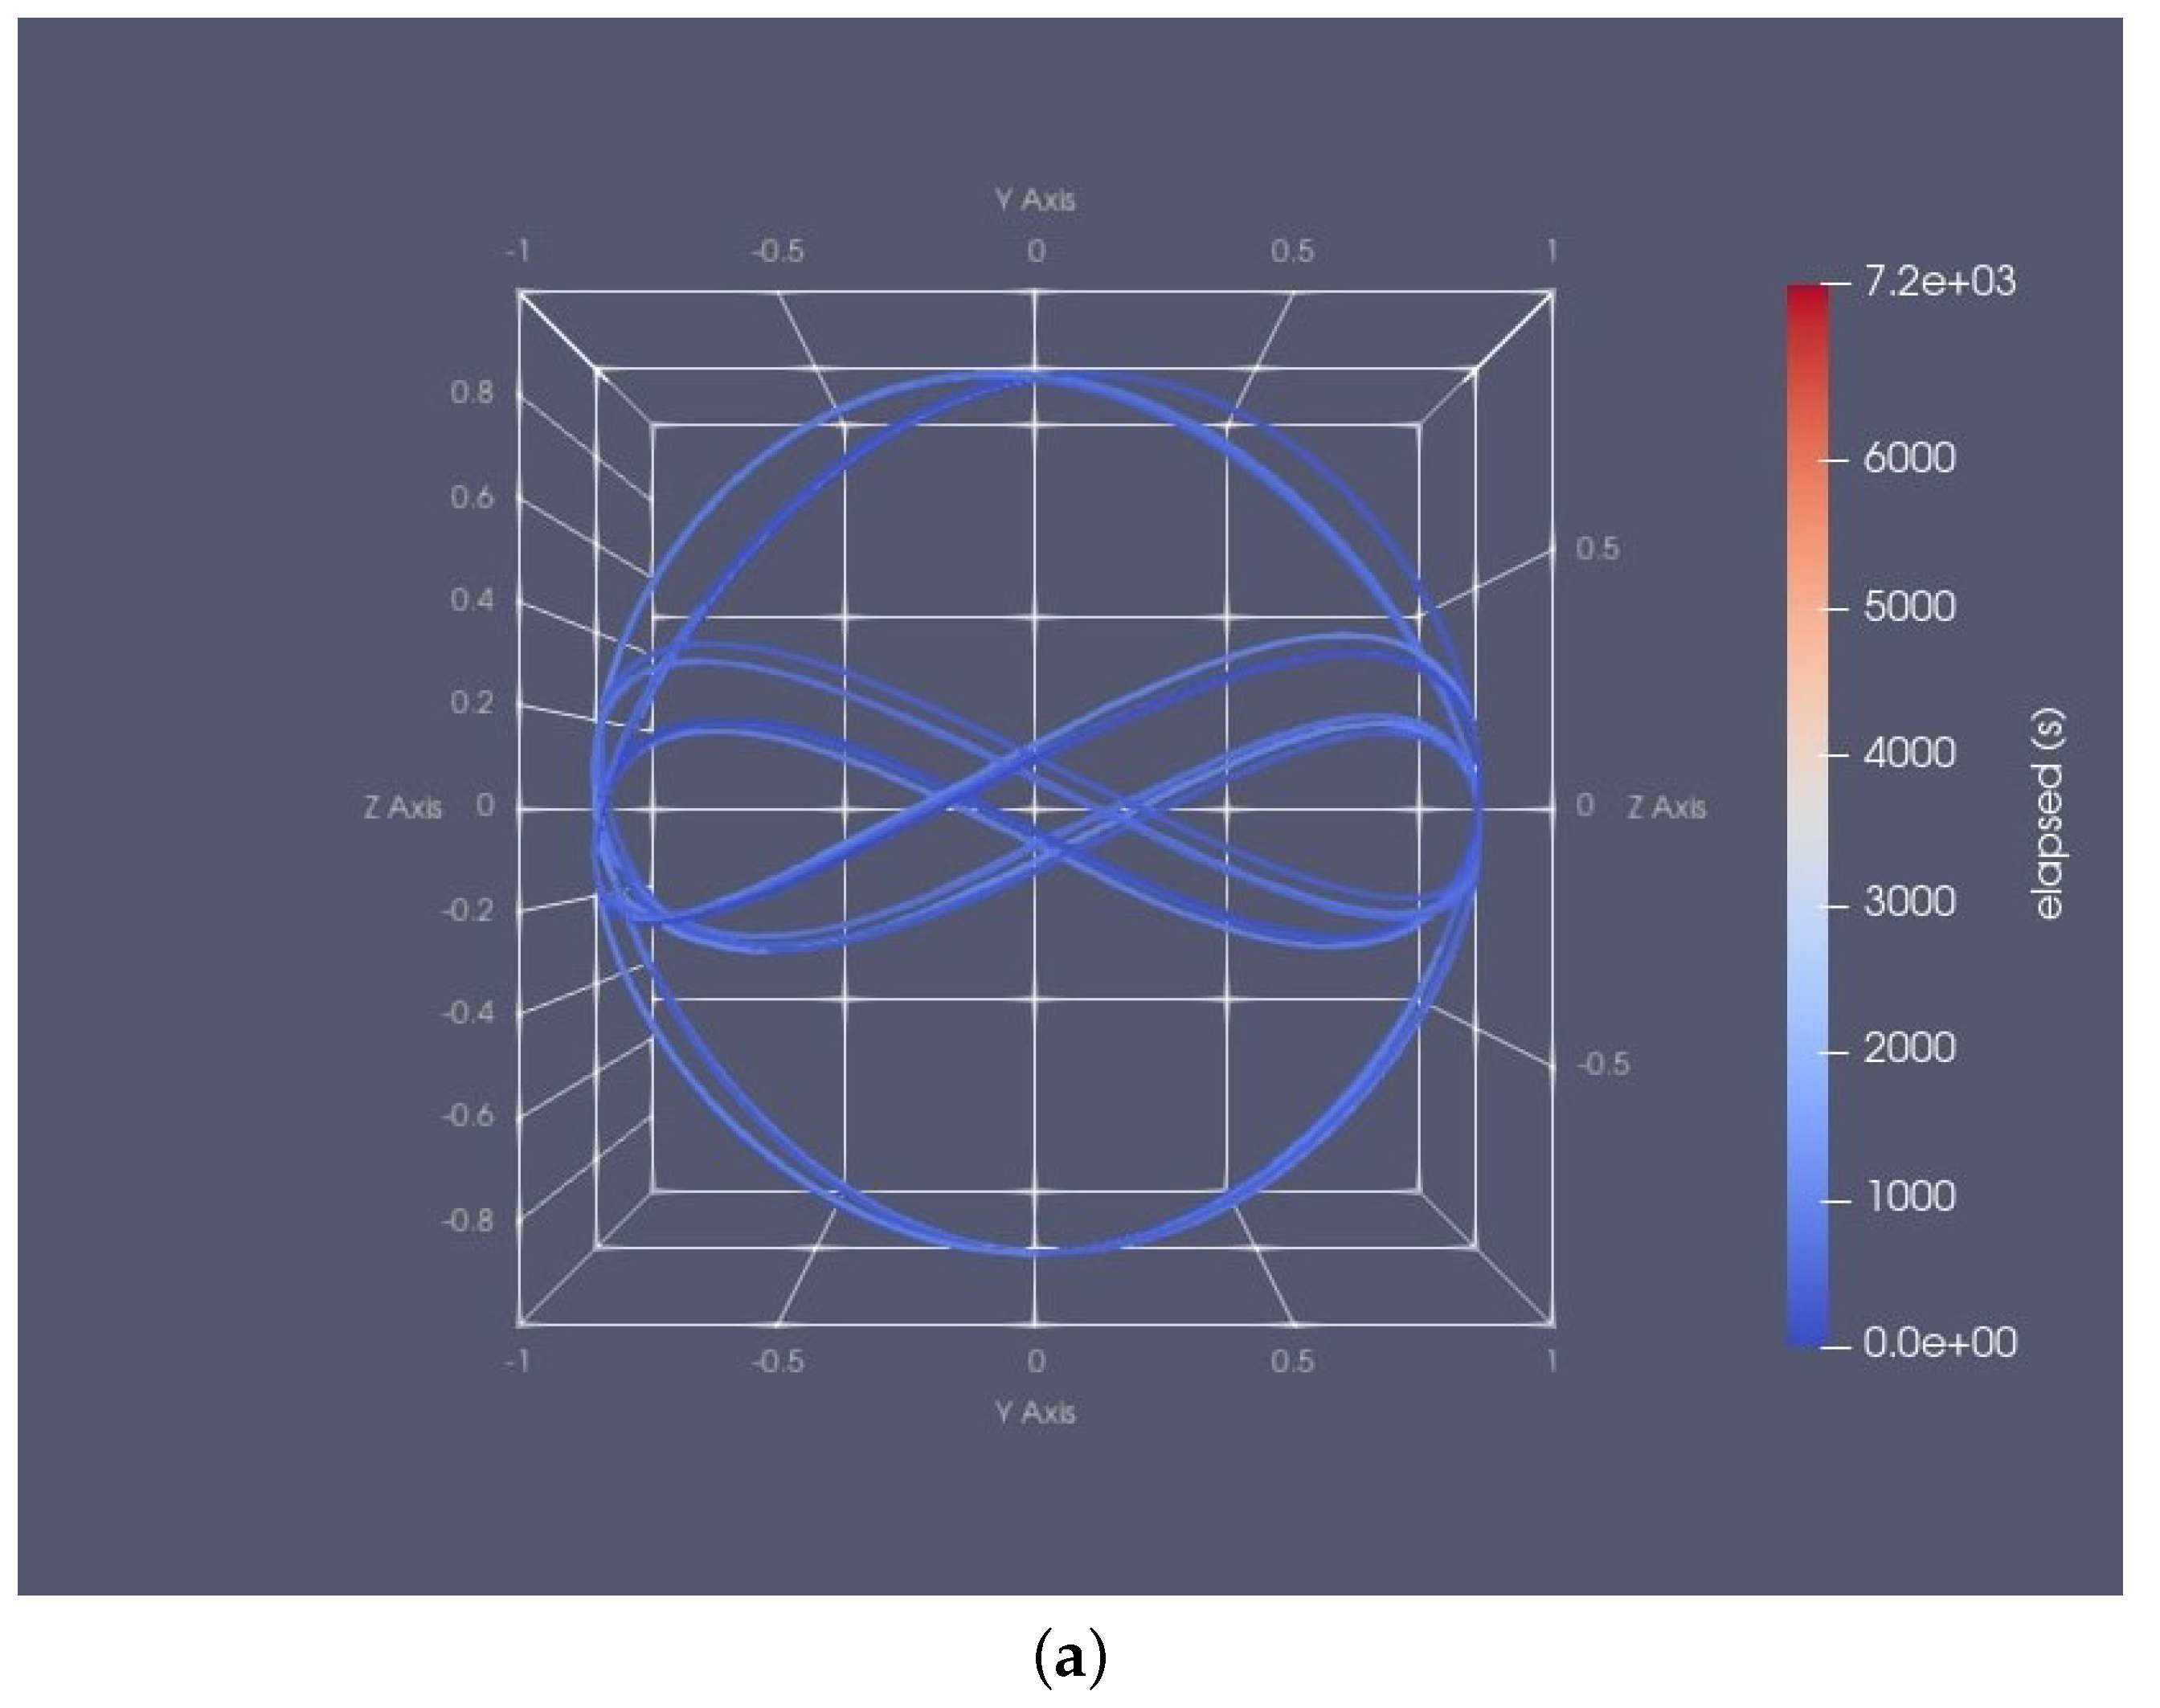
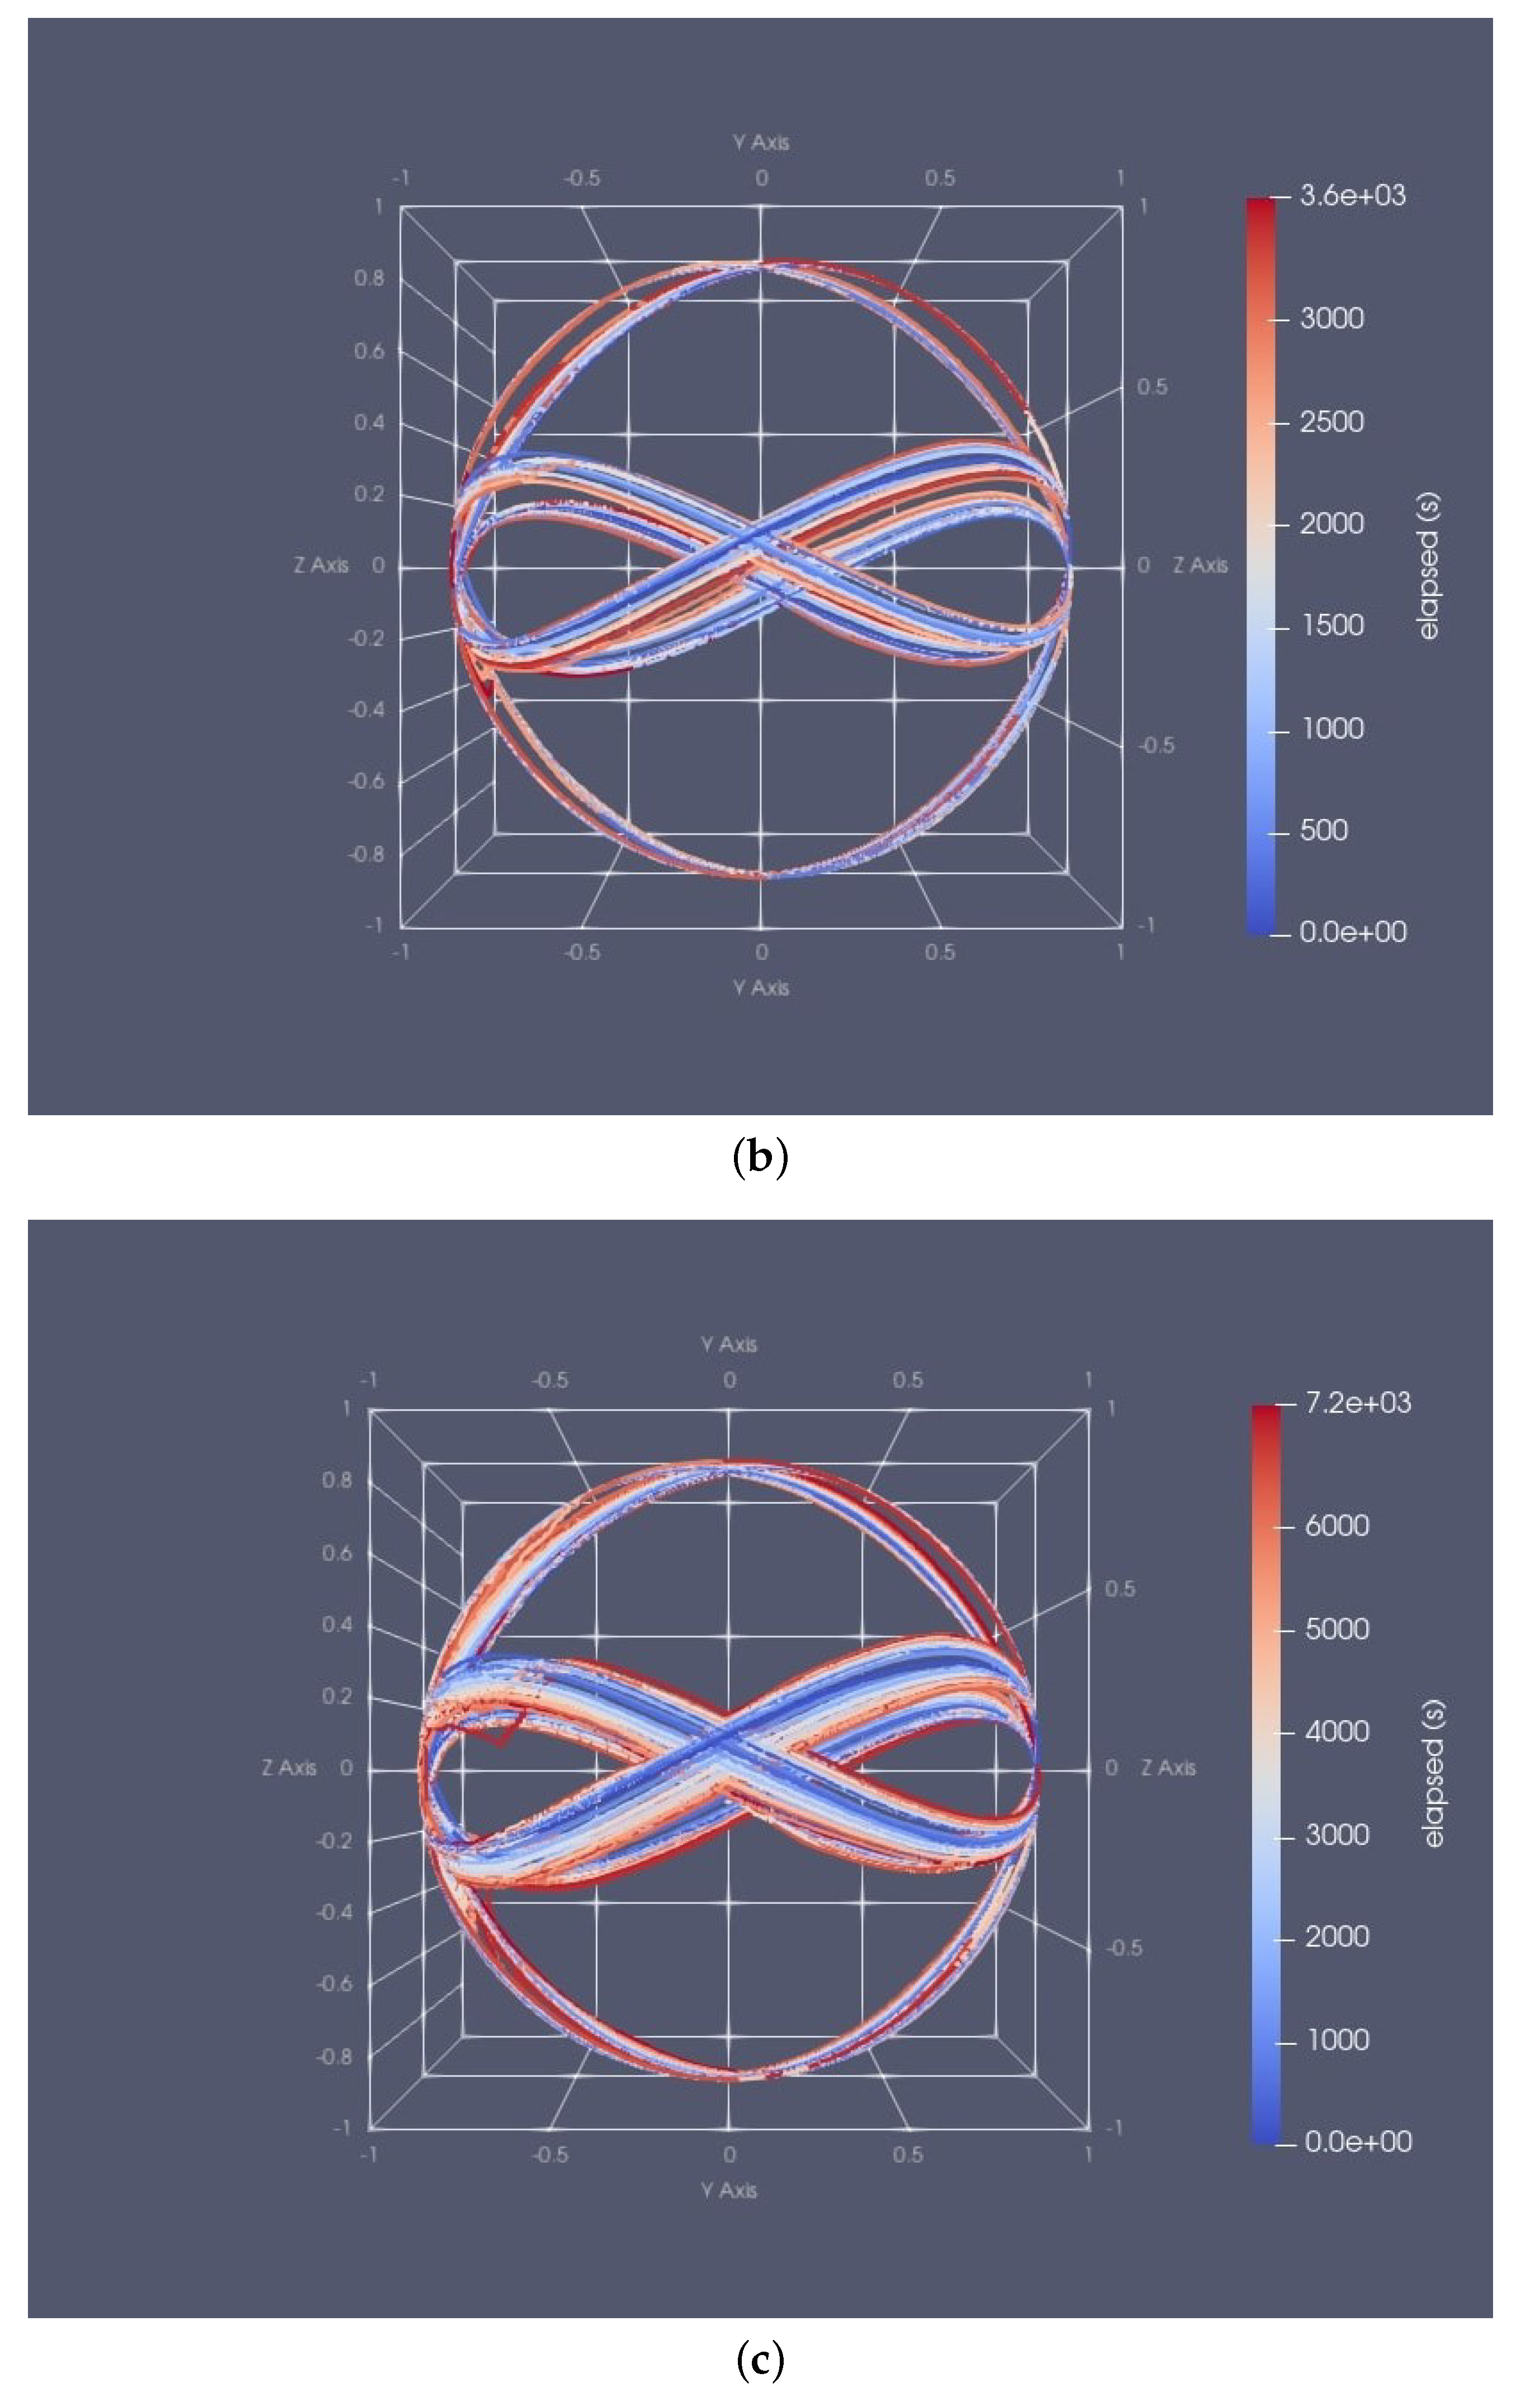
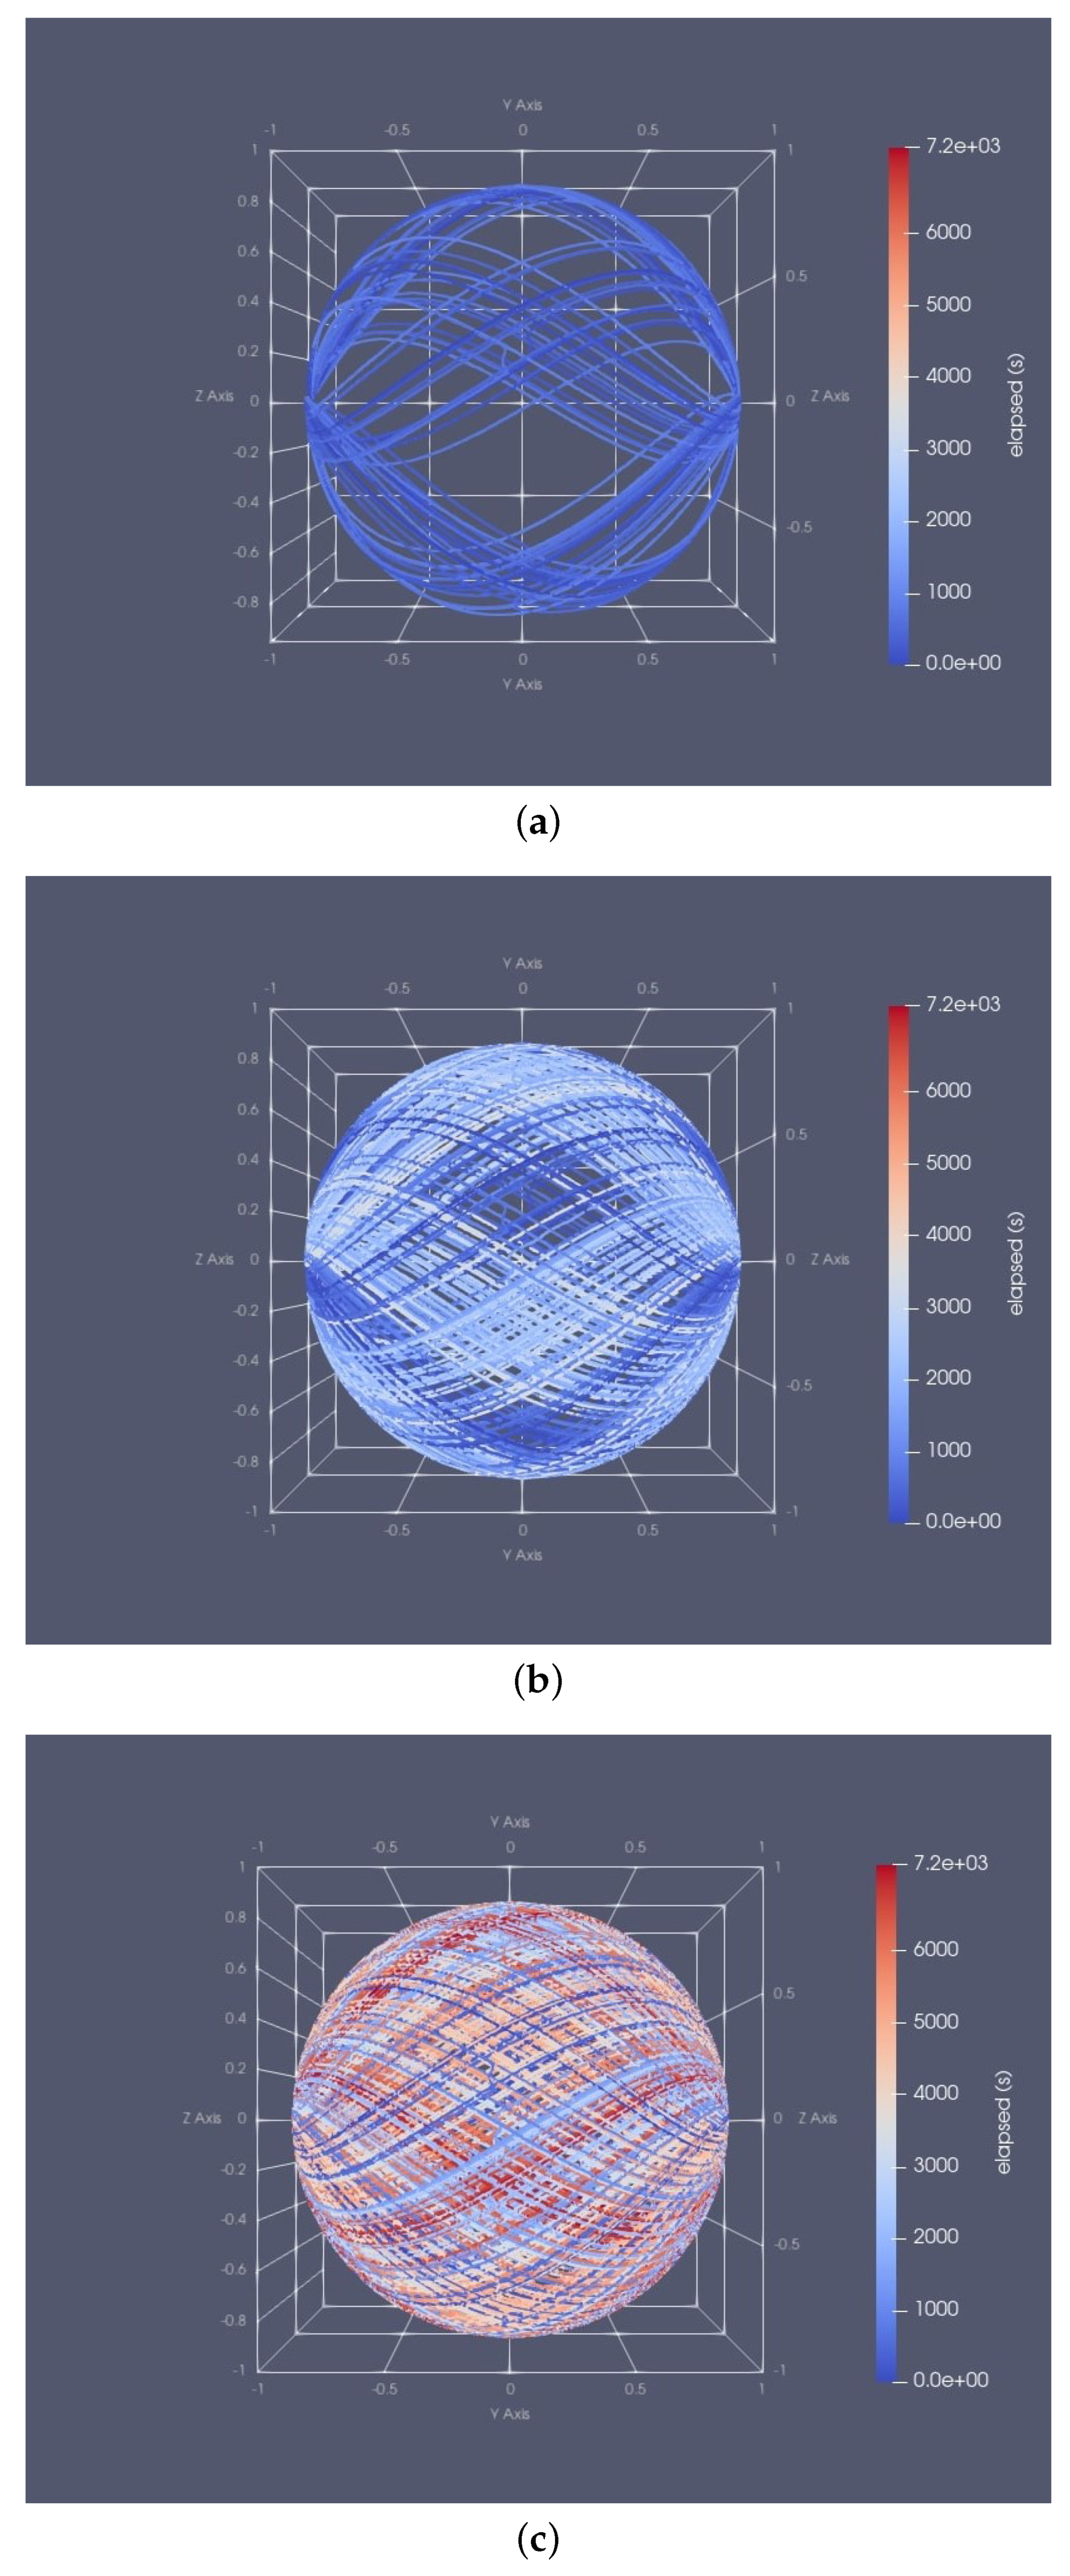
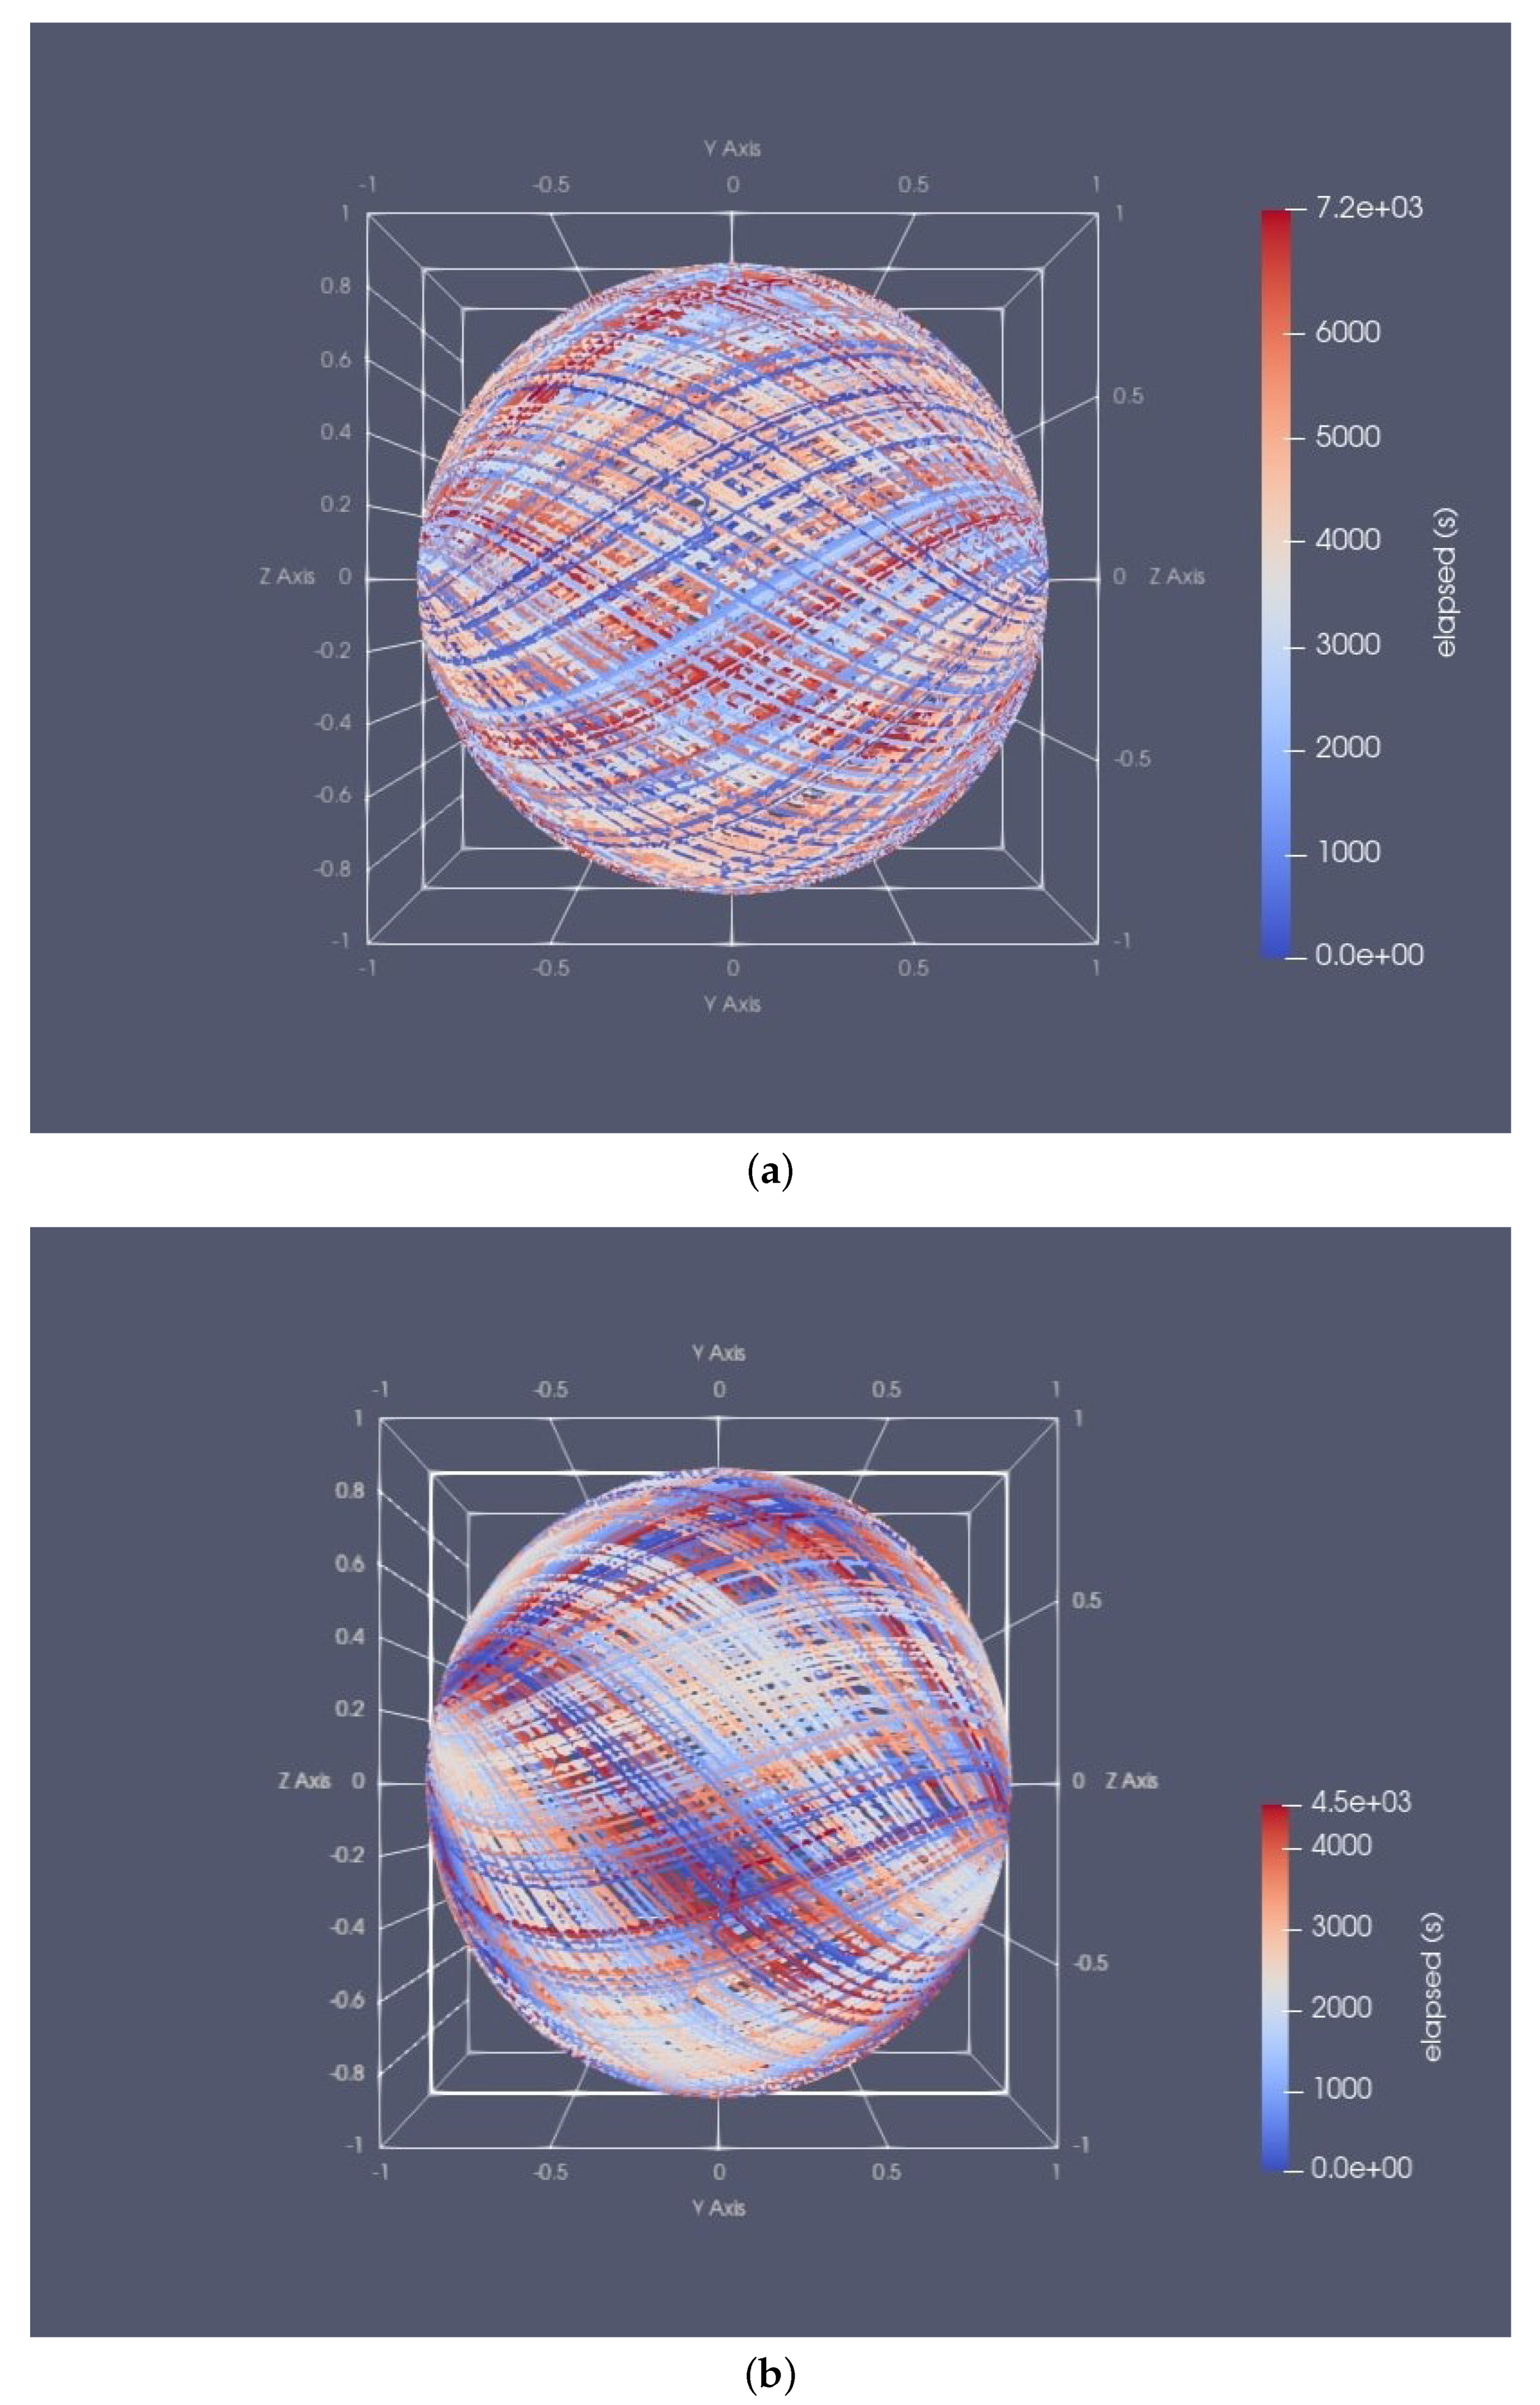
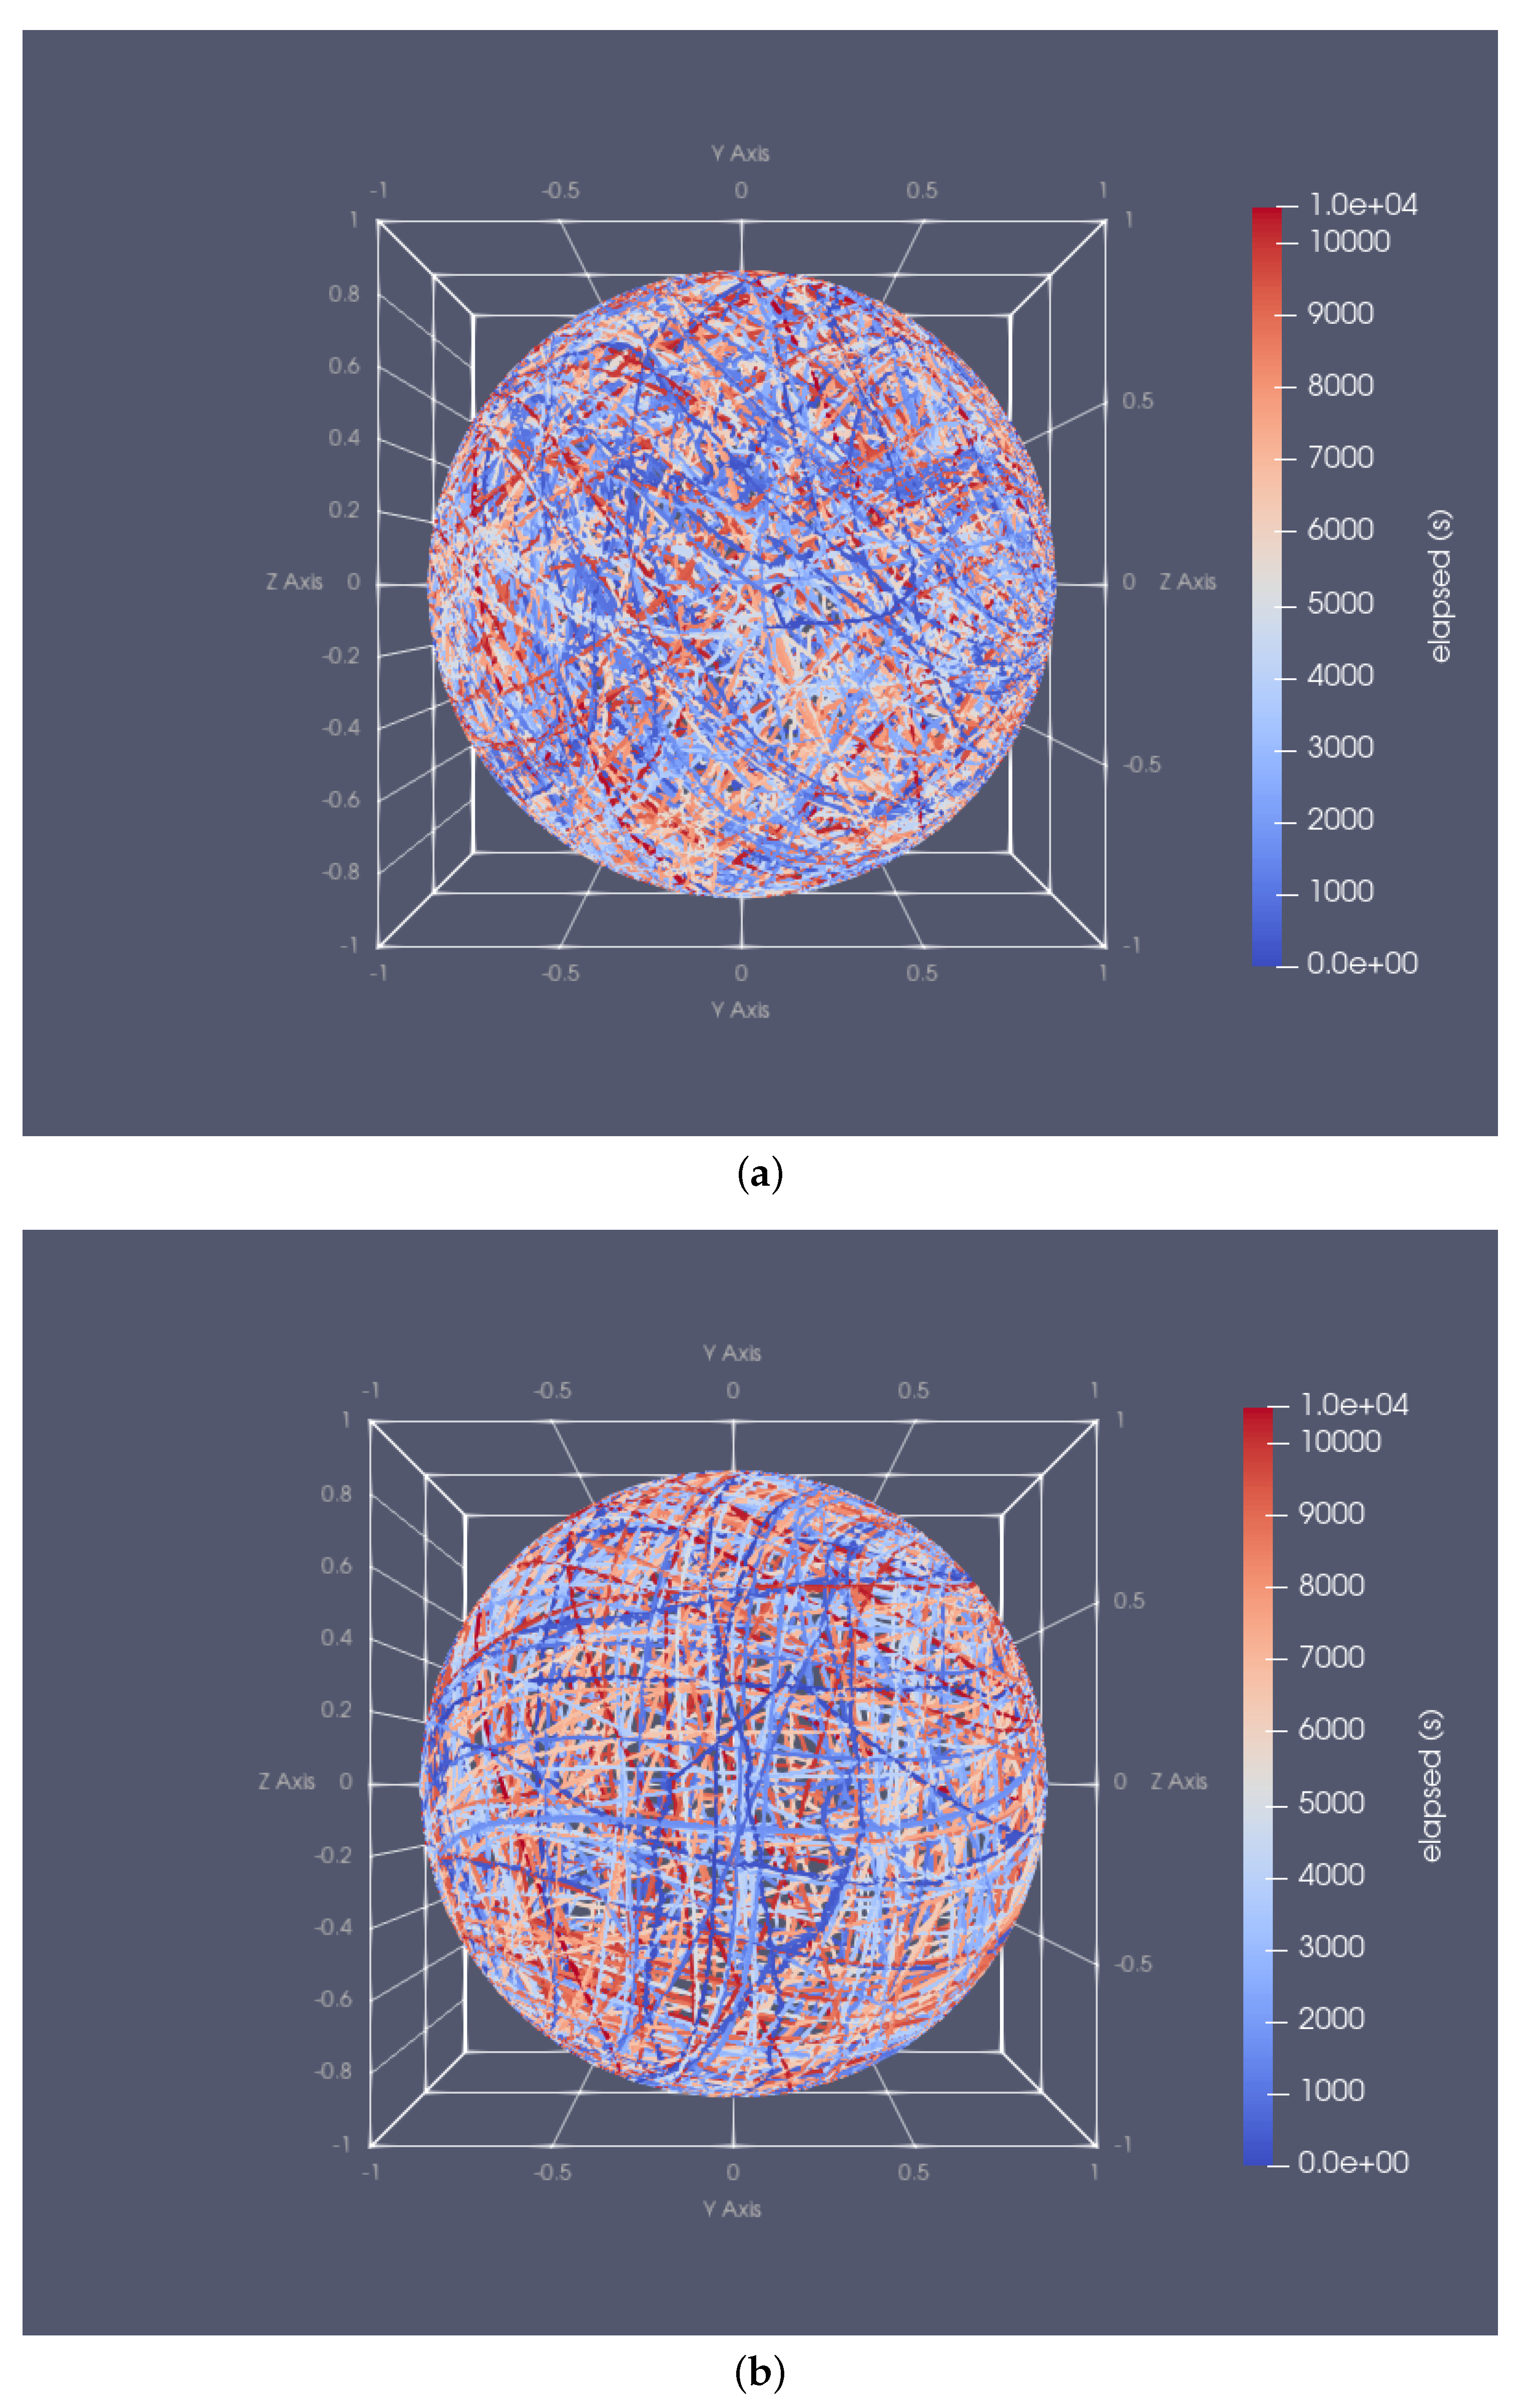
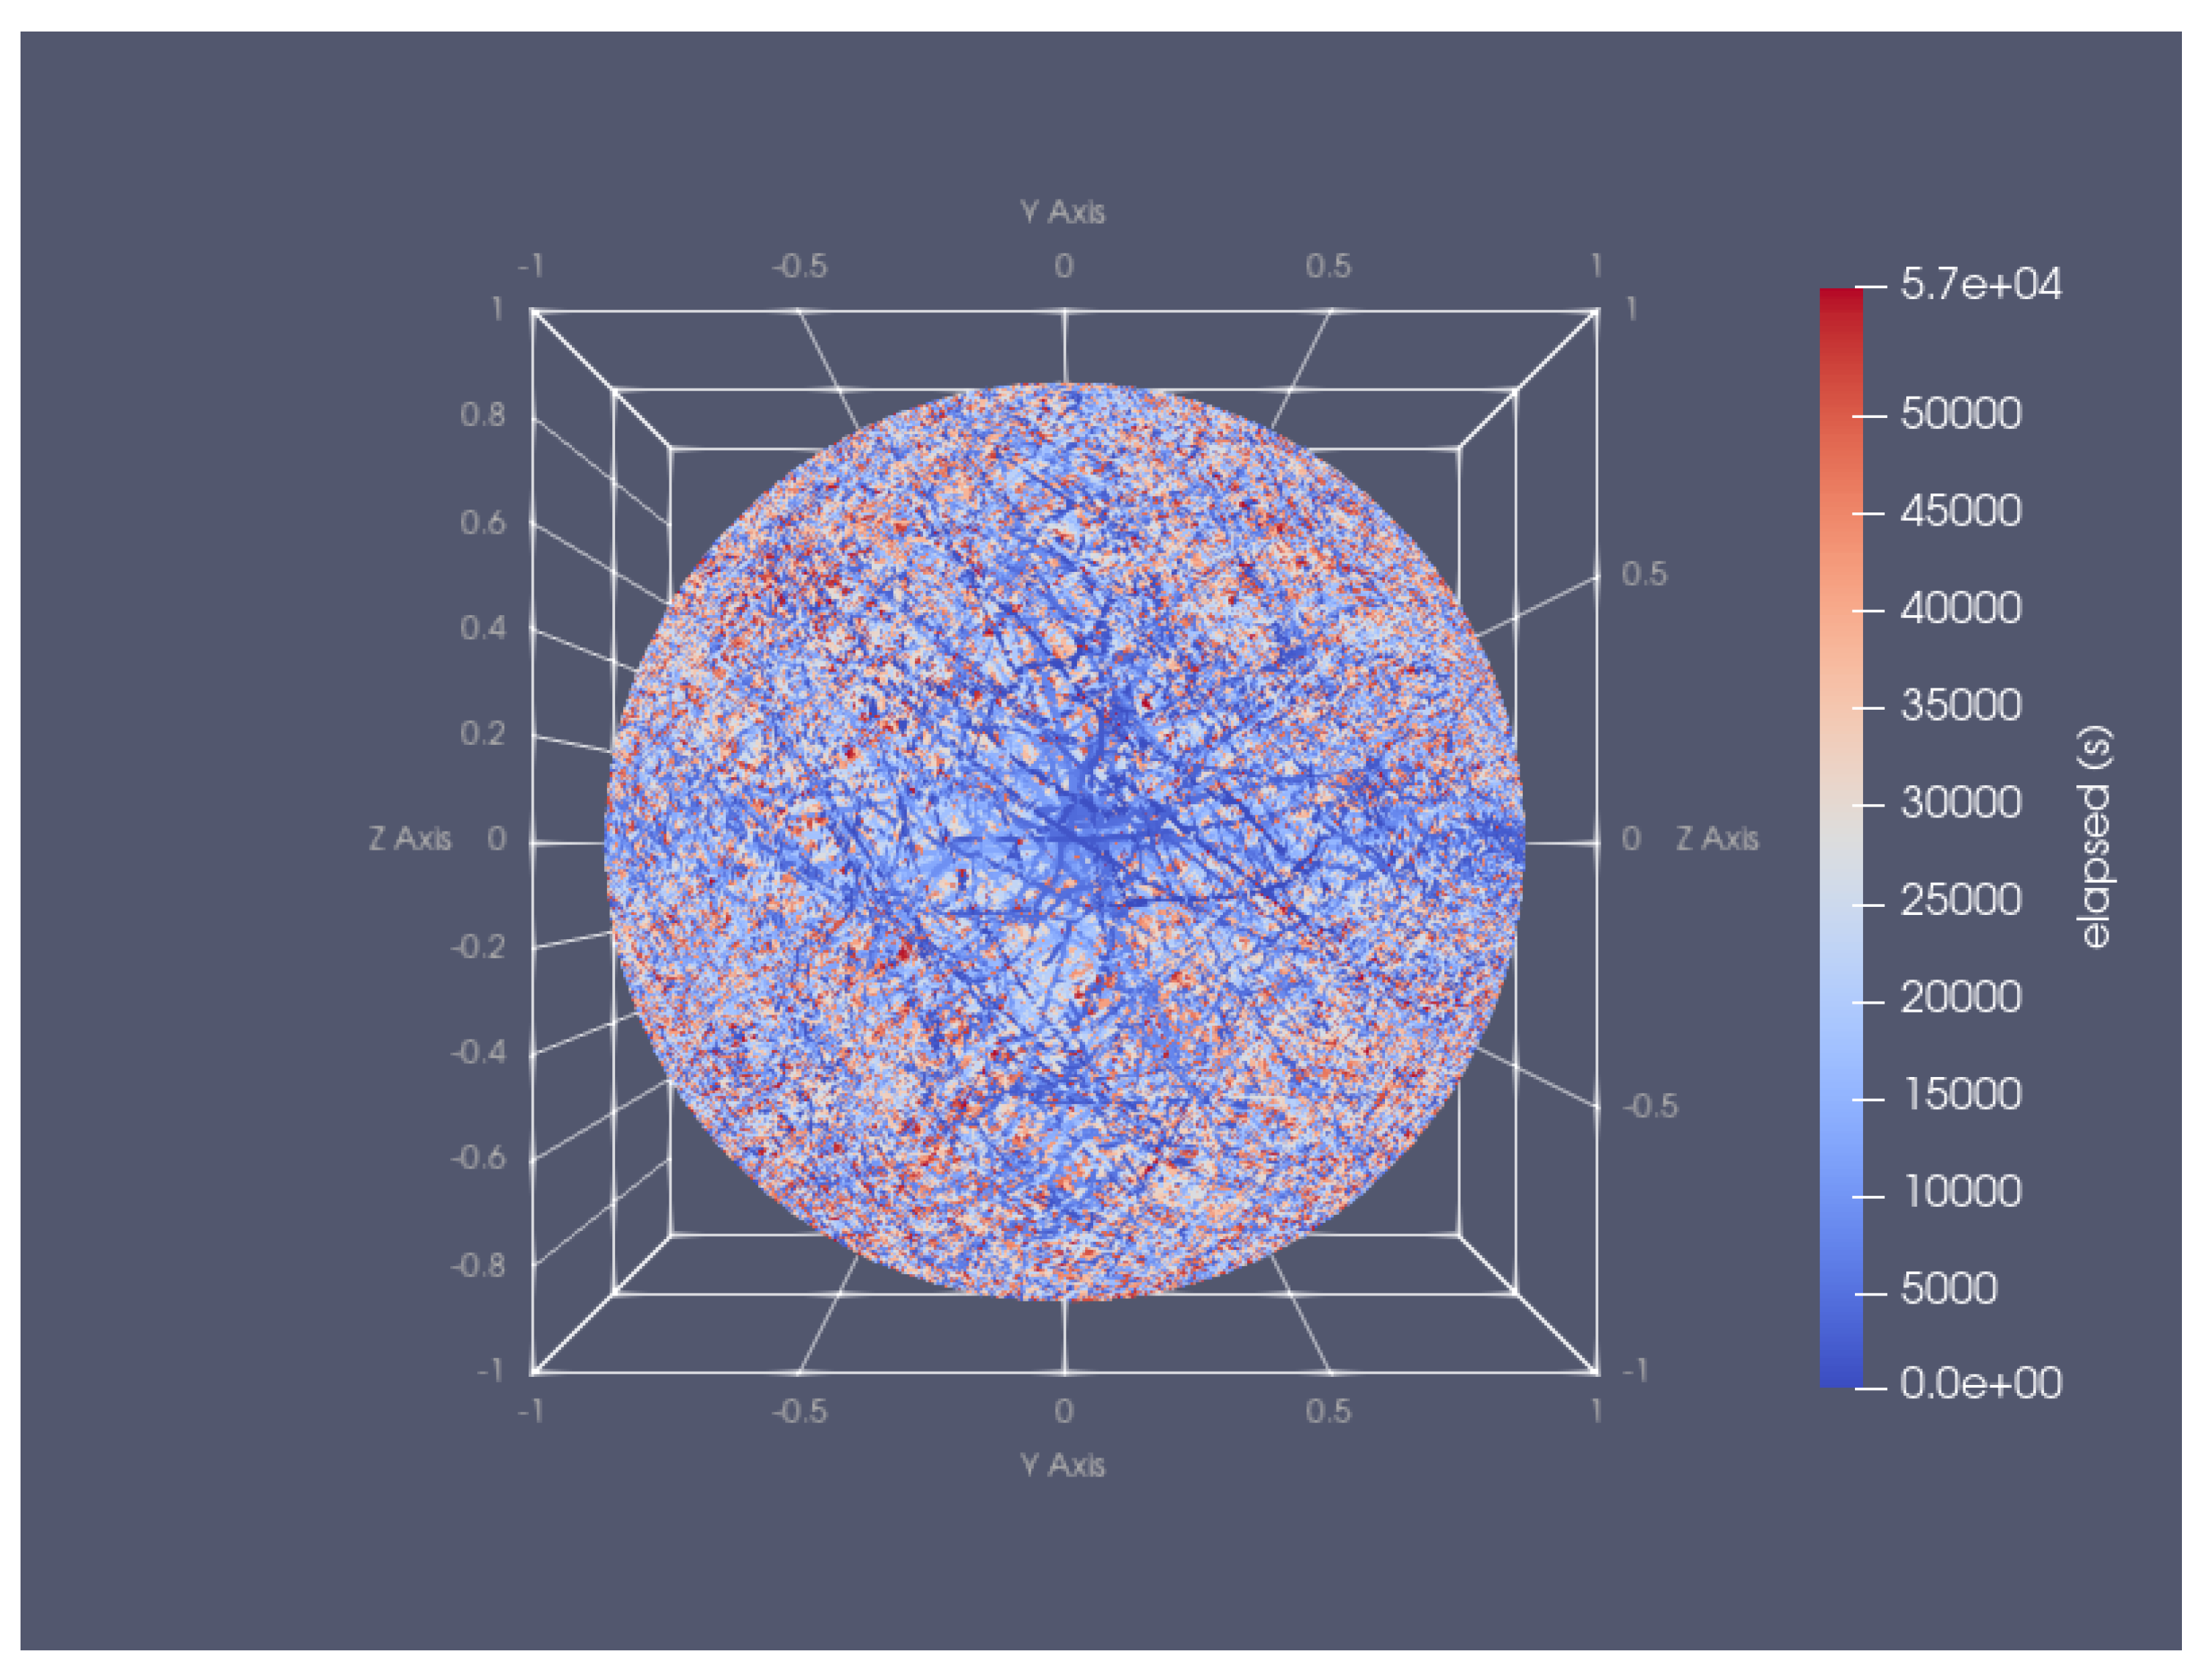
2.3. Gravity Vector Tip Dispersion and taSMG

As an upgraded RPM, the proposed model requires comparison with existing ones. The first step was to check the distribution of the gravity values in three dimensions in accordance with previous findings [12,16,29]. Using an acceleration sensor (MBIENTLAB INC, San Francisco, CA, USA), we measured the acceleration (by means of g = 9.81 m/s2) produced by different randomly selected working parameters. The data from the sensor are presented in Table 1 and Table 2, and in Figure A1, Figure A2, Figure A3, Figure A4 and Figure A5 (see Appendix A).
The motion trajectory of the gravity vector tip (at 3.5 cm distance from the center) is displayed on an imaginary sphere for 15 min, 1 h and 2 h of rotation as presented in Figure A1. The chosen fixed speeds for this set of data are 0.0524 [rad/s] for the inner frame and 0.106 [rad/s] for the outer one. The motion trajectory of the gravity vector tip is shown in Figure A2 using the same conditions but with fixed velocities of 0.1575 [rad/s] for the inner frame and 0.2615 [rad/s] for the outer one. In both figures, the three axes present the acceleration in g.
The data in Figure A2 suggest more uniformly distributed acceleration than the one in Figure A1, which means a better-simulated microgravity. After two hours of rotation, the randomization of the trajectory was better due to the uniform coverage of the surface. The reason for that lies in the ratio of the angular velocities (5). As described in the previous section, the closer γ is to an irrational number, the greater the chance for reproducing microgravity states. The data obtained from this study agree with the data in the cited papers [16,29,36].
For objectivity, a comparison should be made between the same parameter sets in 3D mode and same range in random mode with an object in the geometrical center of the machine and our proposed design. Figure A3 presents such a comparison for 3D mode. The motion trajectory of the gravity vector tip in fixed speeds of the inner frame 0.1575 [rad/s] and of the outer one 0.2615 [rad/s] at a distance of 3.5 cm from the center (Figure A3a) and of the inner frame between 0.1575 [rad/s] and of the outer one 0.2615 [rad/s] at a distance of 0 cm (Figure A3b). The data clearly show that there is no major difference in the distribution of the gravity vector between the two cases. Furthermore, in Table 1, a direct comparison of the parameters and the time-averaged value of acceleration (in g) shows that there is a small difference between the two models. The data suggest that residual accelerations are minimal in the case of an object at a distance of 3.5 cm from the center.
Figure A4 presents a comparison between the motion trajectory of the gravity vector tip in a random mode for the two positions. There is a very slight change in the gravity dispersion between the center of the RPM and at a distance of 3.5 cm for the same amount of simulated microgravity (Table 2). Again, the data suggest minimal residual accelerations on an object at a distance of 3.5 cm. Furthermore, Figure A5 shows improvement of the time evolution of the gravity vector tip dispersion. The data obtained from this study agree with the ones obtained by other authors in this field [12,29] and suggest its operation is similar as previously reported RPMs.
Regarding ‘critical’ reviews that consider the validity of the application of RPM, the machine is a limited technical model for reproducing ground-based microgravity conditions [18,36]. Our experiments have shown the following particularity of its application. In terms of geometrical characteristics, there are no crucial variations between our results and those with object in the center. It is worth noting that such a model does not reject effects from the movement of cellular and tissue fluids, and the obtained results should be carefully interpreted and compared with data from real microgravity or other analogs at best [36].
In terms of rotational parameters, as shown in Table 1, Figure A1 and Figure A2, it is clear that not all combinations from the 3D mode are applicable for simulating microgravity conditions. The second and the third row of Table 1 in both models are with small values of g. However, only the data in the second row could be evaluated as close as possible to microgravity. The first and the fourth rows show an overall decrease in the gravitational force acting on the object over time but far from the microgravity values. Nevertheless, this indicates the ability to reproduce hypogravity—a powerful tool for future experiments to duplicate biological effects on an organism level caused by decreased gravity conditions. For example, by making the necessary calibration of the setup parameters, our machine can recreate such gravity states as on Mars ( g M a r s = 0.379 g) or on the Moon ( g M o o n = 0.165 g). This information can give the scientific community a better chance of predicting hypogravity-induced changes.

3. Application in a Laboratory Experiment with Rats

In this section, we apply our RPM in laboratory experiments with three different groups of rats. A posteriori stress tests are conducted to estimate and compare the level of stress between the groups. To our best knowledge, no such experiments have been attempted with an RPM animal model. For this reason, we are discussing our results with studies containing similar animal-modeled microgravity analogs.

3.1. Description of the Experiment

To assess the applicability of the design, stress tests were performed on 18 adult male Wistar rats (mass range between 180–220 g). All animals used for the experiment were housed according to the normative documents of the European Union for the usage of experimental animals.
The experimental subjects were randomly divided into three even groups of six members each—experimental group (RPM), stress control (RPM-K), and absolute control (K). All animals had a 7-day acclimatization period at the experimental premises before the start. After this period, the RPM group was exposed to simulated microgravity for 20 h/day (from 1 p.m. to 9 a.m. on the next day with access only to food during the experiment) over seven consecutive days. RPM 3D mode (velocity of the inner frame—0.1575 [rad/s] and of the outer—0.2615 [rad/s]) was used to recreate of microgravity effects. The animals were placed into the chambers. Chambers were then closed using a plastic cork with an opening in the center. The rats’ tails were positioned outside the chambers through the cork opening. The tails were then taped with band aid on the outer part of the chamber (nontraumatic ‘U’ position) to avoid injuries by the rotational parts of the machine.
At the same time, the RPM-K group was exposed to the same conditions as RPM group but without the rotation from the machine. Identical setup and cylinders were used for this group. Meanwhile, the K group animals were housed in standard conditions with access only to food during the period from 1 p.m. to 9 a.m. on the next day. For the remaining 4 h, all groups were returned to their housing cages with access to food and water. During the seven days of the experiment, the mass of all animals was measured every day before the start of the session (1 p.m.).
The tests used for a social trait are social interaction and elevated plus maze. Both experiments were conducted on the 8th day. First was the social interactions experiment. It was performed in an open plastic box with dimensions 60 cm width, 60 cm length and 40 cm height. Each rat was left for 5 min in the box for acclimatization before the experiment. After that, another rat (unfamiliar to all three groups) was added. To evaluate the social interaction, we measured the time of interactivity (mainly sniffing) in seconds for a period of 5 min.
After one hour of rest, the experiment continued with the elevated plus maze with two open and two closed arms. Each rat was placed in the middle of the maze and tested for 5 min. During that period, three parameters were recorded: time spent in open spaces, time spent in closed spaces, and number of exposures to open spaces.
The results from all tests were statistically processed (ANOVA) and presented by their mean value ± standard deviation.

3.2. Weight and Stress Evaluation

Table 3 contains the mass of the experimental subjects. It is presented in percentages compared with the mass from the first day. There was no significant difference between the three groups on the second day. A significant difference ( p < 0.05 ) between RPM and K groups is observed on the last three days. Similarly, a significant difference ( p < 0.05 ) between RPM-K and K groups was found on days three and four. No significant change between the RPM and RPM-K groups in the tested period was found.Results show that the mass of the animals has decreased on days two and three. Later, the subjects either began to restore or started to gain mass.
The registered differences in body weight between RPM and RPM-K groups on the one side, and K group on the other, can be explained by activation of central neuronal mechanisms, independent of stress-induced hypophagia [37].
Table 4 shows that in the social interaction test, we get 12.72 ± 2.3 seconds for the K group rats. The data for the other two groups showed a statistically significant increase in their time compared with the control group (K) ( p < 0.05 ) . However, no significant difference between RPM and RPM-K groups was found.
In the elevated plus maze, the rats in the RPM group have significantly increased their stay in open spaces ( 170.25 ± 27.2 s, p < 0.01 ) and have decreased the stay in closed ones ( 129.75 ± 27.2 s, p < 0.01 ) compared to RPM-K and K groups (see Table 5). In terms of the number of entries in the open arms, K and RPM-K groups have 1.5 ± 0.5 times each, while the RPM group showed a statistically significant increase ( 4.25 ± 0.75 ; p < 0.01 ) compared to RPM-K. We obtained similar results from the closed arms. The RPM group showed statistically increased number of entries compared to both K ( p < 0.01 ) and RPM-K groups ( p < 0.001 ) (Table 5).
The decreased time of social interaction is a sign of anxious behavior, while the increased one—for anxiolytic effect [38]. The increase in time spent in open spaces of the elevated maze and the increased number of entries inside them correlates with the anxiolytic effect [39]. The results from our social interaction experiments demonstrate that RPM–K and RPM groups are prone to an anxiolytic effect. In the elevated maze, only RPM group is prone to the last. The collected data suggest that RPM group has decreased anxiety compared to the control groups.
Similar results have been obtained by Kokhan et al. [40]. They found an increased amount of time from the suspended group compared with their control one in the open arms of the maze. However, they did not find any statistical differences in the number of entries like in our data. In another study, mice that received hindlimb unloading spent significantly more time in the exposed portion of an elevated maze [41]. This suggests that exposure to simulated microgravity may affect exploration and increase risk-taking behaviors. A relevant study demonstrated changes in risk-taking behavior in a human head tilt model of microgravity [42]. In a 7-day anti-orthostatic hanging of rats, Lebedeva-Georgievskaya et al. [43] demonstrated an increased time in open arms of the elevated maze. It is worth mentioning that some research teams obtained the opposite results. For example, a study from 2017 showed that a 14-day hindlimb unloading procedure caused anxiety states and significantly decreased spontaneous activity in mice [44]. Another one with space-flown mice for 30 days on a Bion-M1 satellite showed reduced ambulatory/exploratory activity and higher anxiety [45]. Those contradictory results have been explained by Lebedeva-Georgievskaya et al [43]. They suggest that the duration of the simulated microgravity experiments has an important role. The main effects of anxiety occur at different stages of the general adaptation syndrome, and the period of exposure may affects the concentration of monoamines. So, simulated microgravity lasting less than 14 days may decrease the level of anxiety which corresponds with our data.

4. Conclusions

A new modification of RPM in both 3D clinostat mode and random mode used for in vivo experiments has been proposed. The main novelty of our design is the ability for simultaneous operation with up to four experimental animals placed at a distance from the geometric center of the rotation. In order to validate our machine, we have compared it with reported traditional ones. Furthermore, we have examined taSMG at the center of the device and at a distance of 3.5 cm from it. The results showed no crucial deviations in gravity dispersion and its time-averaged value in all sets of parameters between our machine and the traditional model. Also, there were no crucial differences in the gravity dispersion between the two used positions. To show the applicability of our machine, we have conducted a social trait tests with experimental animals. To our best knowledge, no such experiments with RPM were attempted so far. The experiments showed that our machine provides a relatively safe test environment in which the psychophysical state of the subjects remains close to their baseline. The social trait results suggest that the group exposed to our device did not experience increase in anxiety. Considering all of the above, we assume that the usage of our model will be relevant for reproducing hypogravity conditions in experiments using commercial RPM.

Author Contributions

V.V.Y.—writing the draft, data acquisition, data analysis, review of the draft; J.M.—data acquisition, data analysis, review of the draft; V.T.—writing the draft, data analysis, conception of the experiment, review and editing; S.I.I.—writing the draft and concept of the theoretical description; data analysis, review and editing. All authors have read and agreed to the published version of the manuscript.

Funding

The experimental program was supported by FOT Ltd.—Bulgaria.

Institutional Review Board Statement

The project is approved by the Ethical Committee of the Bulgarian food safety agency (BFSA, https://bfsa.egov.bg/wps/portal/bfsa-web-en/home) with a license #327, accepted with Protocol 26/09.12.2021. The authors confirm that all experiments were performed in accordance with the relevant guidelines and regulations of the European Union.

Informed Consent Statement

Not applicable.

Data Availability Statement

Not applicable.

Acknowledgments

This paper has been prepared as part of the participation in National Scientific Program ‘Young researchers and post-doc students’ 2021 for V. Yotov, Medical University of Plovdiv. Our machine has been developed in collaboration with the Bulgarian Academy of Sciences (the Engineering laboratory of the Institute in Neurobiology).

Conflicts of Interest

The authors declare no conflict of interest in preparing this paper.The funding company is not involved in the construction of the machine, the experimental design and the preparation of the paper.

Appendix A

Figure A1. Motion trajectory of the gravity vector tip displayed on imaginary sphere (in 3D mode) for (a) 15 min of rotation; (b) 1 h of rotation; (c) 2 h of rotation.
Inventions 07 00085 g0a1aInventions 07 00085 g0a1b
Figure A2. Motion trajectory of the gravity vector tip at a distances of 3.5 cm from the center displayed on imaginary sphere (in 3D mode) for (a) 15 min of rotation; (b) 1 h of rotation; (c) 2 h of rotation.
Inventions 07 00085 g0a2
Figure A3. Motion trajectory of the gravity vector tip with ω ϕ = 0.157 [rads/s] and ω φ = 0.262 [rads/s] (a) at a distance of 3.5 cm from the center and (b) at a distance of 0 cm.
Inventions 07 00085 g0a3
Figure A4. Motion trajectory of the gravity vector tip in random mode ( ω ϕ and ω φ are randomly selected within range between 0.0524 [rads/s] and 0.733 [rads/s] and periods of rotation of both frames are randomly selected from 1 to 10 periods) (a) at a distance of 0 cm from the center and (b) at a distance of 3.5 cm.
Inventions 07 00085 g0a4
Figure A5. Motion trajectory of the gravity vector tip in random mode ( ω ϕ and ω φ are randomly selected from range of 0.0524 [rads/s] to 0.733 [rads/s] and periods of rotation of both frames are randomly selected from 1 to 10 periods) for time of 15 h.
Inventions 07 00085 g0a5

References

  1. Petrov, V.M. Problems and conception of ensuring radiation safety during Mars missions. Adv. Space Res. 2004, 34, 1451–1454. [Google Scholar] [CrossRef] [PubMed]
  2. Baevsky, R.; Moser, M.; Nikulina, G.; Polyakov, V.V.; Funtova, I.; Chernikova, A.G. Autonomic regulation of circulation and cardiac contractility during a 14-month space flight. Acta Astronaut. 1998, 42, 159–173. [Google Scholar] [CrossRef]
  3. Fitts, R.H.; Trappe, S.W.; Costill, D.L.; Gallagher, P.M.; Creer, A.C.; Colloton, P.A.; Peters, J.R.; Romatowski, J.G.; Bain, J.L.; Riley, D.A. Prolonged space flight-induced alterations in the structure and function of human skeletalmuscle fibres. J. Physiol. 2010, 588, 3567–3592. [Google Scholar] [CrossRef] [PubMed]
  4. Riley, D.A.; Bain, J.L.W.; Thompson, J.L.; Fitts, R.H.; Widrick, J.J.; Trappe, S.W.; Trappe, T.A.; Costill, D.L. Decreased thin filament density and length in human atrophic soleus muscle fibers after spaceflight. J. Appl. Physiol. 2000, 88, 567–572. [Google Scholar] [CrossRef]
  5. Trappe, S.W.; Trappe, T.; Lee, G.A.; Widrick, D.J.J.; Costill, L.; Fitts, R.H. Comparison of a space shuttle flight (STS-78) and bed rest on human muscle function. J. Appl. Physiol. 2001, 91, 57–64. [Google Scholar] [CrossRef]
  6. Ronca, A.E.; Moyer, E.L.; Talyansky, Y.; Lowe, M.; Padmanabhan, S.; Choi, S.; Gong, C.; Cadena, S.M.; Stodieck, L.; Globus, R.K. Behavior of mice aboard the International Space Station. Sci. Rep. 2019, 9, 4717. [Google Scholar] [CrossRef]
  7. Temple, M.; Kosik, K.; Steward, O. Spatial learning and memory is preserved in rats after early development in a microgravity environment. Neurobiol. Learn. Mem. 2002, 78, 199–216. [Google Scholar] [CrossRef]
  8. Orr, S.; Weigand, R.; Adams, T.; Raychev, R.; Griko, Y. Environmental Enrichment in the ISS Rodent Habitat Hardware System. Int. J. Biosci. Med. 2017, 1, 6. [Google Scholar] [CrossRef]
  9. Zhang, Y.; Wang, Q.; Chen, H.; Liu, X.; Lv, K.; Wang, T.; Wang, Y.; Ji, G.; Cao, H.; Kan, G.; et al. Involvement of Cholinergic Dysfunction and Oxidative Damage in the Effects of Simulated Weightlessness on Learning and Memory in Rats. BioMed Res. Intl. 2018, 2018, 2547532. [Google Scholar] [CrossRef]
  10. Pani, G.; Samari, N.; Quintens, R.; de Saint-Georges, L.; Meloni, M.; Baatout, S.; Van Oostveldt, P.; Benotmane, M. Morphological and Physiological Changes in Mature In Vitro Neuronal Networks towards Exposure to Short-, Middle- or Long-Term Simulated Microgravity. PLoS ONE 2013, 8, e73857. [Google Scholar] [CrossRef] [Green Version]
  11. Bevelacqua, J.J.; Welsh, J.; Mortazavi, S. Comment on “Dexamethasone Inhibits Spheroid Formation of Thyroid Cancer Cells Exposed to Simulated Microgravity”. Cells 2020, 9, 1738. [Google Scholar] [CrossRef] [PubMed]
  12. van Loon, J.J.W.A. Some history and use of the random positioning machine, RPM, in gravity related research. Adv. Space Res. 2007, 39, 1161–1165. [Google Scholar] [CrossRef]
  13. Scano, A. Effeti di una variazione continua del campo gravitazionale sullo svoluppo ed accrescimento di Lathyrus Odororatus. In Proceedings of the Communication at 6th International and 12th European Congress on Aeronautical and Space Medicine, Rome, Italy, October 1963. [Google Scholar]
  14. Murakami, S.; Yamada, M. Architecture of statocytes and chloroplasts under the microgravity environment. Jap. Soc. Biol. Sci. Space 1988, 2, 301. [Google Scholar]
  15. Hoson, T.; Kamisaka, S.; Masuda, Y.; Yamashita, M. Changes in plant growth process under microgravity conditions simulated by a three-dimensional clinostat. Bot. Mag. Tokyo 1992, 105, 53–70. [Google Scholar] [CrossRef]
  16. Borst, A.; van Loon, J. Technology and developments for the Random Positioning Machine, RPM. Microgravity Sci. Technol. 2009, 21, 287–292. [Google Scholar] [CrossRef]
  17. Hemmersbach, R.; Strauch, S.; Seibt, D.; Schuber, M. Comparative studies on gravisensitive protists on ground (2D and 3D clinostats) and in microgravity. Microgravity Sci. Technol. 2006, 18, 257–259. [Google Scholar] [CrossRef]
  18. Wuest, S.L.; Richard, S.; Kopp, S.; Grimm, D.; Egli, M. Simulated Microgravity: Critical Review on the Use of Random Positioning Machines for Mammalian Cell Culture. BioMed Res. Int. 2015, 2015, 971474. [Google Scholar] [CrossRef]
  19. Mogil, J.S. The translatability of pain across species. Phil. Trans. R. Soc. B 2019, 374, 20190286. [Google Scholar] [CrossRef]
  20. Schweinfurth, M.K. The social life of Norway rats (Rattus norvegicus). eLife 2020, 9, 54020. [Google Scholar] [CrossRef]
  21. Wrighten, S.A.; Hall, C.R. Support for Altruistic Behavior in Rats. Open J. Soc. Sci. 2016, 4, 93–102. [Google Scholar] [CrossRef]
  22. Swanson, H.H.; Schuster, R. Cooperative social coordination and aggression in male laboratory rats: Effects of housing and testosterone. Horm. Behav. 1987, 21, 310–330. [Google Scholar] [CrossRef]
  23. Fox, M.D.; Corbetta, M.; Snyder, A.Z.; Vincent, J.L.; Raichle, M.E. Spontaneous neuronal activity distinguishes human dorsal and ventral attention systems. Proc. Natl. Acad. Sci. USA 2006, 103, 10046–10051. [Google Scholar] [CrossRef] [PubMed]
  24. Girbovan, C.; Plamondon, H. Environmental enrichment in female rodents: Considerations in the effects on behavior and biochemical markers. Behav. Brain Res. 2013, 253, 178–190. [Google Scholar] [CrossRef] [PubMed]
  25. Lahvis, G.P. Point of View: Unbridle biomedical research from the laboratory cage. eLife 2017, 6, 27438. [Google Scholar] [CrossRef]
  26. Laviola, G.; Hannan, A.J.; Macrì, S.; Solinas, M.; Jaber, M. Effects of enriched environment on animal models of neurodegenerative diseases and psychiatric disorders. Neurobiol. Dis. 2008, 31, 159–168. [Google Scholar] [CrossRef]
  27. Simpson, J.; Kelly, J.P. The impact of environmental enrichment in laboratory rats—Behavioural and neurochemical aspects. Behav. Brain Res. 2011, 222, 246–264. [Google Scholar] [CrossRef]
  28. Sengupta, P. The Laboratory Rat: Relating Its Age with Human’s. Int. J. Prev. Med. 2013, 4, 624–630. [Google Scholar]
  29. Kim, T.Y. Theoretical study on microgravity and hypogravity simulated by random positioning machine. Acta Astronaut. 2020, 177, 684–696. [Google Scholar] [CrossRef]
  30. Russomano, T.; Cardoso, R.; Falcao, F.; Dalmarco, G.; Santos, C.D.; Santos, L.D.; de Azevedo, D.; Santos, M.D.; Martinelli, L.; Motta, J.; et al. Development and Validation of a 3 D Clinostat for the Study of Cells during Microgravity Simulation. In Proceedings of the IEEE Engineering in Medicine and Biology 27th Annual Conference, Shanghai, China, 17–18 January 2006; pp. 564–566. [Google Scholar] [CrossRef]
  31. Kim, Y.; Jeong, A.; Kim, M.; Lee, C.; Ye, S.; Kim, S. Time-averaged simulated microgravity (taSMG) inhibits proliferation of lymphoma cells, L-540 and HDLM-2, using a 3D clinostat. Biomed. Eng. Online 2017, 16, 48. [Google Scholar] [CrossRef]
  32. Peana, A.; Chessa, M.; Deligios, M.; Cesarone, C.; Meloni, M.; Pippia, P. Effects of simulated microgravity conditions on carrageenin-induced oedema in rat. J. Gravit. Physiol. 2002, 9, 299–300. [Google Scholar]
  33. Saba, A.; Pani, G.; Galleri, G.; Meloni, M.; Pippia, P. “In vivo” physiological experiments in simulated microgravity conditions on rat bon marrow cells mineralization. J. Biol. Res. 2009, 82, 22–24. [Google Scholar] [CrossRef]
  34. Ayachit, U. The ParaView Guide: A Parallel Visualization Application; Kitware: Clifton Park, NY, USA, 2015. [Google Scholar]
  35. van Loon, J.J.W.A.; Folgering, E.H.; Bouten, C.V.; Veldhuijzen, J.P.; Smit, T.H. Inertial shear forces and the use of centrifuges in gravity research. What is the proper control? J. Biomech. Eng. 2003, 125, 342–346. [Google Scholar] [CrossRef] [PubMed]
  36. Ferranti, F.; Del Bianco, M.; Pacelli, C. Advantages and Limitations of Current Microgravity Platforms for Space Biology Research. Appl. Sci. 2021, 11, 68. [Google Scholar] [CrossRef]
  37. Harris, R.; Mitchell, T.; Simpson, J.; Redmann, S., Jr.; Youngblood, B.; Ryan, D. Weight loss in rats exposed to repeated acute restraint stress is independent of energy or leptin status. Am. J. Physiol. Regul. Integr. Comp. Physiol. 2002, 82, 77–88. [Google Scholar] [CrossRef]
  38. Koob, G.F.; Zimmer, A. Chapter 9—Animal models of psychiatric disorders. In Neurobiology of Psychiatric Disorders; Aminoff, M.J., Boller, F., Swaab, D.F., Eds.; Handbook of Clinical Neurology; Elsevier: Amsterdam, The Netherlands, 2012; Volume 106, pp. 137–166. [Google Scholar] [CrossRef]
  39. Pellow, S.; Chopin, P.; File, S.E.; Briley, M. Validation of open:closed arm entries in an elevated plus-maze as a measure of anxiety in the rat. J. Neurosci. Methods 1985, 14, 149–167. [Google Scholar] [CrossRef]
  40. Kokhan, V.; Matveeva, M.; Bazyan, A.; Kudrin, V.; Mukhametov, A.; Shtemberg, A. Combined effects of antiorthostatic suspension and ionizing radiation on the behaviour and neurotransmitters changes in different brain structures of rats. Behav. Brain Res. 2017, 320, 473–483. [Google Scholar] [CrossRef]
  41. Bellone, J.A.; Gifford, P.S.; Nishiyama, N.C.; Hartman, R.E.; Mao, X.W. Long-term effects of simulated microgravity and/or chronic exposure to low-dose gamma radiation on behavior and blood–brain barrier integrity. NPJ Microgravity 2016, 2, 16019. [Google Scholar] [CrossRef]
  42. Rao, L.; Zhou, Y.; Liang, Z.; Rao, H.; Zheng, R.; Sun, Y.; Tan, C.; Xiao, Y.; Tian, Z.; Chen, X.; et al. Decreasing ventromedial prefrontal cortex deactivation in risky decision making after simulated microgravity: Effects of −6B head-down tilt bed rest. Front. Behav. Neurosci. 2014, 8, 187. [Google Scholar] [CrossRef]
  43. Lebedeva-Georgievskaya, K.B.; Kokhan, V.S.; Shurtakova, A.K.; Perevezentsev, A.A.; Kudrin, V.S.; Shtemberg, A.S.; Bazyan, A.S. The Neurobiological Effects of the Combined Impact of Anti-Orthostatic Hanging and Different Ionizing Irradiations. Neurochem. J. 2019, 13, 302–311. [Google Scholar] [CrossRef]
  44. Shang, X.; Xu, B.; Li, Q.; Zhai, B.; Xu, X.; Zhang, T. Neural oscillations as a bridge between glutamatergic system and emotional behaviors in simulated microgravity-induced mice. Behav. Brain Res. 2017, 317, 286–291. [Google Scholar] [CrossRef]
  45. Andreev-Andrievskiy, A.; Dolgov, O.; Alberts, J.; Popova, A.; Lagereva, E.; Anokhin, K.; Vinogradova, O. Mice display learning and behavioral deficits after a 30-day spaceflight on Bion-M1 satellite. Behav. Brain Res. 2022, 419, 113682. [Google Scholar] [CrossRef] [PubMed]
Figure 1. Images of the RPM: (a) The assembled machine; (b) The design of the chambers for the animals.
Inventions 07 00085 g001
Figure 2. The connection between the coordinate systems and the RPM.
Inventions 07 00085 g002
Table 1. Rotational parameters in 3D mode.
Distance from the Center
[cm]
ω ϕ (Inner Frame)
[rad/s]
ω φ (Outer Frame)
[rad/s]
γ taSMG
[g]
00.05240.10600.4940.273
00.15750.26150.6020.0033
00.20920.15811.3230.0464
00.21110.211110.2713
3.50.05240.10600.5050.211
3.50.15750.26150.5920.0050
3.50.20920.15811.3460.0473
3.50.21110.211110.2855
Table 2. Rotational parameters in random mode.
Distance from the Center
[cm]
ω ϕ (Inner Frame)
[rad/s]
ω φ (Outer Frame)
[rad/s]
Periods of the FramestaSMG
[g]
00.0524 to 0.7330.0524 to 0.7331 to 100.0018
3.50.0524 to 0.7330.0524 to 0.7331 to 100.0027
Table 3. Mass of the animals (in percentages) through the experimental period (mean ± SD).
GroupDay 1Day 2Day 3Day 4Day 5Day 6Day 7
RPM100 90.2 ± 6.7 86.9 ± 6.1 80.8 ± 4.6 74.7 ± 7.2 77.3 ± 8.2 81.3 ± 9.4
RPM-K100 89.9 ± 2.7 86.2 ± 5.5 86.2 ± 8.1 82 ± 9.7 83.9 ± 8.4 87.6 ± 8
K100 94 ± 6.2 94.8 ± 4.4 101 ± 12.8 99.9 ± 12.6 101.4 ± 13.5 104.7 ± 12.9
Table 4. Results from the social interaction experiment (time in seconds is presented by mean ± SD).
GroupRPMRPM-KK
Time [s] 42.5 ± 8.4 44.2 ± 7.2 12.72 ± 2.3
Table 5. Results from the elevated maze experiment (mean of ± SD).
GroupNumber of Entries
To Open Arms
Time in Open Spaces
[s]
Number of Entries
To Closed Arms
Time in Closed Spaces
[s]
RPM 4.25 ± 0.75 170.25 ± 27.2 6.8 ± 0.6 129.75 ± 27.2
RPM-K 1.5 ± 0.5 34.5 ± 2.3 1.75 ± 0.75 265.5 ± 2.3
K 1.5 ± 0.5 23.5 ± 11.5 1.5 ± 0.5 276.5 ± 11.5
Publisher’s Note: MDPI stays neutral with regard to jurisdictional claims in published maps and institutional affiliations.

