1. Introduction
Renewable sources of energy are not a new topic but it remains a controversial one. The 20th century energy system based on fossil fuels created an urgent need to experiment with alternatives leading to a sustainable energy future. Renewables are still far from overtaking fossil fuels in the global energy system; still, their growth is fast and contributes to a nascent and uncertain energy transition with major effects in the field of environment, economy, governance, and society. Renewable energy sources are crucial for long-term efforts to mitigate climate change and are expected to play a vital role in improving the entire planet’s energy security [
1,
2,
3].
According to the European Commission, by 2050, Europe must increase the offshore wind capacities between 230 and 450 GW. So far, Romania is the leader of Southeast Europe in terms of onshore developments, with an installed capacity of 3 GW [
4]. The development of onshore wind farms was achieved mainly in the Dobrogea plateau. In this area are concentrated almost 80% of the existing wind turbines from Romania. The largest onshore wind farm in Europe is the Fantanele–Cogealac, also established in Dobrogea, having an installed capacity of 600 MW [
5].
On contrary, there is still little information on the energetic offshore potential of the Black Sea basin. In their studies [
6] the authors estimated a total potential natural capacity of 94 GW, out of which 22 GW could be installed as fixed turbines and 72 GW from offshore wind farms.
Previous studies based on the Black Sea wave wind conditions indicate that the western part of the sea is more energetic than the eastern sector [
7,
8,
9,
10,
11,
12]. Moreover, Onea and Rusu [
13] affirmed that in terms of the spatial distribution of extreme events, most probable storm conditions occur in the western part, whereas in the eastern sector it is more likely to happen in a relatively short time window. In their work [
7] the authors assessed the largest average power of 7 kW/m in the South Western part of the Black Sea, whereas the average mean wave power in the eastern part is about 3 kW/m, with a maximum of 4 kW/m. In terms of wind speed, the western side records significant seasonal variations, while the eastern area is characterized by more stable conditions [
14,
15]. In their research [
15] the authors have conducted a comparison between average wind speed from coastal stations (4.9 m/s) and satellites data (6 m/s). In [
16], based on the wind wave conditions evaluated over 50 years (1958–2007), it is concluded that the wind and wave climate of the western Black Sea shelf manifests large spatial and seasonal variability. The authors stated that wind speed exceeded 40 m/s in the open sea and 25 m/s near shore. The analysis made in [
17,
18] indicates that the Romanian coastal environment is more energetic during the winter season, with an average wind speed at 80 m of about 9.7 m/s and a power density of 870 W/m
2. Myslenkov et al. [
19] pointed out that during summer months low quality of wind and wave were observed due to their low and weak speeds. In their work [
20], Rusu, Raileanu and Onea obtained from the Gloria platform values of the wind fields at 10 m height from 6 m/s to 7 m/s, covering a time period from 1987 to 2009. Diaconita, Rusu, and Andrei have concluded in their study [
21] that the mean wind speed at the height of 10 m was 6.7 m/s. Based on the literature review mentioned above, there is an increasing interest in marine renewable project development based on the wind and wave resources located in the northwestern part of the Black Sea.
In this context, the purpose of the present study is to contribute to the characterization of the wind climate along the western part of the Black Sea Basin over a period of 6 years (2015–2020) and to estimate ideal areas for exploiting this resource. Consequently, this study will focus on the wind parameters evolution based on the measurements provided by the 2 autonomous marine monitoring stations, part of the regional security system EMSO-EUXINUS. The present research can be considered as a first step for future renewable energy projects since there is significant growing interest from the Romanian authorities in energy transition towards renewables.
2. Materials and Methods
2.1. Target Area
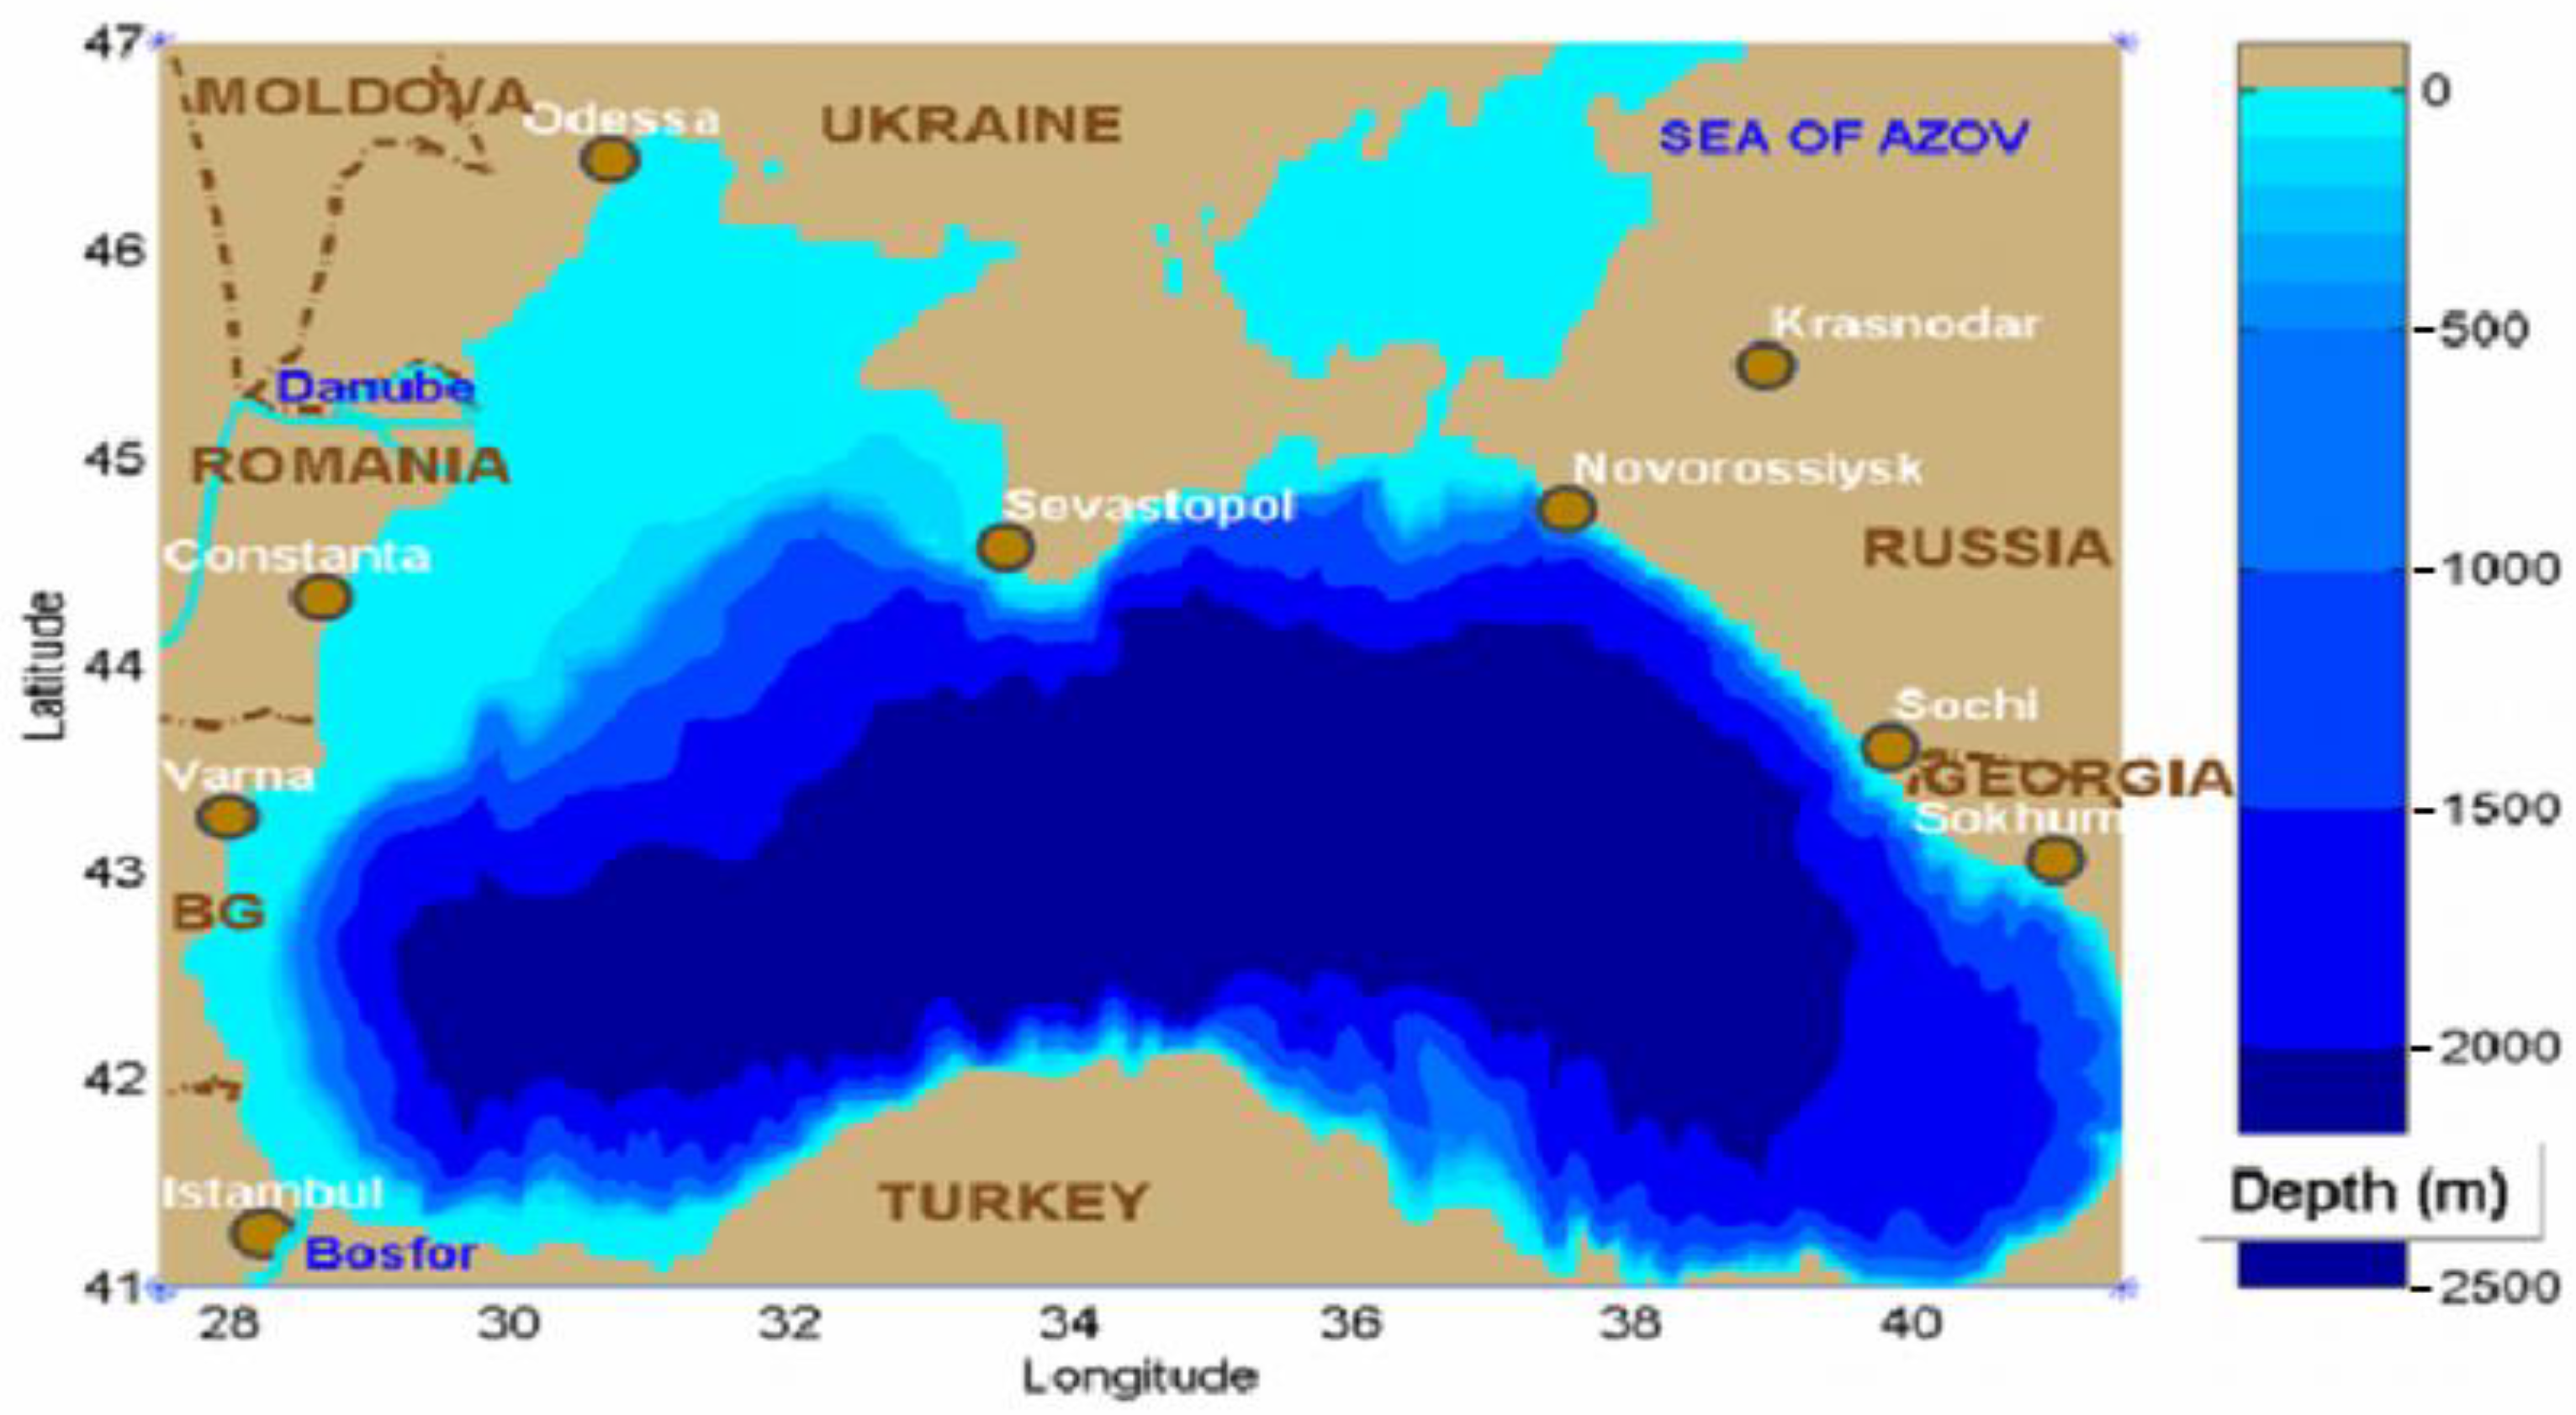
The Black Sea represents an inland sea situated between Europe, Anatolia, and Caucasus, covering an area of 422,000 km
2. The basin is considered a semi-enclosed sea, connected to the Mediterranean Sea through the Straits of Dardanelles and Bosporus and to the Sea of Azov through the Kerch Strait. The sea is defined by an irregular shape being divided between Romania, Ukraine, Russia, Georgia, Turkey, and Bulgaria. The average water depth is about 1240 m, while a maximum of 2210 m is observed offshore. In terms of bathymetry, wide shelf area can be noticed that occupies up to 25% of the total seafloor area and, on average, being restricted to sea depths of 100–200 m and a width of 200 km. The remaining area is associated with the continental slope and the abyssal plain, where depths below 2000 m can be found. The configuration of the bathymetric line, the presence of depressions and canyons, has an important influence on the distribution of water masses, direction and speed of currents. The bathymetric chart of the Black Sea can be observed in
Figure 1 [
22,
23,
24].
The wind and wave climate are determined by the geographical position and the landscape configuration, which have temperate-continental characteristics. During winter months frequent storms and strong N-NE winds are accompanied by waves 2–4 m high, but in summer wave heights are generally less than 1 m. The tide is almost imperceptible, for it reaches scarcely 10 cm in height [
23,
24].
One of the greatest particularities of the Black Sea is the inability of the water layers to mix. The hydro-chemical configuration of the sea is primarily influenced by the fluvial inputs and the basin topography, which result in a strongly stratified vertical structure and a positive water balance. The first layer, located on the sea surface over 50 m depth, is generally cooler, less salty, and less dense than the deeper waters, as it is fed by large fluvial systems. The second area, known as a cold layer, is a sub-surface water mass located at 50 to 180 m depth [
23,
24].
The salinity of the Black Sea is determined by the balance between the fresh water and water exchange through the Bosporus Strait. At the surface water of the Black Sea, an average salinity of 16–18 PPT (two times less than the salinity of the World Ocean surface waters) was recorded. The salinity increases to 21 to 22.5 PPT (parts per thousand) at a depth below 120–200 m. This difference is motivated because the water layers do not mix, and high salinity water from Mediterranean origin penetrates into the sea through the Bosporus Strait [
25].
The water temperatures vary depending on the season. In summer the surface water warms to 25 °C, (occasional extremes at the shores of up to 28 °C). In winter in the open sea, it gets to 6–8 °C. The northwestern coast has ice in the winter while the southeastern stays around 9 °C [
26].
The Black Sea is considered a vital connection between Europe and Asia regarding maritime activities. Most of the research effort is focused on the Romanian coastal zone, while the eastern side characteristics are less discussed.
2.2. Wind Dataset
In the present work, we will analyze the wind dataset covering a time period from 2015 to 2020 as provided by the National Institute of Marine Geology and Geoecology—GeoEcoMar.
Romania is represented in the European Multidisciplinary Seafloor and Water Column Observatory-European Research Infrastructure Consortium (EMSO ERIC) through GeoEcoMar. The National Institute provides EMSO ERIC real-time data on the physico-chemical and biological parameters of the water column, at different depths, data on early warning in case of marine hazards, as well as the experience of the personnel involved in the proper functioning of the entire system. The data are provided from the EUXINUS network of marine and coastal observatories (3 offshore and one coastal observatory), part of the Black Sea Security System. EMSO-EUXINUS is a regional security system destined for the Western Black Sea with real-time alerting to marine geo-hazards (e.g., submarine landslides, active fault movements, submarine earthquakes, tsunami waves, etc.). It monitors the characteristics and dynamics of coastal water bodies, including several meteorological parameters. The amount of data is stored within the National Center for Monitoring and Alarming to Marine Natural Hazards, which operates within the Constanta branch of INCD (National Center for Research and Development) GeoEcoMar [
27].
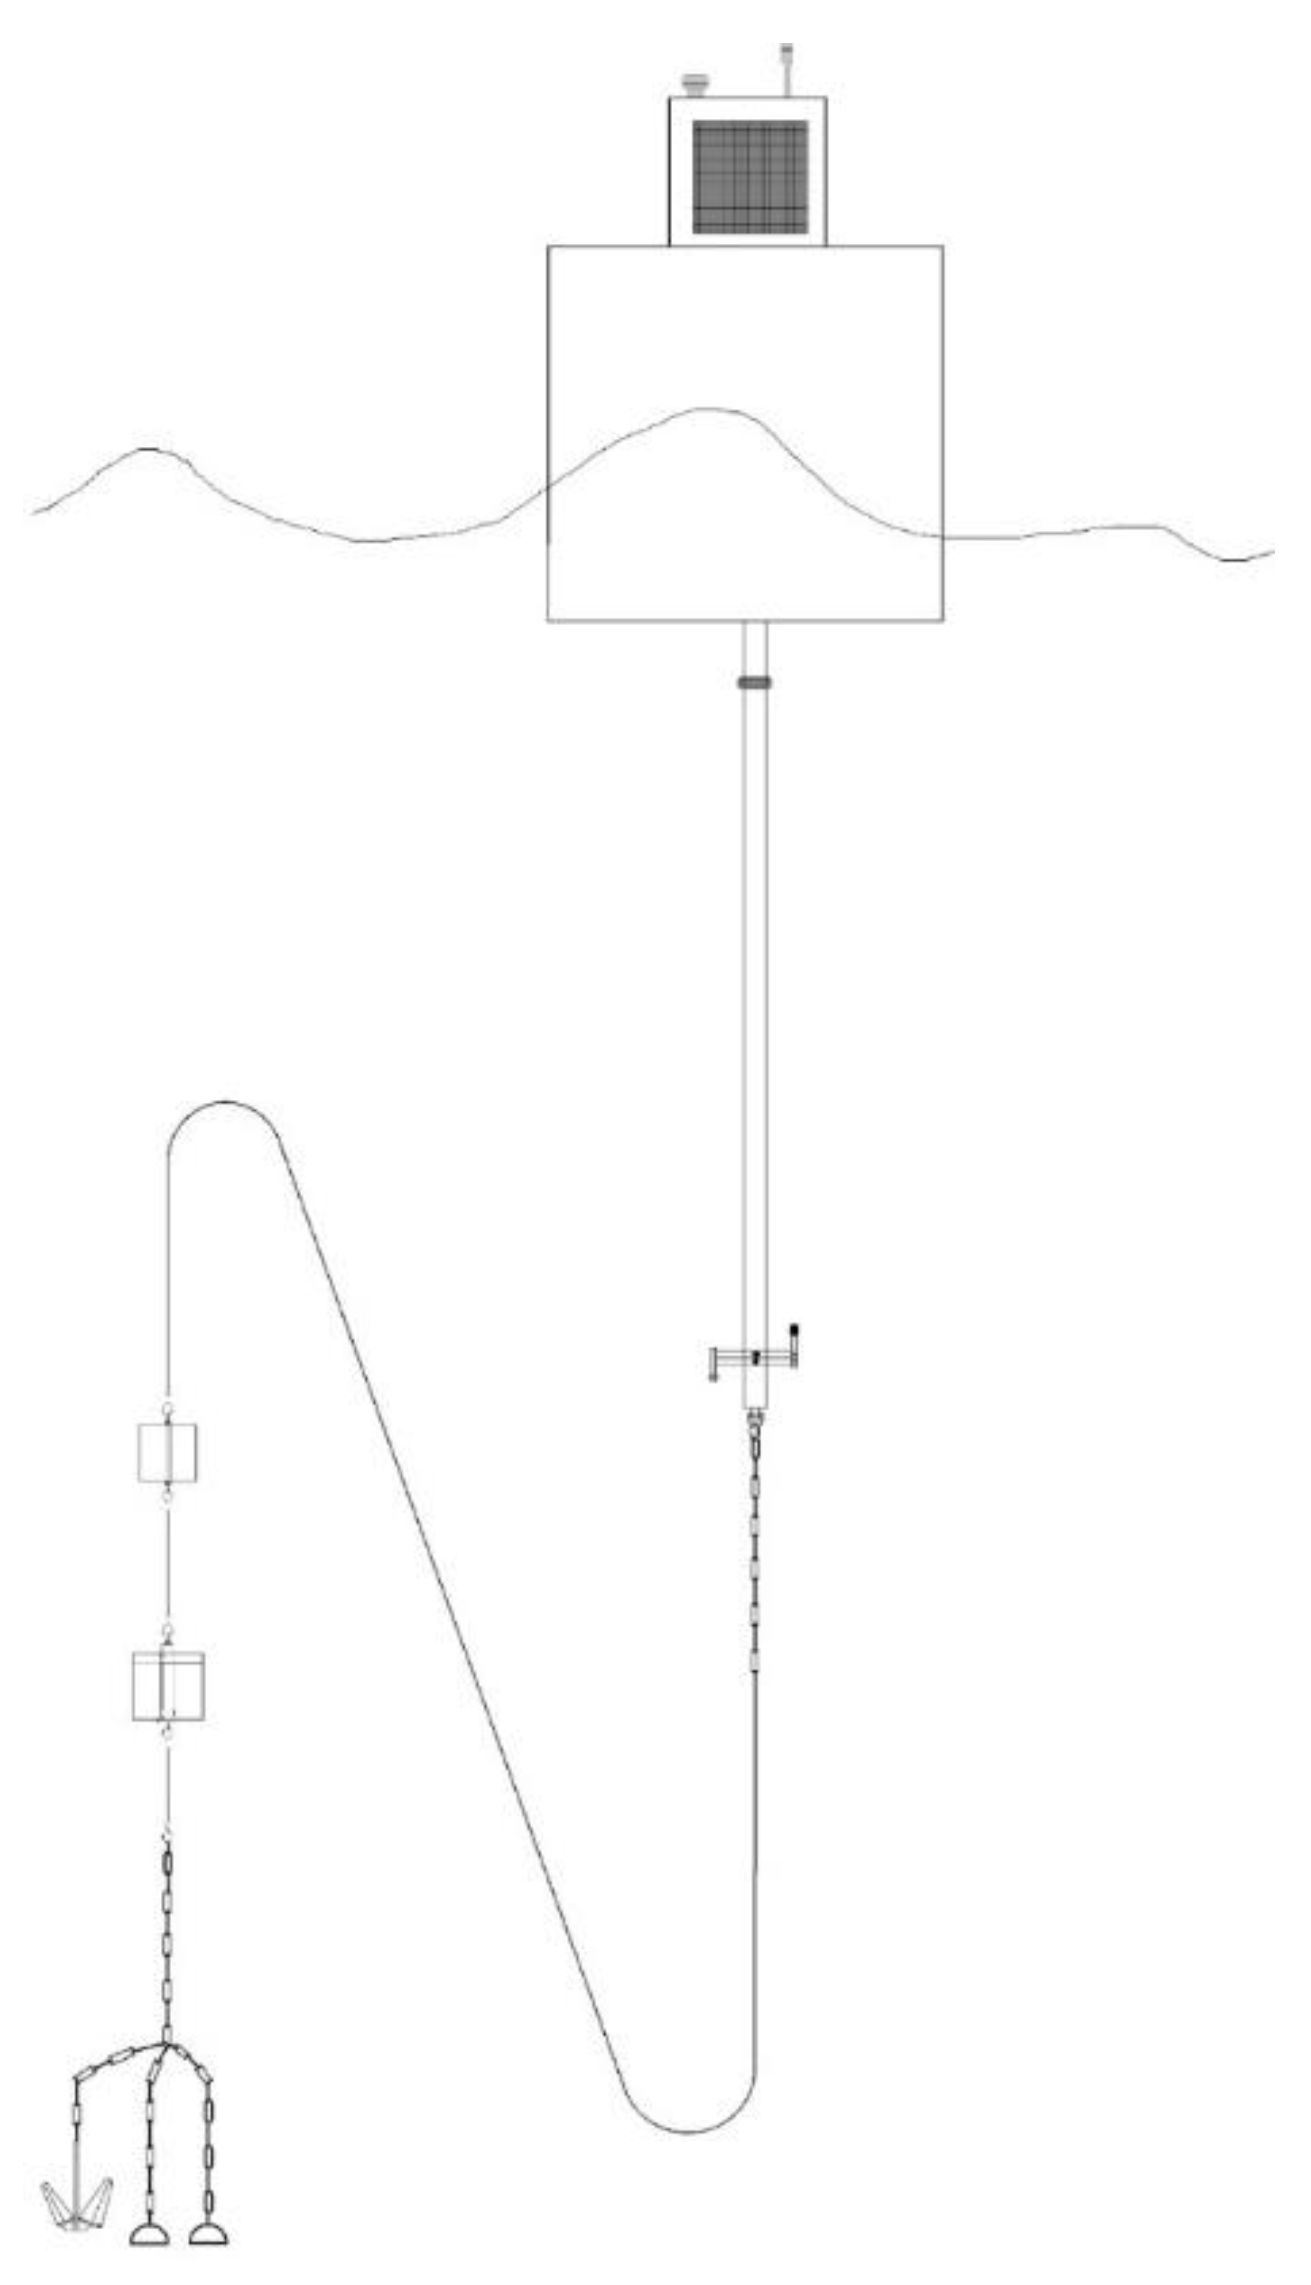
The monitoring and early warning system consisting of 3 autonomous marine monitoring stations (
Figure 2) is composed of:
Surface buoy:
solar recharging system for accumulator batteries;
power supply management system of the station;
switchable satellite/radio communication system;
data acquirer with integrated management;
remote control system and two-way real-time radio/satellite communication;
weather sensor system;
active and passive radar system;
optical signaling system;
acoustic system for managing the communication and data transmission with the installed underwater equipment [
27].
Multiparameter buoy fixed at 5 m depth:
Multi-parameter buoy fixed to the seabed with bidirectional acoustic communication modem with surface buoy (approximately 2 years autonomy and remote triggering system):
Tsunameter assembled on the seabed, near the buoy:
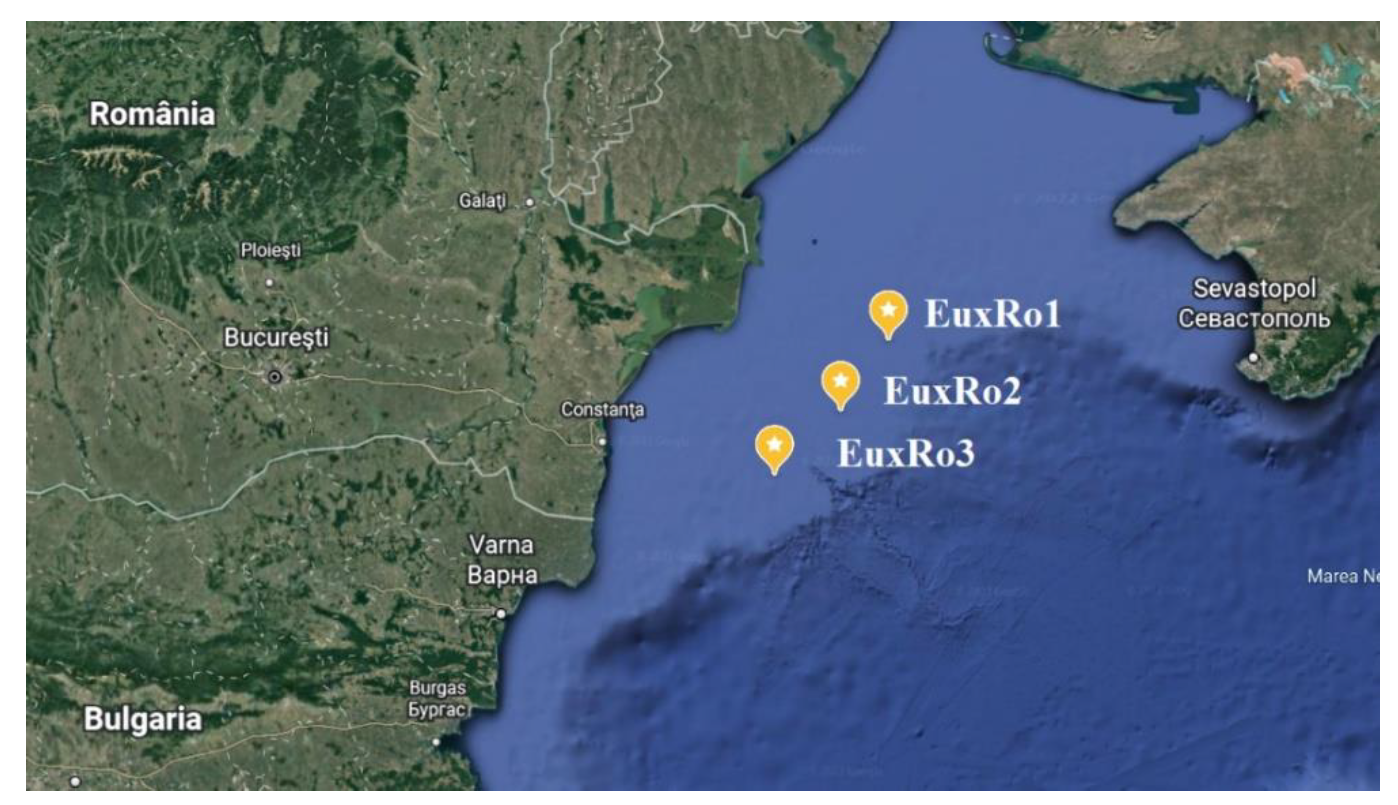
The three complex buoys (EuxRO 1, EuxRO 2, and EuxRO 3) are located on the Romanian continental shelf, in the territorial waters of Romania, at a distance of approximately 160 km from the coast and were approved by the Ministry of National Defense, through the Romanian Naval Forces, represented by the Maritime Hydrographic Directorate (DHM). Their location can be seen in
Figure 3 and also in
Table 1.
The transmission of the data collected from the installed sensor systems is acoustically done, in real time. The data are transmitted to the surface buoys, then satellite, to the National Monitoring and Alarm Center for Marine Natural Hazards EUXINUS, in Constanța. The weather station used for measuring the wind parameters is AIRMAR WHEATHER STATION 200WX, being installed at an approximate height of 2.5 m above the water. The system is capable of recording the following data: air pressure, air temperature, water current amplitude, water current direction, water temperate, wind speed and wind direction, making 24 observations per day, one value of each parameter per hour. EuxRO 2 only records the water current direction, water current amplitude, and water temperature data. Consequently, this research focuses on the data coming from EuxRO 1 and EuxRO 3 for the period May 2015–December 2020. More details regarding the parameters and the characteristics of the databases considered in this work are presented in
Table 2 [
27]. It is worth mentioning that certain data are missing due to the maintenance periods of the offshore buoys, unfavorable weather factors or certain technical problems.
3. Results
The study is based on the wind parameters (speed and direction) analysis while considering the total data for the 6-year period (2015–2020).
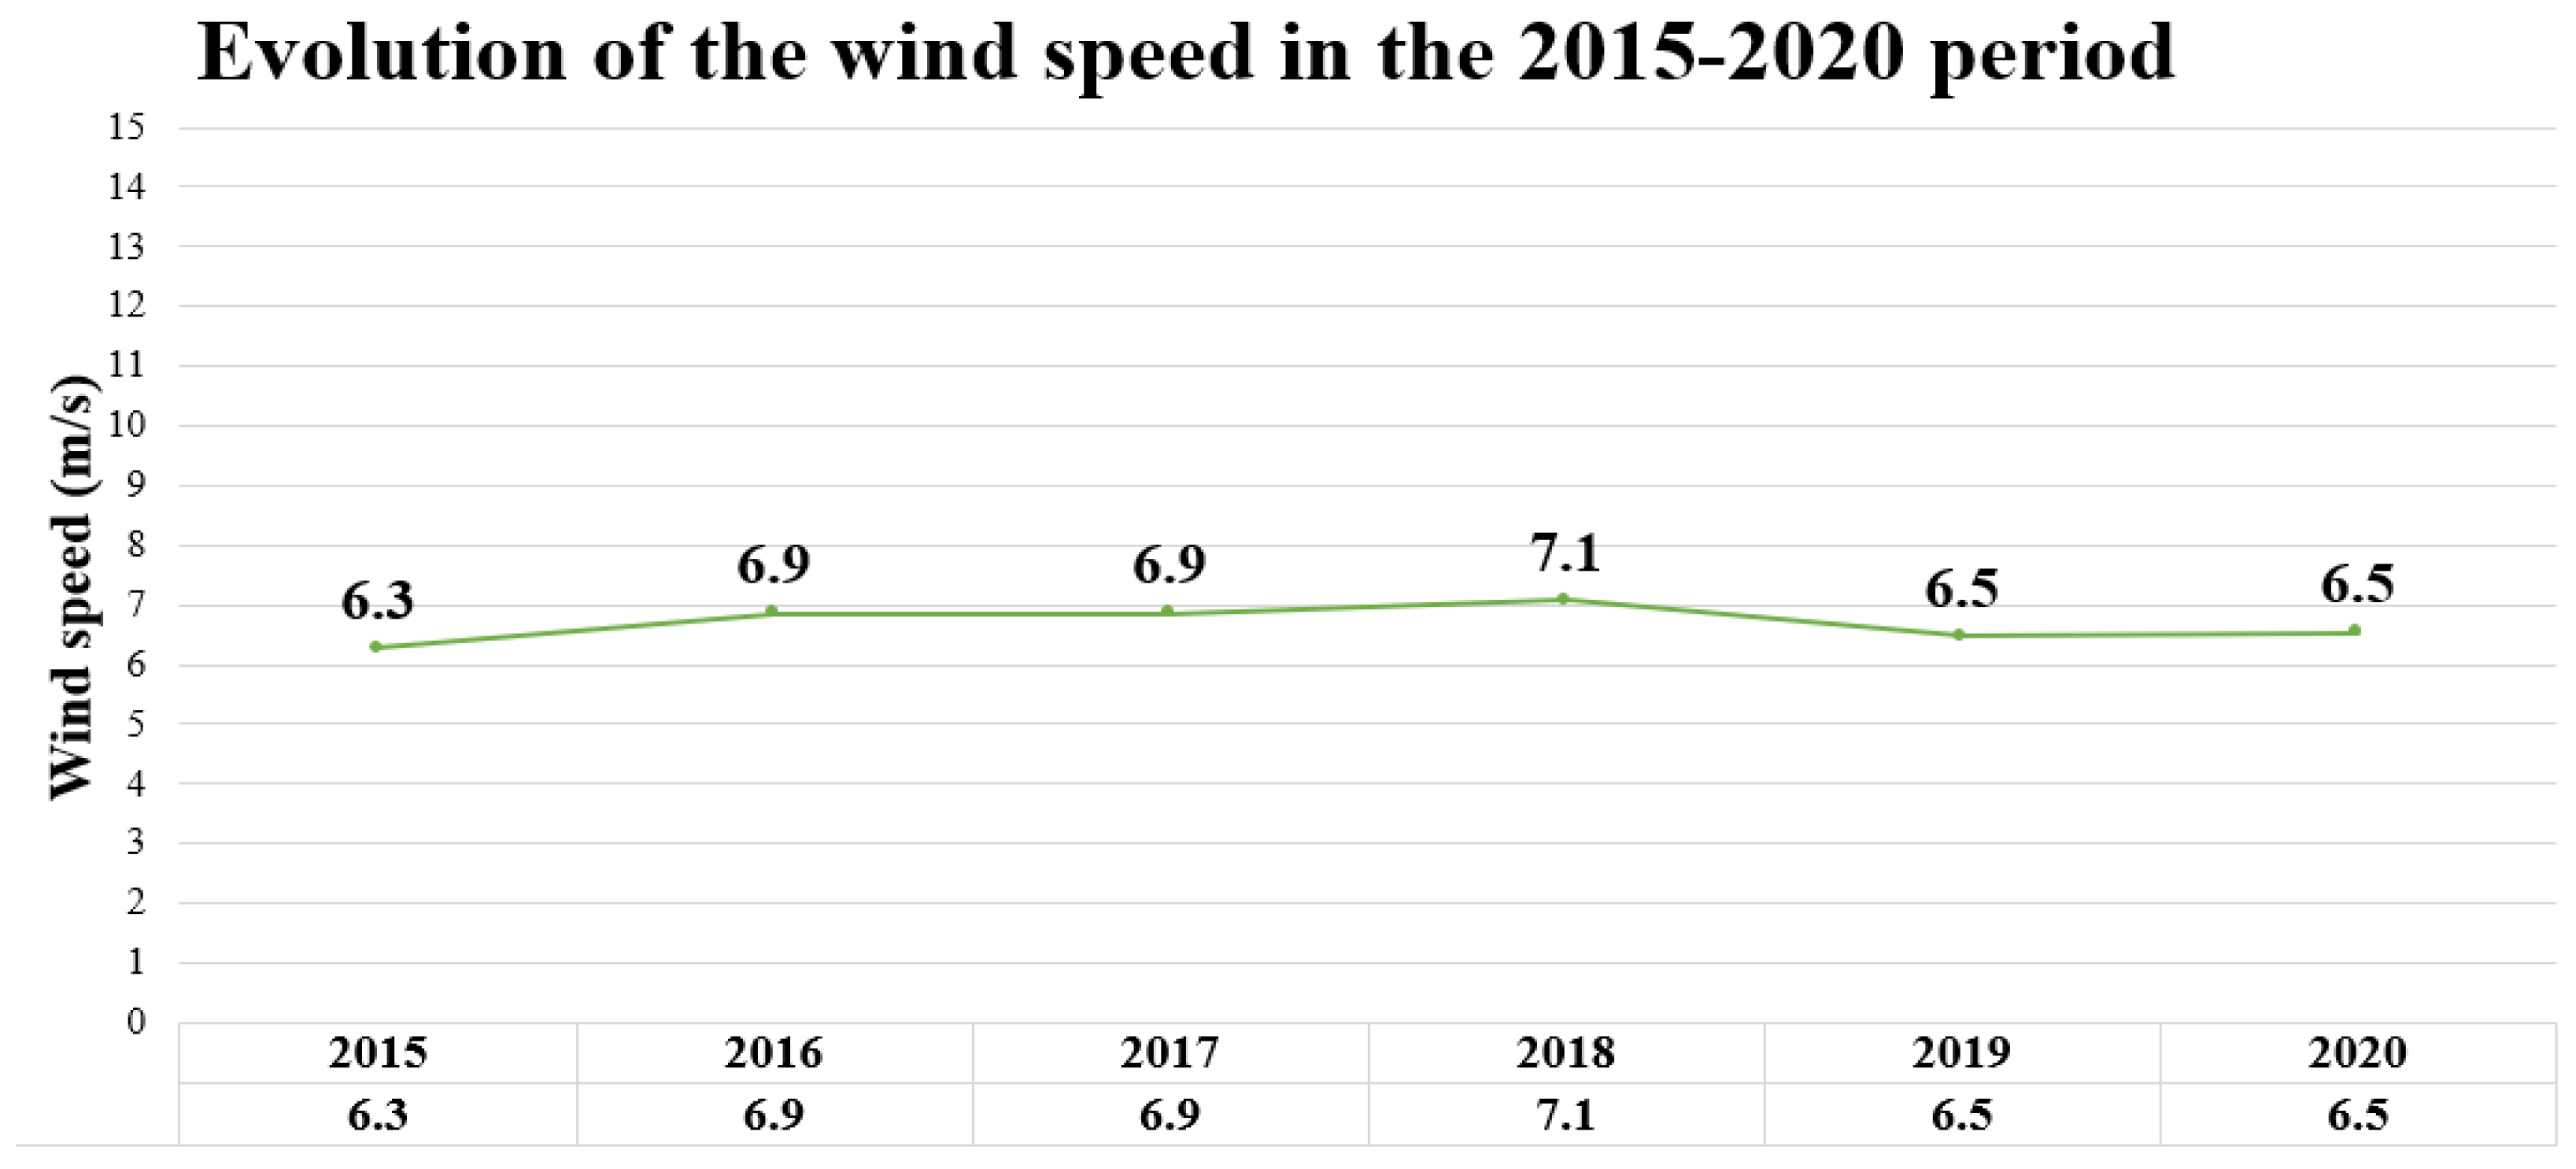
Figure 4 provides a first observation of the wind conditions in the Romanian coastal zone. From the analysis of the mean wind speed computed from the 2 autonomous marine monitoring stations, we may notice that there are no significant differences in the reported period. From the analysis performed for each year it resulted that the 2018 year is the most energetic year (7.1 m/s), whereas the lowest energetic is 2015 (6.3 m/s). From the analysis made in the entire period recorded, a mean value of the wind speed of 6.7 m/s was obtained, at a height of 2.5 m above the water.
3.1. Annually Evaluation of the Wind Data
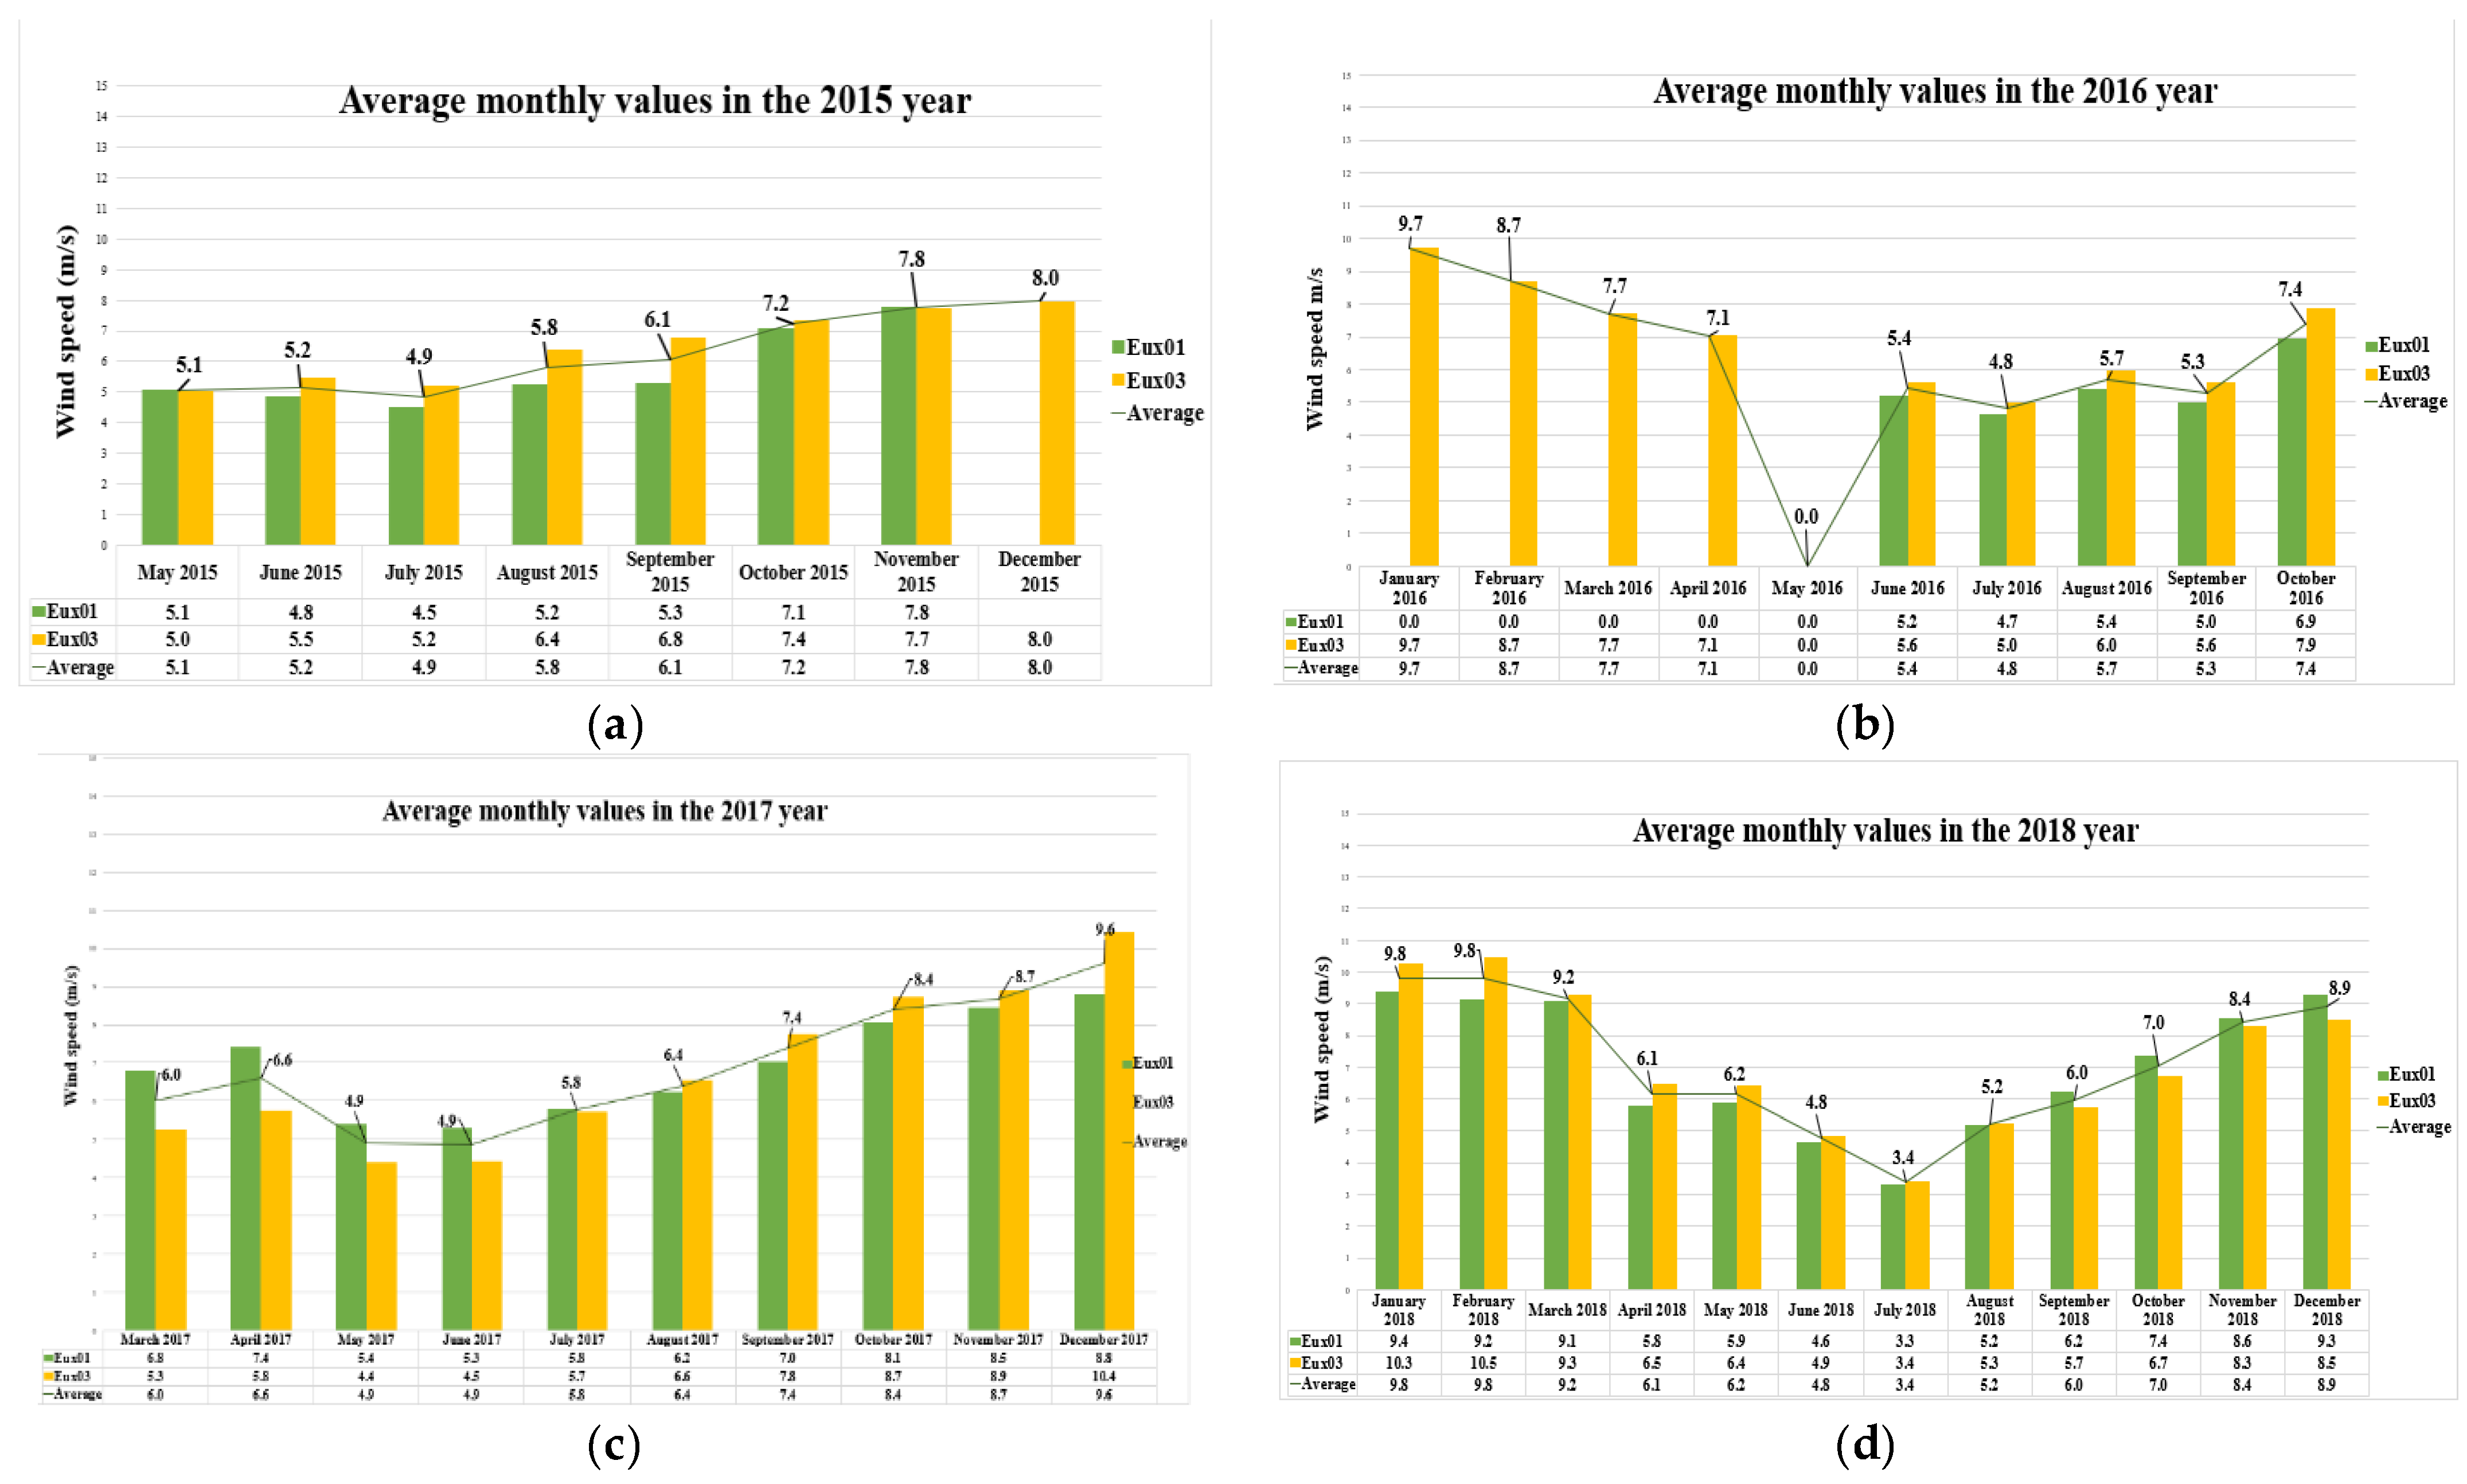
A more detailed analysis for every year can be seen in
Figure 5. As it can be observed from
Figure 5a, the wind speed maximum average value is located in December (EuxRo 3–8.0 m/s), which is closely followed by November with an average of 7.8 m/s. On the opposite, the lowest value is found in July (a mean value of 4.9 m/s). From
Figure 5b, a maximum value of the wind speed of 9.7 m/s in January 2016 can be observed, closely followed by 8.7 m/s in February, whereas a minimum of 4.8 m/s is seen in July 2016. For
Figure 5c a major value is reported in December, during which an average of 9.6 m/s may be observed, while a minimum value of 4.9 m/s was found in June. In
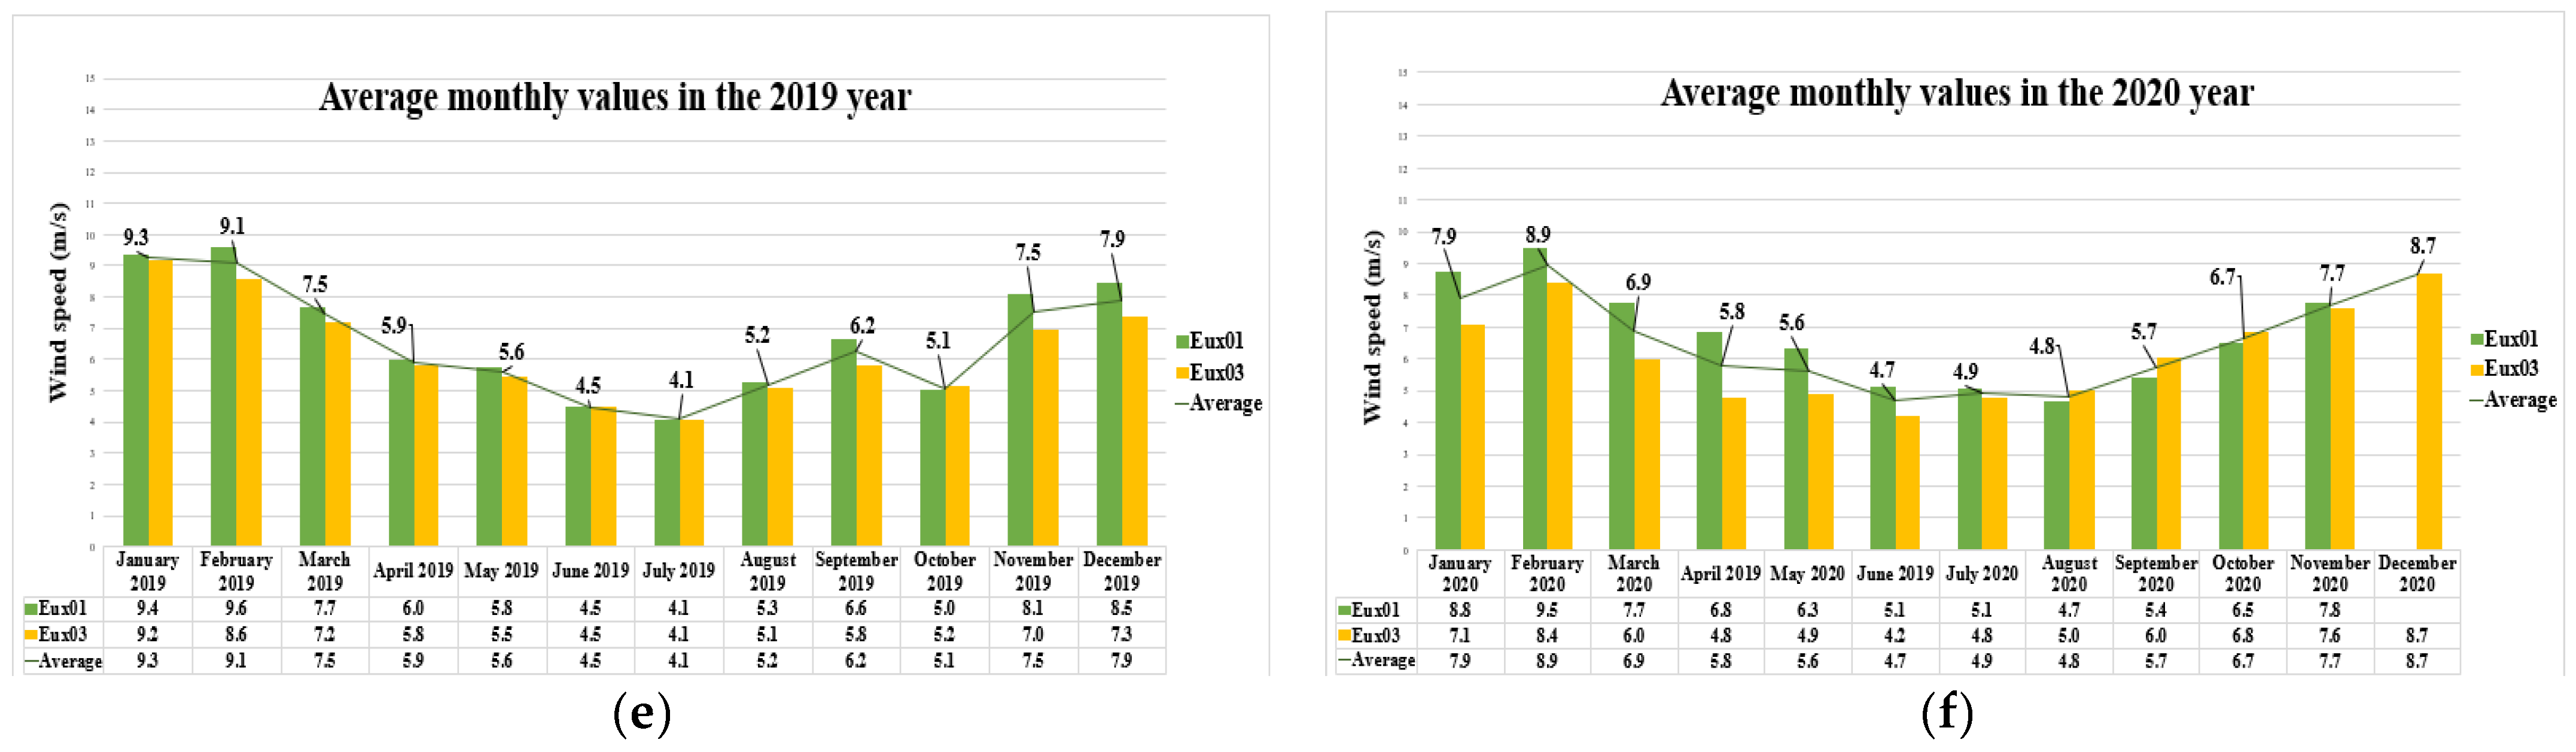
Figure 5d it is presented the 2018 year, the most energetic year, where we can witness a maximum average value of 9.8 m/s in January and a minimum of 3.4 m/s in July. From the values analyzed in 2019 (
Figure 5e), it can be noticed that January (9.3 m/s) and February (9.1 m/s) present in general much higher values compared to July and June, where the values are located in the range 4.1–4.5 m/s. The 2020 data (
Figure 5f) seems to be in good agreement with the data from above, a maximum average value has been noticed in winter (February—8.9 m/s) and a minimum in summer (June—4.7 m/s). Based on the analysis made for each month in the 6-year interval considered, it resulted that the greatest average values were encountered in January 2018—9.8 m/s (
Figure 5d), followed by January 2016—9.7 m/s (
Figure 5b).
3.2. Maximum Wind Values Recorded per Year
From the amount of analyzed data, the maximum values that were recorded should be highlighted. In 2015 the maximum wind speed value was registered by the EuxRO 1 on the 1st of December at 20.00. The wind had a speed of 17.1 m/s and a direction of 340°. In the next year, on the 18 January 2016 at 20.00 a value of 18 m/s and a direction of 336° were indicated by the EuxRO 3. Further, in the next years, all of the maximum values were stored by the EuxRO 3. In 2017, a value of 17.3 m/s and a direction of 272° were present on the 30 October. In 2018 and 2019 values over 20 m/s were observed. On 18 January 2018, wind speed of 22.5 m/s and direction of 327° were seen at 19.00, while on the 8 January 2019 at 05.00 the wind speed reached 25.5 m/s and direction 344°. The last year that was analyzed shows a maximum wind speed value of 17.2 m/s and a direction of 299° on 30 April at 24.00.
3.3. Seasonal Average Values
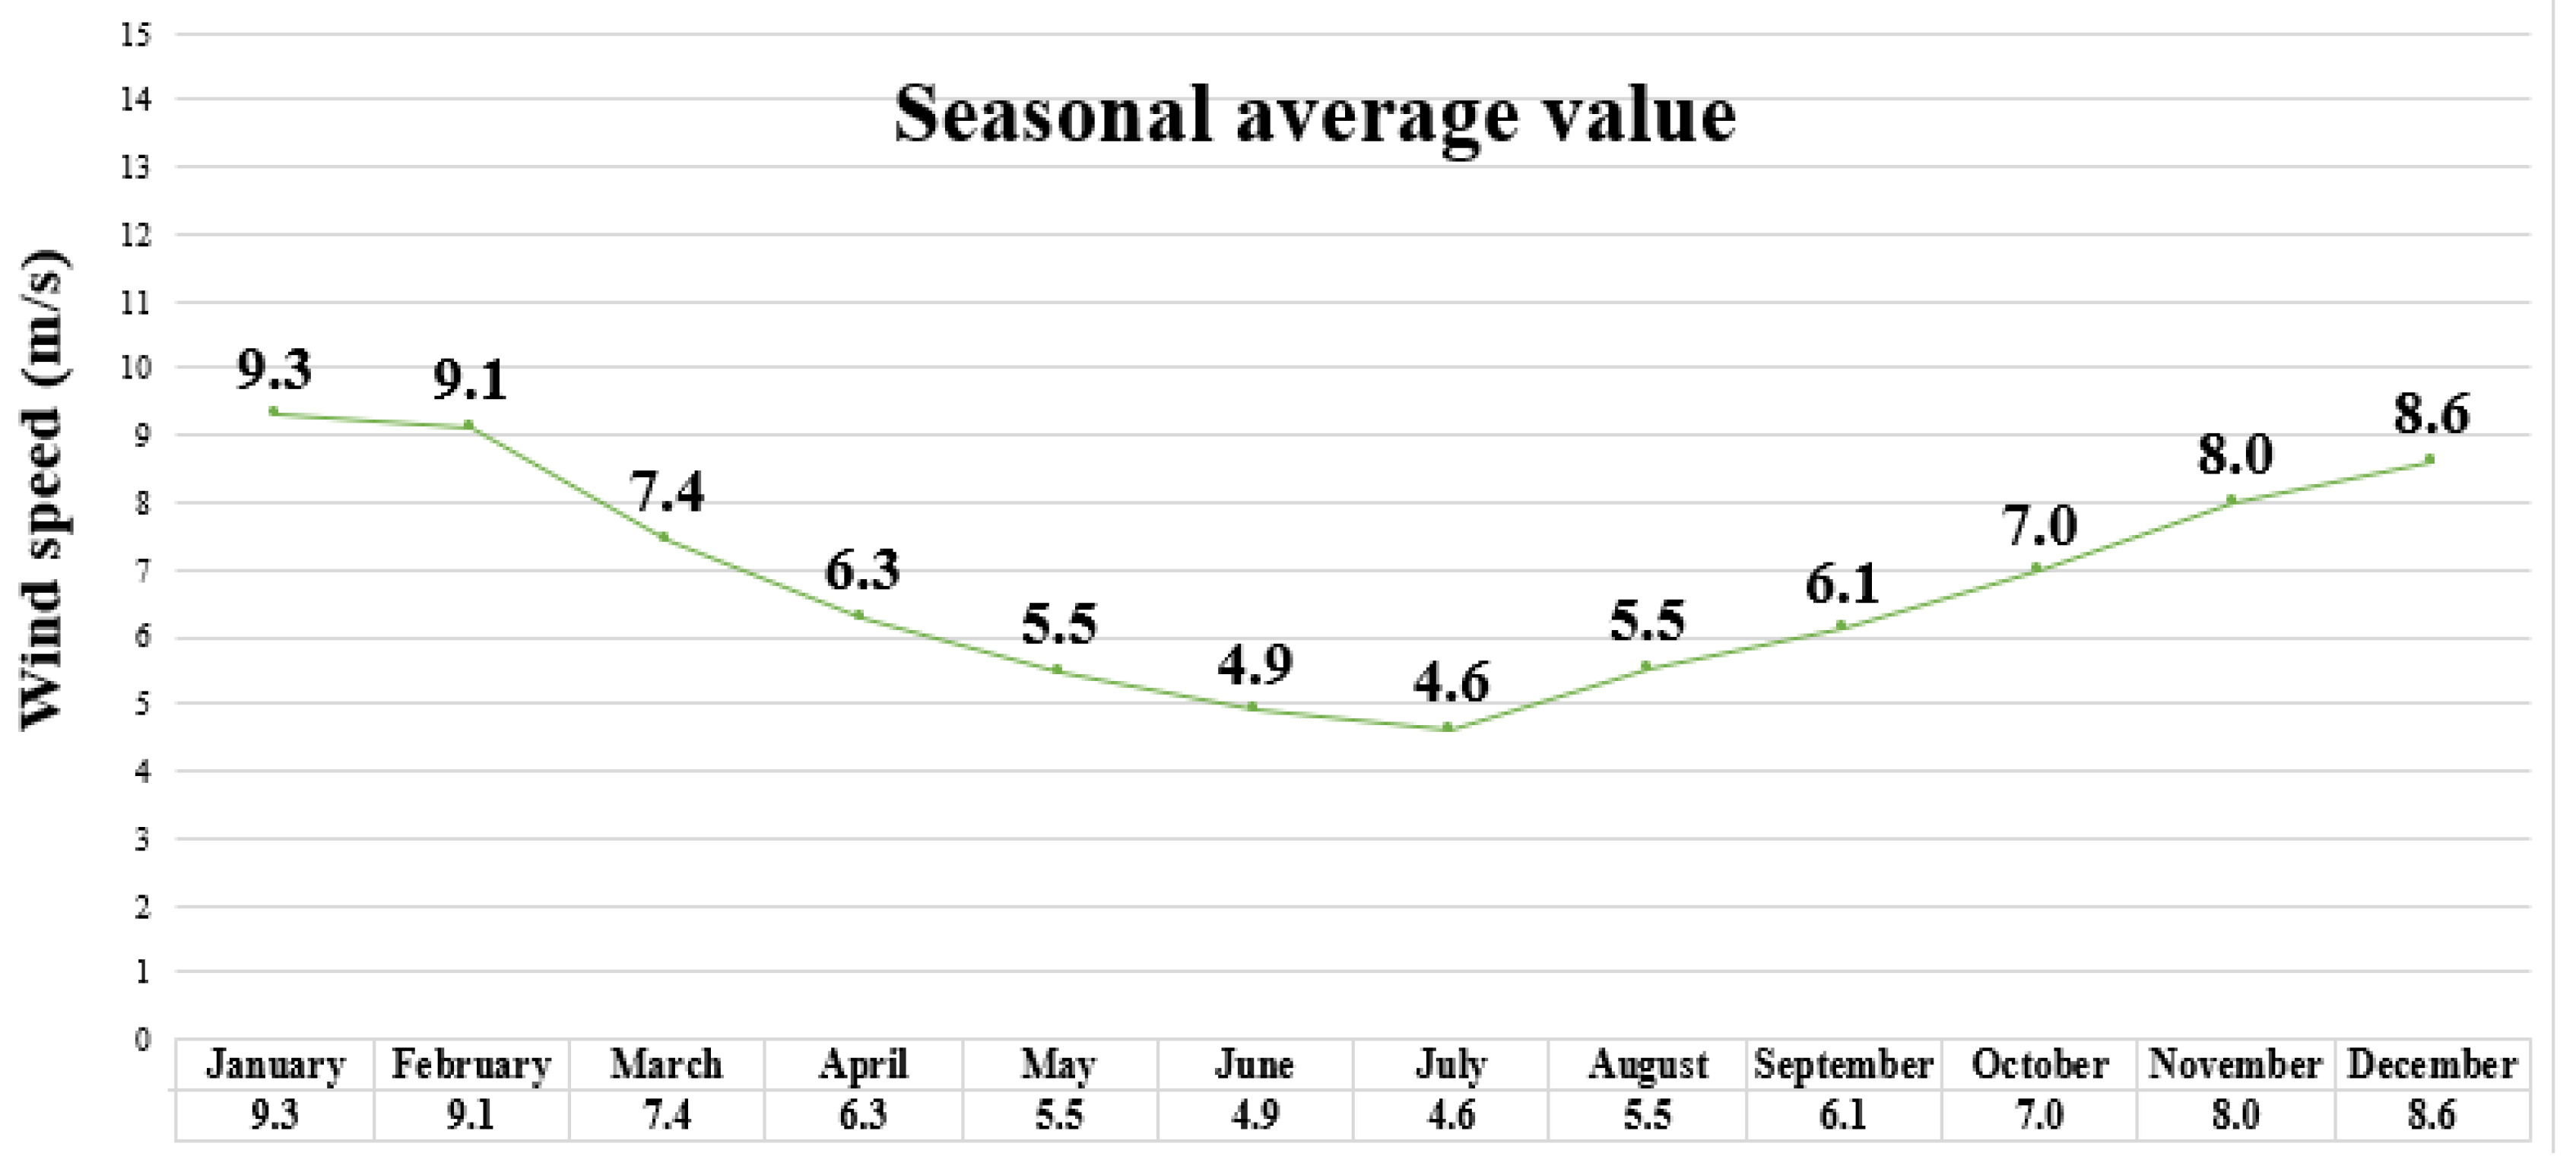
The seasonal average values of the wind speed were computed by following partitions: winter—DJF (December-January-February), spring—MAM (March-April-May), summer—JJA (June-July-August), and autumn—SON (September-October-November). As can be seen from
Figure 6, winter is the most dynamic season. In this season, wind speed values were registered in the range of 8.6 m/s (December)–9.3 m/s (January). Further, the next season that presents dynamic variations is autumn. During these months average values of 6.1 m/s in September, 7.0 m/s in October and 8.0 m/s in November were recorded. In spring lower values of the wind speed were noticed: March—7.4 m/s, April—6.3 m/s, May—5.5 m/s. Nevertheless, the lowest energetic season is summer. The lowest wind speed average value was recorded in July (4.6 m/s), which is closely followed by June (4.9 m/s) and August (5.5 m/s).
3.4. Wind Direction
Comparing the average wind direction from the selected buoys, it can be observed that all the values are in good agreement. The mean value wind direction obtained for the entire study period is 167.1°. This result is based on the observation made from the 2 buoys, being more detailed in
Table 3. The annual values are in the same range from 152.8° in the 2018 year to 176.9° measured in 2017. In terms of monthly average values, the results are also grouped by seasons with approximately equal directions. During winter, the wind direction is 191.5°, followed by autumn with a mean value of 151.9°. During spring, the average wind direction obtained is 171.2°, whereas in summer the direction is 157.7°.
4. Discussion
It is highly important to acknowledge that wind resources are directly related to wind speed not to mention that their productivity will be influenced by the climate. In order to assess the dynamics of the wind energy resources in the Black Sea, the 6 years of GeoEcoMar data (2015–2020) were considered for evaluation. To identify relevant trends, analysis of mean and maximum wind speed, as well as their seasonal variations were conducted. Moreover, an evaluation of the strongest winds recorded is presented.
In order to highlight the distribution of the strongest winds recorded in the Black Sea region, the maximum wind speeds were considered for discussion in order to identify some energetic peaks. On the 18 January 2018, a maximum wind speed of 22.5 m/s was seen at 19.00. Signs of a cyclone were seen on the 9 January when the wind started to blow with 8 m/s from N-NE. On the 11 January, the wind speed was around 14 m/s with a direction of 67°–126°. The wind speed had an average of 13 m/s in this period although the pressure continued to decrease. On 18th at 19.00 the maximum peak of wind speed was 22.5 m/s, direction of 327° and pressure of 983.7 mbar. On the next day, the average wind speed was 12 m/s from the western sector. On the 20th, 21th, 22th, 23th above-normal wind speed values were recorded. On the 24 January, the cyclone was no longer present in the western sector of the Black Sea. To sum up, the cyclone started on the 9 January (8 m/s), had a maximum peak on the 18th (22.5 m/s) and finished on 24th (12.5 m/s).
Following the same principle, the highest value of wind speed recorded from the entire study should be detailed. In this instance, the period is much shorter and with not so many well-defined severe weather parameters. On 8 January 2019 at 05.00, a maximum value of 25.5 m/s was recorded. Before this day, on the 5th, the wind speed reached a value of 10.2 m/s. The next day, the wind speed average was 10.375 m/s from the north-western sector. On the 7th, the wind had a similar direction and a speed average of 13.308 m/s. The pressure was in standard parameters. On the following day, the wind speed started to rise substantially, recording an average of 17.9 m/s. On the last day, the wind speed decreased to usual values resulting in completion of the extreme event reported.
Analyzing the data obtained for the mean wind parameters in the present study, it can be seen that the overall wind speeds for each year are close, indicating that no significant variations will be present in the near or distant future, proving that the Romanian coastal zone can be a reliable solution for the offshore wind farms development.
5. Conclusions
This research paper aimed to analyze the dynamics of the wind parameters along the west coast of the Black Sea, based on the weather data provided over a 6-year period (2015–2020) by GeoEcoMar Institute.
The present study outlines relevant trends in wind dynamics, resulting from the analysis of mean and maximum values of the wind, but also its seasonal and monthly variations. Moreover, two periods of severe weather were discussed.
Wind climate was analyzed covering the period 2015–2020. Two offshore autonomous marine stations data were studied in terms of their wind parameters by computing monthly and mean wind speed and direction. A mean wind speed value of 6.7 m/s was obtained from the analysis. Taking into account the seasonal and monthly variation of the wind, the climatic picture of the Black Sea is divided into two opposite seasons, winter and summer, the principal cause being the temperature increase or decrease during these periods. However, the other two seasons give a better transition from one extreme to another and also acquire some of their characteristics.
The data analyzed in this report support that the offshore regions are suitable for developing wind farms. Taking into consideration the data recorded from the buoys located at 160 km from the coast, and the fact that deep-water areas are more satisfactory for wind farms, it is highlighted that floating turbines are a feasible solution for the northwestern part of the Black Sea’s offshore development. Moreover, given the fact that wind speeds increase along with the distance to the shore, and a large part of Romania’s Exclusive Economic Zone consists of a deep-water area, prove once again that the area discussed represents a viable solution for the development of offshore wind farms [
6]. The results that were achieved in this study contribute to the wind climate characterization in the discussed area and represent one of the first steps in future studies related to wind variability considering various approaches. Finally, it can be concluded that the Black Sea is a dynamic environment with rich sources for the development of renewable energy projects.
Author Contributions
L.-I.N. collected and processed the wind data, carried out the statistical analysis and interpreted the results. E.R. guided the entire research, wrote parts of the manuscript and handled the review process. The final manuscript has been approved by all authors. All authors have read and agreed to the published version of the manuscript.
Funding
This work was carried out in the framework of the research project DREAM (Dynamics of the REsources and technological Advance in harvesting Marine renewable energy), supported by the Romanian Executive Agency for Higher Education, Research, Development and Innovation Funding—UEFISCDI, grant number PN-III-P4-ID-PCE-2020-0008.
Institutional Review Board Statement
Not applicable.
Informed Consent Statement
Not applicable.
Data Availability Statement
The data that were used in the present study are openly available. The wind data were obtained from the National Institute of Marine Geology and Geoecology—GeoEcoMar.
Conflicts of Interest
The authors declare no conflict of interest.
References
- Aklin, M.; Urpelainen, J. Renewables: The Politics of a Global Energy Transition; The MIT Press: Cambridge, MA, USA, 2018. [Google Scholar]
- Ellabban, O.; Abu-Rub, H.; Blaabjerg, F. Renewable energy resources: Current status, future prospects and their enabling technology. Renew. Sustain. Energy Rev. 2014, 39, 748–764. [Google Scholar] [CrossRef]
- Bull, S.R. Renewable energy today and tomorrow. Proc. IEEE 2001, 89, 1216–1226. [Google Scholar] [CrossRef]
- Available online: https://www.interregeurope.eu/agrores/news/news-article/10859/opportunities-of-black-sea-offshore-wind/ (accessed on 15 January 2022).
- Dragomir, G.; Serban, A.; Nastase, G.; Brezeanu, A.I. Wind Energy in Romania: A Review from 2009 to 2016. Renew. Sustain. Energy Rev. 2016, 64, 129–143. [Google Scholar] [CrossRef]
- Bălan, M.; Dudău, R.; Cătuți, M.; Covatariu, A. Romania’s Offshore Wind Energy Resources: Natural Potential, Regulatory Framework, and Development Prospects; Energy Policy Group: Bucharest, Romania, 2020. [Google Scholar]
- Aydogan, B.; Ayat, B.; Yüksel, Y. Black Sea wave energy atlas from 13 years hindcasted wave data. Renew. Energy 2013, 57, 436–447. [Google Scholar] [CrossRef]
- Rusu, L.; Bernardino, M.; Guedes Soares, C. Wind and wave modelling in the Black Sea. J. Oper. Oceanogr. 2014, 7, 5–20. [Google Scholar] [CrossRef] [Green Version]
- Fulya, I.; Yalcin, Y. Inter-comparison of long-term wave power potential in the Black Sea based on the SWAN wave model forced with two different wind fields. Dyn. Atmos. Ocean. 2021, 93, 101192. [Google Scholar]
- Rusu, L.; Ganea, D.; Mereuta, E. A joint evaluation of wave and wind energy resources in the Black Sea based on 20-year hindcast information. Energy Explor. Exploit. 2018, 36, 335–351. [Google Scholar] [CrossRef]
- Girleanu, A.; Onea, F.; Rusu, E. Assessment of the Wind Energy Potential along the Romanian Coastal Zone. Inventions 2021, 6, 41. [Google Scholar] [CrossRef]
- Davy, R.; Gnatiuk, N.; Pettersson, L.; Bobylev, L. Climate change impacts on wind energy potential in the European domain with a focus on the Black Sea. Renew. Sustain. Energy Rev. 2018, 81, 1652–1659. [Google Scholar] [CrossRef] [Green Version]
- Onea, F.; Rusu, L. A Long-Term Assessment of the Black Sea Wave Climate. Sustainability 2017, 9, 1875. [Google Scholar] [CrossRef] [Green Version]
- Staneva, J.V.; Stanev, E. Oceanic response to atmospheric forcing derived from different climatic data sets, Intercomparison studies for the Black Sea. Oceanol. Acta 1998, 21, 393–417. [Google Scholar] [CrossRef] [Green Version]
- Atodiresei, D.; Toma, A.; Cotorcea, A.; Samoilescu, G. Opportunities for harnessing wind potential on board ships in the northwest area of the black sea. Rev. Roum. Sci. Tech. Ser. Electrotech. Energetique 2017, 62, 265–268. [Google Scholar]
- Valchev, N.; Davidan, I.; Belberov, Z.; Palazov, A.; Valcheva, N. Estimation of wind wave climate of the Western Black Sea during the last 50 years. In Proceedings of the Ninth International Conference on Marine Sciences and Technologies Black Sea, Varna, Bulgary, 23–25 October 2008; pp. 232–239. [Google Scholar]
- Onea, F.; Rusu, E. An Evaluation of the Wind Energy in the North-West of the Black Sea. Int. J. Green Energy. 2014, 11, 465–487. [Google Scholar] [CrossRef]
- Ganea, D.; Mereuta, E.; Rusu, L. Estimation of the near future wind power potential in the Black Sea. Energies 2018, 11, 3198. [Google Scholar] [CrossRef] [Green Version]
- Myslenkov, S.; Zelenko, A.; Resnyanskii, Y.; Arkhipkin, V.; Silvestrova, K. Quality of the Wind Wave Forecast in the Black Sea Including Storm Wave Analysis. Sustainability 2021, 13, 13099. [Google Scholar] [CrossRef]
- Rusu, L.; Raileanu, A.; Onea, F. A comparative analysis of the wind and wave climate in the Black Sea along the shipping routes. Water 2018, 10, 924. [Google Scholar] [CrossRef] [Green Version]
- Diaconita, A.I.; Rusu, L.; Andrei, G. A Local Perspective on Wind Energy Potential in Six Reference Sites on the Western Coast of the Black Sea Considering Five Different Types of Wind Turbines. Inventions 2021, 6, 44. [Google Scholar] [CrossRef]
- Divinsky, B.V.; Kosyan, R.D. Spatiotemporal variability of the Black Sea wave climate in the last 37 years. Cont. Shelf Res. 2017, 136, 1–19. [Google Scholar] [CrossRef]
- Rusu, E.; Onea, F.; Toderascu, R. Dynamics of the Environmental Matrix in the Black Sea as Reflected by Recent Measurements and Simulations with Numerical Models. In Black Sea: Dynamics, Ecology and Conservation; Nova Science Publishers, Inc.: Hauppauge, NY, USA, 2011. [Google Scholar]
- Nedelcu, A.T.; Atodiresei, D.; Buzbuchi, N. Oceanographic research and recordings made on the North-West Coast of the Black Sea. Int. J. Conserv. Sci. 2020, 11, 615–624. [Google Scholar]
- Amarioarei, A.; Tusa, I.; Sidoroff, M.; Pauna, M. Classification of Romanian salt water lakes by statistical methods. J. Environ. Prot. Ecol. 2018, 19, 1–14. [Google Scholar]
- Available online: https://www.fao.org/3/n7372e/N7372E02.htm (accessed on 25 November 2021).
- Available online: https://www.euxinus.eu/ (accessed on 26 November 2021).
| Publisher’s Note: MDPI stays neutral with regard to jurisdictional claims in published maps and institutional affiliations. |
© 2022 by the authors. Licensee MDPI, Basel, Switzerland. This article is an open access article distributed under the terms and conditions of the Creative Commons Attribution (CC BY) license (https://creativecommons.org/licenses/by/4.0/).


