Sewage Sludge Bio-Oil Development and Characterization

 ,
,
Abstract
:1. Introduction
2. Experimental
2.1. Materials
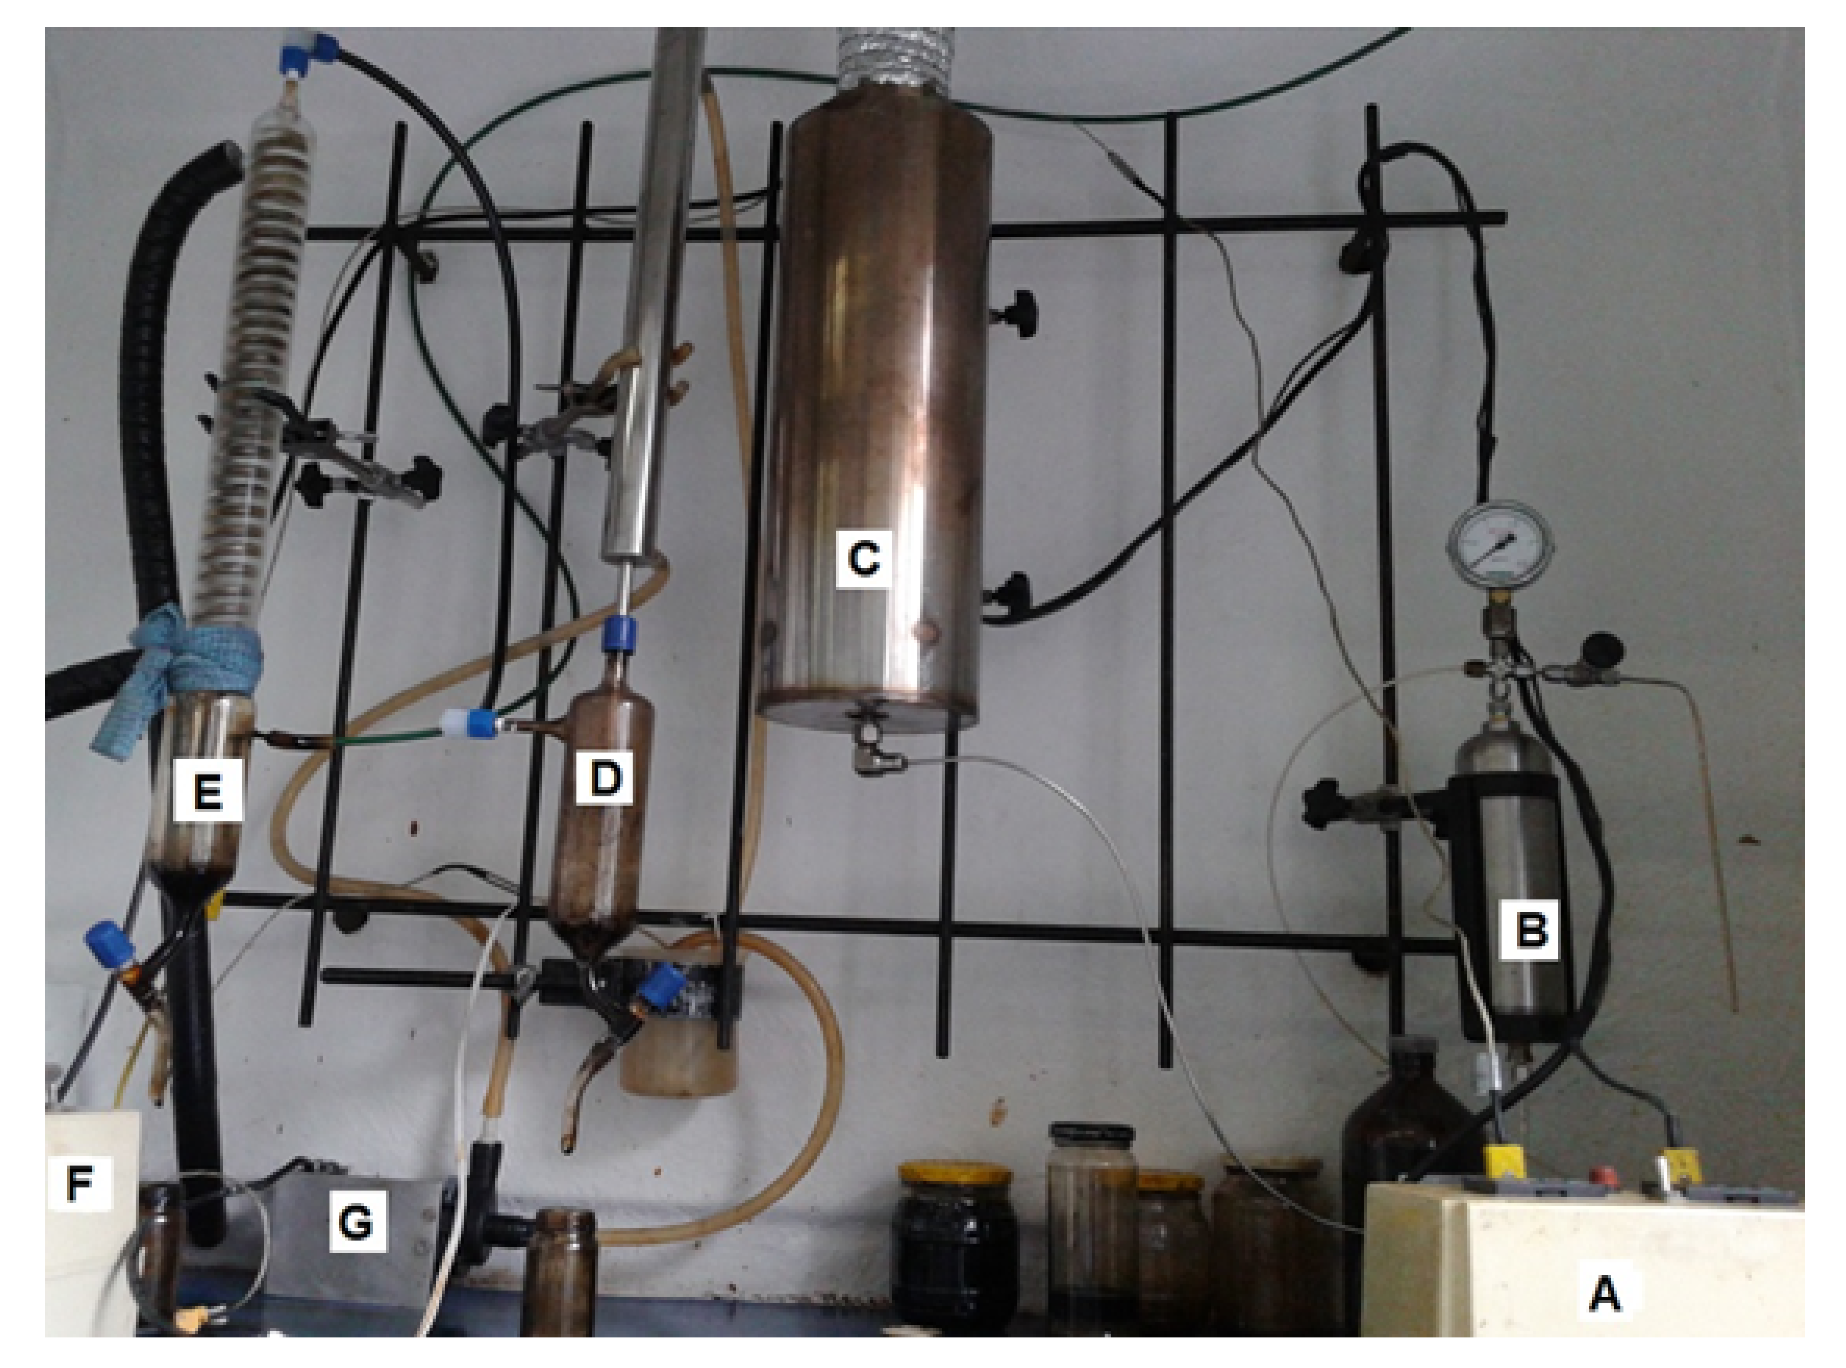
2.2. Production
2.3. GC-MS
2.4. (1H-NMR)
2.5. Thermogravimetric Analysis
2.6. Fourier Transform Infrared
2.7. Enthalpy of Combustion
2.8. Flashpoint
2.9. Density, Viscosity and pH
3. Results and Discussions
3.1. Influence of Temperature on Pyrolysis Yield
3.2. GC-MS
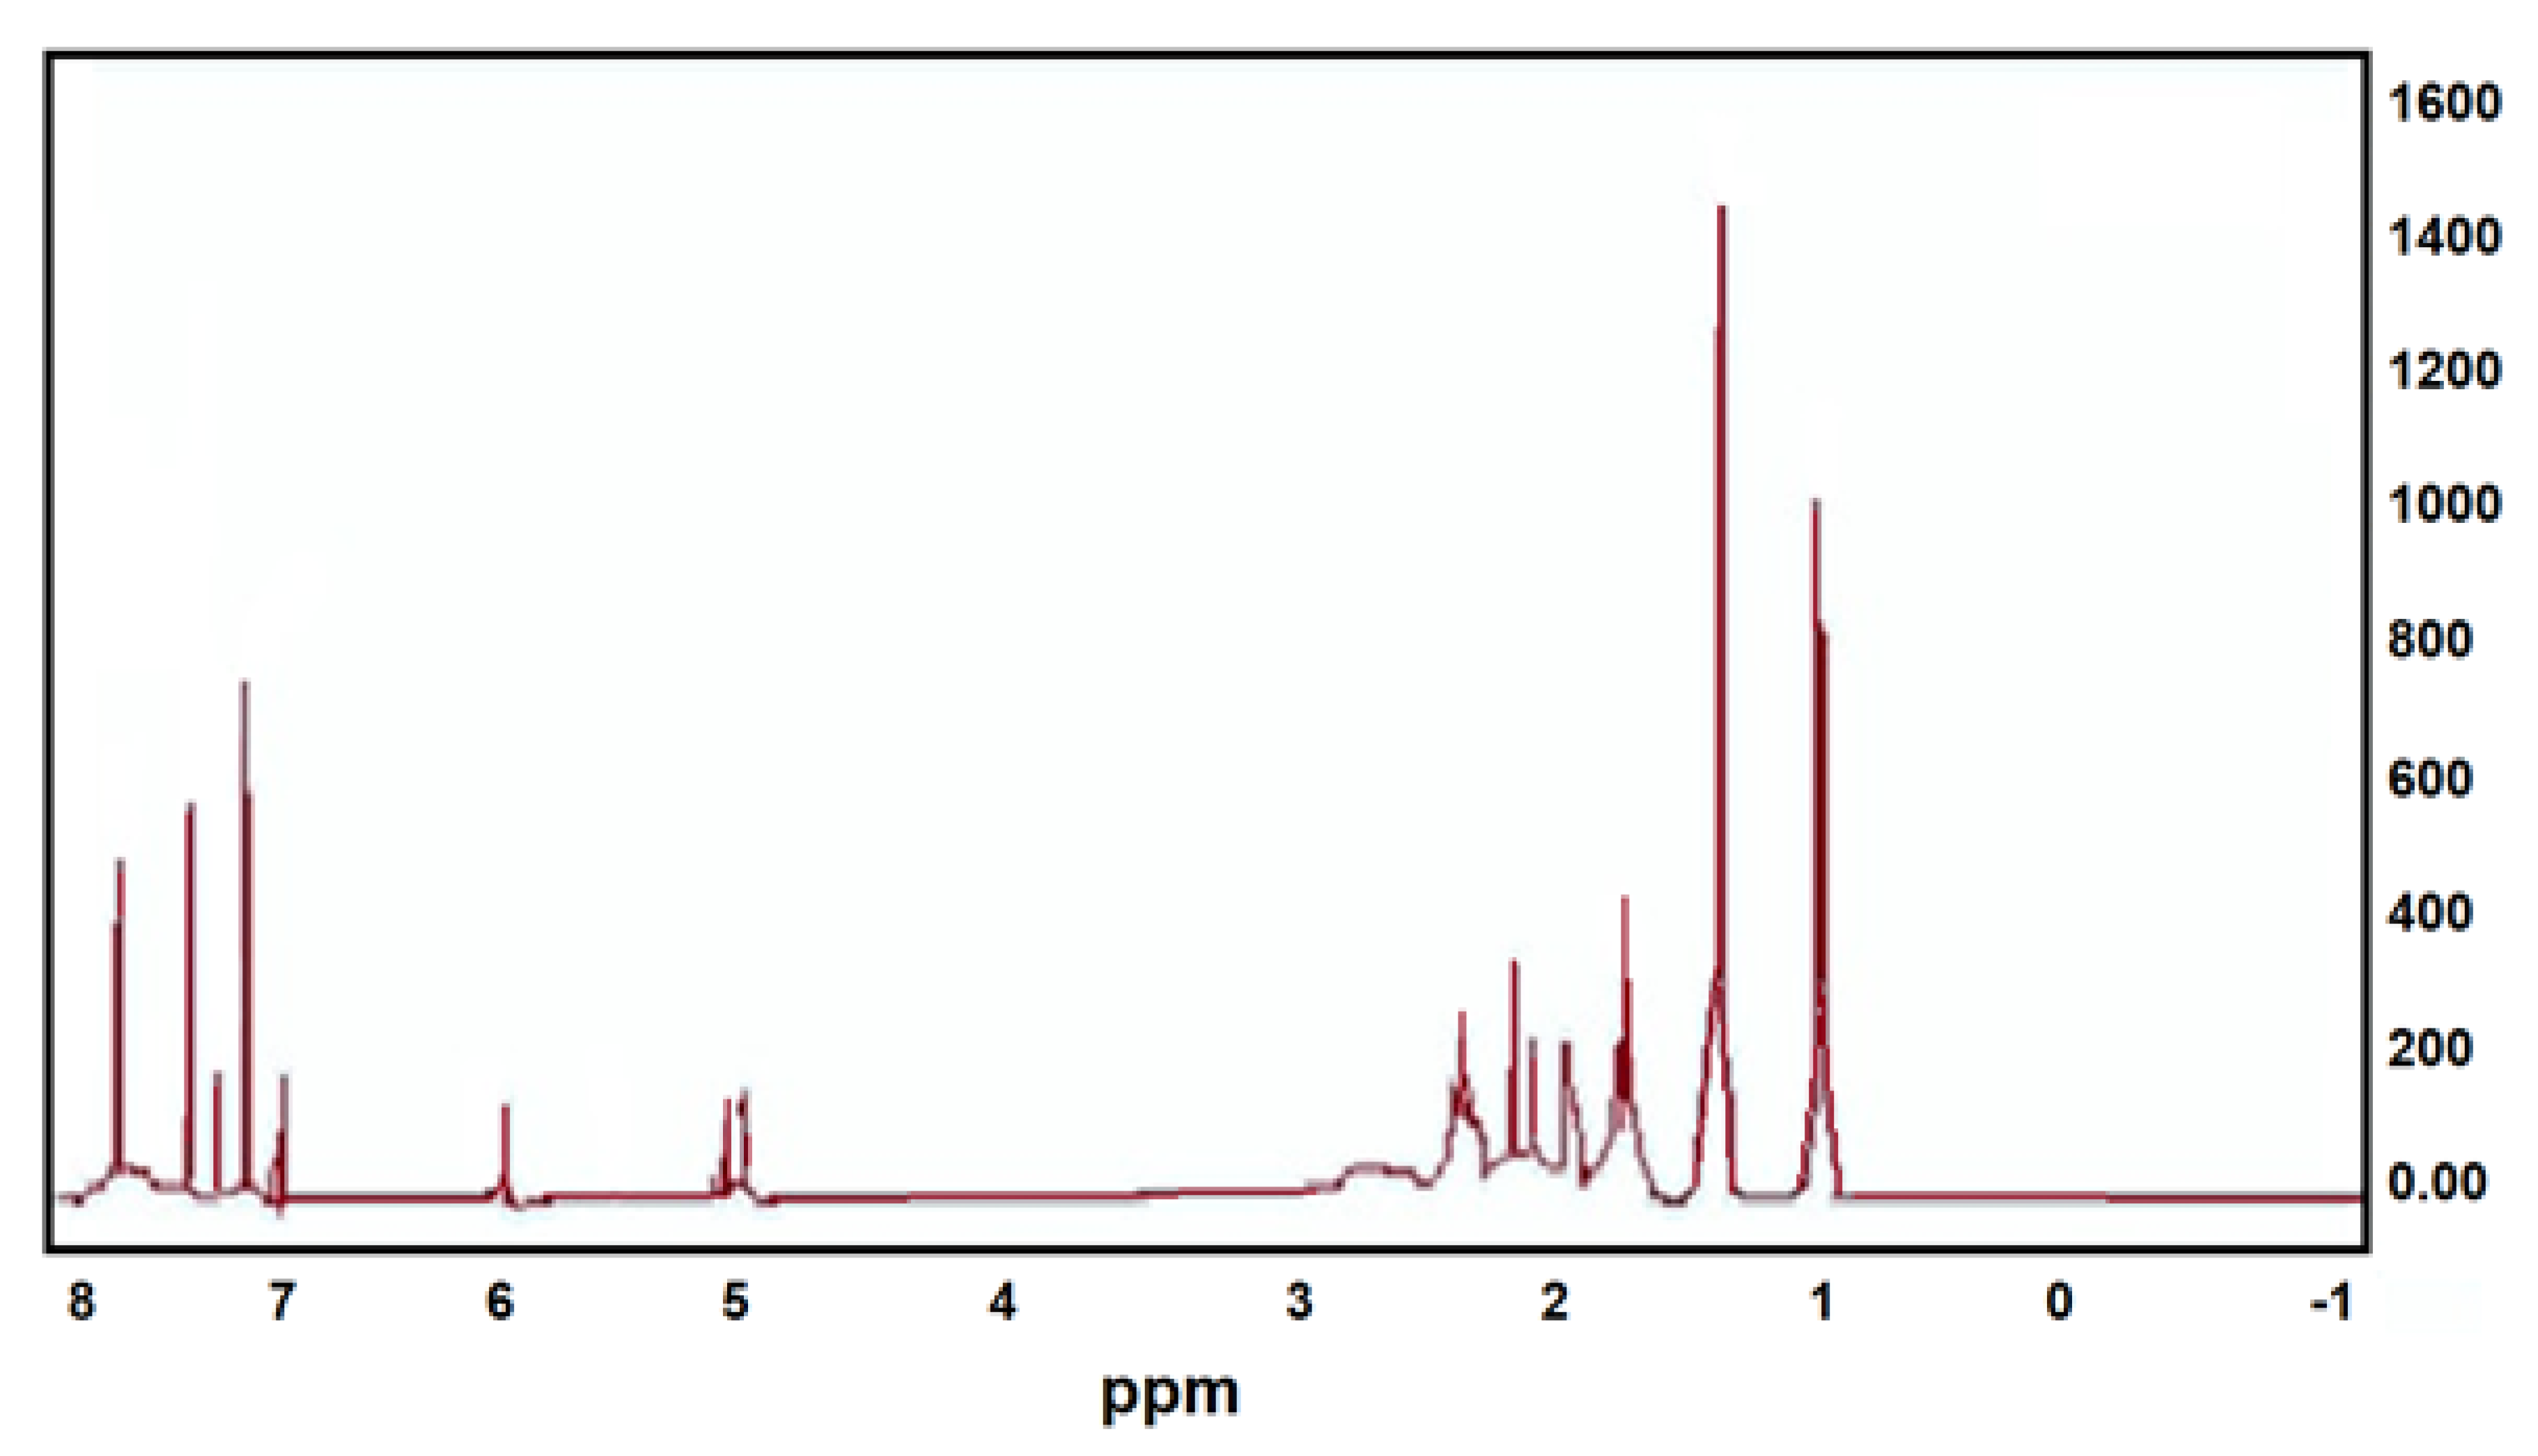
3.3. 1H NMR
3.4. TGA
3.5. FTIR Analysis
3.6. Calorific Value
3.7. Density and Viscosity
3.8. Flash Points and pH
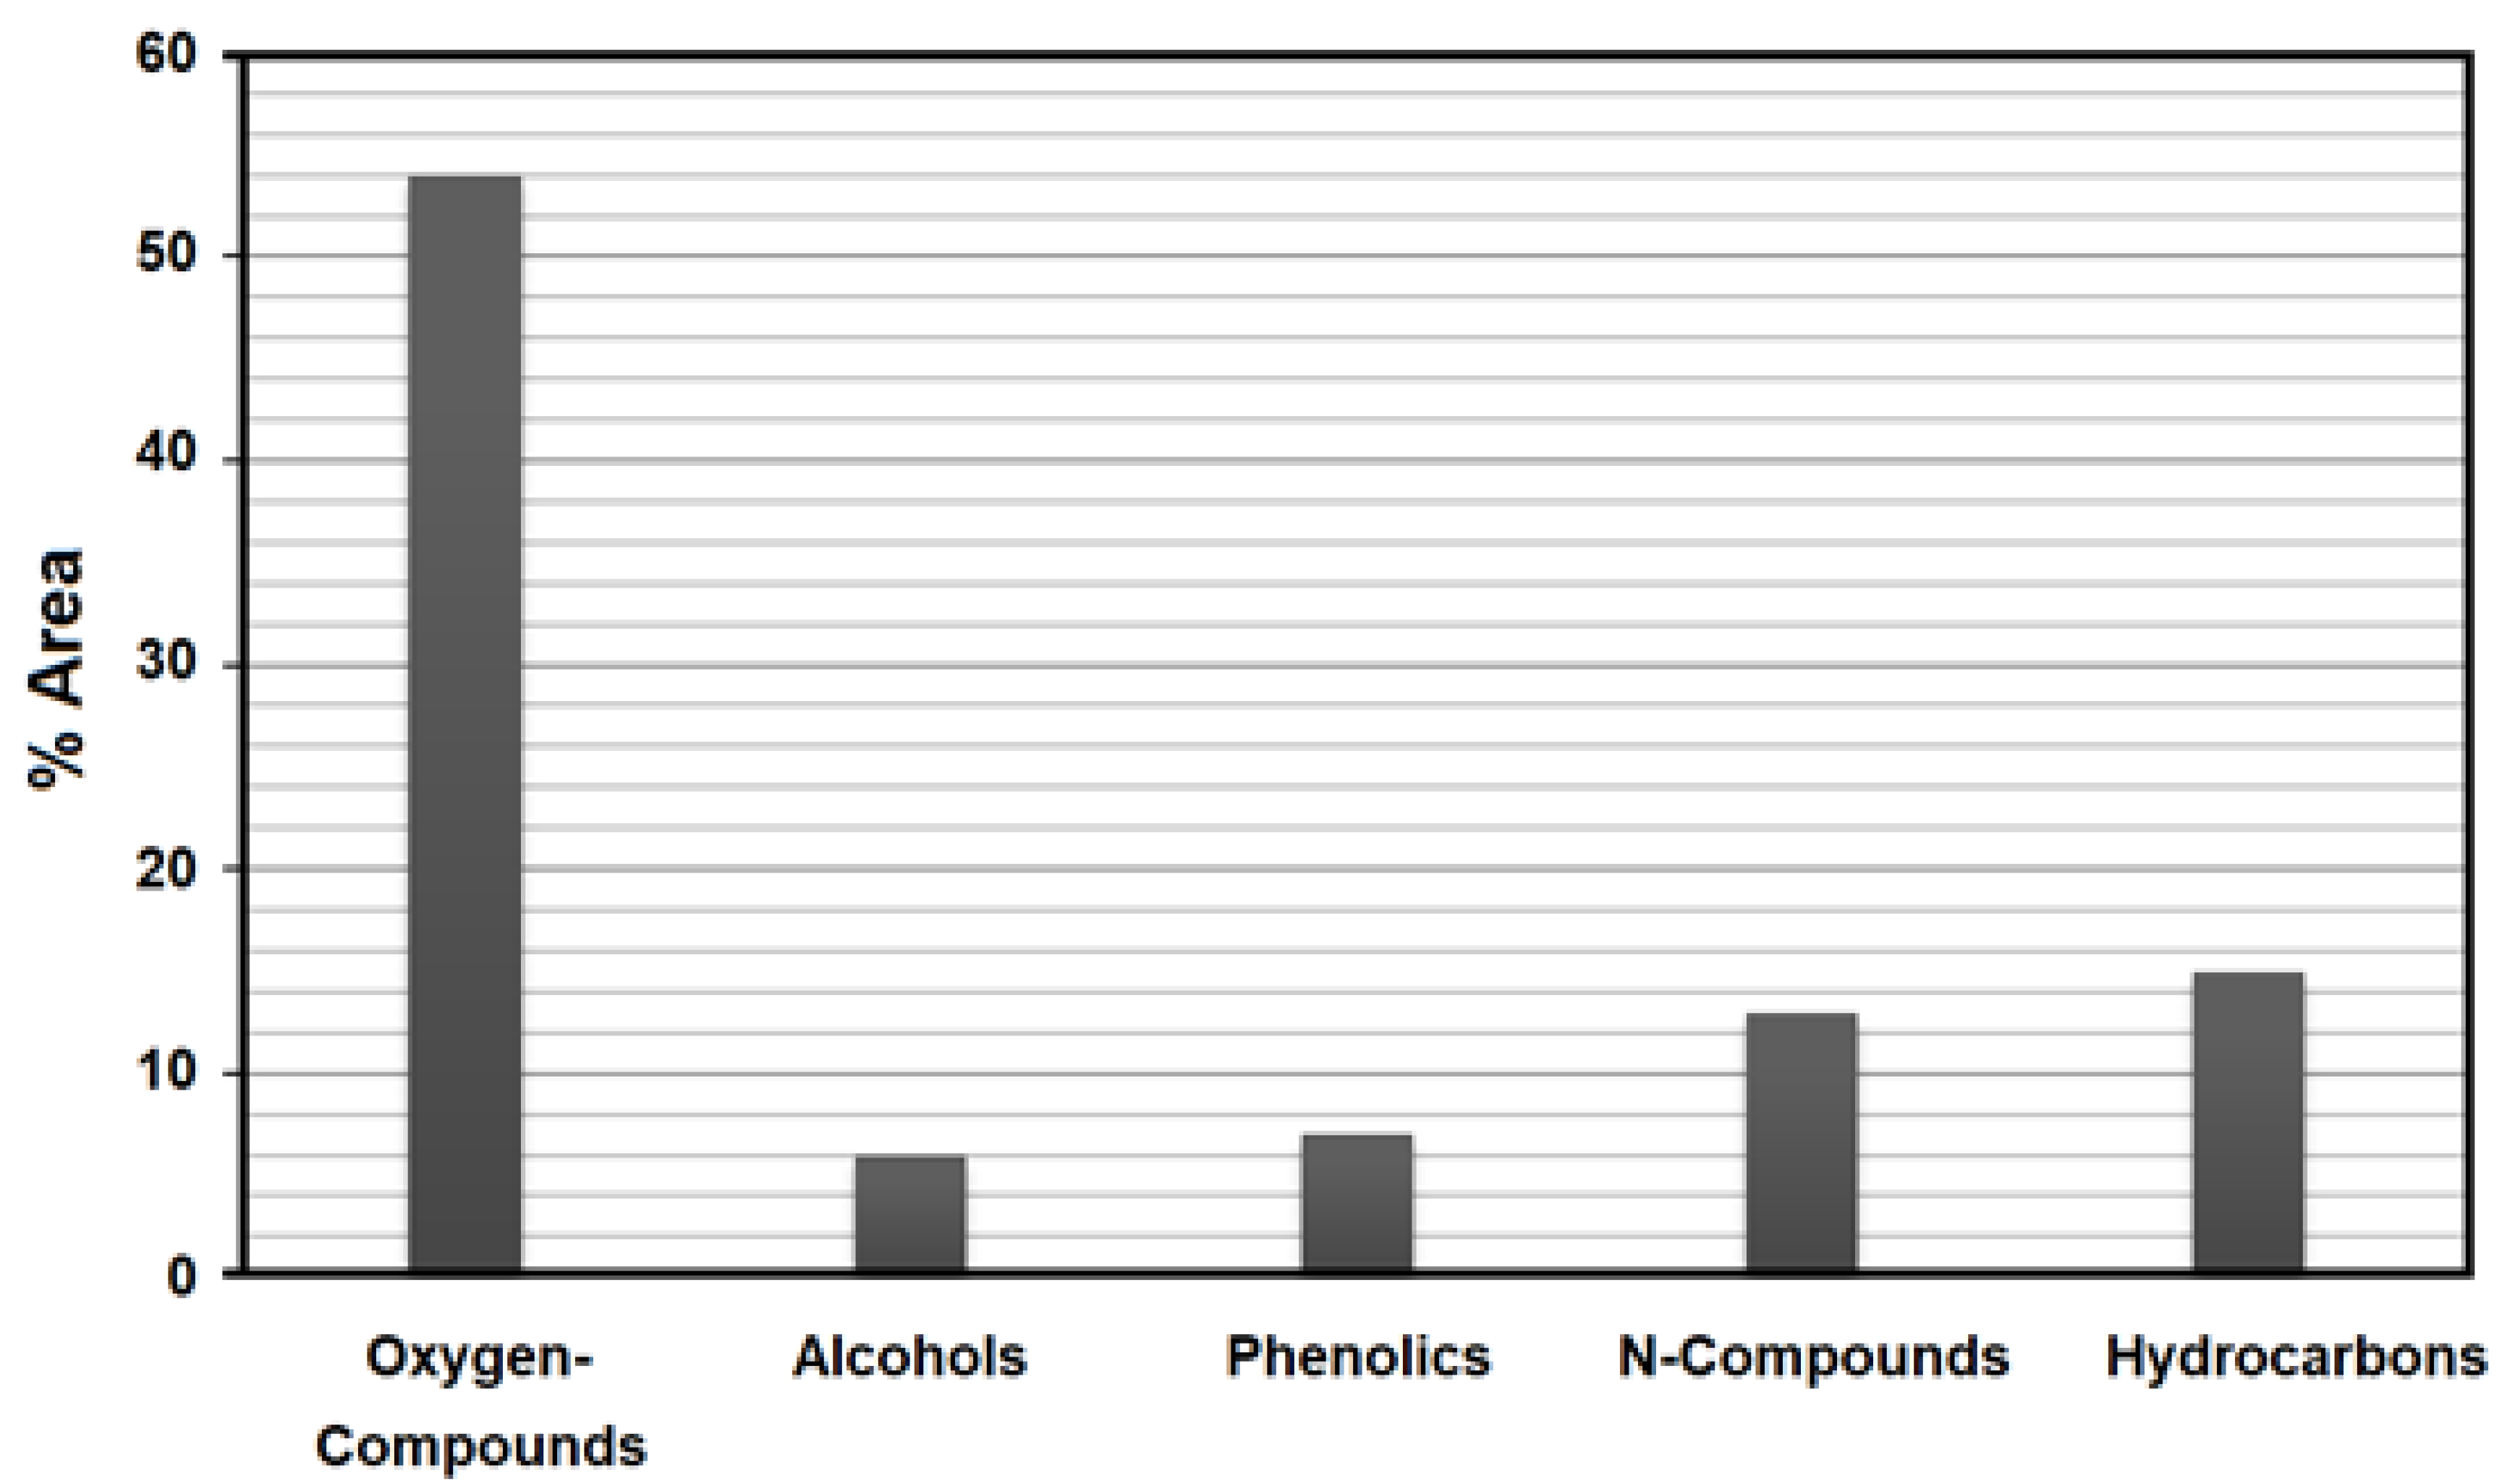
3.9. Chemical Composition
4. Conclusions
Author Contributions
Funding
Acknowledgments
Conflicts of Interest
References
- Wei, F.; Cao, J.-P.; Zhao, X.-Y.; Ren, J.; Gu, B.; Wei, X.-Y. Formation of aromatics and removal of nitrogen in catalytic fast pyrolysis of sewage sludge: A study of sewage sludge and model amino acids. Fuel 2018, 218, 148–154. [Google Scholar] [CrossRef]
- Veses, R.C.; Shah, Z.; Pelisson, L.; Caetano, N.R.; Silva, R.D.; Azevedo, C.M.N. Biodiesel Glycerides from the Soybean Ethylic Route Incomplete Conversion on the Diesel Engines Combustion Process. J. Braz. Chem. Soc. 2017, 28, 2447–2454. [Google Scholar] [CrossRef]
- Gomaa, M.A.; Gombocz, N.; Schild, D.; Mjalli, F.S.; Al-Harrasi, A.; Abed, R.M.M. Effect of organic solvents and acidic catalysts on biodiesel yields from primary sewage sludge, and characterization of fuel properties. Biofuels 2018, 1–9. [Google Scholar] [CrossRef]
- Areeprasert, C.; Chanyavanich, P.; Ma, D.; Shen, Y.; Yoshikawa, K. Effect of hydrothermal treatment on co-combustion of paper sludge with coal: Thermal behavior, NO emissions, and slagging/fouling tendency. Biofuels 2016, 8, 187–196. [Google Scholar] [CrossRef]
- Antony, D.; Murugavelh, S. Anaerobic co-digestion of kitchen waste and wastewater sludge: Biogas-based power generation. Biofuels 2016, 9, 157–162. [Google Scholar] [CrossRef]
- Sanchez, M.E.; Menendez, J.A.; Dominguez, A.; Pis, J.J.; Martinez, O.; Calvo, L.F.; Bernad, P.L. Effect of pyrolysis temperature on the composition of the oils obtained from sewage sludge. Biomass Bioenergy 2009, 33, 933–940. [Google Scholar] [CrossRef]
- Werther, J.; Ojada, T. Sewage sludge combustion. Prog. Energy Combust. Sci. 1999, 25, 55–116. [Google Scholar] [CrossRef]
- Piskorz, J.; Scott, D.S.; Westerberg, I.B. Flash pyrolysis of sewage sludge. Ind. Eng. Chem. Process Des. Dev. 1986, 25, 265–270. [Google Scholar] [CrossRef]
- Domínguez, A.; Menéndez, J.A.; Inguanzo, M.; Pis, J.J. Gas chromatographic-mass spectrometric study of the oil fractions produced by microwave-assisted pyrolysis of different sewage sludges. J. Chromatogr. A 2003, 1012, 193–206. [Google Scholar] [CrossRef]
- Shah, Z.; Veses, R.C.; Vaghetti, J.C.P.; Amorim, V.D.A.; da Silva, R. Preparation of jet engine range fuel from biomass pyrolysis oil through hydrogenation and its comparison with aviation querosene. Int. J. Green Energy 2019, 1–11. [Google Scholar] [CrossRef]
- Lu, G.Q.; Flow, J.C.; Lin, C.Y.; Lua, A.C. Surface area development of sewage sludge during pyrolysis. Fuel 1995, 74, 344–348. [Google Scholar] [CrossRef]
- Zakaria, R.; Harvey, A.P. Direct production of biodiesel from rapeseed by reactive extraction/in situ transesterification. Fuel Process. Technol. 2012, 102, 53–60. [Google Scholar] [CrossRef]
- Vassilev, S.V.; Baxter, D.; Andersen, L.K.; Vassileva, C.G.; Morgan, T.J. An overview of the organic and inorganic phase composition of biomass. Fuel 2012, 94, 1–33. [Google Scholar] [CrossRef]
- Shah, Z.; Renato, C.V.; Marco, A.C.; Rosangela, D.S. Separation of Phenol from Bio-oil Produced from Pyrolysis of Agricultural Wastes. Mod. Chem. Appl. 2017, 5, 1–8. [Google Scholar] [CrossRef]
- Wu, Q.; Zhang, B.; Grant, N.G. High yield of hydrocarbon gases resulting from pyrolysis of yellow heterotrophic and bacterially degradedChlorella protothecoides. J. Appl. Phycol. 1996, 8, 181–184. [Google Scholar] [CrossRef]
- Du, J.; Liu, P.; Liu, Z.; Sun, D.; Tao, C. Fast pyrolysis of biomass for bio-oil with ionic liquid and microwave irradiation. J. Fuel Chem. Technol. 2010, 38, 554–559. [Google Scholar] [CrossRef]
- Ji, Y.; Hou, Y.; Ren, S.; Yao, C.; Wu, W. Separation of phenolic compounds from oil mixtures using environmentally benign biological reagents based on Brønsted acid-Lewis base interaction. Fuel 2019, 239, 926–934. [Google Scholar] [CrossRef]
- Shah, Z.; Veses, R.C.; Silva, R.D. GC-MS and FTIR analysis of bio-oil obtained from freshwater algae (spirogyra) collected from Freshwater. Int. J. Environ. Agric. Res. 2016, 2, 134–141. [Google Scholar]
- Zhan, H.; Yin, X.; Huang, Y.; Zhang, X.; Yuan, H.; Xie, J.; Wu, C. Characteristics of NOx precursors and their formation mechanism during pyrolysis of herb residues. J. Fuel Chem. Technol. 2017, 45, 279–288. [Google Scholar] [CrossRef]
- Caetano, N.R.; Venturini, M.S.; Centeno, F.R.; Lemmertz, C.K.; Kyprianidis, K.G. Assessment of mathematical models for prediction of thermal radiation heat loss from laminar and turbulent jet non-premixed flames. Therm. Sci. Eng. Prog. 2018, 7, 241–247. [Google Scholar] [CrossRef]
- Wander, P.R.; Bianchi, F.M.; Caetano, N.R.; Klunk, M.A.; Indrusiak, M.L.S. Cofiring low-rank coal and biomass in a bubbling fluidized bed with varying excess air ratio and fluidization velocity. Energy 2020, 203, 117882. [Google Scholar] [CrossRef]
- Rahman, M.M.; Liu, R.; Cai, J. Catalytic fast pyrolysis of biomass over zeolites for high quality bio-oil—A review. Fuel Process. Technol. 2018, 180, 32–46. [Google Scholar] [CrossRef]
- Chen, T.; Wu, J.; Zhang, Z.; Zhu, M.; Sun, L.; Wu, J.; Zhang, D. Key thermal events during pyrolysis and CO2-gasification of selected combustible solid wastes in a thermogravimetric analyser. Fuel 2014, 137, 77–84. [Google Scholar] [CrossRef]
- Shah, Z.; Veses, R.C.; Silva, R.D. Using GC-MS to Analyze Bio-Oil Produced from Pyrolysis of Agricultural Wastes—Discarded Soybean Frying Oil, Coffee and Eucalyptus Sawdust in the Presence of 5% Hydrogen and Argon. J. Anal. Bioanal. Tech. 2016, 7, 1–7. [Google Scholar] [CrossRef] [Green Version]
- Li, H.; Yan, Y.; Ren, Z. Online upgrading of organic vapors from the fast pyrolysis of biomass. J. Fuel Chem. Technol. 2008, 36, 666–671. [Google Scholar] [CrossRef]
- Vaish, B.; Sharma, B.; Srivastava, V.; Singh, P.; Ibrahim, M.H.; Singh, R.P. Energy recovery potential and environmental impact of gasification for municipal solid waste. Biofuels 2017, 1–14. [Google Scholar] [CrossRef]
- Oyebanji, J.A.; Okekunle, P.O.; Lasode, A.O.; Oyedepo, S.O. Chemical composition of bio-oils produced by fast pyrolysis of two energy biomass. Biofuels 2017, 9, 479–487. [Google Scholar] [CrossRef]
- Caetano, N.R.; Silva, B.P. Technical and Economic Viability for the Briquettes Manufacture. Defect Diffus. Forum 2017, 380, 218–226. [Google Scholar] [CrossRef]
- Klunk, M.A.; Dasgupta, S.; Das, M. Influence of Fast Pyrolysis with Temperature on Gas, Char and Bio-oil Production. South. Braz. J. Chem. 2017, 25, 1–11. [Google Scholar]
- Parthasarathy, P.; Gupta, N.K.; Narayanan, K.S. Effect of composting on products of slow pyrolysis. Biofuels 2015, 6, 313–321. [Google Scholar] [CrossRef]
- Westover, T.L.; Phanphanich, M.; Clark, M.L.; Rowe, S.R.; Egan, S.E.; Zacher, A.H.; Santosa, D. Impact of thermal pretreatment on the fast pyrolysis conversion of southern pine. Biofuels 2013, 4, 45–61. [Google Scholar] [CrossRef] [Green Version]
- Veses, R.C.; Shah, Z.; Venturi, V.; Caetano, N.R.; da Silva, B.P.; Azevedo, C.M.N.; Da Silva, R.; Suarez, P.A.Z.; Oliveira, L.P. Production process of di-amyl ether and its use as an additive in the formulation of aviation fuels. Fuel 2018, 228, 226–233. [Google Scholar] [CrossRef]
- Caetano, N.R.; Veses, R.C.; Vielmo, H.A. Analysis of the Effect on the Mechanical Injection Engine Using Doped Diesel Fuel by Ethanol and Bio-Oil. Int. Rev. Mech. Eng. 2015, 9, 124–128. [Google Scholar] [CrossRef]
- Shah, Z.; Veses, R.C.; Silva, R.D. A Comparative Study and Analysis of Two Types of Bio-Oil Samples Obtained from Freshwater Algae and Microbial Treated Algae. Mod. Chem. Appl. 2016, 4, 1–7. [Google Scholar] [CrossRef] [Green Version]
- Demirel, Y. Lignin for Sustainable Bioproducts and Biofuels. J. Biochem. Eng. Bioprocess Technol. 2017, 1, 1–3. [Google Scholar]
- Shah, Z.; Veses, R.C.; Aguilhera, R.A.; Silva, R.D. Bio-Oil Production from Pyrolysis of Coffee and Eucalyptus Sawdust in the Presence of 5% Hydrogen. Int. J. Eng. Res. Sci. 2016, 2, 34–42. [Google Scholar]
- Caetano, N.R.; Stapasolla, T.Z.; Peng, F.B.; Schneider, P.S.; Pereira, F.M.; Vielmo, H.A. Diffusion Flame Stability of Low Calorific Fuels. Defect Diffus. Forum 2015, 362, 29–37. [Google Scholar] [CrossRef]
- Caetano, N.R.; Soares, D.; Nunes, R.P.; Pereira, F.M.; Schneider, P.S.; Vielmo, H.A.; van der Laan, F.T. A comparison of experimental results of soot production in laminar premixed flames. Open Eng. 2015, 5, 213–219. [Google Scholar] [CrossRef]
- Aboulkas, A.; El Harfi, K.; El Bouadili, A. Pyrolysis of olive residue/low density polyethylene mixture: Part I Thermogravimetric kinetics. J. Fuel Chem. Technol. 2008, 36, 672–678. [Google Scholar] [CrossRef]
- Yao, C.; Hou, Y.; Ren, S.; Wu, W.; Ji, Y.; Liu, H. Sulfonate based zwitterions: A new class of extractants for separating phenols from oils with high efficiency via forming deep eutectic solventes. Fuel Process. Technol. 2018, 178, 206–212. [Google Scholar] [CrossRef]


| No. | Sample (In Grams) | T (°C) | Liquid-Oil (% Weight) | Uncondensablegas (% Weight) | Residues (%Weight) | Water Fraction (% Weight) |
|---|---|---|---|---|---|---|
| 1 | 300 | 450 | 7 | 9 | 72 | 10 |
| 2 | 300 | 550 | 8 | 13 | 69 | 10 |
| 3 | 300 | 650 | 13 | 13 | 66 | 10 |
| No. | Compound’s Names | Formulas | Retention Time | Percent Area |
|---|---|---|---|---|
| 1 | Phenol | C6H6O | 09.01 | 2.77 |
| 2 | Phenol, 2-methyl- | C7H8O | 10.02 | 1.34 |
| 3 | Phenol, 3-methyl- | C7 H8O | 11.04 | 1.10 |
| 4 | Phenol, 2,5-dimethyl- | C8H10O | 12.02 | 1.69 |
| 5 | Azulene | C10 H8 | 14.00 | 1.30 |
| 6 | Naphthalene, 2-methyl | C11H10 | 15.02 | 1.40 |
| 7 | Naphthalene, 1-methyl- | C11H10 | 16.10 | 1.29 |
| 8 | 3-Heptadecene | C17H34 | 18.11 | 1.60 |
| 9 | 1-Pentadecene | C15H30 | 20.01 | 1.50 |
| 10 | Hexadecane | C18H38 | 21.10 | 1.31 |
| 11 | 1-Heptadecene | C17H34 | 23.11 | 1.36 |
| 12 | Tricosane | C23 H48 | 24.00 | 0.95 |
| 13 | Hexadecanenitrile | C16H31N | 25.21 | 2.20 |
| 14 | Methylhexadecanoate | C17 H34 O2 | 27.20 | 4.50 |
| 15 | Hexadecanoicacid | C16H32O2 | 29.22 | 5.10 |
| 16 | Hexadecanoic acid, ethyl ester | C18 H36 O2 | 30.10 | 3.75 |
| 17 | Triolein | C57H104O6 | 31.00 | 4.50 |
| 18 | Ethylpentadecanoate | C17 H34 O2 | 33.22 | 2.90 |
| 19 | Ethanone | C8 H12 O | 34.23 | 4.90 |
| 20 | Cyclohexene,3-(2-propenyl)- | C9H14 | 35.01 | 1.20 |
| 21 | Benzene, 1,3,5-trimethyl- | C9H12 | 36.38 | 0.75 |
| 22 | Decane | C10H22 | 37.22 | 1.15 |
| 23 | Cyclohexene,3-(2-propenyl)- | C9H14 | 38.34 | 1.19 |
| 24 | Toluene | C7H7 | 39.12 | 2.31 |
| 25 | Pyridine | C5H5N | 40.33 | 2.55 |
| 26 | Octadecenamide | C18H35NO | 42.11 | 2.35 |
| 27 | 1H-pyrrole | C4H5N | 43.33 | 2.45 |
| 28 | p-Cresol | C7H8O | 44.01 | 3.44 |
| 29 | Benzofuran | C8H6O | 45.33 | 2.98 |
| 30 | Chrysene | C18H12 | 46.11 | 2.34 |
| 31 | Furfuryl | C5H6O2 | 47.11 | 3.30 |
| 32 | Isoquinoline | C9H7N | 47.54 | 2.55 |
| 33 | Octadecenoicacid, methylester | C19 H36 O2 | 48.01 | 3.09 |
| 34 | Ethyl Oleate | C20H38O2 | 48.50 | 3.78 |
| No. | Compound’s Names | Percent Area | No. | Compound’s Names | Percent Area |
|---|---|---|---|---|---|
| 1 | Oxygen containing compounds | 54.12 | 4 | N-compounds | 13.10 |
| 2 | Alcohols | 6.20 | 5 | Esters | 0 |
| 3 | Phenolic | 7.21 | 6 | Hydrocarbons | 15.02 |
| Fractions | SSP | S-10 Diesel |
|---|---|---|
| Calorific Value (MJ kg−1) | 39.16 | 43.40 |
| Flash point (°C) | 70.00 | 63.00 |
| Density (g mL−1) at 25 °C | 0.8231 | 0.8354 |
| Viscosity (mm2 s−1) at 25 °C | 1.6274 | 1.8484 |
| T (K) | T (°C) | Volume (mL) | Mass (g) | ρ (g mL−1) S-10 Diesel | ρ (g mL−1) SSP |
|---|---|---|---|---|---|
| 283 | 10 | 11.955 | 10 | 0.8398 | 0.8364 |
| 293 | 20 | 11.999 | 10 | 0.8367 | 0.8334 |
| 303 | 30 | 12.141 | 10 | 0.8311 | 0.8236 |
| 313 | 40 | 12.211 | 10 | 0.8256 | 0.8189 |
| 323 | 50 | 12.294 | 10 | 0.8223 | 0.8134 |
| T(°C) | Flow Time (s) | T (K) | η (mm2/s) S-10 Diesel | η (mm2/s) SSP |
|---|---|---|---|---|
| 10 | 210 | 283 | 1.7625 | 1.6531 |
| 20 | 180 | 293 | 1.2131 | 0.9673 |
| 30 | 172 | 303 | 0.8827 | 0.8523 |
| 40 | 150 | 313 | 0.8343 | 0.8273 |
| 50 | 142 | 323 | 0.7434 | 0.7223 |
© 2020 by the authors. Licensee MDPI, Basel, Switzerland. This article is an open access article distributed under the terms and conditions of the Creative Commons Attribution (CC BY) license (http://creativecommons.org/licenses/by/4.0/).
Share and Cite
Shah, Z.; Veses, R.C.; Brum, J.; Klunk, M.A.; Rocha, L.A.O.; Missaggia, A.B.; Oliveira, A.P.d.; Caetano, N.R. Sewage Sludge Bio-Oil Development and Characterization. Inventions 2020, 5, 36. https://doi.org/10.3390/inventions5030036
Shah Z, Veses RC, Brum J, Klunk MA, Rocha LAO, Missaggia AB, Oliveira APd, Caetano NR. Sewage Sludge Bio-Oil Development and Characterization. Inventions. 2020; 5(3):36. https://doi.org/10.3390/inventions5030036
Chicago/Turabian StyleShah, Zeban, Renato Cataluña Veses, Jonatan Brum, Marcos Antônio Klunk, Luiz Alberto Oliveira Rocha, André Brum Missaggia, Andressa Padilha de Oliveira, and Nattan Roberto Caetano. 2020. "Sewage Sludge Bio-Oil Development and Characterization" Inventions 5, no. 3: 36. https://doi.org/10.3390/inventions5030036