Article

Designing of Cost-Effective and Low-Carbon Multi-Energy Nanogrids for Residential Applications

1
Italian National Agency for New Technologies, Energy and Sustainable Economic Development (ENEA), Energy Technologies Department—Portici Research Centre, P. E. Fermi, 1, IT-80055 Portici (Naples), Italy
2
Department of Mechanical, Energetic and Management Engineering—Via P. Bucci (Arcavacata di Rende), University of Calabria, 87036 Rende, Italy
*
Author to whom correspondence should be addressed.
Inventions 2020, 5(1), 7; https://doi.org/10.3390/inventions5010007
Submission received: 13 December 2019 / Revised: 8 January 2020 / Accepted: 17 January 2020 / Published: 21 January 2020

Abstract

:
Recently, hybrid multi-energy systems consisting of multiple generation, conversion, and storage technologies have been receiving great attention as a promising option to meet the multi-energy demands of residential end-users, by transforming them from passive consumers to active prosumers, who both produce and consume energy. The design problem of such systems is challenging due to the large number of degrees of freedom in the design and operation phases, so the system as a whole must be optimized. Moreover, both economic and low-carbon priorities should be considered in the design problem to foster an effective implementation and deployment. The aim of this paper was to present a methodology for the optimal design of multi-energy nanogrids (MENs) operating in grid-connected and islanded modes. Based on a pre-defined MEN superstructure, a multi-objective linear problem was established to find the types and sizes of the technologies in the MEN, with the aim to reduce the total annual cost and the fossil primary energy input, while satisfying the assigned time-varying user multi-energy demand. With reference to the latter, the thermal behavior of the building was simulated by using the dynamic simulation software TRNSYS. The Pareto frontier was found by minimizing a weighted sum of the total annual cost and fossil primary energy input, and the problem was solved by using branch-and-cut. In the numerical testing, a single-family house of 200 m2 located in Italy was considered as the residential end-user. Results show the effectiveness of the model for providing good balancing solutions for end-users based on economic and energetic priorities. Moreover, it was found that the MEN operating in grid-connected mode showed economic and environmental performances much better than those found for the configuration operating in islanded mode.

1. Introduction

1.1. Motivation

It is well known that Europe tends towards the goal of a “zero-emission” energy system, which will require a necessary and gradual (already begun) energy transition. This transition will have to be characterized by a continuous increase in the penetration of generation systems from renewable energy sources (RES), a massive increase in energy efficiency (with attention on the energy consumption of buildings) and, contemporarily, an increased use of the electrical energy carrier to meet the needs traditionally required for the direct use of fossil fuels (in particular, domestic heating and systems related to mobility and road transportation) [1,2]. In this future scenario, where RES will play an increasingly important role, it is crucial to consider their peculiar characteristics: non-programmability (for solar and wind sources); the uncertainty in the predictability of generation capacity; the general lack of time coincidence between production and demand linked to final energy uses.
Buildings are responsible for 40% of energy consumption and 36% of CO2 emissions in the EU. As a result, the topic of energy efficiency in buildings has assumed central importance in EU energy and environment policy-making. The goal is new buildings being nearly zero-energy buildings, i.e., buildings that have a very high energy performance. The energy performance of a building is determined based on the annual energy that is consumed in order to meet the different needs associated with its typical use and reflects the heating and cooling energy needs to maintain the envisaged temperature conditions of the building, as well as the domestic hot water needs. Furthermore, the low amount of energy required should be covered to a very significant extent by energy from RES produced on-site or nearby.
In most residential applications, user energy demands are usually met by the utility grid, conventional gas-fired boilers, and electric chillers. However, recently, along with the upstream grid as the main power supply, hybrid systems consisting of micro combined heat and power systems (µCHPs), photovoltaic (PV) systems, and storage units are being used to meet the energy demands of residential users, by transforming them from passive consumers to active prosumers, who both produce and consume energy [3]. These systems can be configured as multi-energy systems, including various generation, conversion, and storage technologies satisfying the users’ electrical, thermal, and cooling demand. The design problem of a hybrid multi-energy system is challenging and introduces a large number of degrees of freedom in the design and operation phases, so the system as a whole must be optimized, while satisfying the time-varying end-user multi-energy demand. Moreover, both economic and low-carbon priorities should be considered in designing these systems to foster an effective implementation and deployment. Therefore, in such a contest, novel solutions are needed to:
-
effectively integrate RES at local level;
-
demonstrate the economic benefits of hybrid multi-energy systems implementation at local level;
-
reduce primary energy consumption by giving priority to green energy sources and low-carbon solution technologies;
-
increase management efficiency by dynamically matching local electricity and thermal generation and consumption;
-
stimulate the development of a leading-edge market for energy-efficient technologies with new business models.

1.2. Literature Review

The issue of the optimization of hybrid systems has been widely investigated in the literature. In [4], a model based on mixed integer linear programming (MILP) was proposed for the optimization of a hybrid renewable energy system with a battery energy storage system in residential microgrids, in which the demand response of available controllable appliances was coherently considered in the proposed optimization problem with reduced calculation burdens. The intrinsic stochastic behavior of renewable energy and the uncertainty involving electric load prediction were taken into account through proper stochastic models. In [5], several renewable and non-renewable energy sources, like PV, fuel cell, and battery storage were integrated in a grid-connected hybrid energy system to supply energy demand. A multi-objective optimization model was proposed to solve the cost-emission problem of a battery/PV/fuel cell hybrid system in the presence of a demand response program. Two conflicting objective functions, namely minimization of the total cost of the hybrid system and a reduction in CO2 emissions, were the main goals of the proposed multi-objective model, which was solved through the weighted-sum method, and the best possible solution was selected by employing the fuzzy satisfying approach. An MILP approach was used to model the proposed cost-emission operation problem of the hybrid system. In [6], a combined model of multi-objective home energy management and a battery storage system with multiple residential consumers was proposed for the minimization of the total aggregated energy bill and total system peak load. In [7], a decision support tool was established for energy storage selection to find preferable energy storage technologies for a specific application, adopting a multi-objective optimization approach based on an augmented ε-constraint method, to account for technical, economic, and environmental objectives. In [8], a multicarrier energy hub system with the objective of minimizing the economy cost and the CO2 emissions of a residential building without sacrificing household comfort and increasing the exploitation of renewable energy in daily life was proposed. The energy hub combined the electrical grid and natural gas network, a gas boiler, a heat pump, a PV plant, and a photovoltaic/thermal (PV/T) system. In addition, to increase the overall performance of the system, a battery energy storage system was integrated. To evaluate the optimal capacity of each energy hub component, an optimization scheduling process was proposed and the optimization problem was solved with the YALMIP platform in MATLAB environment.
The optimal sizing of hybrid energy systems has been also widely addressed in the literature. In [9], different behaviors of RES, like wind turbines, fuel cells, and PV, were utilized to economically size a wind–fuel cell–PV hybrid system. In [10], the popular technique, genetic algorithm, was employed to calculate the best possible size and place of a wind–PV–battery–diesel hybrid system for installation in buildings in remote areas. In [11], a hybrid energy system including battery storage, fuel cell, and PV was ideally sized through the particle swarm optimization algorithm. In [12], with the aim of minimizing total investment cost and also considering environmental emission, the optimal size of a hybrid energy system consisting of a diesel generator, PV system, and battery storage was found. In [13], the Hybrid Big Bang–Big Crunch algorithm was employed to ideally size a wind–PV–battery hybrid system. In [14], an optimal sizing approach of hybrid micro-CHP systems defined on the basis of linear programming techniques, with the aim of taking advantage of rapid calculations even in the presence of a high number of variables, was proposed. In [15], the optimal sizing of a PV–wind–diesel hybrid energy system with battery storage was conducted using the multi-objective self-adaptive differential evolution algorithm for the city of Yanbu, Saudi Arabia. The multi-objective optimization approach was then used to analyze the loss of power supply probability, the cost of electricity, and the renewable factor. The design optimization of a distributed energy system was proposed in [16] to find the optimal configurations through economic and exergetic assessments. A multi-objective linear problem was formulated to reduce the total annual cost and increase the overall exergy efficiency, and the Pareto frontier, providing different design options for planners based on economic and sustainability priorities, was found by implementing the weighted-sum method.
Optimal sizing is also a key factor to attain a reliable supply at a low cost through hybrid energy systems operating in standalone mode. Therefore, there has been a growing interest to develop algorithms for design optimization in standalone hybrid energy systems. In [17] the optimal sizing, modeling, and performance analysis of a standalone PV–wind–battery hybrid energy system for an off-grid residential application in Ansons Bay, Tasmania, Australia was presented. The aim of the study was to find the optimal size of the PV plant, wind generation system, and battery storage to satisfy the varying load demand throughout the year, in order to maximize the utilization of RES. In [18], an optimization model based on integer programming was established for the adoption of stand-alone PV systems in the residential sector. The proposed model not only determined the optimal number of PV modules and batteries but also assessed the economic feasibility of the system through annualized cost. The model took into account site-specific data in finding the optimal sizes. In [19], a comprehensive review of recent developments in design optimization methodologies, as well as a critical comparison of single algorithms, hybrid algorithms, and software tools used for sizing standalone solar and wind hybrid energy system, was reported.
In [20], a multi-objective design of a hybrid system composed of PV, fuel cell, and diesel generator to supply electric power to an off-grid community in Kerman, south of Iran in the presence of an operating reserve and uncertainties of load and solar power, was proposed. In [21], an energy storage system design approach was proposed in the context of residential buildings with PV generation. The objective of this approach was to increase the matching between the local generation and consumption, as well as to decease the energy bill, using lithium ion batteries as a storage device. Such a system was modeled and simulated using real data of solar radiation and energy consumption from a typical residential household in Coimbra (Portugal). In [22], the sizing of residential storage (adding the battery storage system to an existing residential PV system) was performed in order to increase the cost-effectiveness.
The use of hybrid energy systems requires finding the solution to optimization problems including one or more objectives, such as sizing the system to minimize energy costs, system management to balance the uncertainty of energy produced, or reduction of environmental impacts. In [23], a number of optimization techniques developed from past to present to solve these problems and especially to determine the efficacy of multi-objective optimization approaches were discussed.

1.3. Aims and Contribution

The aim of this paper is to develop a model that allows the design of solutions, optimized through a multi-objective approach with a view to saving primary energy and reducing costs, of a hybrid energy system, according to the concept of a multi-energy nanogrid (MEN), suitable for integrating multiple generation, conversion, and storage technologies to satisfy the end-user multi-energy demand both in grid-connected mode and in islanded mode in terms of electricity supply. The investigated nanogrid is thus intended as a small-scale grid including several energy resources and storage units, which can work in grid-connected or in islanded mode. From the grid scale aspect, a nanogrid can be implemented in residential and commercial buildings with capacity in the range of 2–20 kW [24]. The short-term objective coincides with the economic objective linked to minimizing the investment and the operation and maintenance (O&M) costs of the MEN as well as the energy costs, while the long-term objective coincides with the minimization of fossil primary energy, aimed at the rational use of energy resources, which has, as a direct consequence, a reduction in the environmental impacts. To consider the two objective functions, a multi-objective optimization problem is formulated by following an MILP approach, and it is solved by using the weighted-sum method. The objective of the optimization model is to determine the design and operation strategy solutions on the Pareto frontier, i.e., the MEN configurations and corresponding operation strategies optimized according to the economic and the energetic objectives.
One of the strengths of the optimization model proposed is its applicability in real contexts, thus providing decision support to residential end-users in terms of planning the optimal MEN configuration according to economic and low-carbon priorities. This advantage is made possible thanks to the general mathematical formulation of the model, as well as to the proposed optimization method. Once the input data of the model have been assigned, such as user loads, local climate data, energy prices, and techno-economic data of the technologies proposed to be part of the MEN configuration, the proposed model makes it possible to obtain their optimized combination, in terms of types of technologies and relative sizes, as well as the corresponding operating strategies, through economic and energetic objectives. The proposed methodology may be also applied in off-grid applications, including isolated individual users in rural areas, where there is no possibility of connection to an electricity distribution network, through designing cost-effective and low-carbon nanogrids. Moreover, the proposed methodology is easily scalable and applicable to larger applications. In fact, in the case of a buildings’ cluster located in a well-defined area, and thus considering a microgrid application, the model can be applied through using the aggregated profiles of electrical and thermal loads of the microgrid’s users. In such a meaning, the microgrid would refer to a multi-input and multi-output energy system, based on the concept of “local production of energy for local consumption”, where the end-users can share the distributed generation systems.
In the numerical testing, a single-family house of 200 m2 located in the Italian climatic zone E, in the city of Turin, is considered as the residential end-user. To identify the hourly space heating and cooling profiles of the user, the thermal behavior of the building is simulated using the dynamic simulation software TRNSYS, whereas the electricity hourly profiles are built up considering the number of occupants, the use of appliances, and the lighting systems, and the domestic hot water hourly profiles are estimated based on the number of occupants. Two scenarios are investigated, where the MEN operates in grid-connected and islanded modes in terms of electricity supply. In both the analyzed scenarios, results show that the Pareto frontiers provide good balancing solutions for the end-user based on economic and energetic priorities. Moreover, the MEN operating in grid-connected mode shows economic and environmental performances much better than those found for the MEN operating in islanded mode.

2. System Description

The system under study was an MEN providing electrical and thermal energy to a residential building. A superstructure of the MEN was pre-established with a series of technologies for the generation, conversion, and storage of electrical and thermal energy to satisfy the electricity, thermal, and cooling demands of the building under investigation. In detail, the generation technologies included a micro combined heat and power (µCHP) system with an internal combustion engine as prime mover, a gas-fired auxiliary boiler, and a rooftop PV system; the conversion technologies included a reversible electric heat pump and a single-stage absorption chiller; whereas the storage technologies included a battery and thermal energy storages for thermal and cooling purposes. The superstructure of the MEN under consideration with the energy technologies and the detailed energy flows among the technologies is shown in Figure 1 and Figure 2. The end-user electricity demand could be satisfied by the µCHP, the rooftop PV, the battery, and the power grid. The end-user thermal energy demand (space heating and domestic hot water) could be satisfied by the µCHP, the auxiliary boiler, the heat pump, and the thermal storage. The end-user cooling demand could be satisfied by the heat pump, the absorption chiller powered by the µCHP, and the auxiliary boiler, and the thermal storage. With reference to the end-user energy demand, the thermal behavior of the building was simulated using the dynamic simulation software TRNSYS for obtaining the hourly space heating and cooling profiles. The electricity hourly profiles were built up considering the number of occupants, the use of appliances, and the lighting systems, whereas the domestic hot water hourly profiles were estimated based on the number of the occupants.

3. Optimal Design Model

Based on the pre-defined MEN superstructure, the problem was to find the optimal design of the system, by determining the types and sizes of the generation, conversion, and storage technologies in the MEN, with the objective of reducing the total annual cost and the total annual fossil primary energy input to the MEN, while satisfying the time-varying user multi-energy demand. In the following, the objective functions and the decision variables are defined in Section 3.1 and Section 3.2, respectively. The problem constraints are established in Section 3.3, and the multi-objective optimization method is discussed in Section 3.4.

3.1. Objective Functions

The optimization problem presents the economic and the energetic objectives. The economic objective was to minimize the total annual cost CMEN of the MEN, consisting of the sum of the following functions [16]:
F C I N V = i C R F i ( C c , i S i ) ,       C R F i = r ( 1 + r ) N i / [ ( 1 + r ) N i 1 ]
F C o & M = i d h r O M i g i , d , h r D t
F C g a s = i { μ C H P ,   A B } d h r P g a s ( g i , d , h r / ( η i L H V g a s ) ) D t
F C P G = d h r P e , h r E P G , d , h r D t
The total annualized investment cost of all technologies is represented in Equation (1), and it was calculated as the product of the capital recovery factor of the technology i (a parameter), the specific capital cost of the technology (a parameter), and its designed size (a continuous decision variable). The capital recovery factor depends on the lifetime of the technology and the interest rate, according to the formula in (1). The total annual O&M cost of all technologies is represented in Equation (2), and it was calculated through multiplying the specific O&M cost of the technology i (a parameter) by the generation level of the technology at hour hr of day d (a continuous decision variable), and the length of the time interval (1 h). Note that for the battery and thermal storages, the O&M costs were calculated through their capacities. The total cost associated with natural gas is defined in Equation (3), and it was calculated through multiplying the gas price (a parameter) by the total amount of gas consumed by the µCHP and the auxiliary boiler (dependent decision variables), which depended on their generation levels at hour hr of day d (continuous decision variables) and their conversion efficiencies (parameters). The total cost of buying grid power, formulated in Equation (4), was calculated as the product of the time-varying unit price of electricity from the grid (a parameter) and the total amount of electricity taken from the grid (a continuous decision variable).
In the design optimization problem, the efficiencies, as well as the specific capital and O&M costs were assumed constant, not varying with the sizes. This assumption was reasonable, considering the residential application and thus the expected small variation in the designed sizes for the considered energy technologies.
The energetic objective was to minimize the total annual fossil primary energy input to the MEN, PEMEN, consisting of the sum of the following functions:
F P E g a s = i { μ C H P ,   A B } d h r ( g i , d , h r / ( η i L H V g a s ) ) D t
F P E e l = d h r ( E P G , d , h r / η e , r e f ) D t
The total primary energy associated with the natural gas is formulated in Equation (5) and was equal to the total amount of natural gas consumed by the µCHP and the auxiliary boiler (dependent decision variables), which depended on their generation levels at hour hr of day d (decision variables) and their conversion efficiencies (parameters). The total primary energy associated with the electricity taken from the grid is formulated in Equation (6) and it was calculated through dividing the total amount of the electricity taken from the grid (decision variable) by a reference electrical efficiency, depending on the power generation plants characteristics in the related country (a parameter).

3.2. Decision Variables

In the optimization problem, the decision variables included both binary and continuous ones. The binary variables represented the existence and the operation status (on/off) of the energy technologies. The continuous variables included: sizes of the technologies and their generation levels; capacities of battery and thermal storages; power input and output to/from battery; heating and cooling rate input/output to/from thermal storages; and power taken from the utility grid.

3.3. Constraints

The constraints of the optimization problem consisted of design and operation constraints for the energy technologies, and energy balances constraints, as discussed in the following.

3.3.1. Design Constraints for Energy Technologies in the Multi-Energy Nanogrid

The main design constraint of the energy technologies in the MEN is formulated below:
S i m i n x i S i S i m a x x i ,   i ,
This constraint ensured that the designed size of the technology i was within the limits available in the market. The binary decision variable, xi, was equal to 1 if the technology was chosen to be part of the MEN configuration.
The design constraint for the rooftop PV is formulated below:
A P V A m a x ,
which ensured that the total designed area was lower than the available one.

3.3.2. Operation Constraints for Energy Technologies in the Multi-Energy Nanogrid

The common constraint for generation and conversion technologies in the MEN was the capacity constraint, formulated below by taking the µCHP as an example [16]:
E μ C H P m i n x μ C H P , d , h r E μ C H P , d , h r E μ C H P m a x x μ C H P , d , h r ,   d , h r .
This constraint ensured that for each hr of day d, the power provided by the µCHP was limited by its minimum part load and the size, if the technology was on, i.e., the binary decision variable xµCHP,d,hr is equal to 1.
In the following, the additional operation constraints of generation, conversion, and storage technologies are presented.

Operation Constraints for Generation Technologies

The generation technologies in the MEN included the µCHP, the auxiliary boiler, and the rooftop PV. The operation constraints for the µCHP are formulated below:
G μ C H P , d , h r = E μ C H P , d , h r η e , μ C H P L H V g a s , d , h r ,
H μ C H P , d , h r = E μ C H P , d , h r η t h , μ C H P η e , μ C H P , d , h r ,
H μ C H P , d , h r = H μ C H P , d , h r T h + H μ C H P , d , h r S C , d , h r ,
The amount of natural gas required by the µCHP to provide electricity is formulated in Equation (10), and the amount of heat recovered by the µCHP is formulated in Equation (11). Equation (12) was established to link the amount of heat recovered by the µCHP to the shares used to meet the thermal demand and to meet the cooling demand through the absorption chiller.
The operation constraints for the auxiliary boiler were similar and they are formulated below:
G A B , d , h r = H A B , d , h r η t h , A B L H V g a s , d , h r ,
H A B , d , h r = H A B , d , h r T h + H A B , d , h r S C , d , h r ,
The operation constraint for the rooftop PV is formulated below:
E P V , d , h r = A P V η P V I d , h r , d , h r ,
which links the electricity provided by the rooftop PV to the area to be installed and the hourly solar irradiance through the electrical efficiency.

Operation Constraints for Conversion Technologies

The conversion technologies in the MEN included reversible heat pumps and single-stage absorption chillers. Reversible heat pumps may be involved in meeting the thermal and cooling demand in heating and cooling mode, respectively. The related operation constraint valid for the heating mode is formulated as:
E H P , d , h r H M = H H P , d , h r H M C O P H P H M , d , h r ,
which links the electricity required by the heat pump to the heat rate provided through its coefficient of performance. The constraint was similar for the heat pump operating in cooling mode.
Absorption chillers could be implemented to meet the cooling demand, powered by the heat from µCHP and auxiliary boiler. The related operation constraint is formulated below:
C A C h i l , d , h r = ( H μ C H P , d , h r S C + H A B , d , h r S C ) C O P A C h i l , d , h r ,
which links the cooling rate provided by the absorption chiller to the amount of heat provided by the µCHP and the auxiliary boiler through its coefficient of performance.

Operation Constraints for Storage Technologies

The storage technologies included a battery and thermal energy storage systems for heating and cooling purposes.
The operation constraints for the battery are formulated below:
0 E B a t , d , h r C h x B a t , d , h r C h E B a t , d , h r C h , m a x ,   d , h r ,
0 E B a t , d , h r D i s c h x B a t , d , h r D i s c h E B a t , d , h r D i s c h , m a x ,   d , h r ,
x B a t , d , h r C h + x B a t , d , h r D i s c h 1 ,   d , h r ,
S O C B a t , d , h r = S O C B a t , d , h r 1 + E B a t , d , h r C h η B a t C h E B a t , d , h r D i s c h / η B a t D i s c h ,   d , h r ,
S O C B a t , d , h r m i n S O C B a t , d , h r S O C B a t , d , h r m a x ,   d , h r .
The charging/discharging power limits of the battery are enforced in Equations (18)–(20), whereas the battery state-of-charge (SOC) is defined in Equation (21) and the limit of SOC is enforced by Equation (22).
As for the thermal storage systems, the operation constraint is formulated as:
H T E S , d , h r s t o = H T E S , d , h r 1 s t o ( 1 φ T E S ( D t ) ) + ( H T E S , d , h r C h H T E S , d , h r D i s c h ) D t ,   d , h r ,
meaning that the energy stored at hour hr depended on the non-dissipated energy stored at the previous hour (based on the storage loss fraction), and on the net energy flow.

3.3.3. Energy Balances Constraints

The energy balances constraints are formulated below for electricity and thermal demand:
E d , h r d e m + E H P , d , h r = E P V , d , h r + E μ C H P , d , h r + E P G , d , h r + E B a t , d , h r D i s c h E B a t , d , h r C h , d , h r ,
H d , h r d e m = H μ C H P , d , h r T h + H A B , d , h r T h + H T E S , d , h r D i s c h H T E S , d , h r C h , d , h r .
The energy balance for the cooling demand can be formulated in a similar way.

3.4. Multi-Objective Optimization Method

With the economic and the energetic objectives formulated in Section 3.1, the problem had two objective functions to be minimized. To solve this multi-objective optimization problem, the weighted-sum method was used, and a single objective function was formulated as:
F o b j = c ω C M E N + ( 1 ω ) P E M E N ,
where c is a constant scaling factor chosen to have two objectives of the same order of magnitude, and ω is the weight varying in the interval 0–1. In detail, with ω = 1, it is possible to find the solution that minimizes the total annual cost, whereas with ω = 0, it is possible to find the solution that minimizes the total annual fossil primary energy input to the MEN. Instead, the Pareto frontier can be found by varying the weight ω in the interval ]0, 1[. A detailed flowchart of the multi-objective optimization problem formulated above is shown in Figure 3.
Given the input data of the model, such as user multi-energy demand, energy prices, solar irradiance profiles, and techno-economic information of the energy technologies proposed to be part of the MEN configuration, the proposed model makes it possible to obtain their optimized combination, in terms of types of technologies and relative sizes, as well as the corresponding operating strategies, through economic and energetic objectives.
The problem formulated through Equations (1)–(26) was linear and involved both discrete and continuous variables. Branch-and-cut, which is powerful for MILP problems, was therefore used to solve it.

4. Italian Case Study
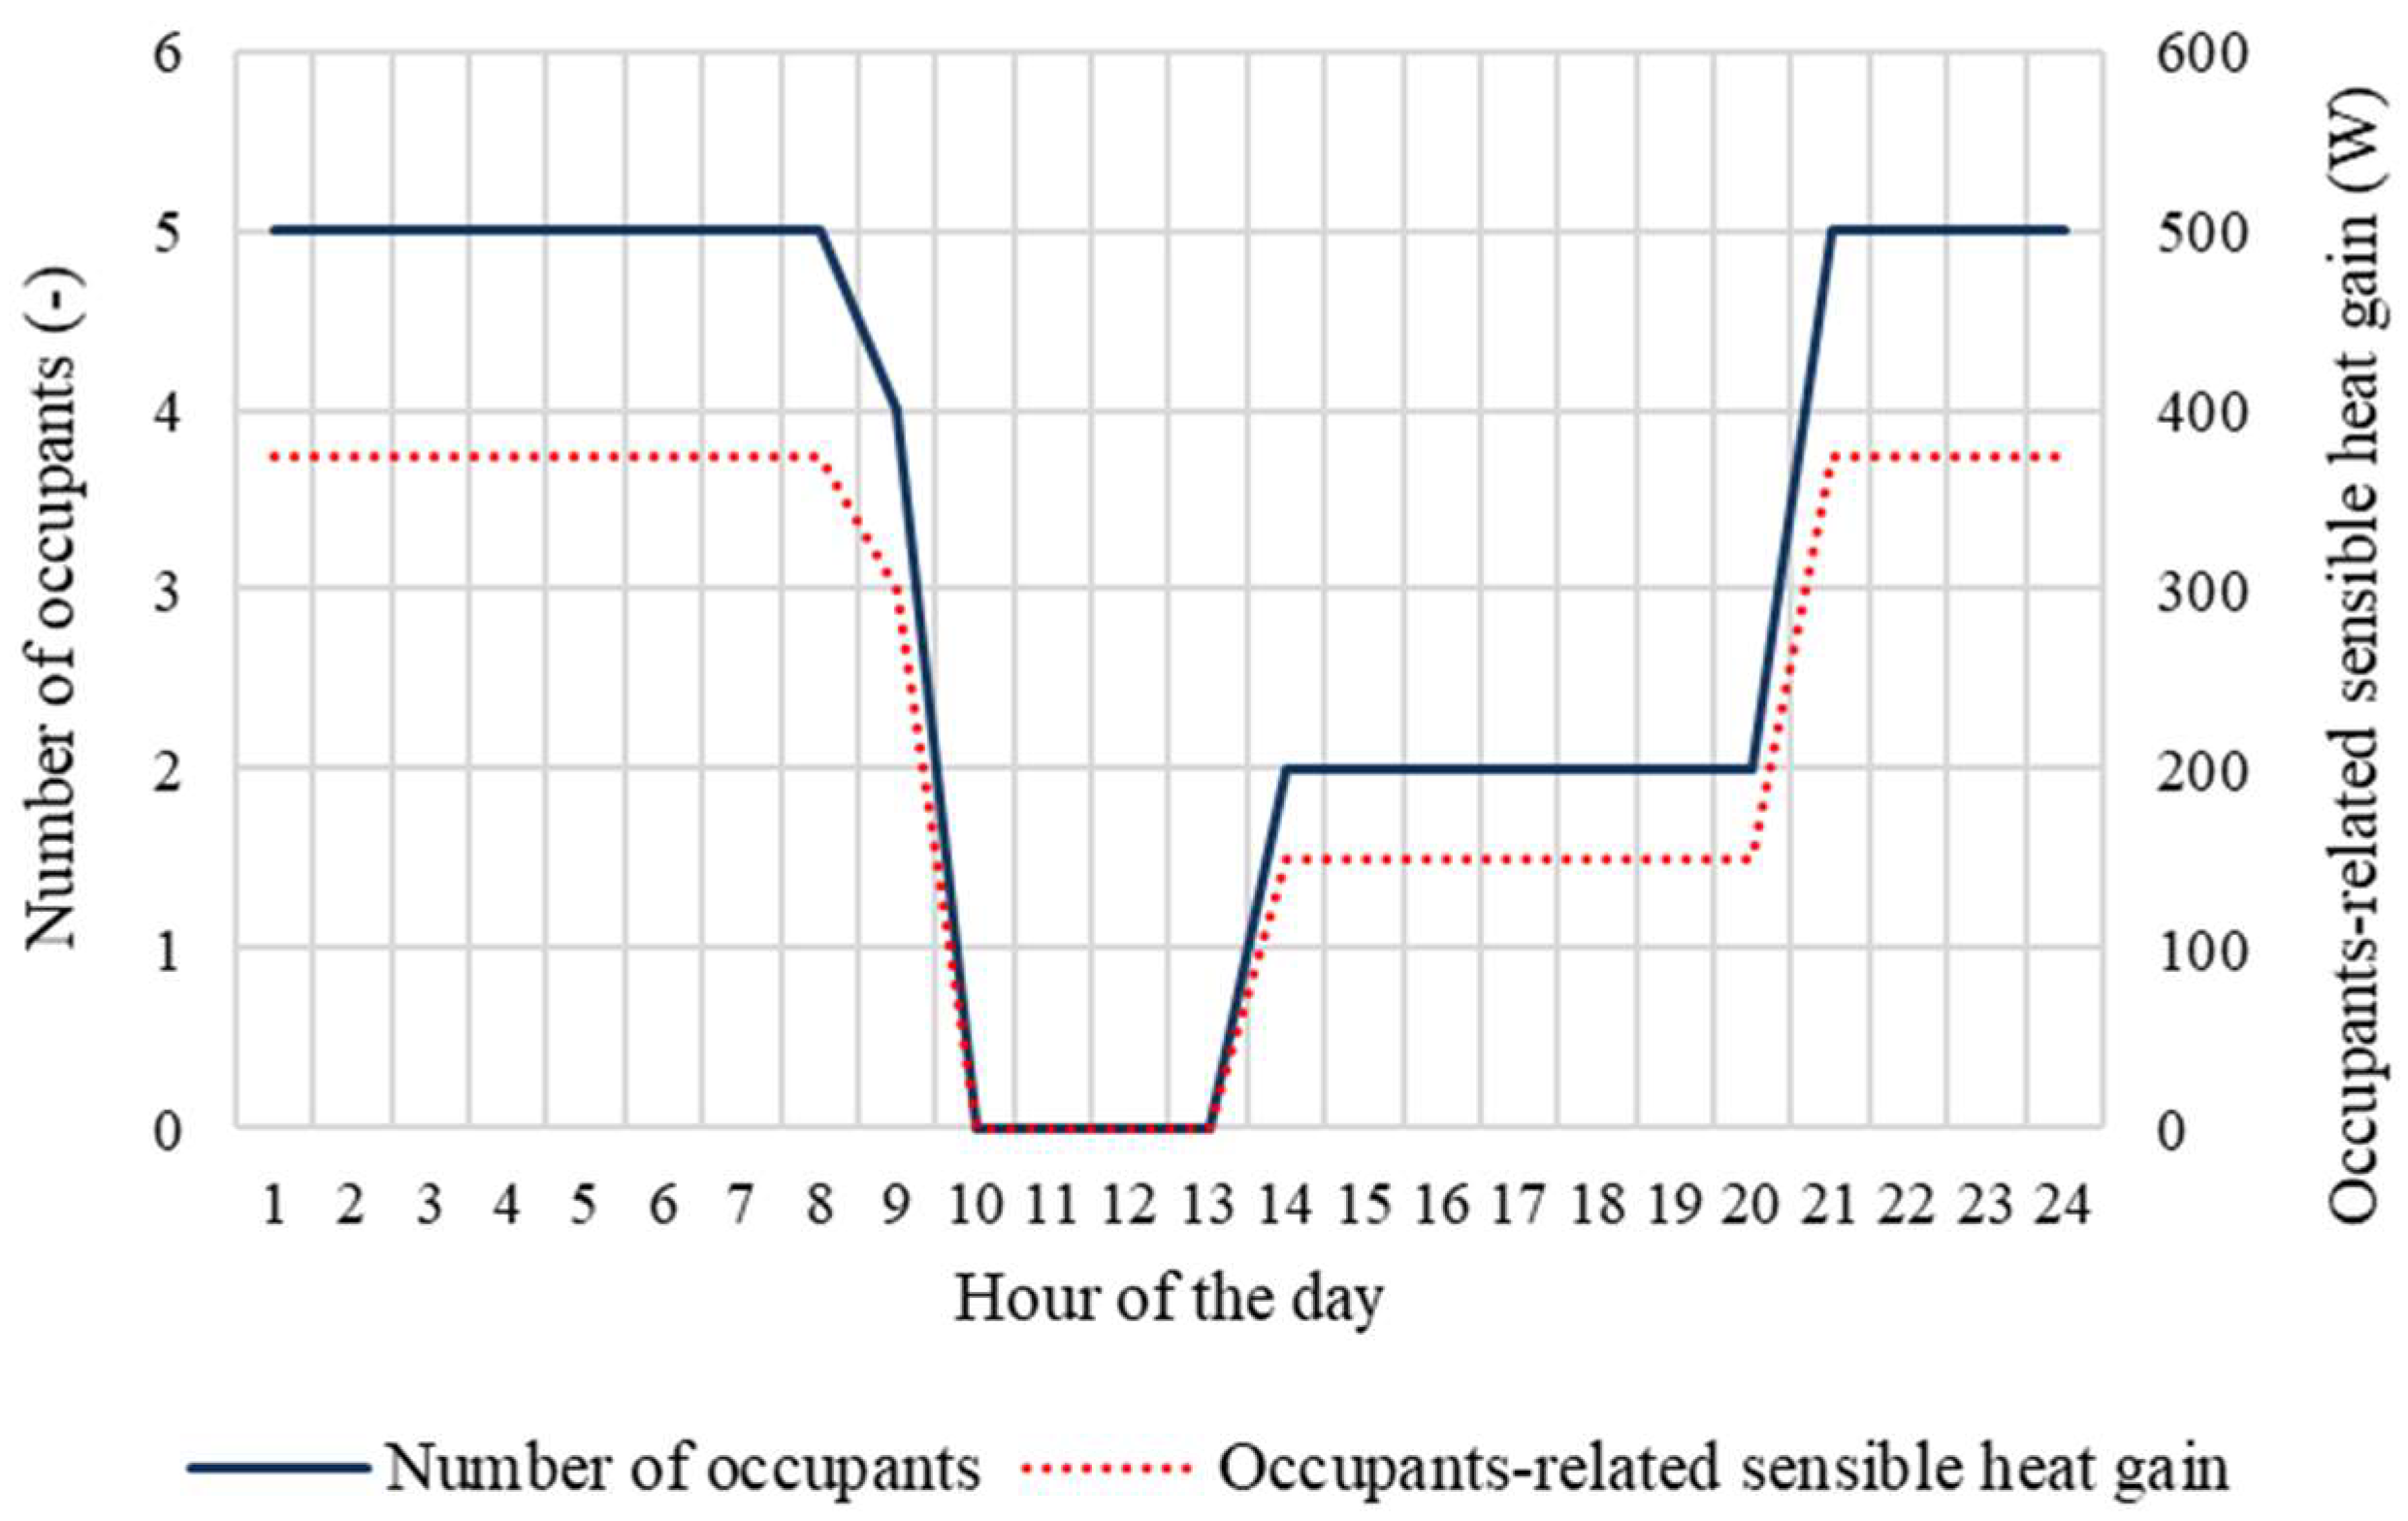
4.1. Energy Demand

The end-user was assumed to be a single-family house with a usable floor area of 200.0 m2, and net height equal to 3.0 m, located in the Italian climatic zone E, in the city of Turin.
The hourly energy demands for space heating and cooling were evaluated through the dynamic simulation software TRNSYS 17. The considered building was divided into eight rooms (living, kitchen, two baths, three bedrooms, and a lobby), and each room was modeled as a different thermal zone, as shown in Figure 4.
The Type56 of TRNSYS was used to model the thermal behavior of the building, and the TRNSYS 3D plug-in for Google SketchUp to draw the multi-zone building and import the geometry from the SketchUp interface into the TRNSYS building environment (TRNBuild). By importing the building in TRNSYS Simulation Studio Interface, the weather data and the ground temperature, evaluated according to the Hadvig relation, relative to the city of Turin, were assigned. The construction of the opaque components of the building was defined so that the wall transmittance of the external walls, the roof, and the ground floor were set equal to 0.34, 0.30, and 0.33 W/m2/K, respectively. For the windows, the glazing and frame transmittance were set equal to 6.56 and 1.53 W/m2/K, respectively [25], and the area of each window was defined as the 12.5% of the useful area of the zone where the window is located [26]. For each thermal zone, the air exchange rate was assumed to be equal to 0.28 h−1 [27]. According to the Italian Law [25], for the climatic zone E, the duration of the heating season goes from 15 October to 15 April. As a consequence, for each thermal zone, the indoor air temperature was controlled during this time interval by setting the set-point temperature for daytime (6.30 a.m. to 11 p.m.) and night-time heating at 21 °C and 15 °C, respectively. Moreover, for each thermal zone, a set-point temperature equal to 26 °C was set to control the indoor temperature during the cooling season, from June to August. Heat coming from occupants, household appliances, and lighting systems were assumed to contribute to the internal gains of the building. In detail, the number of the occupants was fixed at 5 and the sensible heat coming from each one was assumed to be equal to 75.0 W, considering light work/typing as the degree of activity, according to the Standard ISO 7730 [26]. The number of occupants and occupants-related sensible heat gain as a function of the time are shown in Figure 5.
The hourly electricity demand of the building was built up by considering the number of occupants, the use of appliances, and of the lighting systems. Typical household appliances (fridge, washing machine, dish washer, hair-dryer, flat iron, PC, TVs), and lighting systems composed of LED lamps were considered. For each zone, the total electrical power of the lighting system was calculated depending on the type of lamps, intent-of-use of the zone, and its useful area, whereas the thermal power coming from each lamp was assumed to be equal to 75% of its nominal electrical capacity. To take into account the heat gains coming from the household appliances and lighting systems, the sensible heat flux related to their usage was estimated. In detail, it was assumed to be transferred to the indoor air by both radiation (70%) and convection (30%) [28]. The schedule of the household appliances and lighting systems was assumed to be the same for each day of the year [29,30,31].
The outputs of the TRNSYS simulation were the hourly profiles for space heating and space cooling of the building for the entire heating and cooling season, respectively. Starting from these, the hourly energy rate demand for space heating and space cooling was built up for four representative season days. In detail, the year was assumed to be composed of 90 days in the cold season, from December to February; 92 days in the cold mid-season, from 15 October to 30 November and from 1 March to 15 April; 91 days in the hot mid-season, from 15 April to 31 May and from 1 September to 15 October; 92 days in the hot season, from June to August. Therefore, the hourly energy rate demands for space heating and space cooling for each representative season day were evaluated as the average of the hourly mean values of the space heating and space cooling, respectively, in the corresponding hour of all days in the relative season.
As to the domestic hot water demand, it was evaluated depending on the number of the occupants, and was considered to be the same for each day of the year [29,30,31].
The hourly electricity demand, the hourly thermal demand, given by the sum of the hourly domestic hot water and space heating demands, and the hourly space cooling demand of the building, for the four representative season days, are shown in Figure 6.

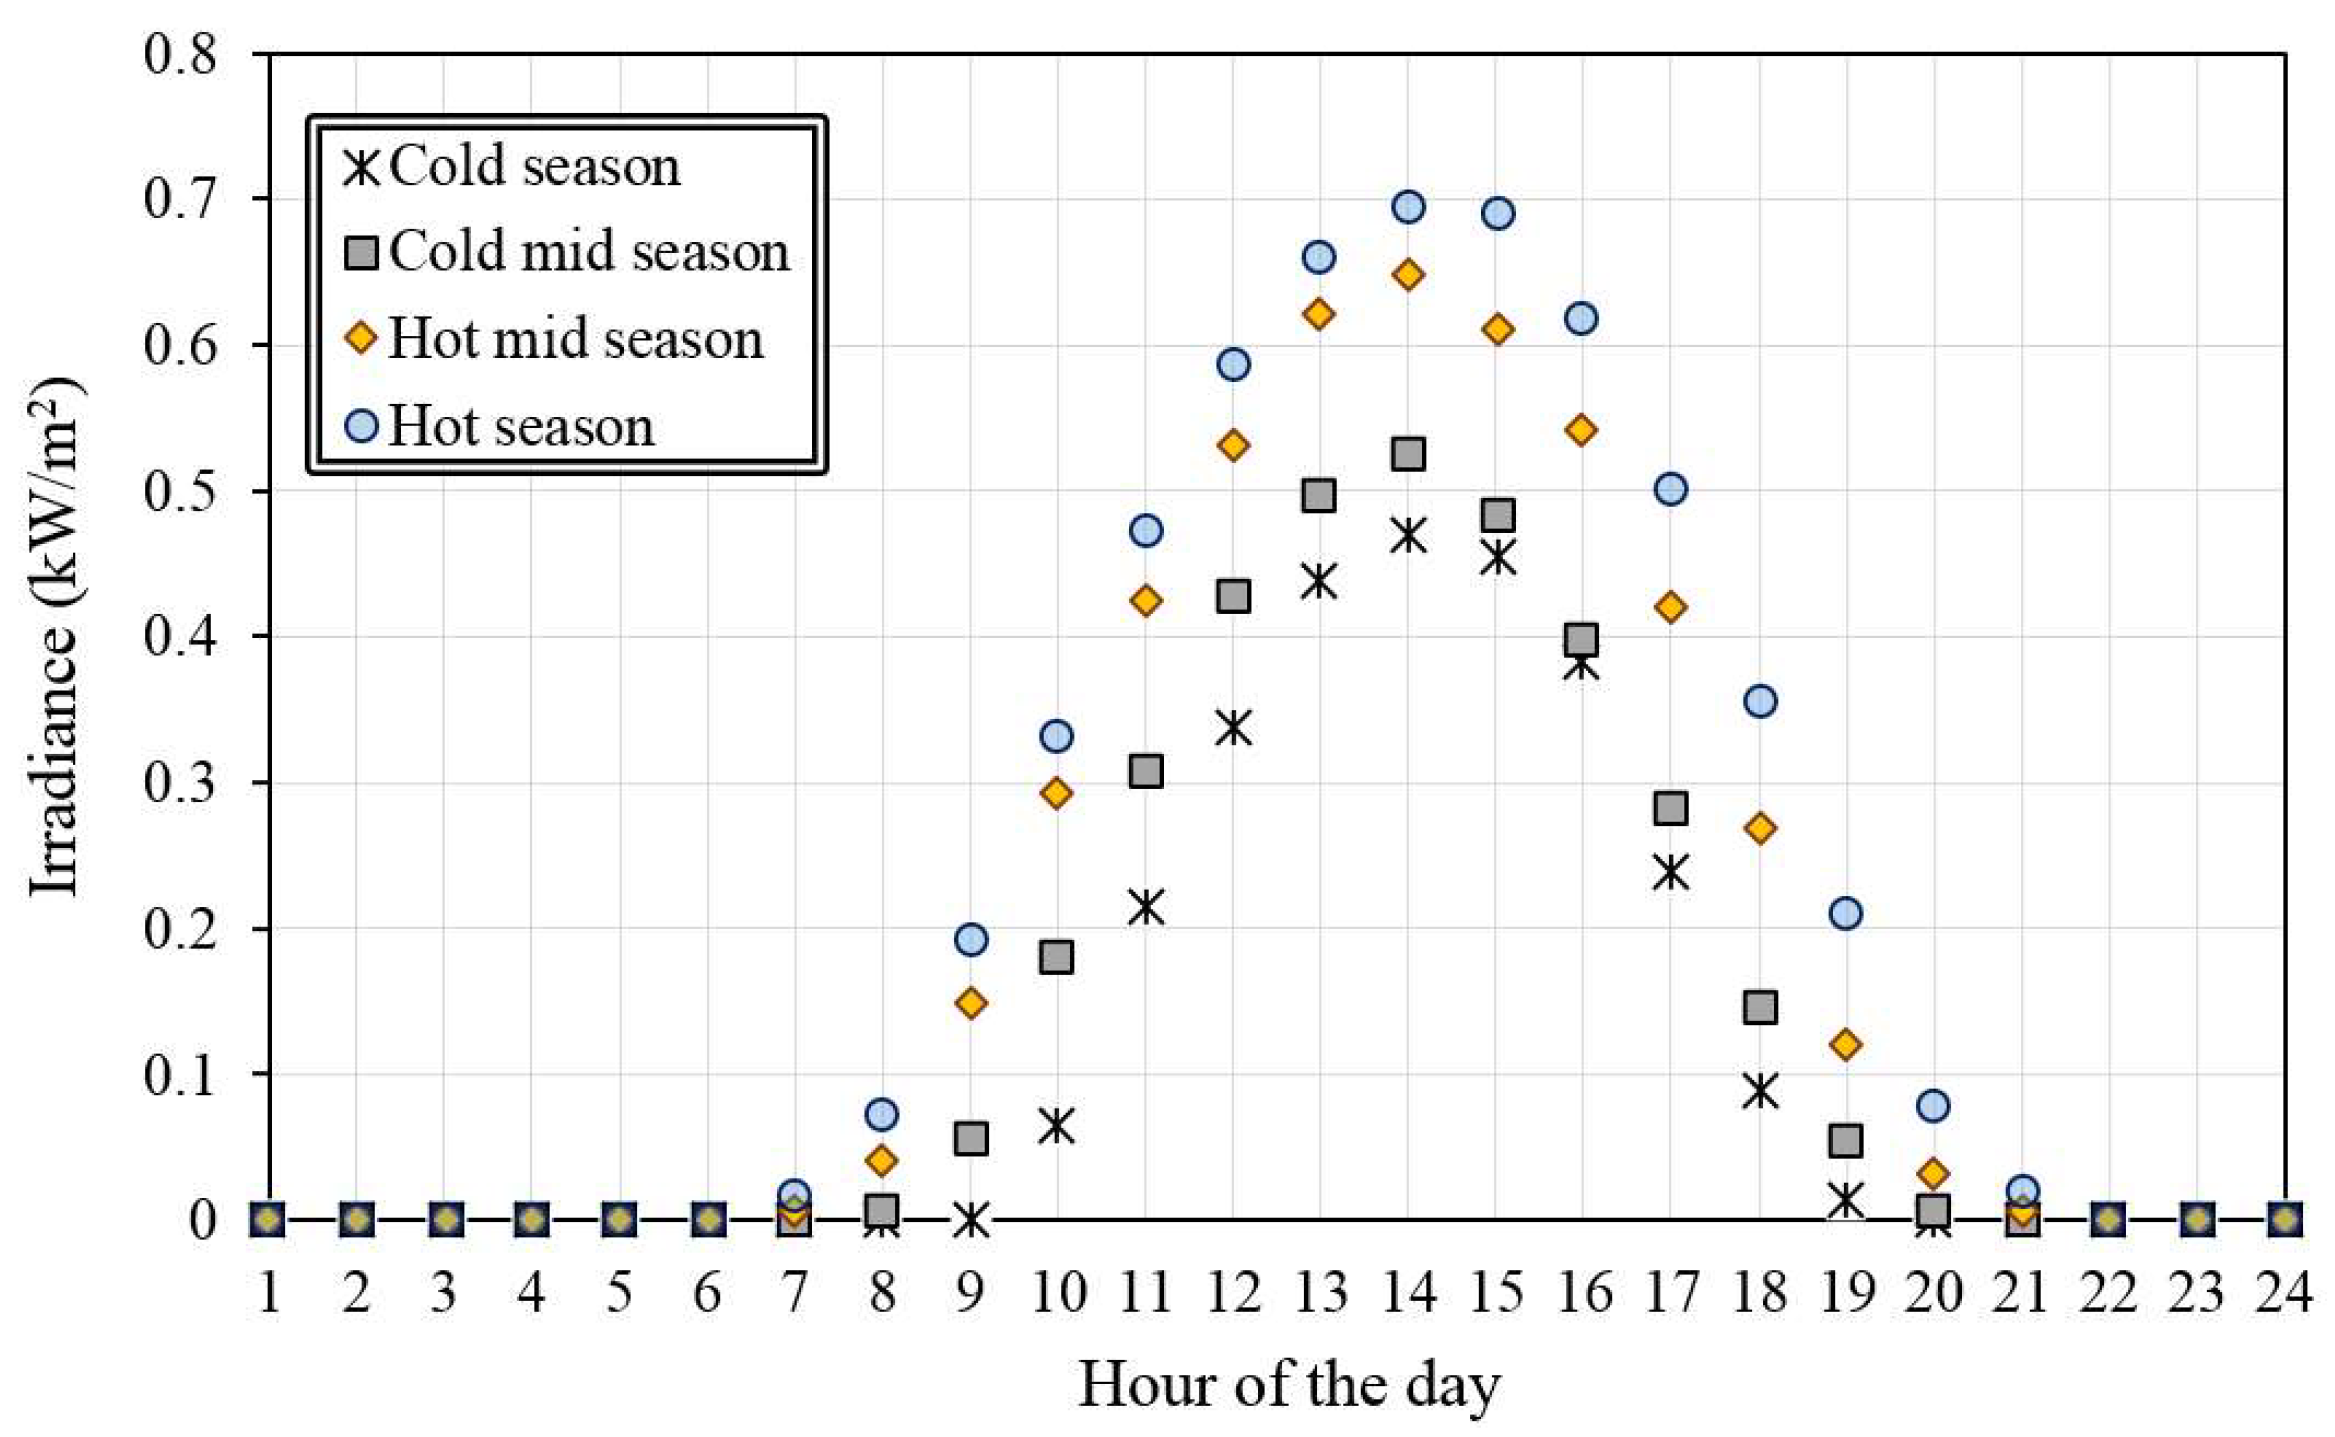
4.2. Solar Irradiance Profiles

Solar irradiance profiles were built up based on meteorological data in Turin [32]. In detail, the hourly solar irradiance on a 35° tilted surface for each representative season day was evaluated as the average of the hourly mean values of the solar irradiance in the corresponding hour of all days in the relative season. The average hourly solar irradiance profiles for the four representative season days are shown in Figure 7. The maximum available area for installation of the rooftop PV arrays was assumed to be 190 m2.

4.3. Techno-Economic Information of Energy Technologies

The techno-economic information of the generation, conversion, and storage technologies in the MEN superstructure are shown in Table 1. The maximum size of the technologies was omitted, considering the type of end-user investigated, and the expected small sizes designed for the energy technologies. The maximum and minimum SOC for the battery were assumed to be 80% and 20% of the designed capacity, respectively. To evaluate the total annualized investment cost, the interest rate was assumed to be 5%.

4.4. Other Input Data

The energy prices were chosen according to the Italian market. The unit price of natural gas was assumed to be 0.462 €/Nm3, whereas the time-of-day electricity price was assumed to vary between 0.123 and 0.152 €/kWh. The reference electrical efficiency of the Italian thermoelectric park used to evaluate the primary energy associated with the electricity taken from the grid in Equation (6) was set to 0.488 [35].

5. Results

The model developed in Section 3 was implemented using IBM ILOG CPLEX Optimization Studio Version 12.6. In the numerical testing, two scenarios were considered for the optimal design problem:
  • Scenario 1: MEN operating in grid-connected mode;
  • Scenario 2: MEN operating in islanded mode in terms of electricity supply.
In the following, the optimization results are discussed for both scenarios, by presenting the Pareto frontiers and the optimized MEN configurations obtained under the economic and the energetic optimization, and for the trade-off points on the Pareto frontiers. The operation strategies of the energy technologies in the optimized MEN configurations obtained under the economic and energetic optimization are also presented and discussed.

5.1. Scenario 1: Multi-Energy Nanogrid Operating in Grid-Connected Mode

5.1.1. Optimized System Configurations on the Pareto Frontier in Scenario 1

For the numerical testing in Scenario 1, the optimization problem could be solved within 10 h with a mixed integer gap lower than 0.15% with a PC with 2.60 GHz (2 multi-core processors) Intel(R) Xeon(R) E5 CPU and 32G RAM.
The Pareto frontier is shown in Figure 8. The point marked with a was obtained with ω = 0 under the energetic optimization, and the total annual fossil primary energy was minimum and equal to 12,197 kWh, whereas the total annual cost was maximum and equal to €6071. Conversely, the point marked with b was obtained with ω = 1 under the economic optimization, and the total annual cost was minimum and equal to €3425, whereas the total annual fossil primary energy is maximum and equal to 26,486 kWh. All the other points on the Pareto frontier represent trade-off solutions of the multi-objective optimization problem, and they were obtained by subdividing the weight interval into 10 equally-spaced points.
Each point on the Pareto frontier corresponds to a different optimized MEN configuration, as shown in Table 2.
It can be noted that the size of the µCHP did not change with the weight value, and this is mainly due to the type of end-user and the low electrical loads. As for the auxiliary boiler, it was not selected in any configuration, higlighting that this technology is not convenient for both the economic and energetic purposes, mainly due to the low conversion efficiency. As for the PV arrays, the installed area increased with the decrease of the weight. When the weight of the energetic objective was higher than that of the economic one, the size of this technology increased, showing that it is essential for reducing the total fossil primary energy. The same behavior can be noted for the electric heat pump and the absorption chiller, whose sizes were maximum under the energetic optimization, thereby highlighting the importance of these technologies for the reduction of the fossil primary energy, due to the high conversion efficiency and the possibility to recover waste heat for cooling purposes, respectively. The increase in the capacity of the battery with higher weights of the environmental objective was mainly due to the corresponding increase of the PV area installed and the related higher amount of renewable electrical energy to be stored. As for thermal storage systems, it can be noted that higher capacities were obtained for higher weights of the energetic objective. This can be explained by the increase in the sizes of the heat pump and the absorption chiller, which are used to charge the thermal storages for heat and cooling, respectively.

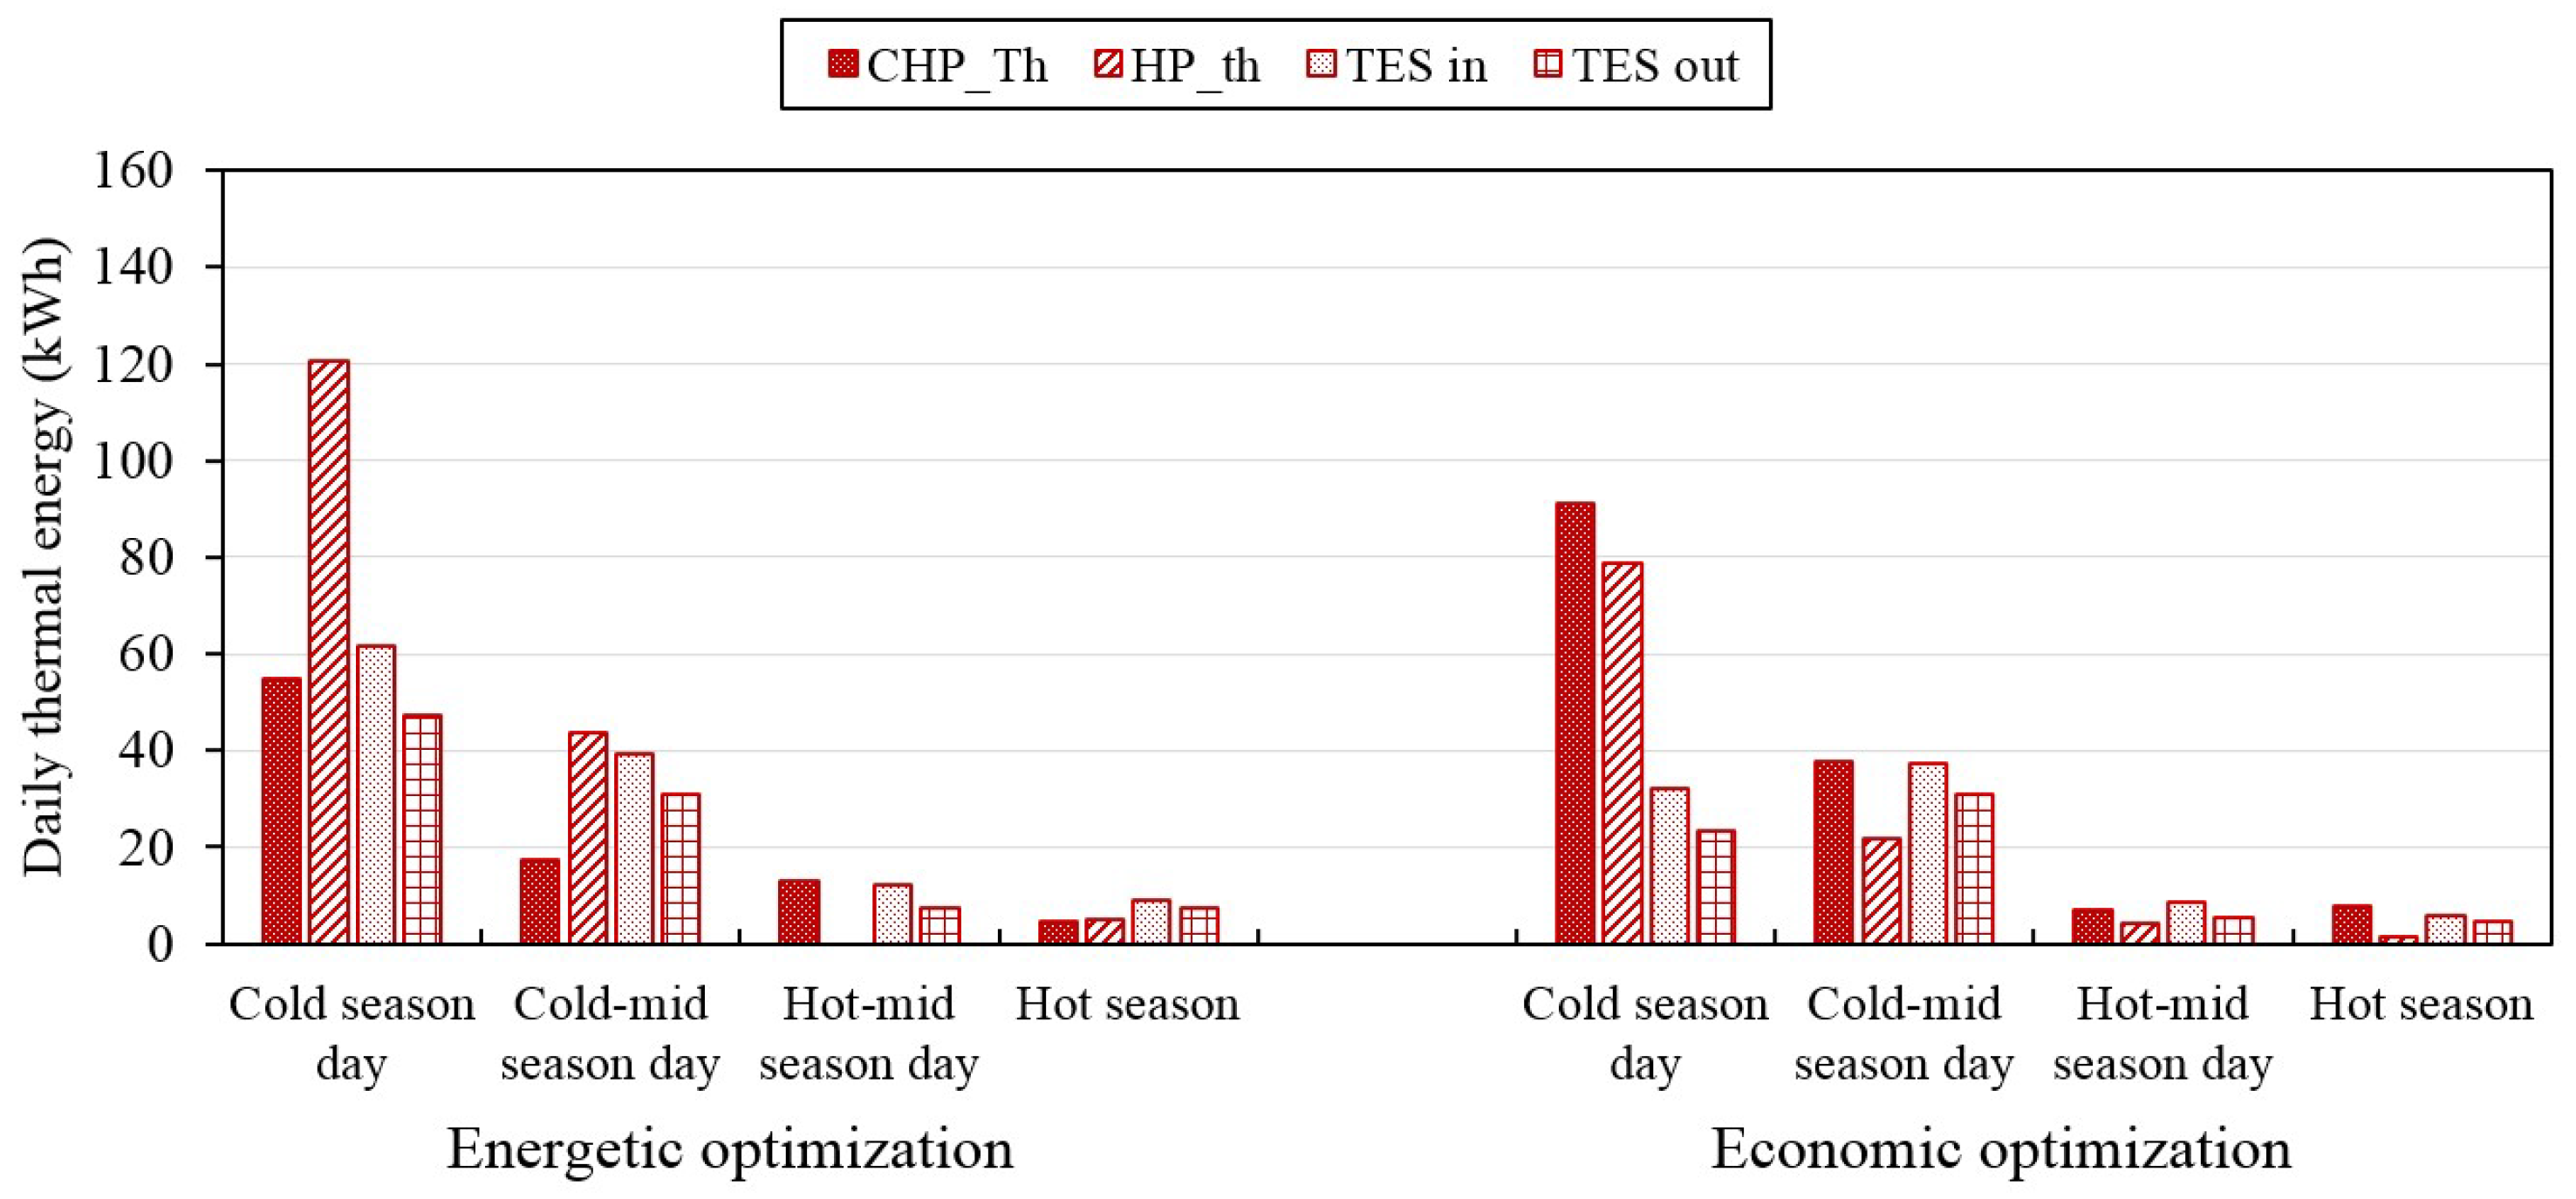
5.1.2. Operation Strategies of the Multi-Energy Nanogrid in Scenario 1

For different optimized configurations of the MEN, different operation strategies of energy technologies were obtained. For the illustration purpose, the operation strategies for electricity, heating, and cooling of the energy technologies in the optimized MEN configurations obtained under the energetic and economic optimization are compared below for the four representative season days.
In Figure 9 for electricity, it can be noted that for all the representative season days, the amount of grid power was larger under the energetic optimization than under the economic one. This is due to the larger usage of the electric heat pump under the energetic optimization, as also shown in Figure 10 for the operation strategies for heat, with the consequent larger electricity required by this technology. The electricity provided by the PV arrays was larger under the energetic optimization than under the economic one, consistent with the larger size of this technology, as shown in Table 2. The larger amount of electricity generated by PV under the energetic optimization leads to the higher usage of the battery. Finally, the electricity generated by the µCHP was lower under the energetic optimization than under the economic one. This result is mainly due to the fact that under energetic optimization, to satisfy the thermal demand, the electric heat pump was mainly used instead of the µCHP, as shown in Figure 10 for heat. In Figure 11 for cooling, it can be noted that the absorption chiller was never used to satisfy the space cooling demand under the economic optimization, consistent with the results shown in Table 2, where it can be found that this technology was not implemented in the MEN configuration under the economic optimization.

5.2. Scenario 2: Multi-Energy Nanogrid Operating in Islanded Mode

5.2.1. Optimized System Configurations on the Pareto Frontier in Scenario 2

For the numerical testing in Scenario 2, the computational effort dramatically increased and the optimization problem could be solved in about 240 h with a mixed integer gap lower than 0.15%, with a PC with 2.60 GHz (two multi-core processors) Intel(R) Xeon(R) E5 CPU and 32G RAM.
The Pareto frontiers obtained under Scenarios 1 and 2 are compared in Figure 12. The point marked with a′ was obtained with ω = 0 under the energetic optimization, and the total annual fossil primary energy was minimum and equal to 19,547 kWh, whereas the total annual cost was maximum and equal to €6580. Conversely, the point marked with b′ was obtained with ω = 1 under the economic optimization, and the total annual cost was minimum and equal to €3995, whereas the total annual fossil primary energy was maximum and equal to 35,867 kWh. All the other points on the Pareto frontier represent trade-off solutions of the multi-objective optimization problem, and they were obtained by subdividing the weight interval into 10 equally-spaced points. It can be noted that in Scenario 2, both the energetic and economic performances of the MEN got worse. By comparing points a′ and a under the energetic optimization, it can be noted that the total annual fossil primary energy obtained in the islanded mode increased by 60.3% as compared with the value obtained in the grid-connected mode. Also, the total annual cost under the energetic optimization was higher in the islanded mode, increasing by 8.4% compared with the cost obtained in the grid-connected mode. A similar worsening situation was found also under the economic optimization. By comparing points b′ and b under the economic optimization, it can be noted that the total annual cost obtained in the islanded mode increased by 16.6% compared with the value obtained in the grid-connected mode. In this comparison, when also taking into account the fixed costs of connection to the electricity grid and of meter transport and management, which were considered only for the grid-connected configuration and were equal to €48/year and €20/year [36], respectively, the grid-connected configuration results more convenient than the islanded one. In fact, under this assumption, the total annual cost of the grid-connected MEN would amount to €3493, which is still lower than the total annual cost of the islanded MEN (€3995). In addition, the total annual fossil primary energy under the economic optimization was much higher in the islanded mode, increasing by 35.4% compared with the value obtained in the grid-connected mode. Moreover, it can be noted that both the economic and energetic performances significantly reduced at all points of the Pareto frontier for the MEN operating in islanded mode.
The different optimized MEN configurations obtained in Scenario 2 for the different values of the weight ω are shown in Table 3.
In general, it can be noted that with the MEN operating in islanded mode, the optimized sizes of all energy technologies were higher than those obtained in grid-connected mode. This result explains the higher total costs obtained for the MEN operating in islanded mode, which was mainly due to the higher investment costs. With reference to the µCHP, higher sizes were obtained for higher weights of the economic objective. The contrary occurred for the PV arrays, since the maximum installed area was obtained in correspondence with higher weights of the energetic objective. Similar to what occurred for Scenario 1, in Scenario 2, the auxiliary boiler was also never implemented in the optimized MEN configuration. As for the electric heat pump, the trend of size variation with the weight ω was similar to that identified in Scenario 1, since the size of this technology increased for higher weights of the energetic objective. The situation was similar for the storage technologies.

5.2.2. Operation Strategies of the Multi-Energy Nanogrid in Scenario 2

The operation strategies for electricity, heating, and cooling of the energy technologies in the optimized MEN configurations obtained under the energetic and economic optimization are compared below for the four representative season days.
In Figure 13 for electricity, it can be noted that for all the representative season days, the amount of grid power was zero, since the MEN operated in islanded mode. In all representative season days, the amount of electricity provided by the µCHP was larger under the economic optimization than under the energetic one, consistent with the larger size attained for this technology under the economic optimization, as shown in Table 3. Conversely, it can be noted that the usage of the electric heat pump was larger under the energetic optimization than under the economic one, as also shown in Figure 14 for the operation strategies for heat. The larger electricity required by the heat pump was satisfied by the electricity provided by PV arrays, which was larger under the energetic optimization. This result also explains the larger usage of the battery under the energetic optimization than under the economic one.
The operation strategies for heating and cooling shown in Figure 14 and Figure 15, respectively, confirm the results discussed above. In Figure 14, it can be noted that, to satisfy the building thermal demand, the amount of thermal energy provided by the µCHP was larger under the economic optimization than under the energetic one, whereas the contrary occurred for the thermal energy provided by the heat pump. The usage of thermal storage systems was larger under the energetic optimization than under the economic one, consistent with the larger sizes attained for these technologies under the energetic optimization. Results were similar for the operation strategies for cooling.

6. Conclusions

In this paper, a methodology was proposed for the optimal design of multi-energy nanogrids (MENs) for residential applications. Based on a pre-defined MEN superstructure, a multi-objective linear problem was established to define the types and sizes of the generation, conversion, and storage technologies in the MEN, with the aim of reducing the total annual cost and the fossil primary energy input, while satisfying the assigned time-varying end-user multi-energy demand. With reference to the latter, the thermal behavior of the building was simulated by using the dynamic simulation software TRSNSYS for obtaining the hourly space heating and cooling profiles. The electricity hourly profiles were built up, considering the number of occupants, the use of appliances, and the lighting systems, whereas the domestic hot water hourly profiles were estimated based on the number of the occupants. The Pareto frontier was found by minimizing a weighted sum of the total annual cost and fossil primary input. The problem was solved by branch-and-cut.
In the numerical testing, a single-family house of 200 m2 located in the Italian climatic zone E, in the city of Turin, was considered as the residential end-user. Two scenarios were investigated, where the MEN operated in grid-connected and islanded modes. In both the analyzed scenarios, results showed that the Pareto frontiers provided good balancing solutions for end-users based on economic and energetic priorities. Moreover, the MEN operating in grid-connected mode showed economic and environmental performances much better than those found for the MEN operating in islanded mode. It was found that under energetic optimization, the total annual fossil primary energy obtained in the islanded mode increased by 60.3% as compared with the value obtained in the grid-connected mode. A similar worsening situation was found for the economic performances of the MEN under the economic optimization, where the total annual cost obtained in the islanded mode increased by 16.6% compared with that obtained in the grid-connected mode. When also considering the fixed costs of connection to the electricity grid and of meter transport and management, which were valid only for the grid-connected configuration, the results were more convenient than the islanded one. In fact, under this assumption, the total annual cost of the islanded MEN would increase by 14.4% compared with the new value obtained in grid-connected mode.
Although the islanded MEN is less convenient for both economic and energetic purposes, the results found in this work show the effectiveness of the methodology for off-grid applications, including isolated individual end-users in rural areas, where there is no possibility of connection to the electricity distribution network, thereby representing a valid solution for designing cost-effective and low-carbon nanogrids, while ensuring access to electricity in critical residential areas.

Author Contributions

Conceptualization: M.D.S., M.C., A.P.; Methodology: M.D.S., M.C.; Model implementation: M.D.S.; Data curation: M.C., A.P.; Writing, review and editing: M.D.S., M.C., G.G., A.P., D.M., N.S., G.B. All authors have read and agreed to the published version of the manuscript.

Funding

This research was funded by the National Project “ComESto-Community Energy Storage” PON ricerca e innovazione 2014–2020 MIUR-ARS01_01259.

Conflicts of Interest

The authors declare no conflict of interest.

Abbreviations

Decision variables
APV installed area (m2)
Ccost function (€)
Cd,hrcooling rate (kW)
Ed,hrpower (kW)
Fobjobjective function
gd,hrgeneration level of technology (kW)
Gd,hrnatural gas volumetric flow rate (Nm3/h)
Hd,hrheating rate (kW)
PEprimary energy input function (kWh)
Sdesigned size of technology (kW)–(kWh)
SOCbattery state-of-charge
xbinary decision variable
Parameters
Amaxavailable area for PV installation (m2)
cconstant in Equation (26) (kWh/€)
Ccspecific capital cost of technology (€/kW)–(€/kWh)–(€/m2)
COPcoefficient of performance
CRFcapital recovery factor of technology
Dtlength of the time interval (h)
Id,hrtotal solar irradiance (kW/m2)
LHVgaslower heat value of natural gas (kWh/Nm3)
Nlifetime of technology (years)
OMspecific O&M cost of technology (€/kWh)
Pe,hrelectricity price (€/kWh)
Pgasnatural gas price (€/Nm3)
rinterest rate
Smaxmaximum size of the technology available in the market (kW)
Sminminimum size of the technology available in the market (kW)
Hefficiency of technology
Φstorage loss fraction
ωweight in Equation (26)
Superscript/Subscripts
ABauxiliary boiler
AChilabsorption chiller
Batbattery
Chcharging
µCHPmicro-CHP
Dday
demdemand
Dischdischarging
HMheating mode
Hrhour
iindex of energy technology
Ininput
INVinvestment
maxmaximum
minminimum
O&Moperation and maintenance
Outoutput
PGpower grid
PVphotovoltaic
refreference
SCspace cooling
Stostored
TESthermal energy storage
Ththermal
Acronyms
µCHPmicro combined heat and power
MILPmixed-integer linear programming
MENmulti energy nanogrid
O&Moperation and maintenance

References

  1. Kari, A.; Arto, S. Distributed energy generation and sustainable development. Renew. Sustain. Energy Rev. 2006, 10, 539–558. [Google Scholar]
  2. Akorede, M.F.; Hizam, H.; Poresmaeil, E. Distributed energy resources and benefits to the environment. Renew. Sustain. Energy Rev. 2010, 14, 724–734. [Google Scholar] [CrossRef]
  3. Roberto, R.; De Iulio, R.; Di Somma, M.; Graditi, G.; Guidi, G.; Noussan, M. A multi-objective optimization analysis to assess the potential economic and environmental benefits of distributed storage in district heating networks: A case study. Int. J. Sustain. Energy Plan. Manag. 2019, 20. [Google Scholar] [CrossRef]
  4. Atia, R.; Yamada, N. Sizing and analysis of renewable energy and battery systems in residential microgrids. IEEE Trans. Smart Grid 2016, 7, 1204–1213. [Google Scholar] [CrossRef]
  5. Majidi, M.; Nojavan, S.; Esfetanaj, N.N.; Najafi-Ghalelou, A.; Zare, K. A multi-objective model for optimal operation of a battery/PV/fuel cell/grid hybrid energy system using weighted sum technique and fuzzy satisfying approach considering responsible load management. Sol. Energy 2017, 144, 79–89. [Google Scholar] [CrossRef]
  6. Lokeshgupta, B.; Sivasubramani, S. Multi-objective home energy management with battery energy storage systems. Sustain. Cities Soc. 2019, 47, 101458. [Google Scholar] [CrossRef]
  7. Li, L.; Liu, P.; Li, Z.; Wang, X. A multi-objective optimization approach for selection of energy storage systems. Comput. Chem. Eng. 2018, 115, 213–225. [Google Scholar] [CrossRef]
  8. Yuan, Y.; Bayod-Rújula, A.A.; Chen, H.; Martínez-Gracia, A.; Wang, J.; Pinnarelli, A. An Advanced Multicarrier Residential Energy Hub System Based on Mixed Integer Linear Programming. Int. J. Photoenergy 2019. [Google Scholar] [CrossRef]
  9. Hosseinalizadeh, R.; Shakouri, H.; Amalnick, M.S.; Taghipour, P. Economic sizing of a hybrid (PV–WT–FC) renewable energy system (HRES) for stand-alone usages by an optimization-simulation model: Case study of Iran. Renew. Sustain. Energy Rev. 2016, 29, 139–150. [Google Scholar] [CrossRef] [Green Version]
  10. Ogunjuyigbe, A.S.; Ayodele, T.R.; Akinola, O.A. Optimal allocation and sizing of PV/Wind/Split-diesel/Battery hybrid energy system for minimizing life cycle cost, carbon emission and dump energy of remote residential building. Appl. Energy 2016, 1, 153–171. [Google Scholar] [CrossRef]
  11. Paulitschke, M.; Bocklisch, T.; Böttiger, M. Sizing algorithm for a PV-battery-H 2-hybrid system employing particle swarm optimization. Energy Procedia 2015, 30, 154–162. [Google Scholar] [CrossRef] [Green Version]
  12. Lan, H.; Wen, S.; Hong, Y.Y.; David, C.Y.; Zhang, L. Optimal sizing of hybrid PV/diesel/battery in ship power system. Appl. Energy 2015, 15, 26–34. [Google Scholar] [CrossRef] [Green Version]
  13. Ahmadi, S.; Abdi, S. Application of the Hybrid Big Bang-Big Crunch algorithm for optimal sizing of a stand-alone hybrid PV/wind/battery system. Sol. Energy 2016, 30, 366–374. [Google Scholar] [CrossRef]
  14. Brandoni, C.; Renzi, M. Optimal sizing of hybrid solar micro-CHP systems for the household sector. Appl. Therm. Eng. 2015, 75, 896–907. [Google Scholar] [CrossRef]
  15. Ramlia, M.A.M.; Bouchekarab, H.R.E.H.; Alghamdia, A.S. Optimal sizing of PV/wind/diesel hybrid microgrid system using multi-objective self-adaptive differential evolution algorithm. Renew. Energy 2018, 121, 400–411. [Google Scholar] [CrossRef]
  16. Di Somma, M.; Yan, B.; Bianco, N.; Graditi, G.; Luh, P.B.; Mongibello, L.; Naso, V. Design optimization of a distributed energy system through cost and exergy assessments. Energy Procedia 2017, 105, 2451–2459. [Google Scholar] [CrossRef]
  17. Al-Falahi, M.D.A.; Nimma, K.S.; Jayasinghe, S.D.G.; Enshaei, H. Sizing and modeling of a standalone hybrid renewable energy system. In Proceedings of the IEEE 2nd Annual Southern Power Electronics Conference (SPEC), Auckland, New Zealand, 5–8 December 2016. [Google Scholar] [CrossRef]
  18. Okoye, C.O.; Solyalı, O. Optimal sizing of stand-alone photovoltaic systems in residential buildings. Energy 2017, 126, 573–584. [Google Scholar] [CrossRef]
  19. Al-Falahi, M.D.; Jayasinghe, S.D.G.; Enshaei, H. A review on recent size optimization methodologies for standalone solar and wind hybrid renewable energy system. Energy Convers. Manag. 2017, 143, 252–274. [Google Scholar] [CrossRef]
  20. Jamshidi, M.; Askarzadeh, A. Techno-economic analysis and size optimization of an off-grid hybrid photovoltaic, fuel cell and diesel generator system. Sustain. Cities Soc. 2019, 44, 310–320. [Google Scholar] [CrossRef]
  21. Vieira, F.M.; Moura, P.S.; de Almeida, A.T. Energy storage system for self-consumption of photovoltaic energy in residential zero energy buildings. Renew. Energy 2017, 103, 308–320. [Google Scholar] [CrossRef]
  22. Aichhorn, A.; Greenleaf, M.; Li, H.; Zheng, J. A cost effective battery sizing strategy based on a detailed battery lifetime model and an economic energy management strategy. In Proceedings of the 2012 IEEE Power and Energy Society General Meeting, San Diego, CA, USA, 22–26 July 2012; pp. 1–8. [Google Scholar]
  23. Tezer, T.; Yaman, R.; Yaman, G. Evaluation of approaches used for optimization of stand-alone hybrid renewable energy systems. Renew. Sustain. Energy Rev. 2017, 73, 840–853. [Google Scholar] [CrossRef]
  24. Burmester, D.; Rayudu, R.; Seah, W.; Akinyele, D. A review of nanogrid topologies and technologies. Renew. Sustain. Energy Rev. 2017, 67, 760–775. [Google Scholar] [CrossRef]
  25. Italian Decree n. 311/06. Available online: www.artechint.com/attestato-energetico.pdf (accessed on 15 October 2019). (In Italian).
  26. Standard ISO 7730:2005. Ergonomics of the Thermal Environment e Analytical Determination and Interpretation of Thermal Comfort Using Calculation of the PMV and PPD Indices and Local Thermal Comfort Criteria; International Organization for Standardization: Geneva, Switzerland, 2005. [Google Scholar]
  27. EN 12831:2003. Heating Systems in Buildings e Method for Calculation of the Design Heat Load; EUROPEAN COMMITTEE FOR STANDARDIZATION: Brussels, Belgium, 2003. [Google Scholar]
  28. Philips Lighting Ltd. Lighting Manual: A Handbook of Lighting Installation Design; Philips Lighting Ltd.: Amsterdam, The Netherlands, 1993. [Google Scholar]
  29. Mongibello, L.; Bianco, N.; Caliano, M.; Graditi, G. Influence of heat dumping on the operation of residential micro-CHP systems. Appl. Energy 2015, 160, 206–220. [Google Scholar] [CrossRef]
  30. Barbieri, E.S.; Melino, F.; Morini, M. Influence of the thermal energy storage on the profitability of micro CHP systems for residential building applications. Appl. Energy 2012, 97, 714–722. [Google Scholar] [CrossRef]
  31. Bianchi, M.; De Pascale, A.; Spina, P.R. Guidelines for residential micro-CHP systems design. Appl. Energy 2012, 97, 673–685. [Google Scholar] [CrossRef]
  32. ASHRAE International Weather Files for Energy Calculations (IWEC Weather Files). Users Manual and CD-ROM; American Society of Heating, Refrigerating and Air-Conditioning Engineers: Atlanta, GA, USA, 2001. [Google Scholar]
  33. Darrow, K.; Tidball, R.; Wang, J.; Hampson, A. Catalog of CHP Technologies. 2015. Available online: https://www.epa.gov/sites/production/files/2015-07/documents/catalog_of_chp_technologies.pdf (accessed on 10 October 2019).
  34. Technology Data for Energy Plants. Energinet.dk. 2012. Available online: https://www.energinet.dk/SiteCollectionDocuments/Danske%20dokumenter/Forskning/Technology_data_for_energy_plants.pdf (accessed on 12 October 2019).
  35. National System for Environmental Protection (ISPRA). Report 280/2018 “Fattori di Emissione Atmosferica di Gas a Effetto Serra e Altri Gas nel Settore Elettrico”. 2018. Available online: http://www.isprambiente.gov.it/files2018/pubblicazioni/rapporti/R_280_18_Emissioni_Settore_Elettrico.pdf (accessed on 15 October 2019). (In Italian)
  36. Available online: https://www.arera.it/it/dati/condec.htm (accessed on 18 October 2019).
Figure 1. Scheme of the pre-defined superstructure of the multi-energy nanogrid (MEN) with the energy technologies proposed to be part of the optimal configuration.
Inventions 05 00007 g001
Figure 2. Scheme of the detailed energy flows among technologies in the MEN.
Inventions 05 00007 g002
Figure 3. Flowchart of the multi-objective optimization framework.
Inventions 05 00007 g003
Figure 4. Thermal zones of the simulated building.
Inventions 05 00007 g004
Figure 5. Number of occupants and occupants-related sensible heat gains during the day.
Inventions 05 00007 g005
Figure 6. Hourly mean energy rate demand of the end-user: (a) a representative cold season day; (b) a representative cold mid-season day; (c) a representative hot mid-season day; and (d) a representative hot season day.
Inventions 05 00007 g006
Figure 7. Solar irradiance hourly profiles for the four representative season days.
Inventions 05 00007 g007
Figure 8. Pareto frontier obtained in Scenario 1.
Inventions 05 00007 g008
Figure 9. Operation strategies of optimized MEN configurations at points a and b in the four season days for electricity.
Inventions 05 00007 g009
Figure 10. Operation strategies of optimized MEN configurations at points a and b in the four season days for heat.
Inventions 05 00007 g010
Figure 11. Operation strategies of optimized MEN configurations at points a and b in the four season days for cooling.
Inventions 05 00007 g011
Figure 12. Comparison of the Pareto frontiers obtained in Scenarios 1 and 2.
Inventions 05 00007 g012
Figure 13. Operation strategies of optimized MEN configurations at points a′ and b′ in the four season days for electricity.
Inventions 05 00007 g013
Figure 14. Operation strategies of optimized MEN configurations at points a′ and b′ in the four season days for heating.
Inventions 05 00007 g014
Figure 15. Operation strategies of optimized MEN configurations at points a′ and b′ in the four season days for cooling.
Inventions 05 00007 g015
Table 1. Techno-economic information of the generation, conversion, and storage technologies in the MEN superstructure [16,33,34].
Energy TechnologyMinimum Size (kW)Specific Capital CostO&M Costs (€/kWh)EfficiencyLifetime
ElTh
µCHP (ICE as prime mover)1.01500 €/kW0.00240.280.6520
Auxiliary boiler10100 €/kW0.015 0.815
PV-2000 Eur/kWp0.0050.14 30
Reversible heat pump5.0460 €/kW0.0025 COPHM = 3.5
COPCM = 3.0
20
Absorption chiller1.0510 €/kW0.001 0.820
Battery-400 €/kWh0.005ηCh = 0.75
ηDisch = 0.75
5
TES-20 €/kWh0.0014 φTES = 0.0520
Table 2. Optimized MEN configurations for all points of the Pareto frontier in Scenario 1.
ω Value00.10.20.30.40.50.60.70.80.91
Optimized Sizes of Energy Technologies in the MEN
µCHP (kWe)1.01.01.01.01.01.01.01.01.01.01.0
Auxiliary boiler (kWth)00000000000
PV (m2)10010010010071464343413420
Reversible heat pump (kWth)9.59.59.48.37.87.47.27.37.36.66.6
Absorption chiller (kWth)1.81.81.01.01.01.01.00000
Battery (kWhe)27.027.027.026.718.110.810.010.010.010.010.0
TES (Heat) (kWhth)27.427.419.617.723.520.417.217.817.317.915.5
TES (Cooling) (kWhth)45.445.454.147.739.532.433.834.731.525.811.4
Table 3. Optimized MEN configurations for all points of the Pareto frontier in Scenario 2.
ω Value00.10.20.30.40.50.60.70.80.91
Optimized Sizes of Energy Technologies in the MEN
µCHP (kWe)1.71.71.71.71.61.92.02.01.92.12.1
Auxiliary boiler (kWth)00000000000
PV (m2)9797979794564439403722
Reversible heat pump (kWth)11.011.011.011.09.17.97.26.56.16.14.4
Absorption chiller (kWth)2.82.82.82.82.02.53.23.42.81.92.7
Battery (kWhe)27.827.827.827.82713.810.310.010.010.010.0
TES (Heat) (kWhth)25.725.725.725.719.425.514.223.325.612.220.9
TES (Cooling) (kWhth)53.553.553.553.548.538.238.131.534.531.022.3

