Development of a Simple ImageJ-Based Method for Dynamic Blood Flow Tracking in Zebrafish Embryos and Its Application in Drug Toxicity Evaluation


Abstract
:1. Introduction
2. Results
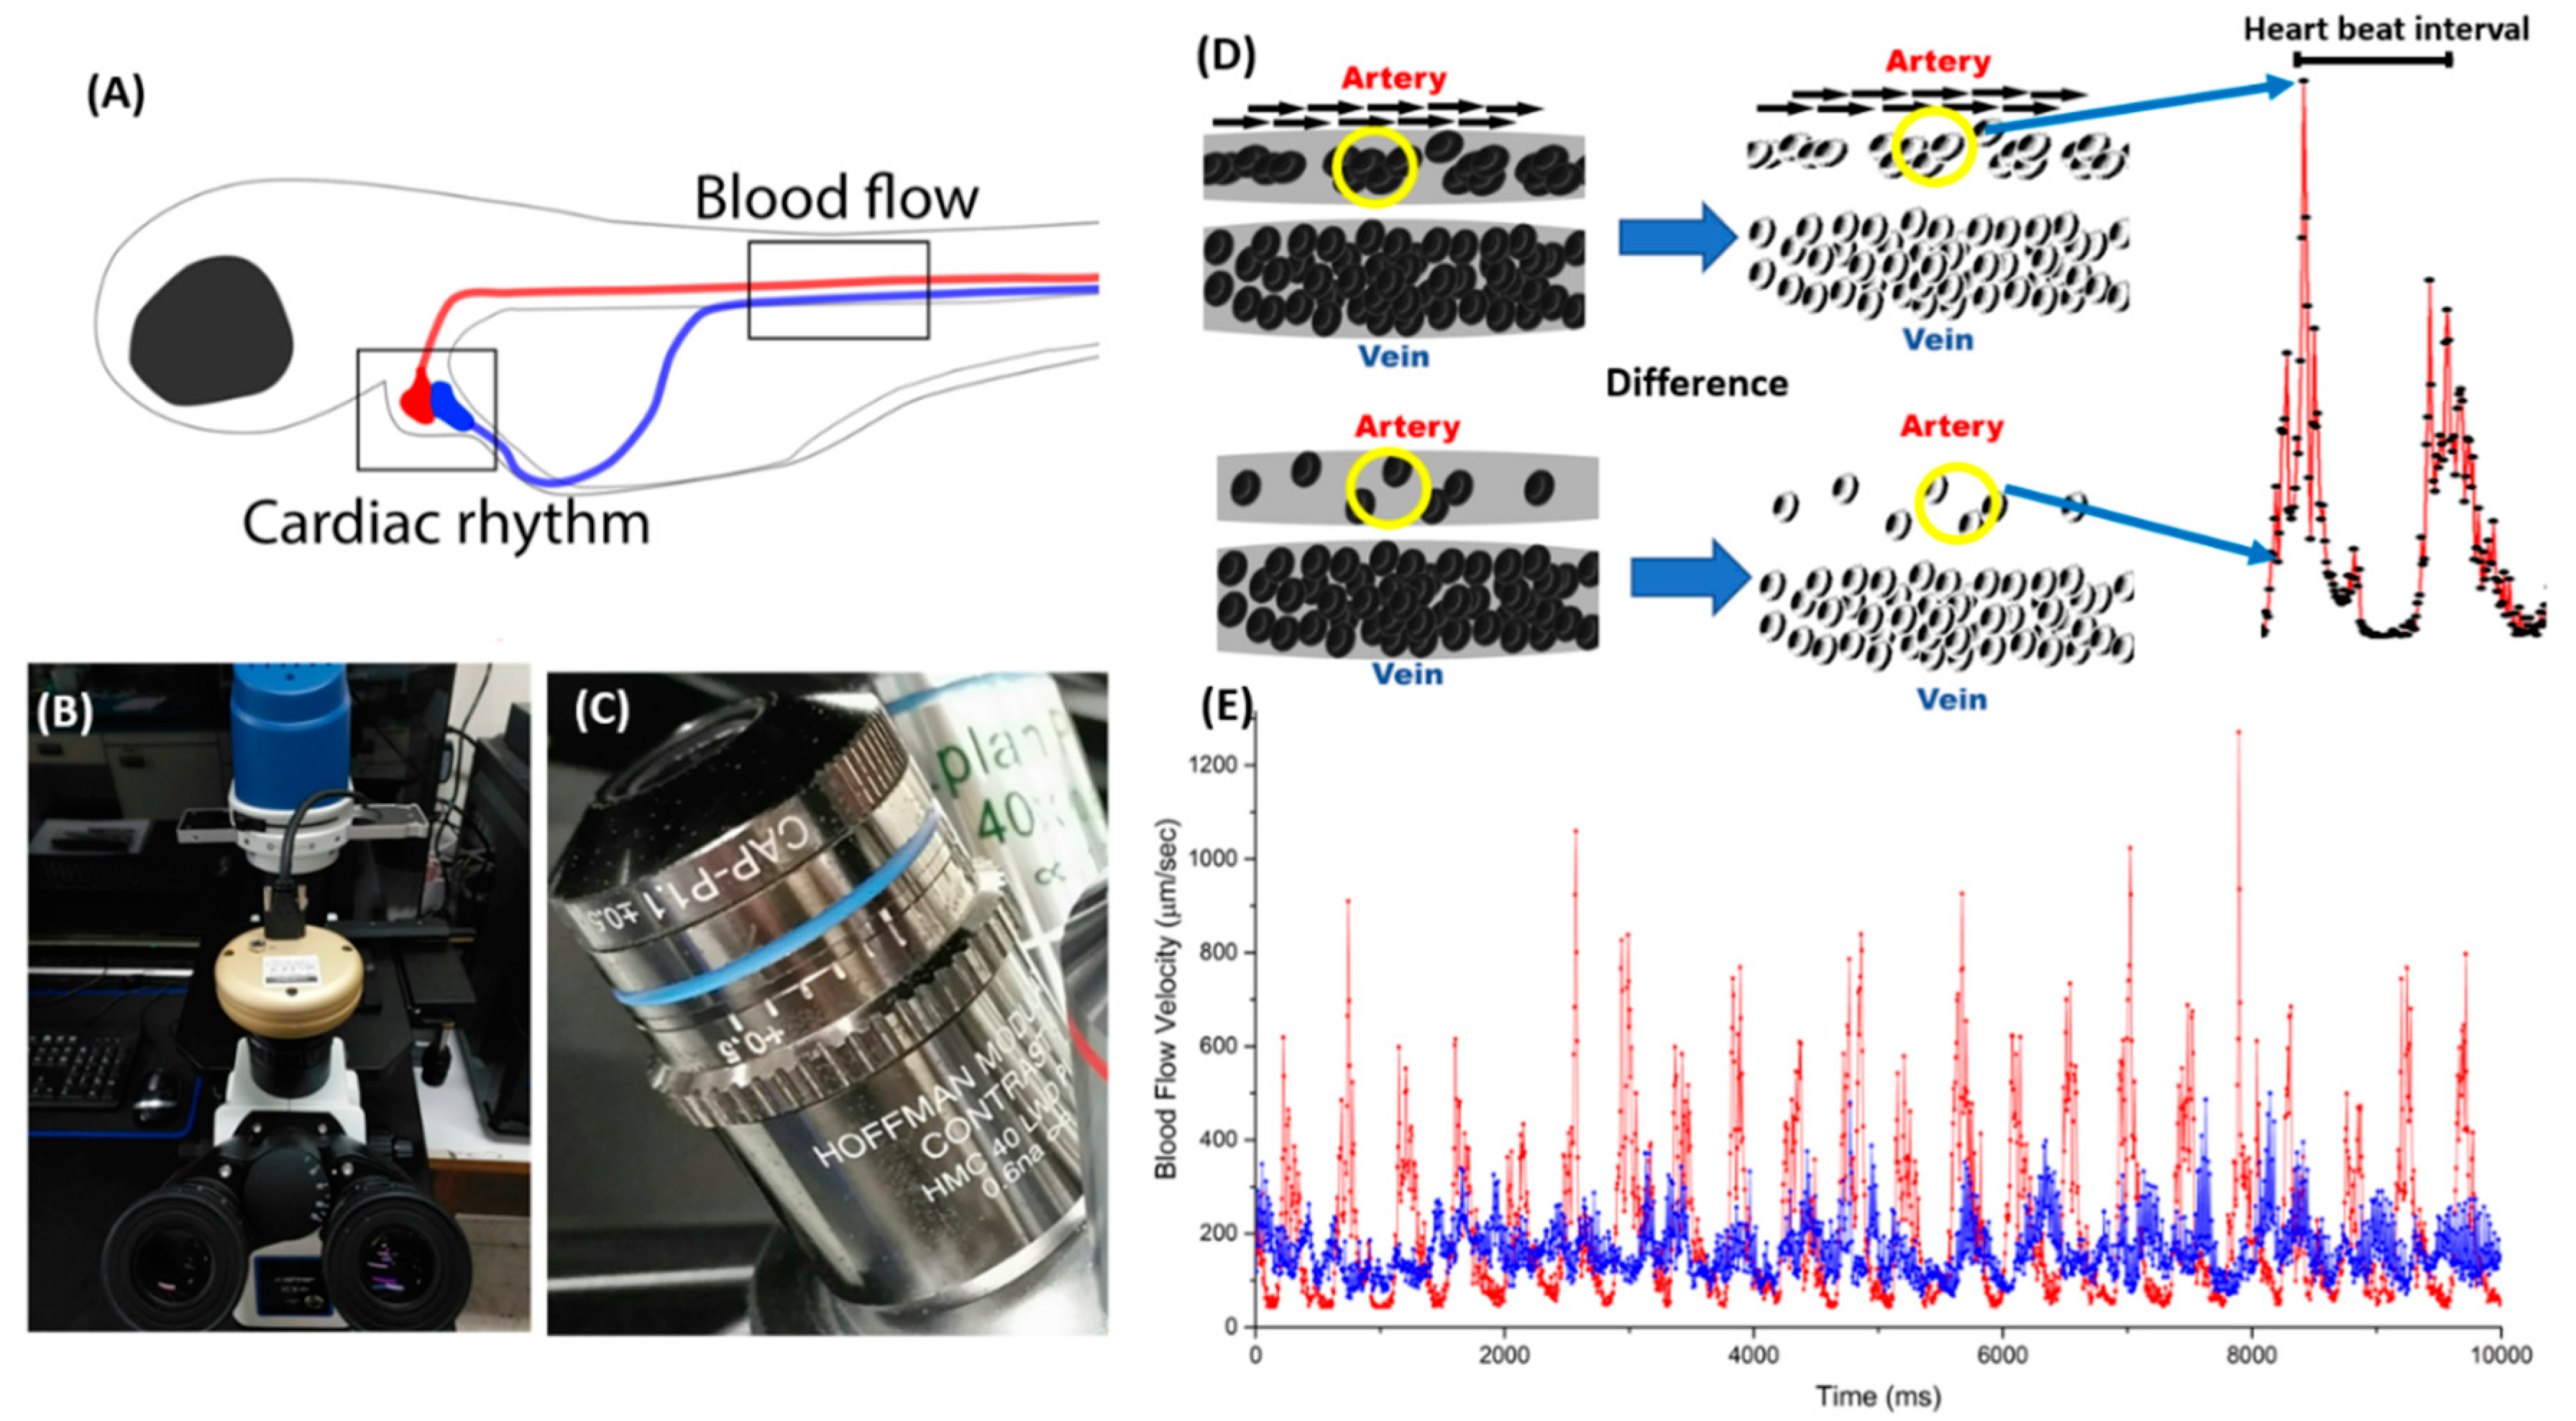
2.1. Basic Principle and Experimental Protocol for Blood Flow Tracking and Velocity Measurement in Zebrafish Embryos Using ImageJ-Based Methodology
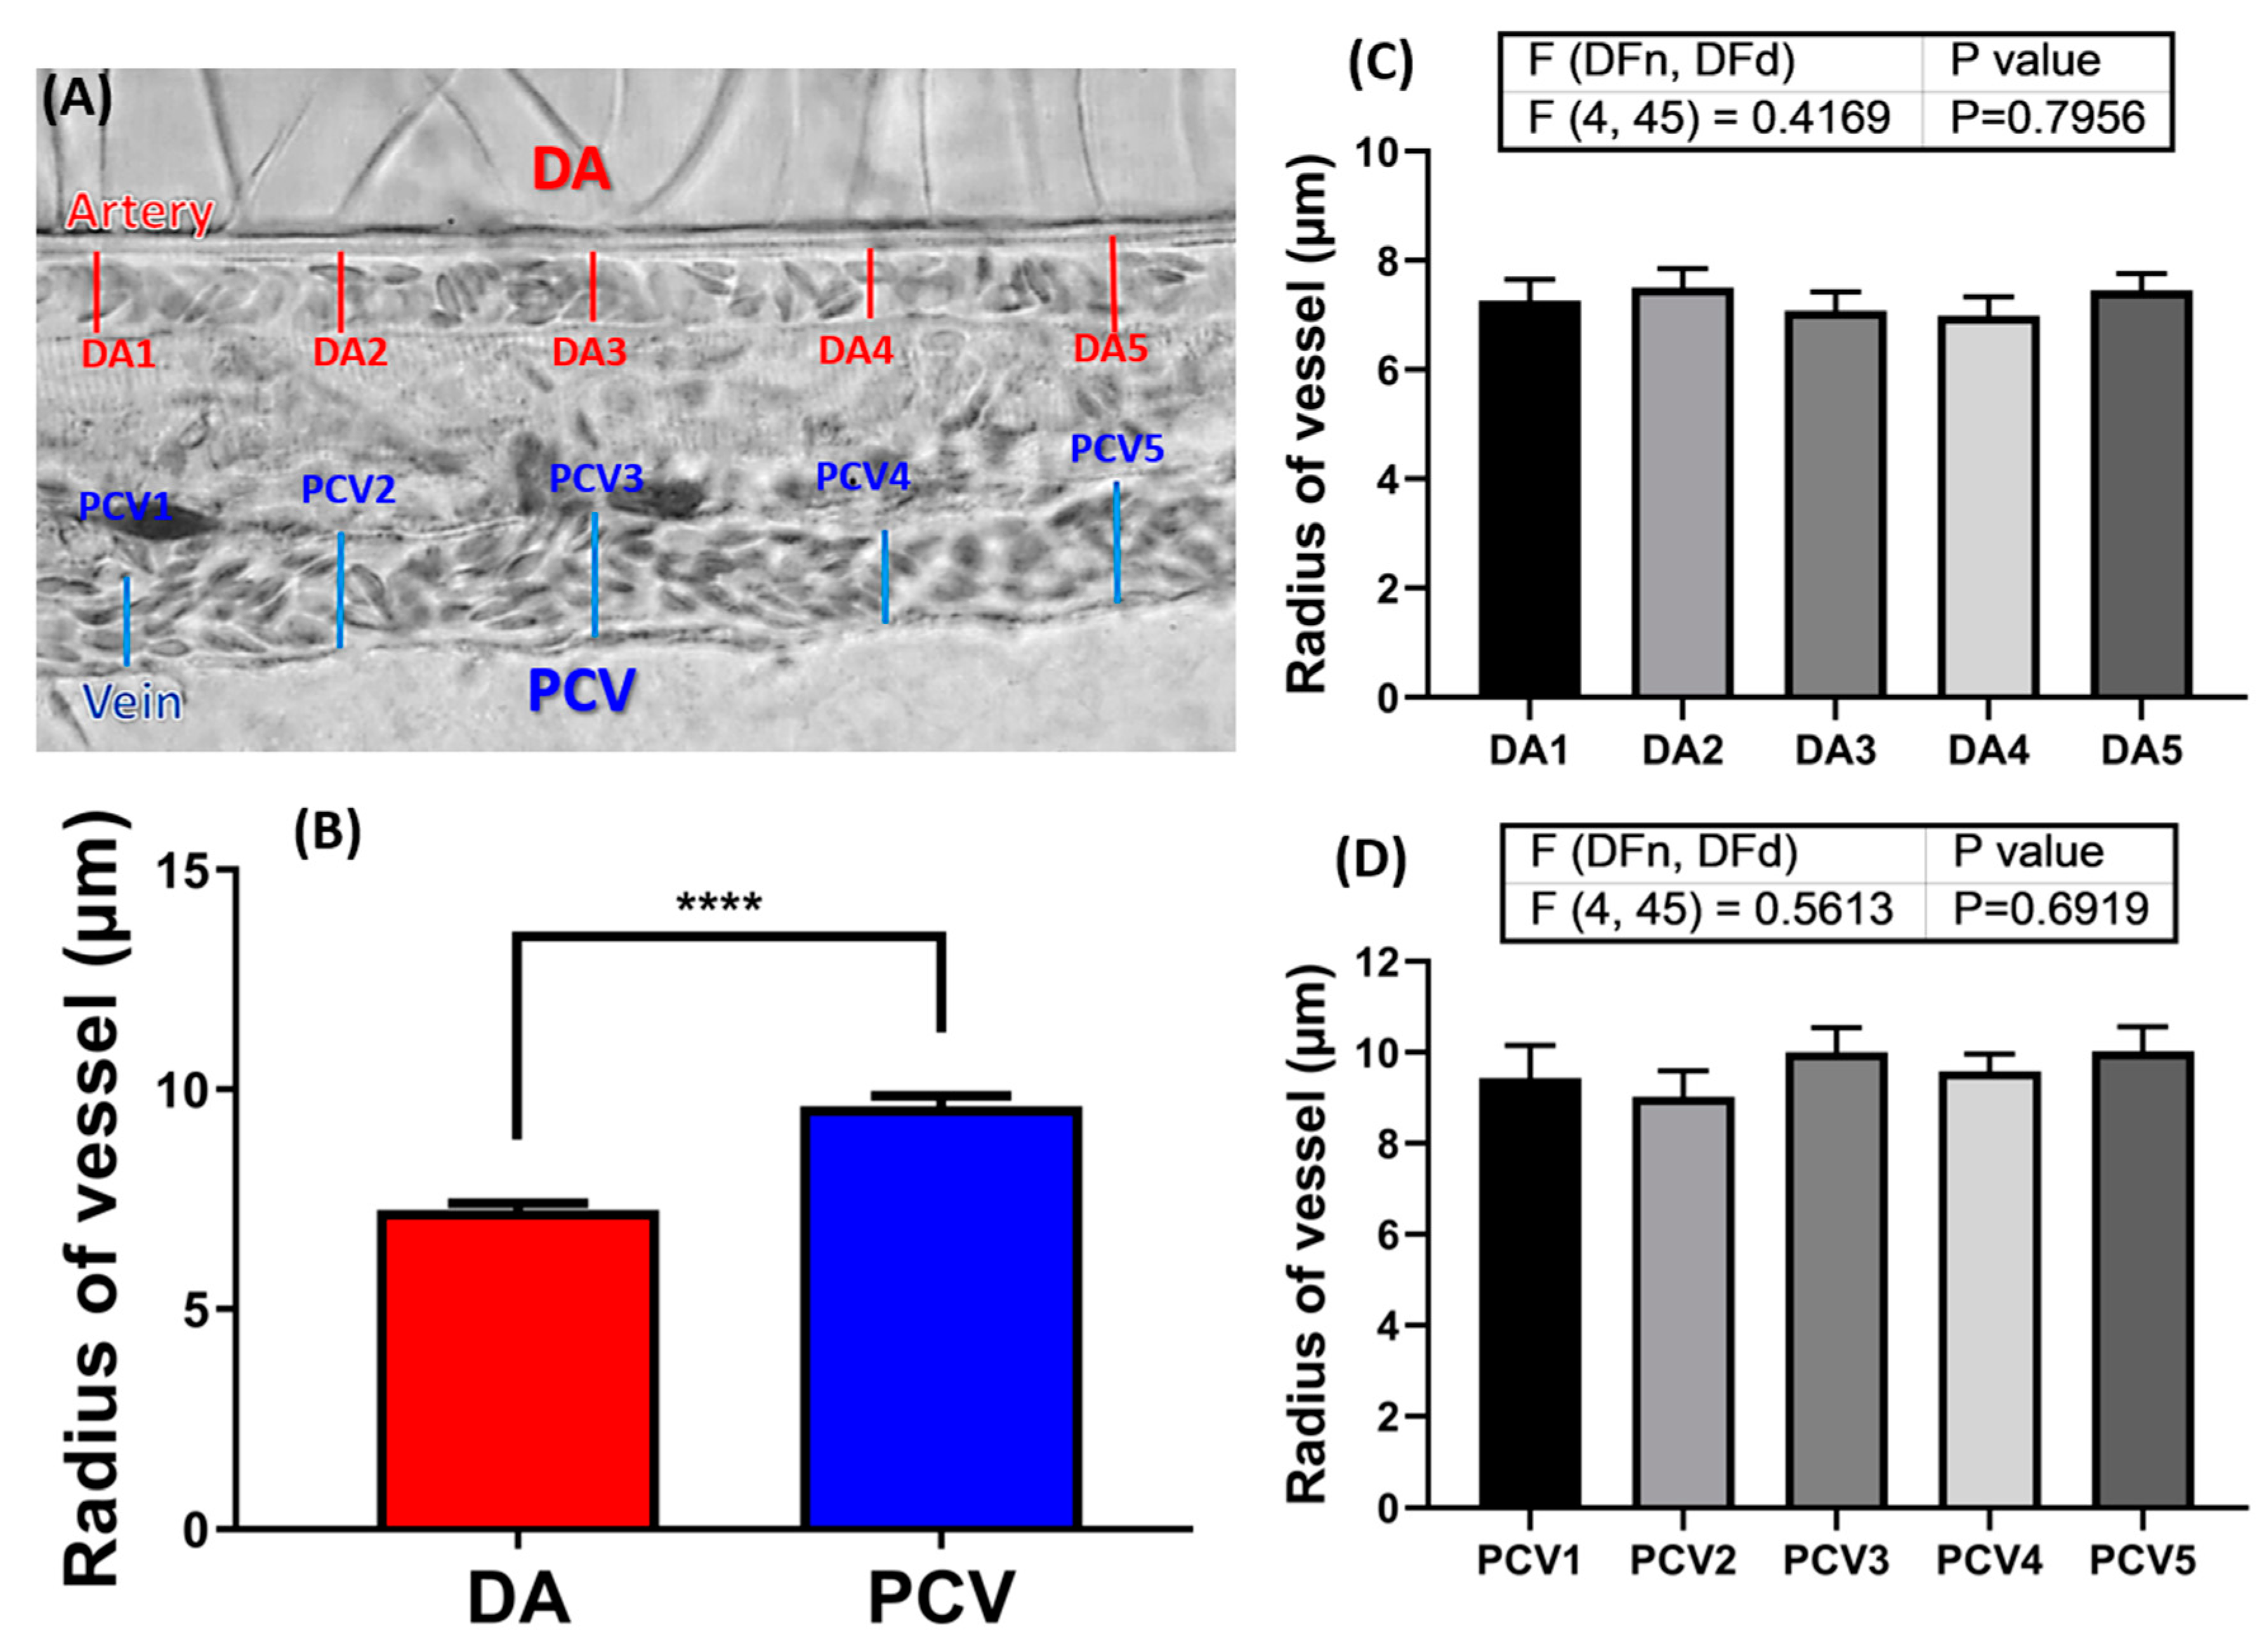
2.2. Measurement of Blood Vessel Radius in 72hpf Zebrafish Embryos
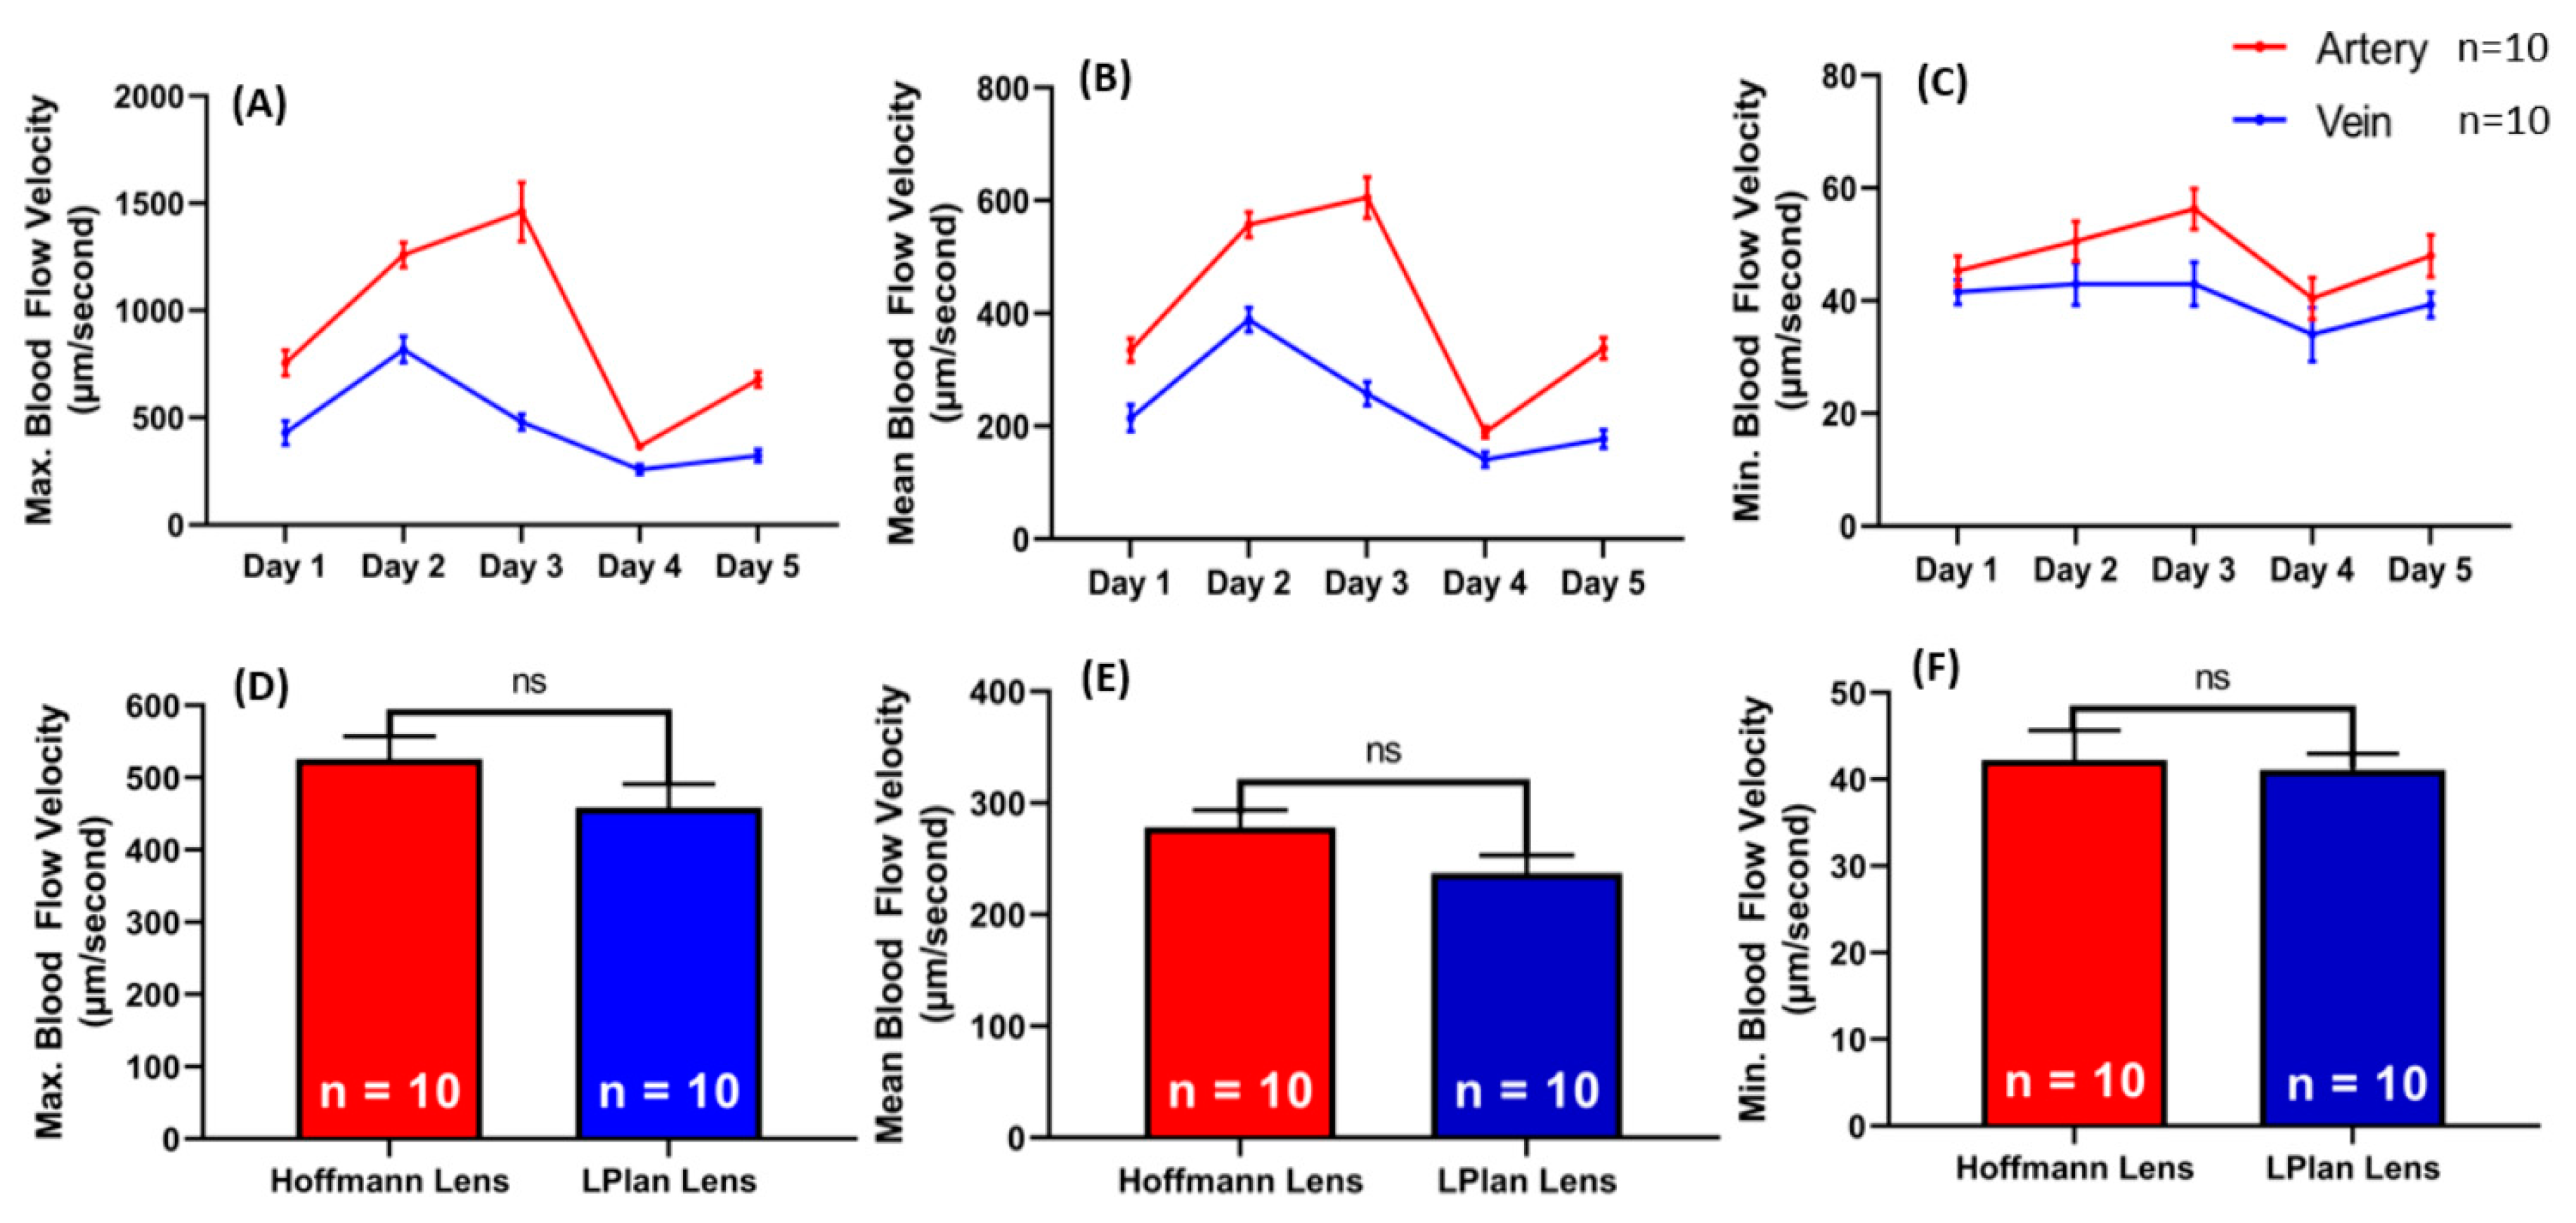
2.3. Cardiovascular Performance in Zebrafish Embryos on 1–5 Days Post Fertilization (dpf)
2.4. Blood Flow Velocity Comparison in Zebrafish Embryos Using Hoffmann Lens and Non-Hoffmann Lens
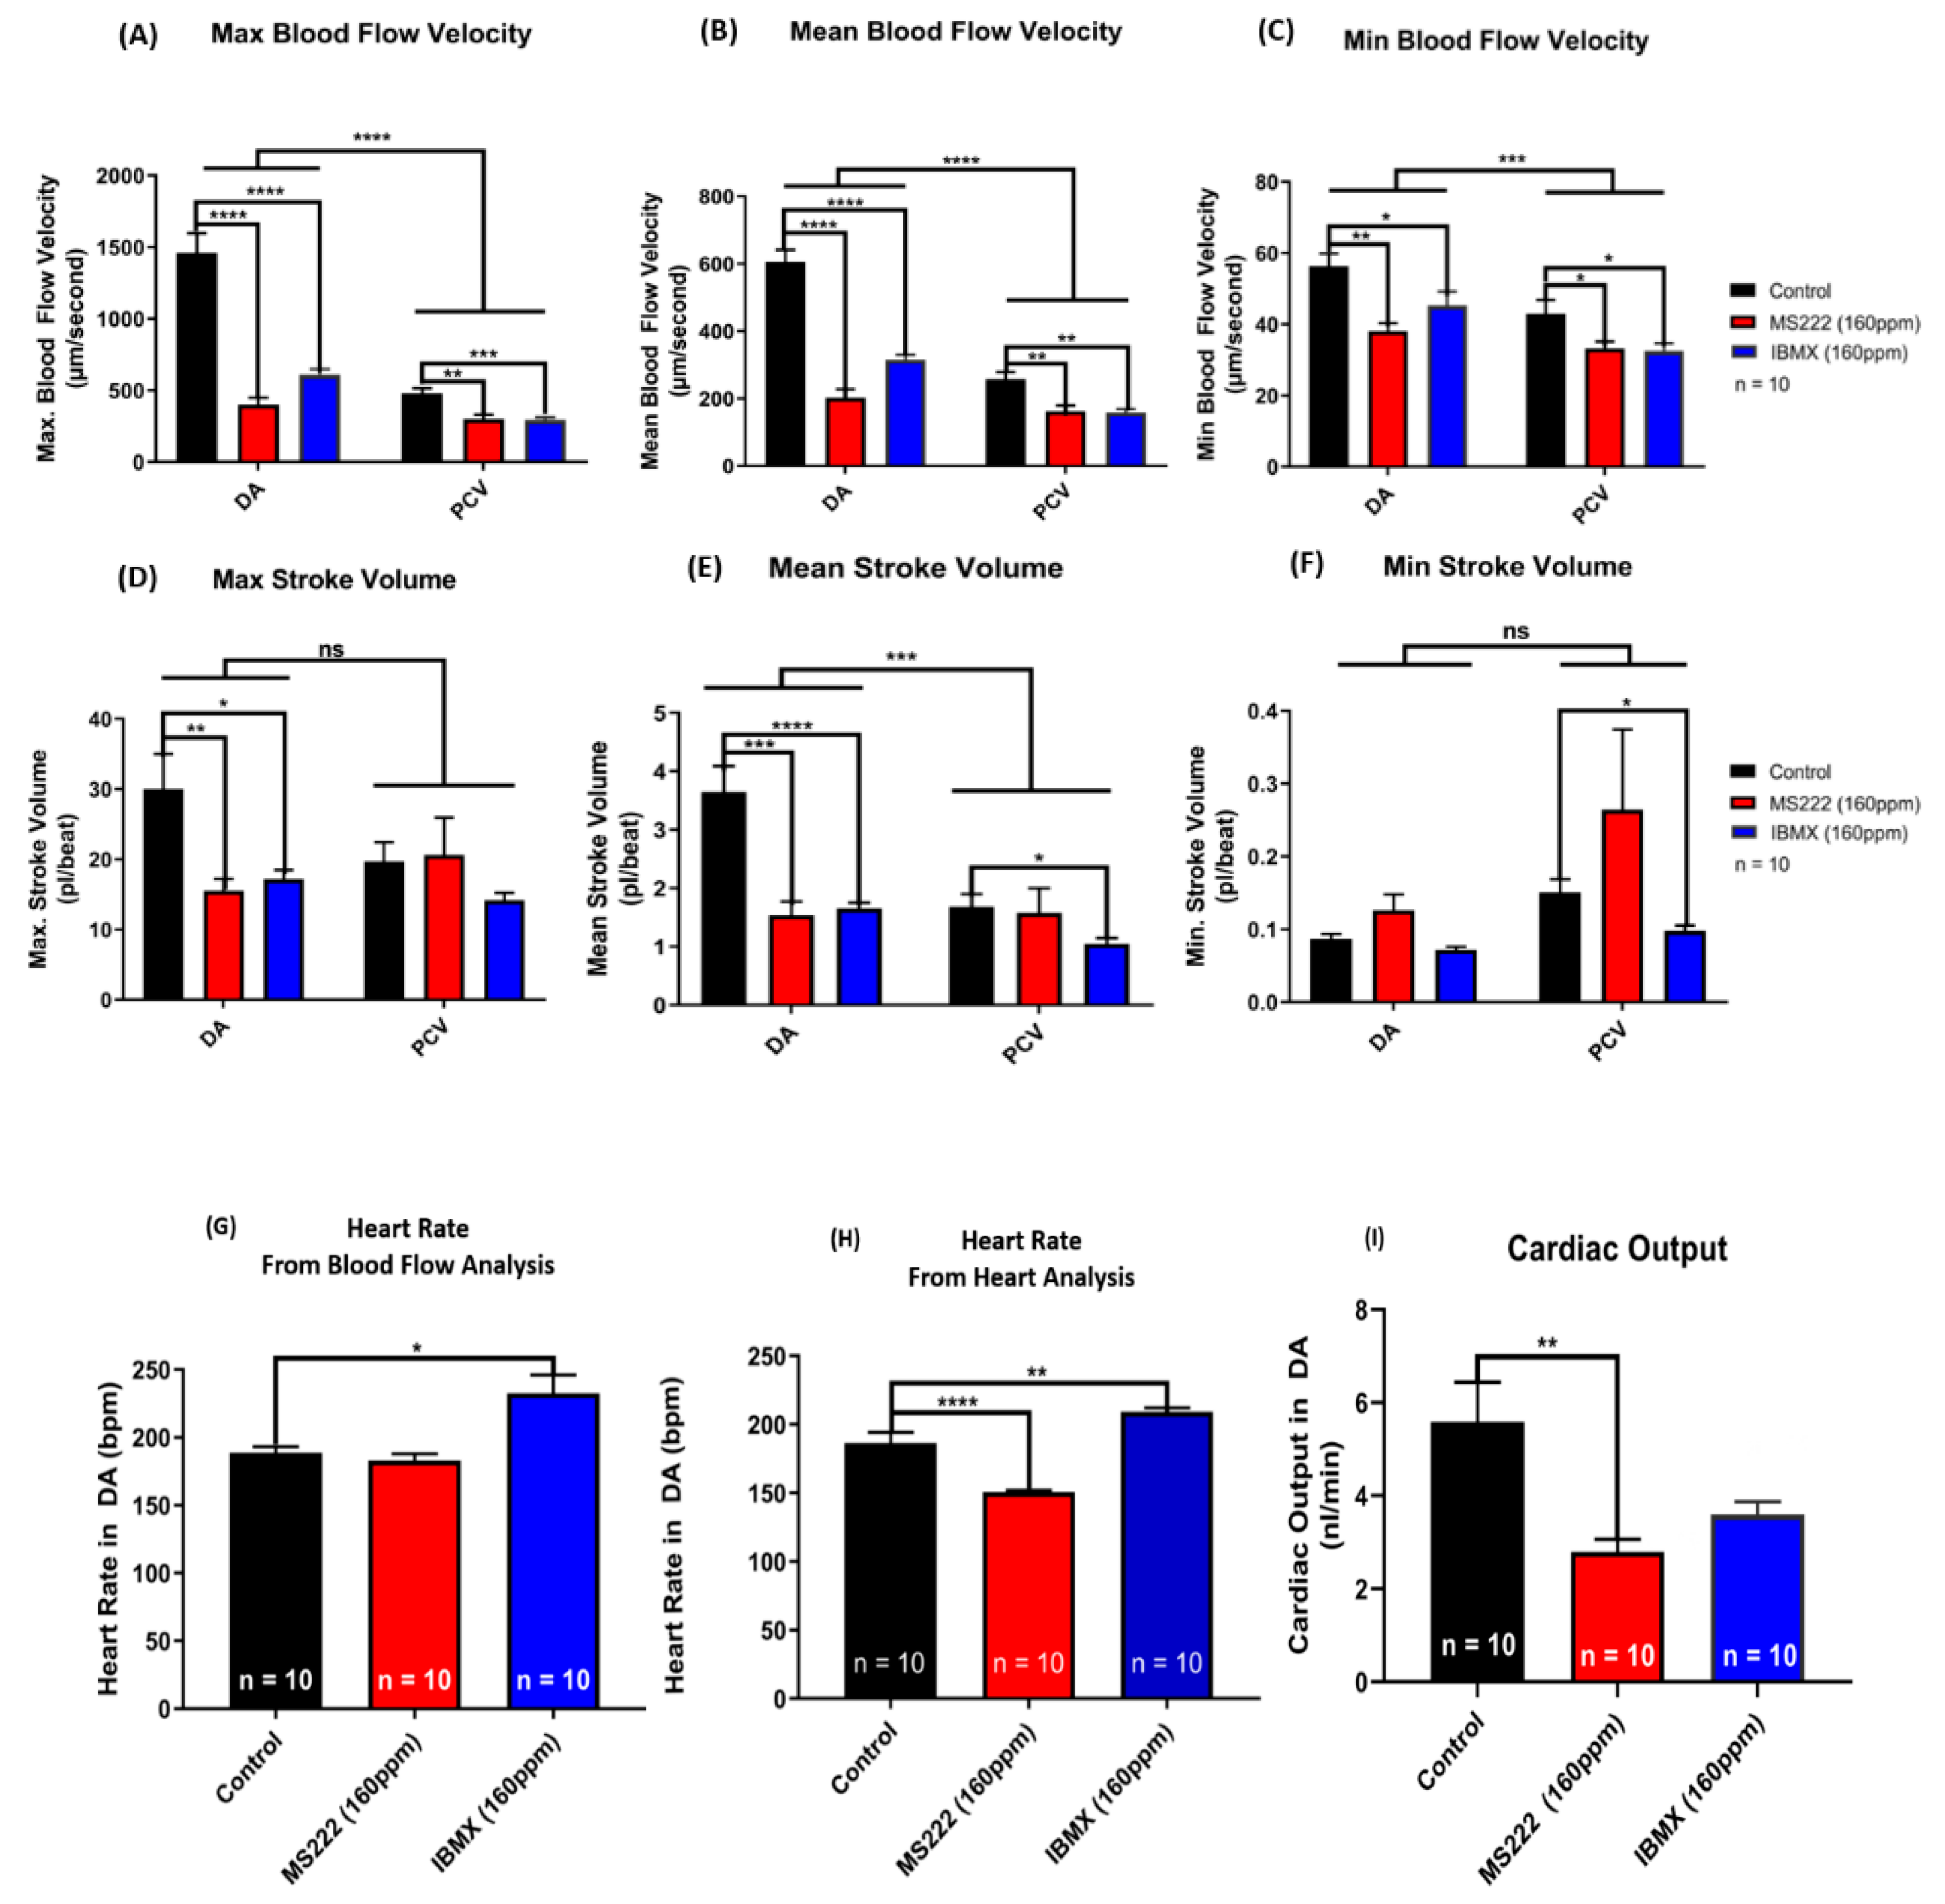
2.5. Functional Assessment of Cardiovascular Performance in Zebrafish Embryos Before and After Exposure to Drugs
3. Discussion
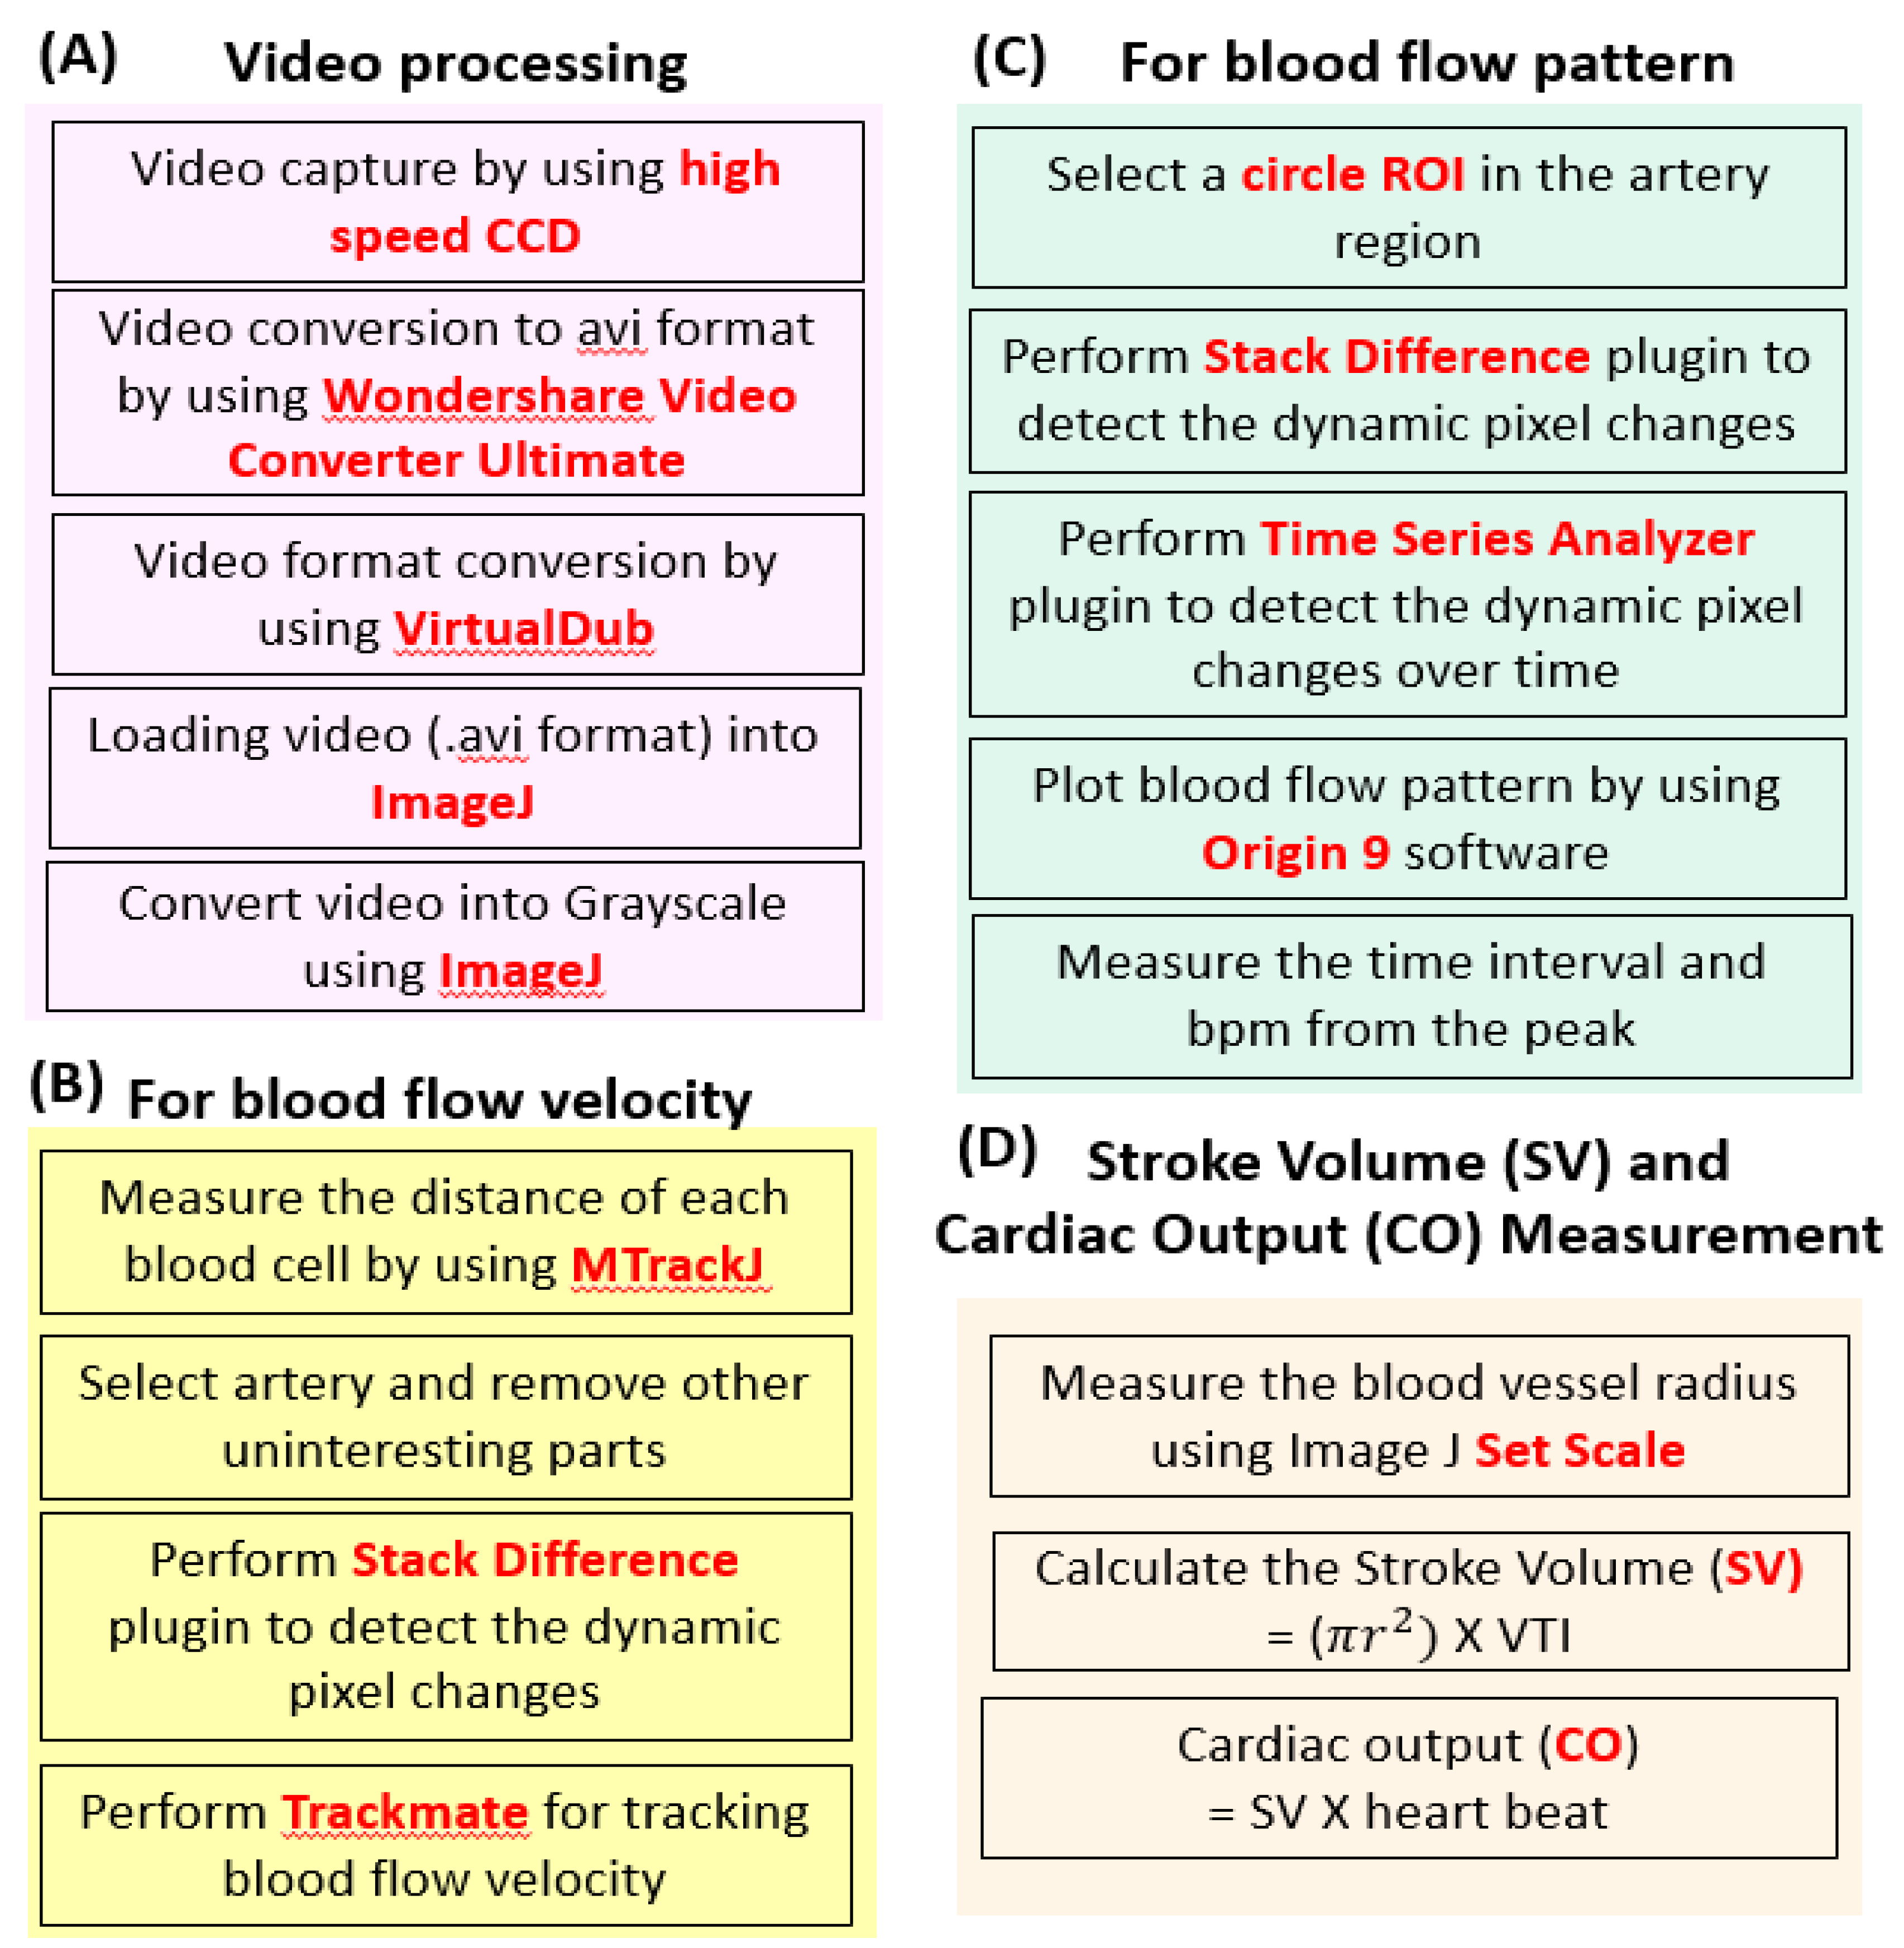
4. Methods
4.1. Zebrafish Maintenance
4.2. Video Recording
4.3. Video Processing
4.4. Blood Cell Tracking
4.5. Blood Flow Pattern and Heart Rate Calculation
4.6. Stroke Volume, and Cardiac Output Calculation
4.7. Statistics
Supplementary Materials
Author Contributions
Funding
Acknowledgments
Conflicts of Interest
References
- Anton, H.; Harlepp, S.; Ramspacher, C.; Wu, D.; Monduc, F.; Bhat, S.; Liebling, M.; Paoletti, C.; Charvin, G.; Freund, J.B. Pulse propagation by a capacitive mechanism drives embryonic blood flow. Development 2013, 140, 4426–4434. [Google Scholar] [CrossRef] [PubMed] [Green Version]
- Boselli, F.; Freund, J.B.; Vermot, J. Blood flow mechanics in cardiovascular development. Cell. Mol. Life Sci. 2015, 72, 2545–2559. [Google Scholar] [CrossRef] [PubMed] [Green Version]
- Isogai, S.; Horiguchi, M.; Weinstein, B.M. The vascular anatomy of the developing zebrafish: An atlas of embryonic and early larval development. Dev. Biol. 2001, 230, 278–301. [Google Scholar] [CrossRef] [PubMed]
- McGrath, P.; Li, C.-Q. Zebrafish: A predictive model for assessing drug-induced toxicity. Drug Discov. Today 2008, 13, 394–401. [Google Scholar] [CrossRef] [PubMed]
- Zon, L.I.; Peterson, R.T. In vivo drug discovery in the zebrafish. Nat. Rev. Drug Discov. 2005, 4, 35. [Google Scholar] [CrossRef] [PubMed]
- Dong, W.; Teraoka, H.; Yamazaki, K.; Tsukiyama, S.; Imani, S.; Imagawa, T.; Stegeman, J.J.; Peterson, R.E.; Hiraga, T. 2, 3, 7, 8-tetrachlorodibenzo-p-dioxin toxicity in the zebrafish embryo: Local circulation failure in the dorsal midbrain is associated with increased apoptosis. Toxicol. Sci. 2002, 69, 191–201. [Google Scholar] [CrossRef]
- Martins, T.; Diniz, E.; Felix, L.M.; Antunes, L. Evaluation of anaesthetic protocols for laboratory adult zebrafish (danio rerio). PLoS ONE 2018, 13, e0197846. [Google Scholar] [CrossRef]
- Huang, W.-C.; Hsieh, Y.-S.; Chen, I.-H.; Wang, C.-H.; Chang, H.-W.; Yang, C.-C.; Ku, T.-H.; Yeh, S.-R.; Chuang, Y.-J. Combined use of ms-222 (tricaine) and isoflurane extends anesthesia time and minimizes cardiac rhythm side effects in adult zebrafish. Zebrafish 2010, 7, 297–304. [Google Scholar] [CrossRef]
- Basnet, R.M.; Zizioli, D.; Guarienti, M.; Finazzi, D.; Memo, M. Methylxanthines induce structural and functional alterations of the cardiac system in zebrafish embryos. BMC Pharmacol. Toxicol. 2017, 18, 72. [Google Scholar] [CrossRef]
- Basnet, R.; Guarienti, M.; Memo, M. Zebrafish embryo as an in vivo model for behavioral and pharmacological characterization of methylxanthine drugs. Int. J. Mol. Sci. 2017, 18, 596. [Google Scholar] [CrossRef]
- Pan, X.; Yu, H.; Shi, X.; Korzh, V.; Wohland, T. Characterization of flow direction in microchannels and zebrafish blood vessels by scanning fluorescence correlation spectroscopy. J. Biomed. Opt. 2007, 12, 014034. [Google Scholar] [CrossRef] [PubMed]
- Iftimia, N.V.; Hammer, D.X.; Ferguson, R.D.; Mujat, M.; Vu, D.; Ferrante, A.A. Dual-beam fourier domain optical doppler tomography of zebrafish. Opt. Express 2008, 16, 13624–13636. [Google Scholar] [CrossRef] [PubMed]
- Zeng, Y.; Xu, J.; Li, D.; Li, L.; Wen, Z.; Qu, J.Y. Label-free in vivo flow cytometry in zebrafish using two-photon autofluorescence imaging. Opt. Lett. 2012, 37, 2490–2492. [Google Scholar] [CrossRef] [PubMed] [Green Version]
- Malone, M.H.; Sciaky, N.; Stalheim, L.; Hahn, K.M.; Linney, E.; Johnson, G.L. Laser-scanning velocimetry: A confocal microscopy method for quantitative measurement of cardiovascular performance in zebrafish embryos and larvae. BMC Biotechnol. 2007, 7, 40. [Google Scholar] [CrossRef] [PubMed]
- Marr, D.; Hildreth, E. Theory of edge detection. Proc. R. Soc. Lond. Ser. B Biol. Sci. 1980, 207, 187–217. [Google Scholar]
- Jamison, R.A.; Fouras, A.; Bryson-Richardson, R.J. Cardiac-phase filtering in intracardiac particle image velocimetry. J. Biomed. Opt. 2012, 17, 036007. [Google Scholar] [CrossRef]
- Sato, Y. Dorsal aorta formation: Separate origins, lateral-to-medial migration, and remodeling. Dev. Growth Differ. 2013, 55, 113–129. [Google Scholar] [CrossRef]
- Watkins, S.C.; Maniar, S.; Mosher, M.; Roman, B.L.; Tsang, M.; St Croix, C.M. High resolution imaging of vascular function in zebrafish. PLoS ONE 2012, 7, e44018. [Google Scholar] [CrossRef]
- Collymore, C.; Tolwani, A.; Lieggi, C.; Rasmussen, S. Efficacy and safety of 5 anesthetics in adult zebrafish (danio rerio). J. Am. Assoc. Lab. Anim. Sci. 2014, 53, 198–203. [Google Scholar]
- Matthews, M.; Varga, Z.M. Anesthesia and euthanasia in zebrafish. ILAR J. 2012, 53, 192–204. [Google Scholar] [CrossRef]
- Lockwood, N.; Parker, J.; Wilson, C.; Frankel, P. Optimal anesthetic regime for motionless three-dimensional image acquisition during longitudinal studies of adult nonpigmented zebrafish. Zebrafish 2017, 14, 133–139. [Google Scholar] [CrossRef] [PubMed]
- Ramlochansingh, C.; Branoner, F.; Chagnaud, B.P.; Straka, H. Efficacy of tricaine methanesulfonate (ms-222) as an anesthetic agent for blocking sensory-motor responses in xenopus laevis tadpoles. PLoS ONE 2014, 9, e101606. [Google Scholar] [CrossRef] [PubMed]
- Cho, G.; Heath, D. Comparison of tricaine methanesulphonate (ms222) and clove oil anaesthesia effects on the physiology of juvenile chinook salmon oncorhynchus tshawytscha (walbaum). Aquac. Res. 2000, 31, 537–546. [Google Scholar] [CrossRef]
- Schwartz, F.J. Use of ms 222 in anesthetizing and transporting the sand shrimp. Prog. Fish Cultur. 1966, 28, 232–234. [Google Scholar] [CrossRef]
- Polese, G.; Winlow, W.; Di Cosmo, A. Dose-dependent effects of the clinical anesthetic isoflurane on octopus vulgaris: A contribution to cephalopod welfare. J. Aquat. Anim. Health 2014, 26, 285–294. [Google Scholar] [CrossRef] [PubMed]
- De Luca, E.; Zaccaria, G.M.; Hadhoud, M.; Rizzo, G.; Ponzini, R.; Morbiducci, U.; Santoro, M.M. Zebrabeat: A flexible platform for the analysis of the cardiac rate in zebrafish embryos. Sci. Rep. 2014, 4, 4898. [Google Scholar] [CrossRef]
- Huertas, A.; Medioni, G. Detection of intensity changes with subpixel accuracy using laplacian-gaussian masks. IEEE Trans. Pattern Anal. Mach. Intell. 1986, 8, 651–664. [Google Scholar] [CrossRef]
- Gore, A.V.; Monzo, K.; Cha, Y.R.; Pan, W.; Weinstein, B.M. Vascular development in the zebrafish. Cold Spring Harb. Perspect. Med. 2012, 2, a006684. [Google Scholar] [CrossRef]
- Sun, P.; Zhang, Y.; Yu, F.; Parks, E.; Lyman, A.; Wu, Q.; Ai, L.; Hu, C.-H.; Zhou, Q.; Shung, K. Micro-electrocardiograms to study post-ventricular amputation of zebrafish heart. Ann. Biomed. Eng. 2009, 37, 890–901. [Google Scholar] [CrossRef]
- Moore, F.B.; Hosey, M.; Bagatto, B. Cardiovascular system in larval zebrafish responds to developmental hypoxia in a family specific manner. Front. Zool. 2006, 3, 4. [Google Scholar] [CrossRef]
- Jacob, E.; Drexel, M.; Schwerte, T.; Pelster, B. The influence of hypoxia and of hypoxemia on the development of cardiac activity in zebrafish larvae. Am. J. Physiol. Regul. Integr. Comp. Physiol. 2002, 283, R911–R917. [Google Scholar] [CrossRef] [PubMed]
- Avdesh, A.; Chen, M.; Martin-Iverson, M.T.; Mondal, A.; Ong, D.; Rainey-Smith, S.; Taddei, K.; Lardelli, M.; Groth, D.M.; Verdile, G. Regular care and maintenance of a zebrafish (Danio rerio) laboratory: An introduction. J. Vis. Exp. 2012, 18, e4196. [Google Scholar] [CrossRef] [PubMed]
- Karlsson, J.; Von Hofsten, J.; Olsson, P.-E. Generating transparent zebrafish: A refined method to improve detection of gene expression during embryonic development. Mar. Biotechnol. 2001, 3, 522–527. [Google Scholar] [CrossRef] [PubMed]
- Sampurna, B.P.; Audira, G.; Juniardi, S.; Lai, Y.-H.; Hsiao, C.-D. A simple imagej-based method to measure cardiac rhythm in zebrafish embryos. Inventions 2018, 3, 21. [Google Scholar] [CrossRef]


© 2019 by the authors. Licensee MDPI, Basel, Switzerland. This article is an open access article distributed under the terms and conditions of the Creative Commons Attribution (CC BY) license (http://creativecommons.org/licenses/by/4.0/).
Share and Cite
Santoso, F.; Sampurna, B.P.; Lai, Y.-H.; Liang, S.-T.; Hao, E.; Chen, J.-R.; Hsiao, C.-D. Development of a Simple ImageJ-Based Method for Dynamic Blood Flow Tracking in Zebrafish Embryos and Its Application in Drug Toxicity Evaluation. Inventions 2019, 4, 65. https://doi.org/10.3390/inventions4040065
Santoso F, Sampurna BP, Lai Y-H, Liang S-T, Hao E, Chen J-R, Hsiao C-D. Development of a Simple ImageJ-Based Method for Dynamic Blood Flow Tracking in Zebrafish Embryos and Its Application in Drug Toxicity Evaluation. Inventions. 2019; 4(4):65. https://doi.org/10.3390/inventions4040065
Chicago/Turabian StyleSantoso, Fiorency, Bonifasius Putera Sampurna, Yu-Heng Lai, Sung-Tzu Liang, Erwei Hao, Jung-Ren Chen, and Chung-Der Hsiao. 2019. "Development of a Simple ImageJ-Based Method for Dynamic Blood Flow Tracking in Zebrafish Embryos and Its Application in Drug Toxicity Evaluation" Inventions 4, no. 4: 65. https://doi.org/10.3390/inventions4040065