1. Introduction
Fused deposition modeling (FDM) is a fabrication method used for the rapid prototyping (RP) of objects by the process broadly known as additive manufacturing (AM). An FDM 3D printer builds objects by depositing melted thermoplastic material extruded from a tiny scanning nozzle. A computer moves either the nozzle or stage layer-by-layer based on instructions coded in a standard triangulated language (STL) format exported from a three-dimensional computer-aided design (3D-CAD) system [
1,
2,
3,
4]. The FDM was originally developed by Scott Cramp in 1988 [
4,
5] and later commercialized by Stratasys Inc. in 1990 [
4]. Though the original apparatus had excellent stability and precision for fabrication, it was too large and expensive to be readily adopted on a commercial basis. When the Stratasys patent on FDM technology expired, the name “FDM 3D printer” came to be widely used to describe the fused filament fabrication (FFF) 3D printer, largely through initiatives in the open-source development community such as the replicating rapid prototyper (RepRap) project. Then came a new generation of FFF 3D printers sold commercially at affordable prices, opening the way to their use for prototyping and development in companies, the fabrication of tools for research and development in laboratories, DIY creation by hobbyists, and so on [
6,
7,
8]. The objects printed for these applications are composed of the thermoplastic materials, typically acrylonitrile butadiene styrene (ABS) and poly(lactic acid) (PLA), fed out as continuous filaments from an unwinding reel. ABS and PLA are both supplied from companies at reasonable prices.
PLA is a biodegradable aliphatic polyester derived from farm products such as corn starch and sugarcane by the polymerization of lactide or the direct condensation of lactic acid monomers [
9,
10]. The glass transition temperature, melting temperature, and other properties of the thermoplastic are appropriate for processing by both FFF and injection molding (I.M.) methods. PLA has superior mechanical properties, with a maximum tensile strength of 43–64 MPa [
11,
12,
13,
14]. The mechanical properties of PLA deteriorate by hydrolysis in moisture and enzymatic action, and ultimately the material degrades into carbon dioxide and water [
9,
10]. These characteristics have been used to advantage in eco-friendly green plastics and medical tools such as bone setter bolts and pins [
12,
15,
16,
17,
18,
19,
20,
21].
The mechanical properties of a structure made by an FFF 3D printer depend on the scan pattern of the nozzle [
2,
22,
23,
24,
25]. The designer thus has to consider the relations between the scan pattern and mechanical properties of the structure. The mechanical properties of PLA-based polymer structures fabricated with commercial-level FFF 3D printers have been evaluated to clarify the dependence of the mechanical properties on the nozzle scan pattern [
2,
22,
23,
24]. Because the mechanical properties of PLA deteriorate by degradation, the degradation rates must be obtained as basic data for the design of the structure. At present, relatively little data has been reported on the deterioration of the mechanical properties of PLA structures fabricated by commercial-level FDM 3D printers.
The deterioration of the mechanical properties of PLA has been evaluated both in vivo [
11,
12,
17,
18,
19,
20,
21,
26] and in vitro [
11,
17,
19,
26] in research on bone setting bolts or pins. The strengths of fabricated PLA structures have been evaluated by tensile tests [
14,
17,
19,
27], flexural tests [
17,
28], and shear tests [
17] after heat degradation at 37 °C [
17,
19,
26,
28,
29]. The immersion solutions used for the in vitro test were saline [
29], phosphate buffer saline [
19,
26,
29,
30,
31], and distilled water [
11].
In this paper we evaluated the changes in the mechanical properties of PLA structures fabricated by a commercially available FFF 3D printer and immersed in saline. Four pieces were printed by the FFF 3D printer using four nozzle scan patterns, and a fifth test piece was fabricated by I.M. The scan patterns were parallel (P.), vertical (V.), parallel-and-vertical (P.V.), and cross-hatched at opposing diagonal angles (C.) to the longitudinal direction. Each test piece was immersed in saline for 15, 30, or 90 days. The mechanical properties were evaluated by determining the maximum stress, Young’s modulus, and breaking energy. The mass increases of the structures by water uptake were measured to determine how they corresponded to the changes in the mechanical properties of the structures. The data obtained in this paper will be applied when PLA is employed as the fabrication material for FFF 3D printers.
2. Materials and Methods
2.1. Preparation of Test Pieces
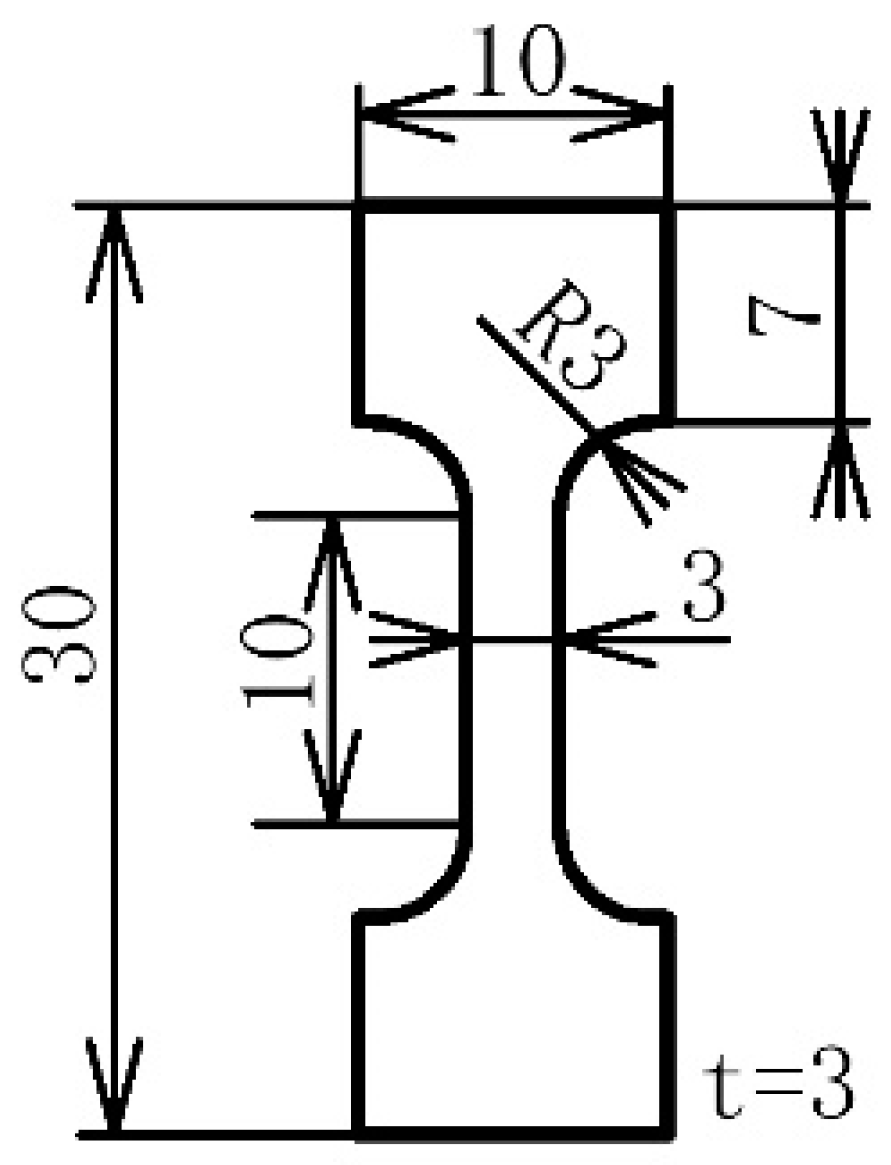
Figure 1 shows the flat, dumbbell-shaped test pieces produced for the tensile tests. Each piece was fabricated using an FFF 3D printer and I.M. apparatus using a commercial PLA for FFF 3D printers (1.75 mm PLA 3D Filament, Color: Translucent white, Waves) supplied in a filament reel.
The 3D-printed test pieces were fabricated by a commercial-level FFF 3D printer (Lepton2, MagnaRecta Inc., Tokyo, Japan) interfaced with slicing and controlling software (Simplify3D, Simplify3D LLC., Cincinnati, OH, USA). The nozzle diameter, scan speed, layer thickness, interior fill percentage (IFP), and temperatures of the nozzle and molding stage were set at Φ0.4 mm, 480 mm/min, 0.2 mm, 100%, and 200 and 80 °C, respectively.
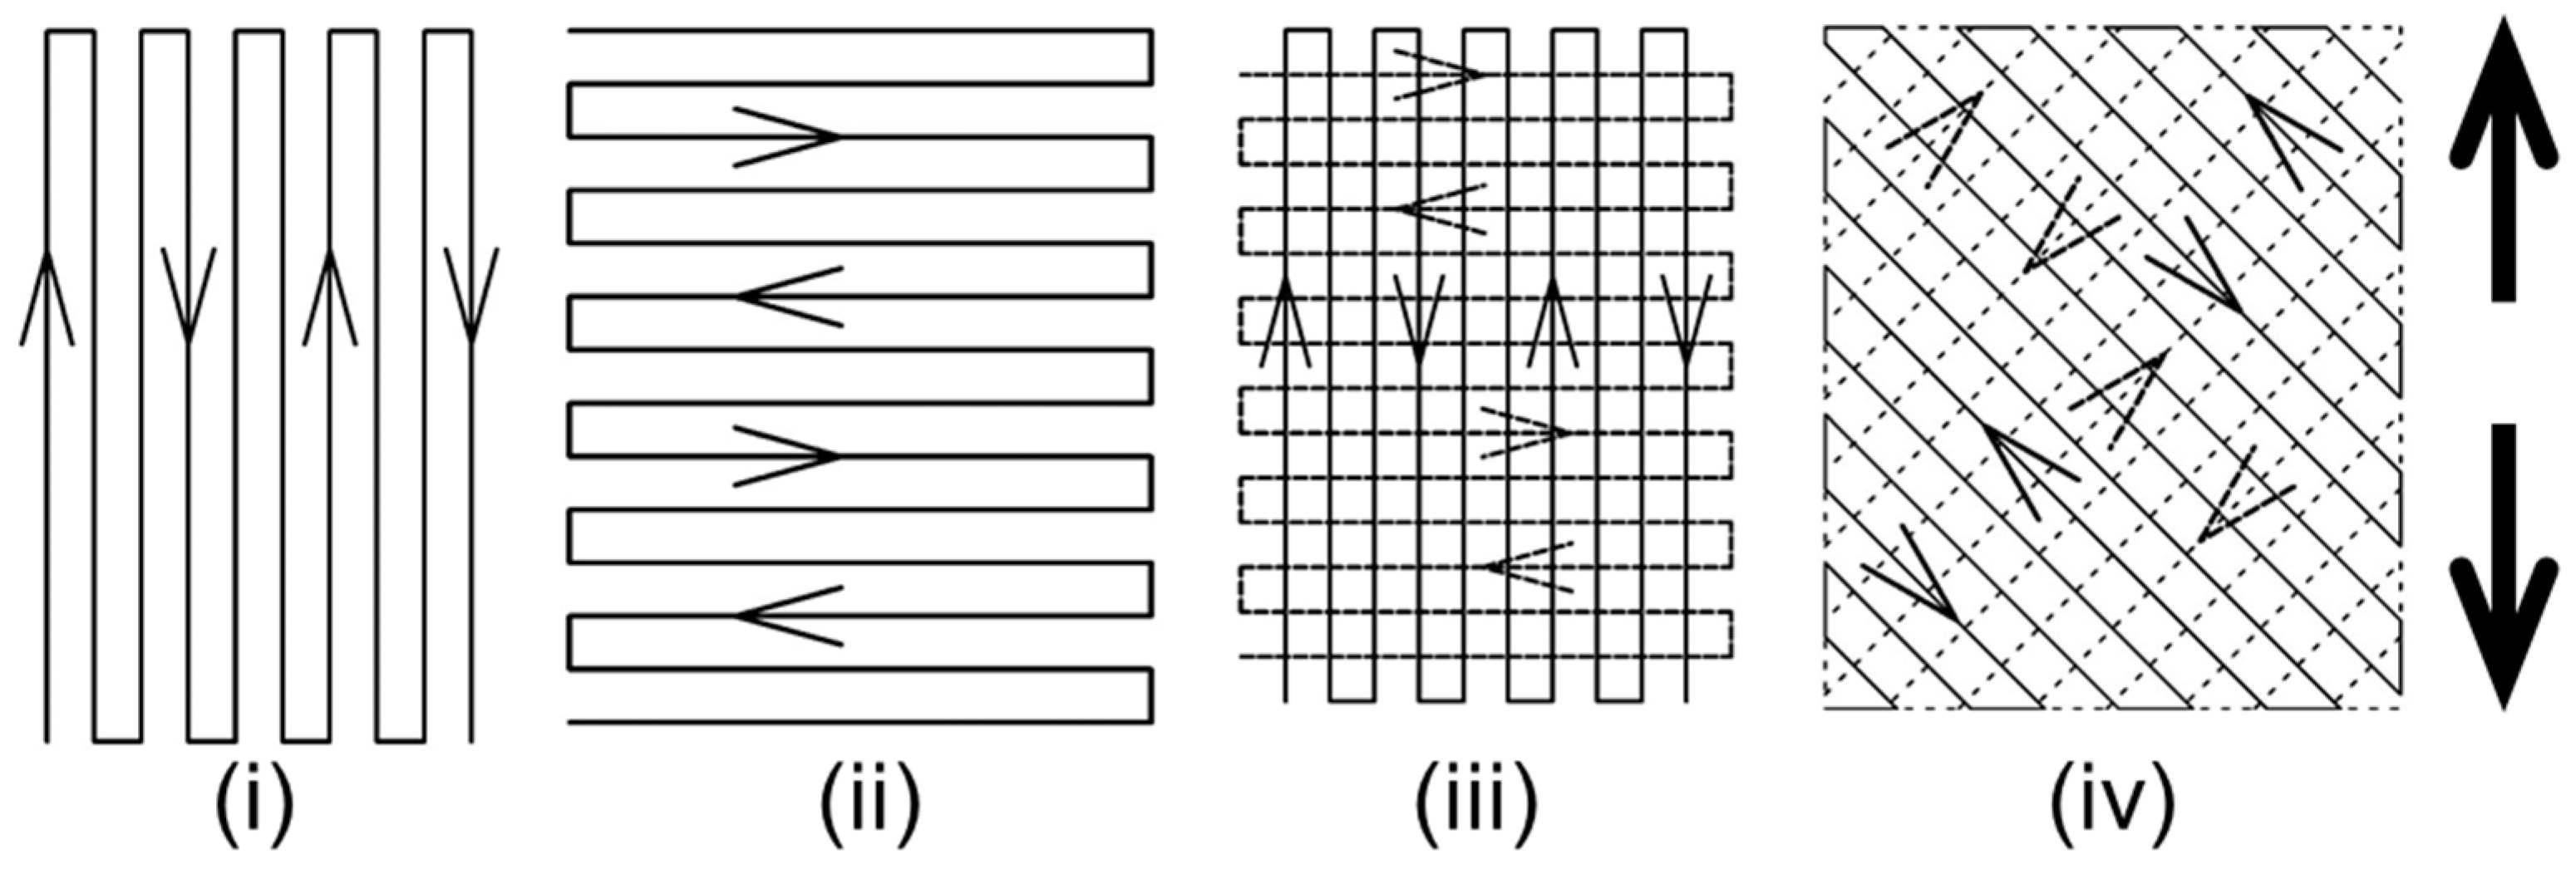
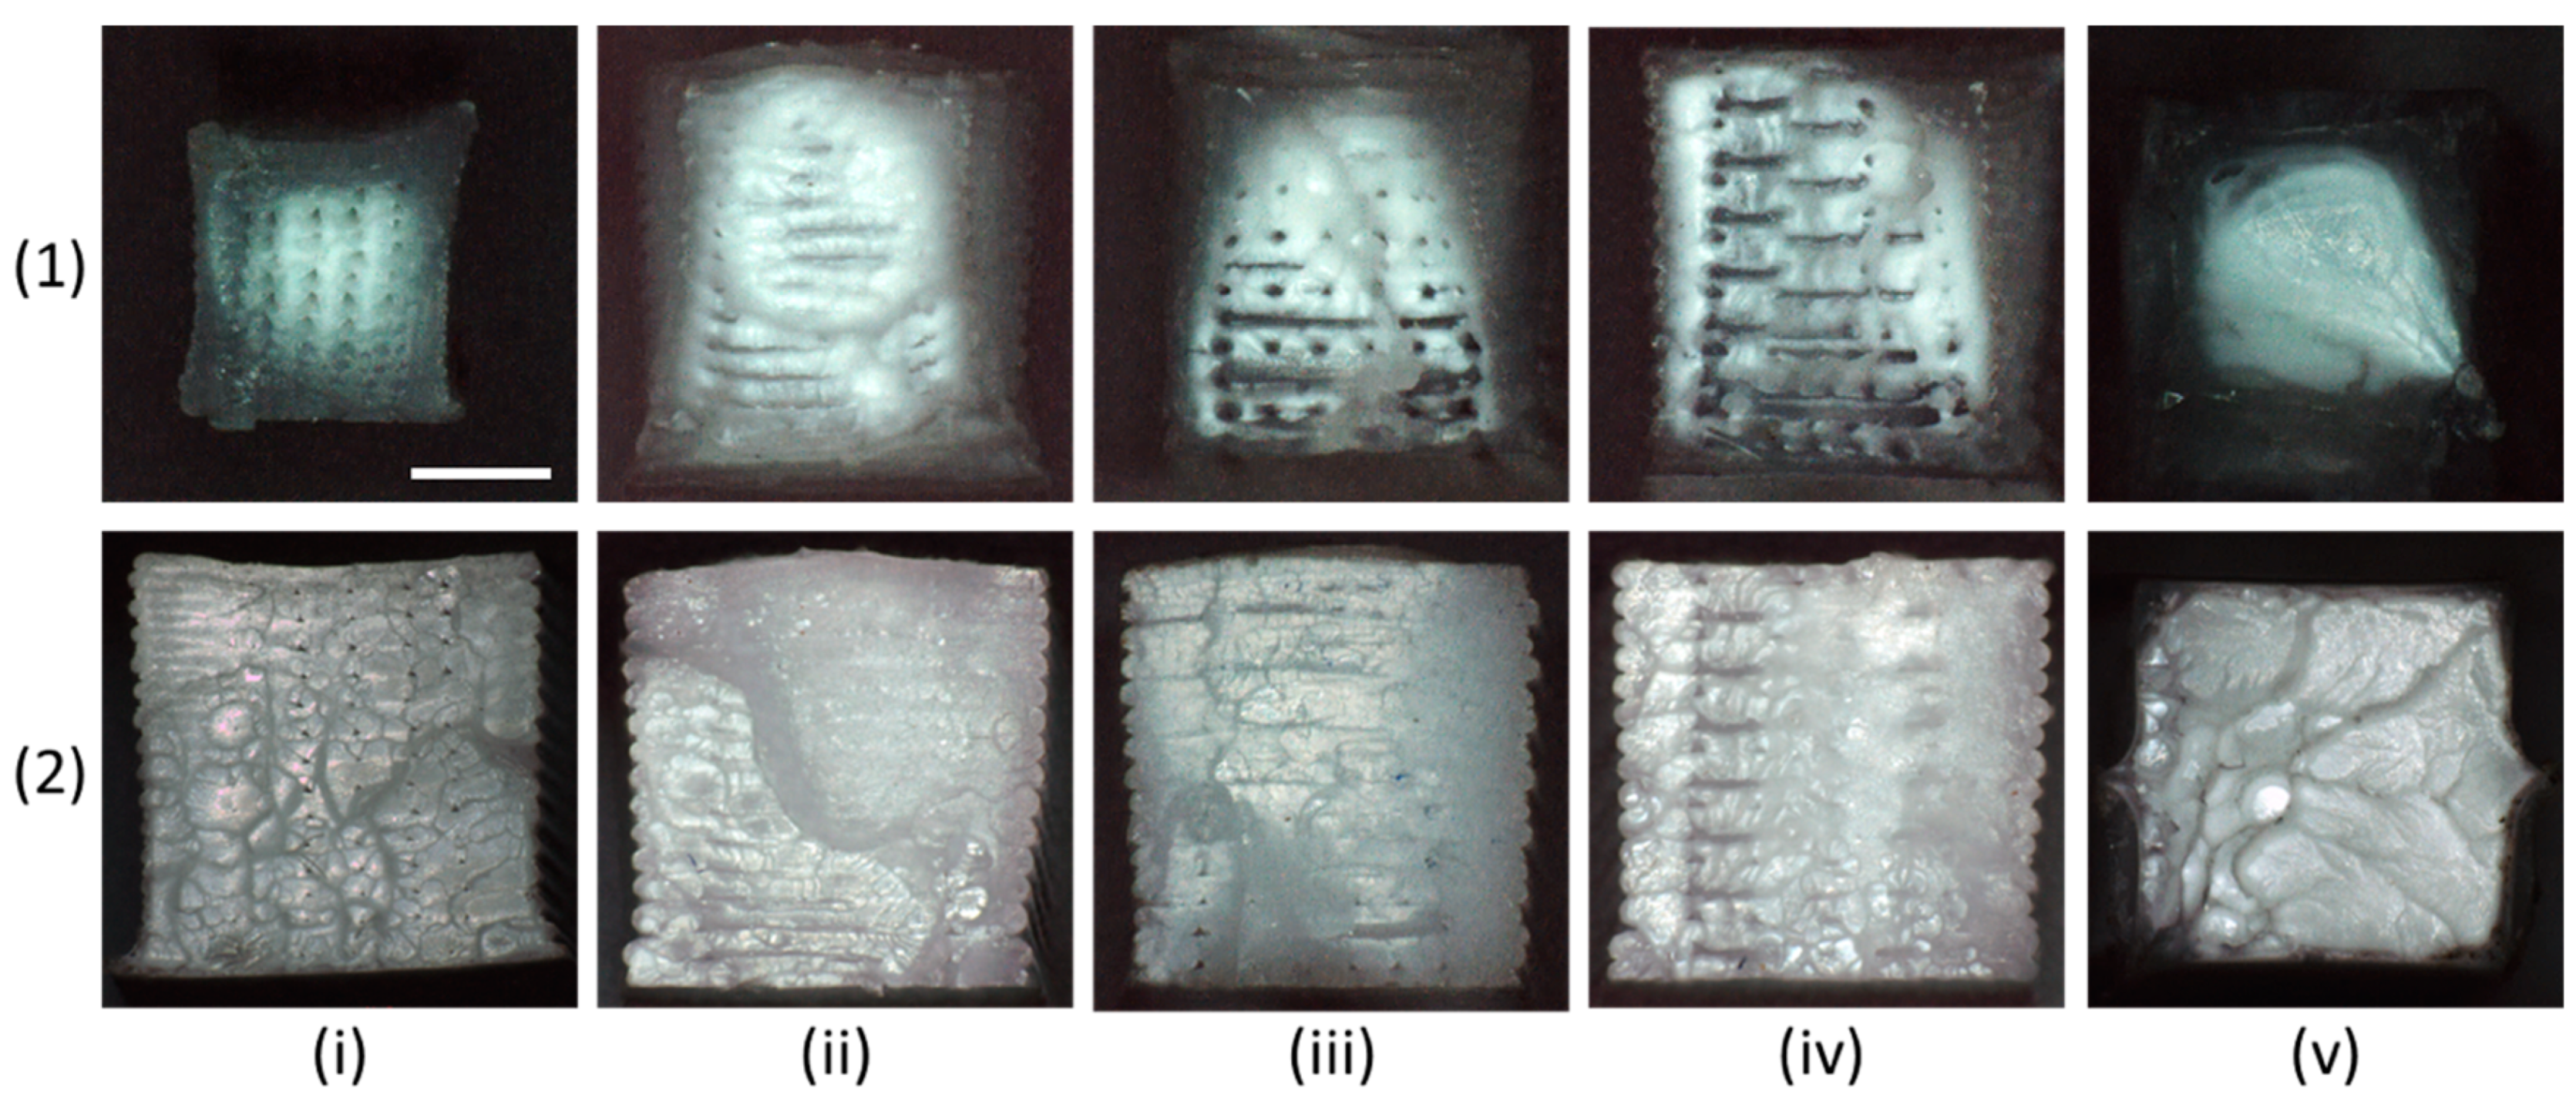
Figure 2 shows four different nozzle scan patterns used for the printing: (i) P., (ii) V., (iii) P.V., and (iv) C. to the longitudinal direction. Test pieces P. and V. were formed by unidirectional scan patterns and test pieces P.V. and C. were formed by bidirectional scan patterns.
The injection-molded test pieces were fabricated by an ultra-compact desktop I.M. apparatus (Digital Factory Corp., Tokyo, Japan). The mold used for the apparatus was designed using a 3D-CAD system and fabricated from VeroWhite resin with a PolyJet type 3D printer (Objet 500 Connex, Stratasys Ltd., Eden Prairie, MN, USA). The mold was designed to allow the melted polymer to flow inside in parallel to the longitudinal direction. The size of the pouring gate measured 5.0 × 2.0 mm.
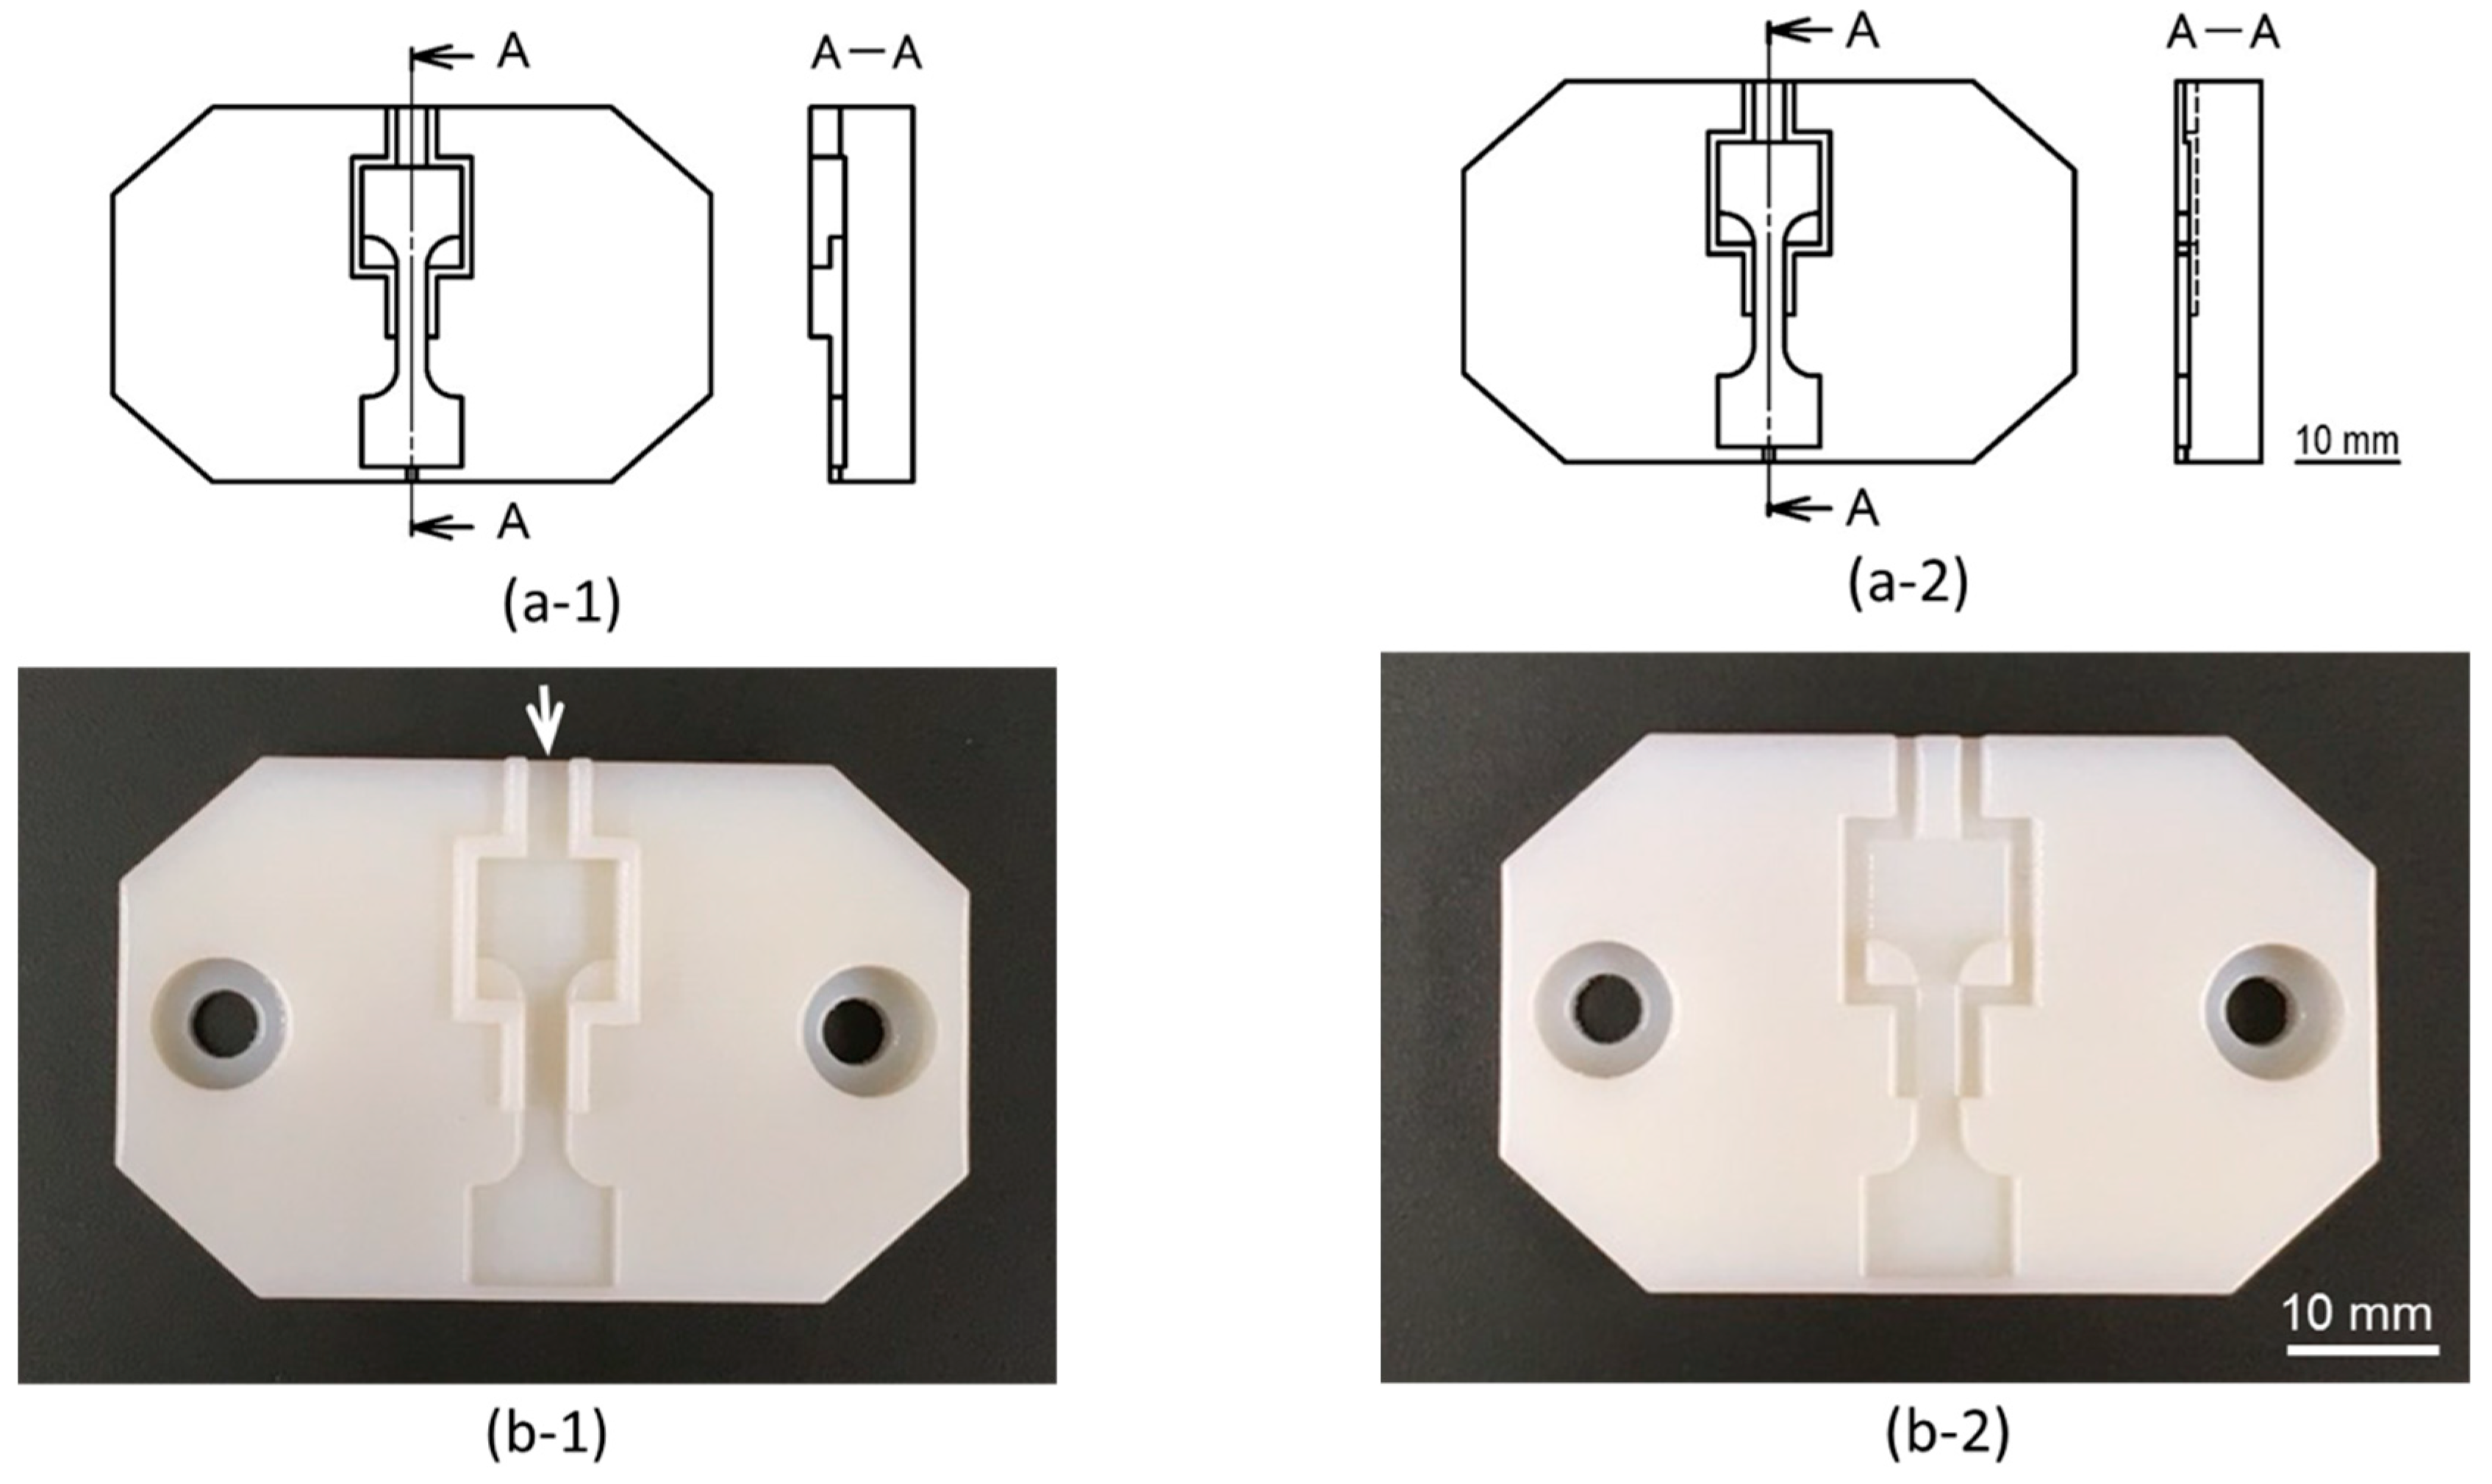
Figure 3a shows schematic representations of the two parts of the mold and
Figure 3b shows photographs of the same. Each half of the mold was fixed by metal clamps and set in the molding apparatus. The PLA filament (about 2 g) was cut and loaded into a metal syringe for injection. The nozzle temperature was set at 245 °C, and the heating of the polymers for injection was kept as short as possible time to prevent thermal decomposition of the resin. The melting condition was checked visually. The test pieces were fabricated one by one to avoid any fluctuation of the fabrication condition. All of the test pieces used in this study were fabricated at room temperature (R.T.) (23–25 °C).
2.2. Tensile Test
The mechanical properties were measured by a tensile test machine (EZ-Graph, Shimadzu Corp., Kyoto, Japan) interfaced with controlling and measuring software (TRAPEZIUM X materials testing software, Shimadzu Corp., Kyoto, Japan). The test pieces were set using specially designed jigs. The load was determined by a load cell (Teada-Huntleigh, Model 615, VPG Transducers, Hampshire, UK). The strain rate was set at 0.12 min−1 based on a gauge length of 10 mm. The non-immersed test pieces (Time = 0; 0 day) were measured on the same day they were fabricated. The immersed test pieces were measured after immersion in saline for certain periods (to be described later). All of the mechanical property measurements were performed at R.T.
The following equations were used to estimate the tensile stress,
σ; strain,
ε; and Young’s modulus,
E.
where
P is the test load,
A is the cross-sectional area of the test piece, Δ
l is the displacement of a crosshead,
l0 is the gauge length,
w and
t are the width and thickness of the test piece. The width and thickness of the test piece were measured just before the tensile test. The maximum tensile stress was determined based on the maximum stress of the stress–strain curve. The Young’s modulus was calculated from the slope of the approximate straight line by the least-squares method in a strain range of 2.2–2.5% on the stress–strain curve. The breaking energy was estimated from the area of the stress–strain curve.
2.3. Immersion of Test Pieces in the Solution, Preparation for the Tensile Test, and Mass Increase
Each test piece was immersed in 8.0 mL of saline (Otsuka Normal Saline (0.9% NaCl), Otsuka Pharmaceutical Factory, Inc., Tokyo, Japan) within a polystyrene case. The pH value of the saline was estimated to be 6.5 by the Auto-pH automated pH measurement system [
32]. The immersed test piece was incubated in the incubator for 15, 30, or 90 days. Before the tensile test, the test piece was wiped with a Kimwipe wiping cloth to remove waterdrops and suctioned by a vacuum pump for 5 min.
The mass increases of the test piece were calculated by the following equation:
where
m0 and
m are mass before and after immersion, respectively.
2.4. Digital Microscope Observation of the Broken Test Pieces
The cross sections of test pieces broken by the tensile test were observed by a digital microscope (SE-2000WR, SELMIC Co., Ltd., Shiga, Japan) consisting of a charge-coupled device (CCD) camera (200 megapixels), lens (SE-40ZP), LED light (SE-LED), and multi-function measurement software.
3. Results
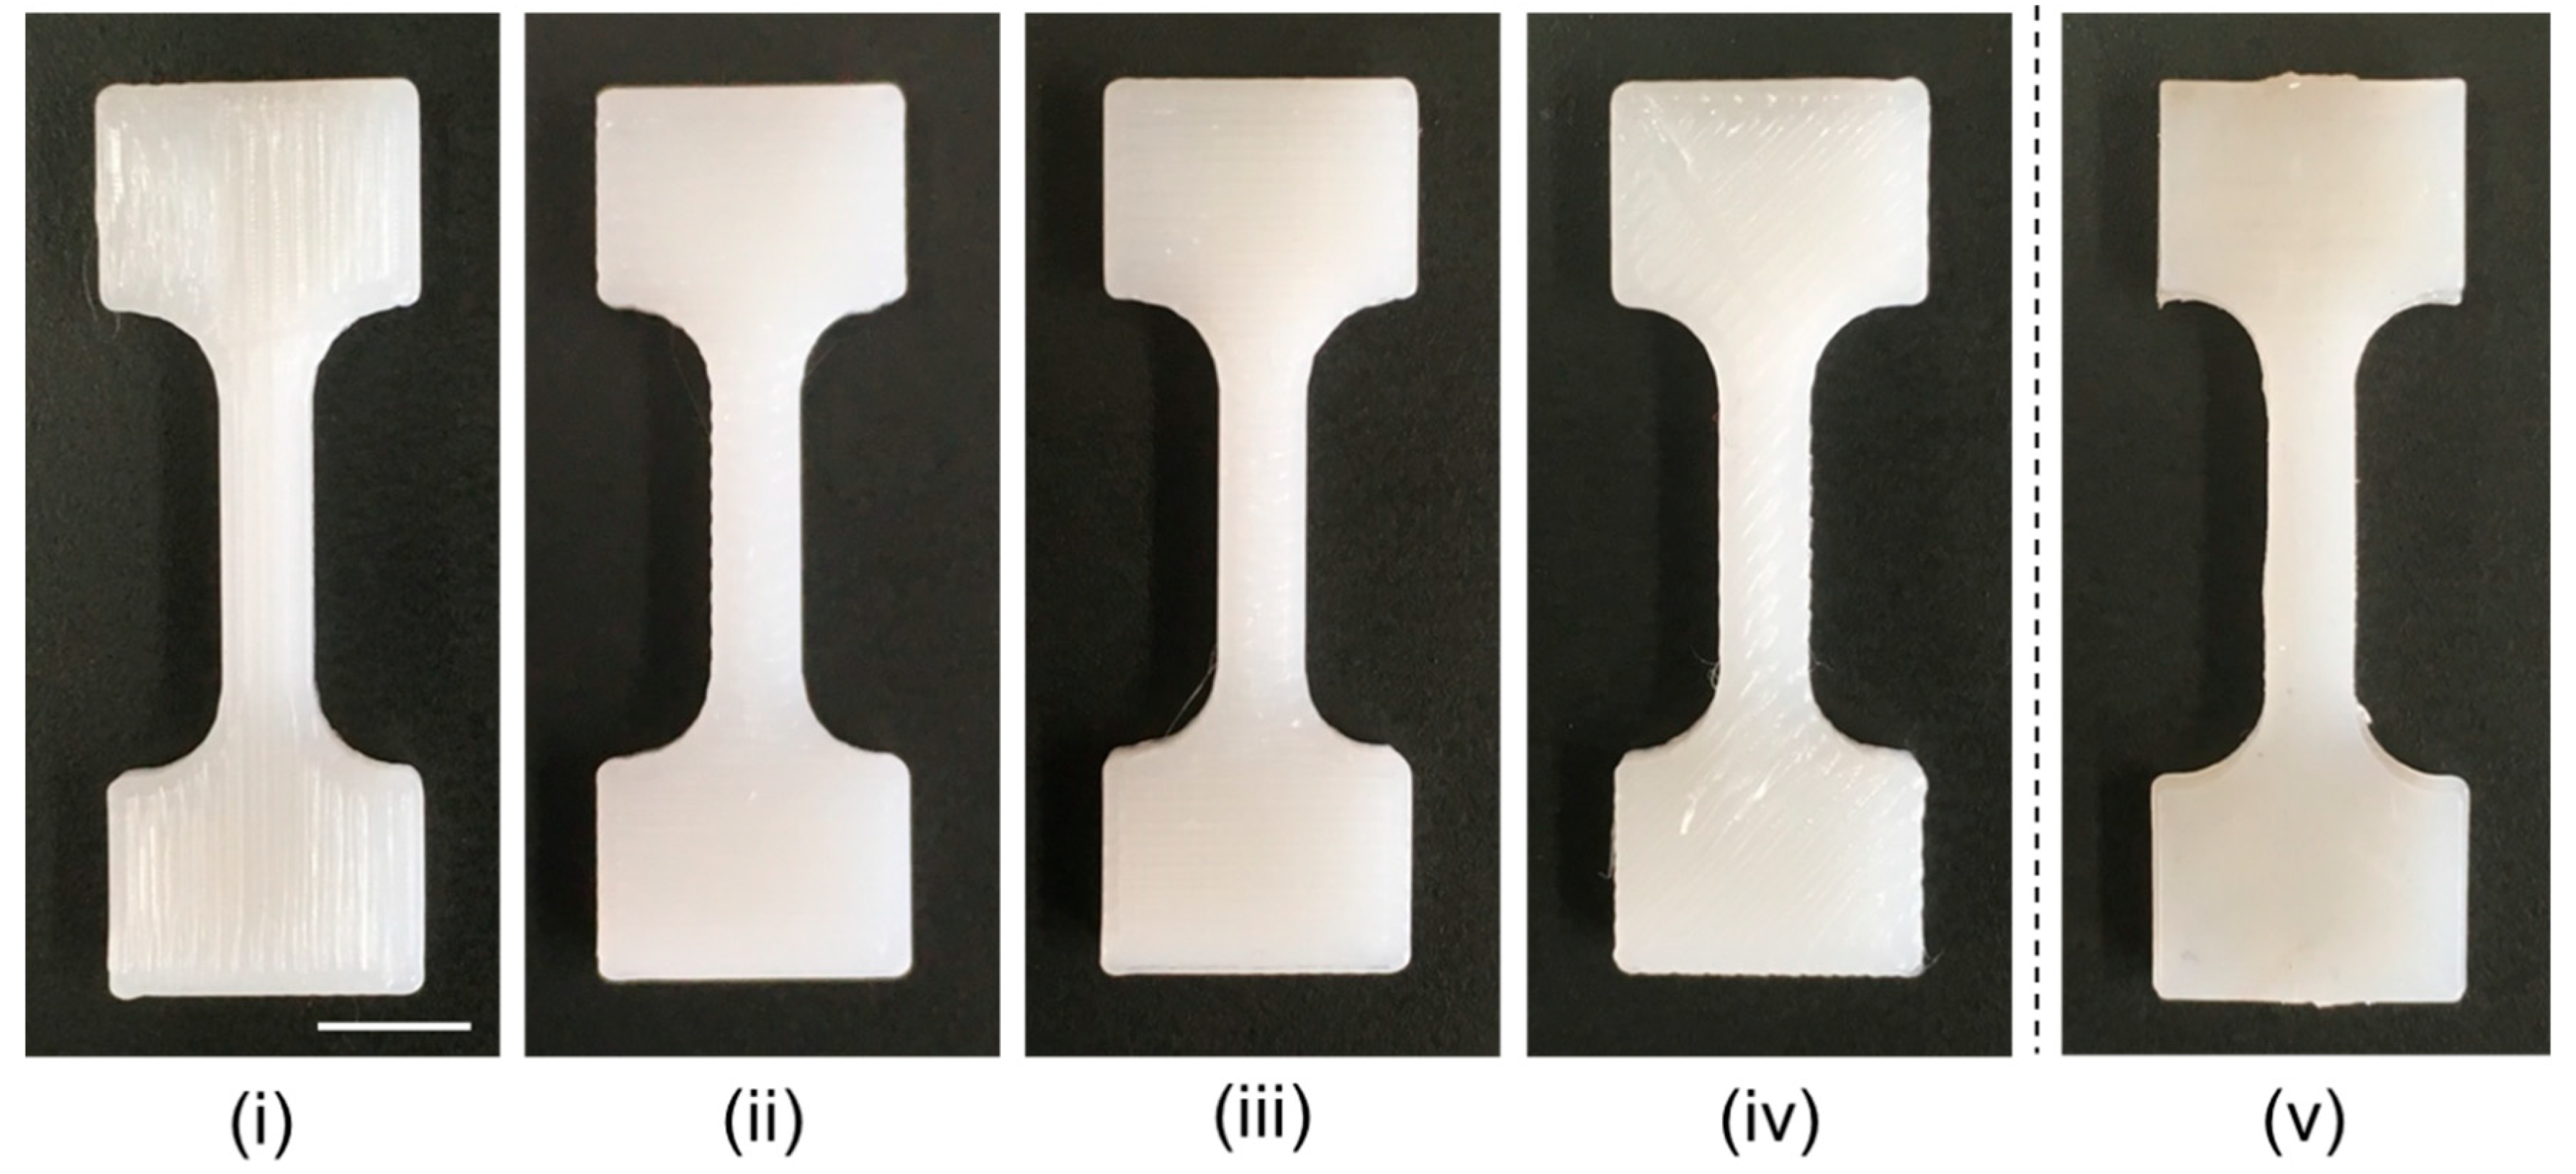
The photographs in
Figure 4 show the external appearances of the test pieces. While the forms of the test pieces looked almost the same, the different nozzle scan patterns used to fabricate the test pieces resulted in visible differences in the surface states.
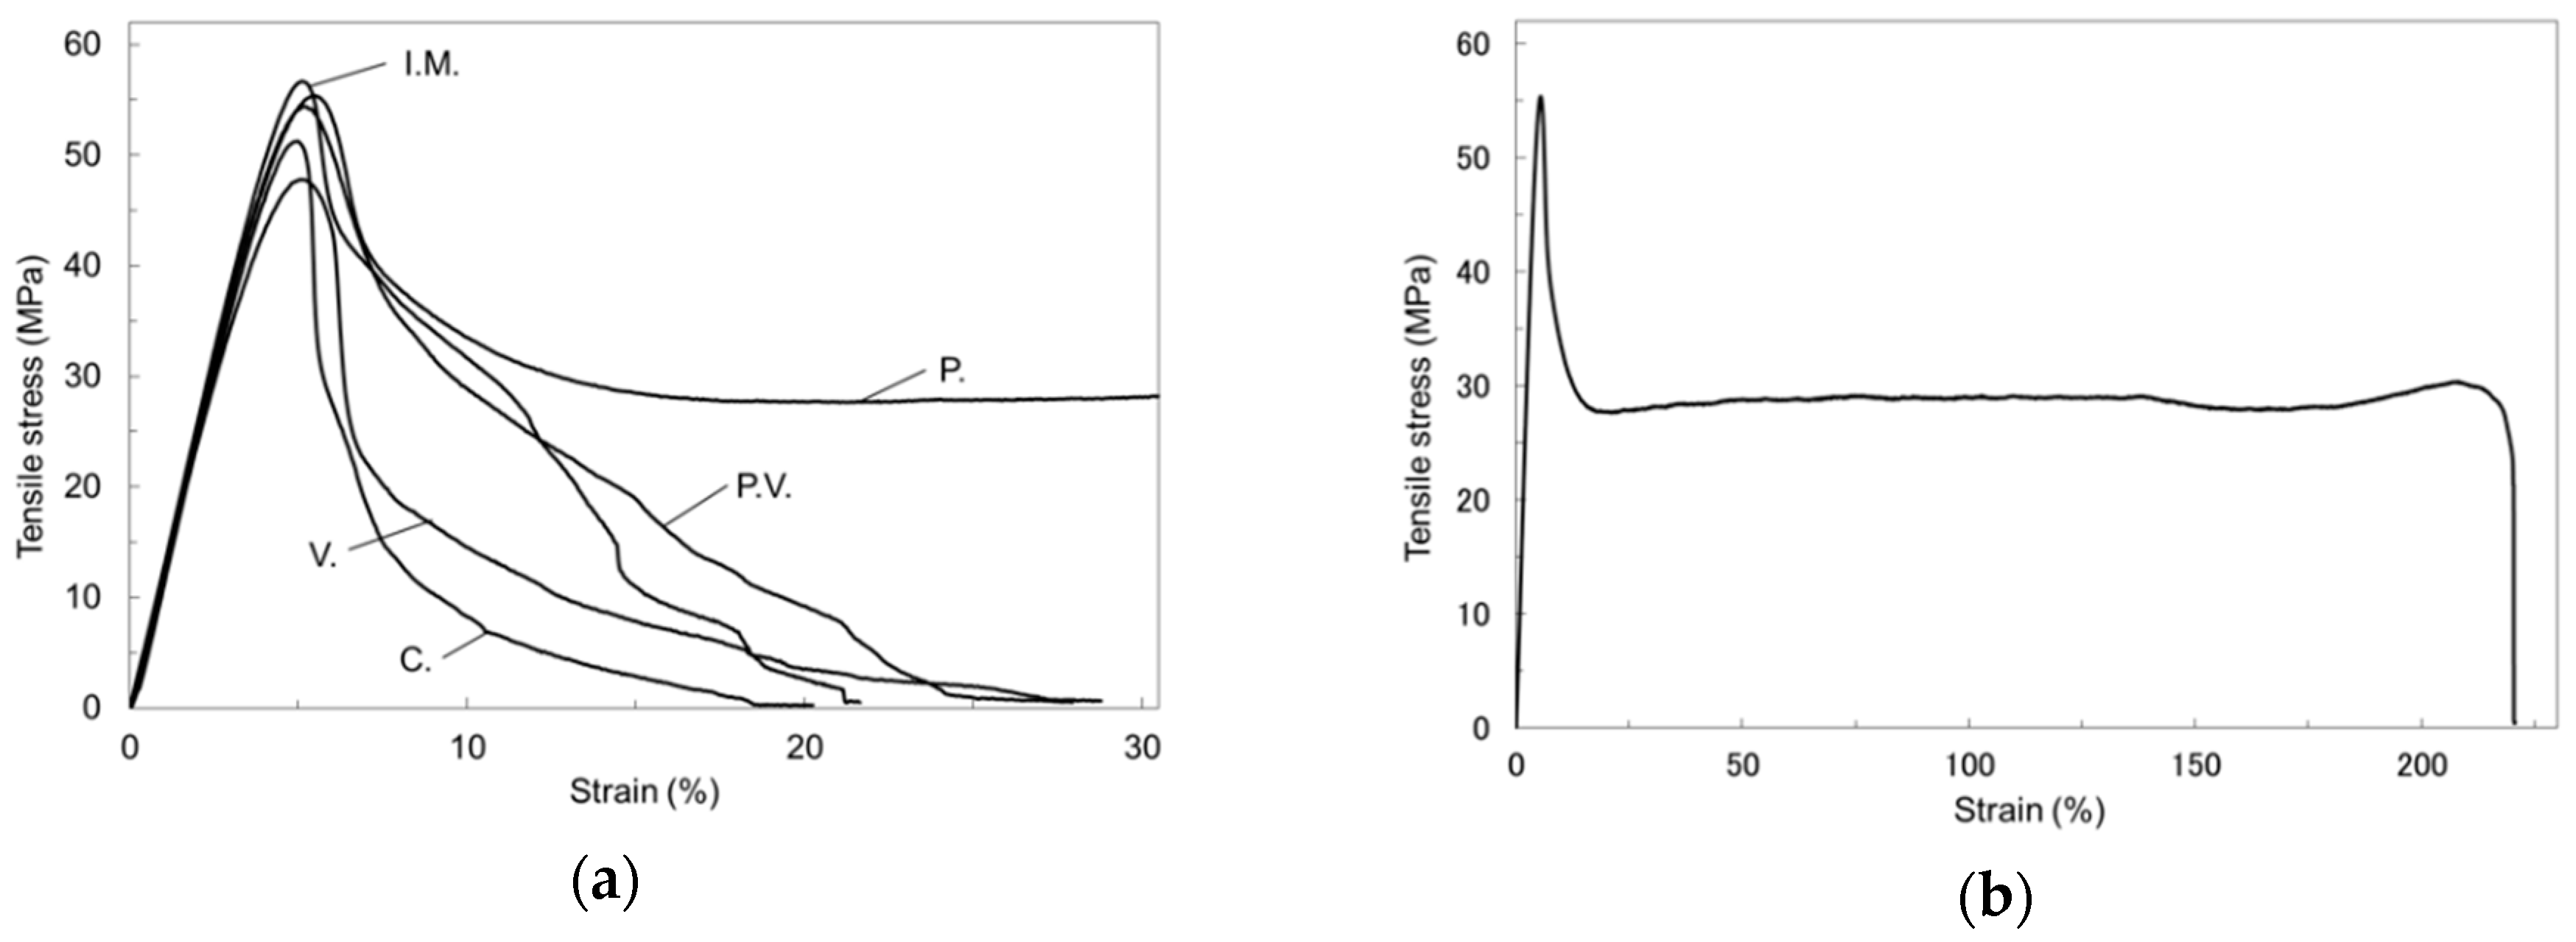
Figure 5 shows representative stress–strain curves from tensile tests performed on the five test piece types kept in a non-immersed condition. As shown in
Figure 5a, the maximum tensile stress attained ranged from 47 to 56 MPa. The tensile stress of each test piece increased with loading, reached maximum stress at around 5–6% strain, and decreased either suddenly (test pieces V. and C.) or gradually (test pieces P., P.V., and I.M.). Test piece P. showed a remarkably larger breaking strain (220.7%) than the other test pieces (
Figure 5b).
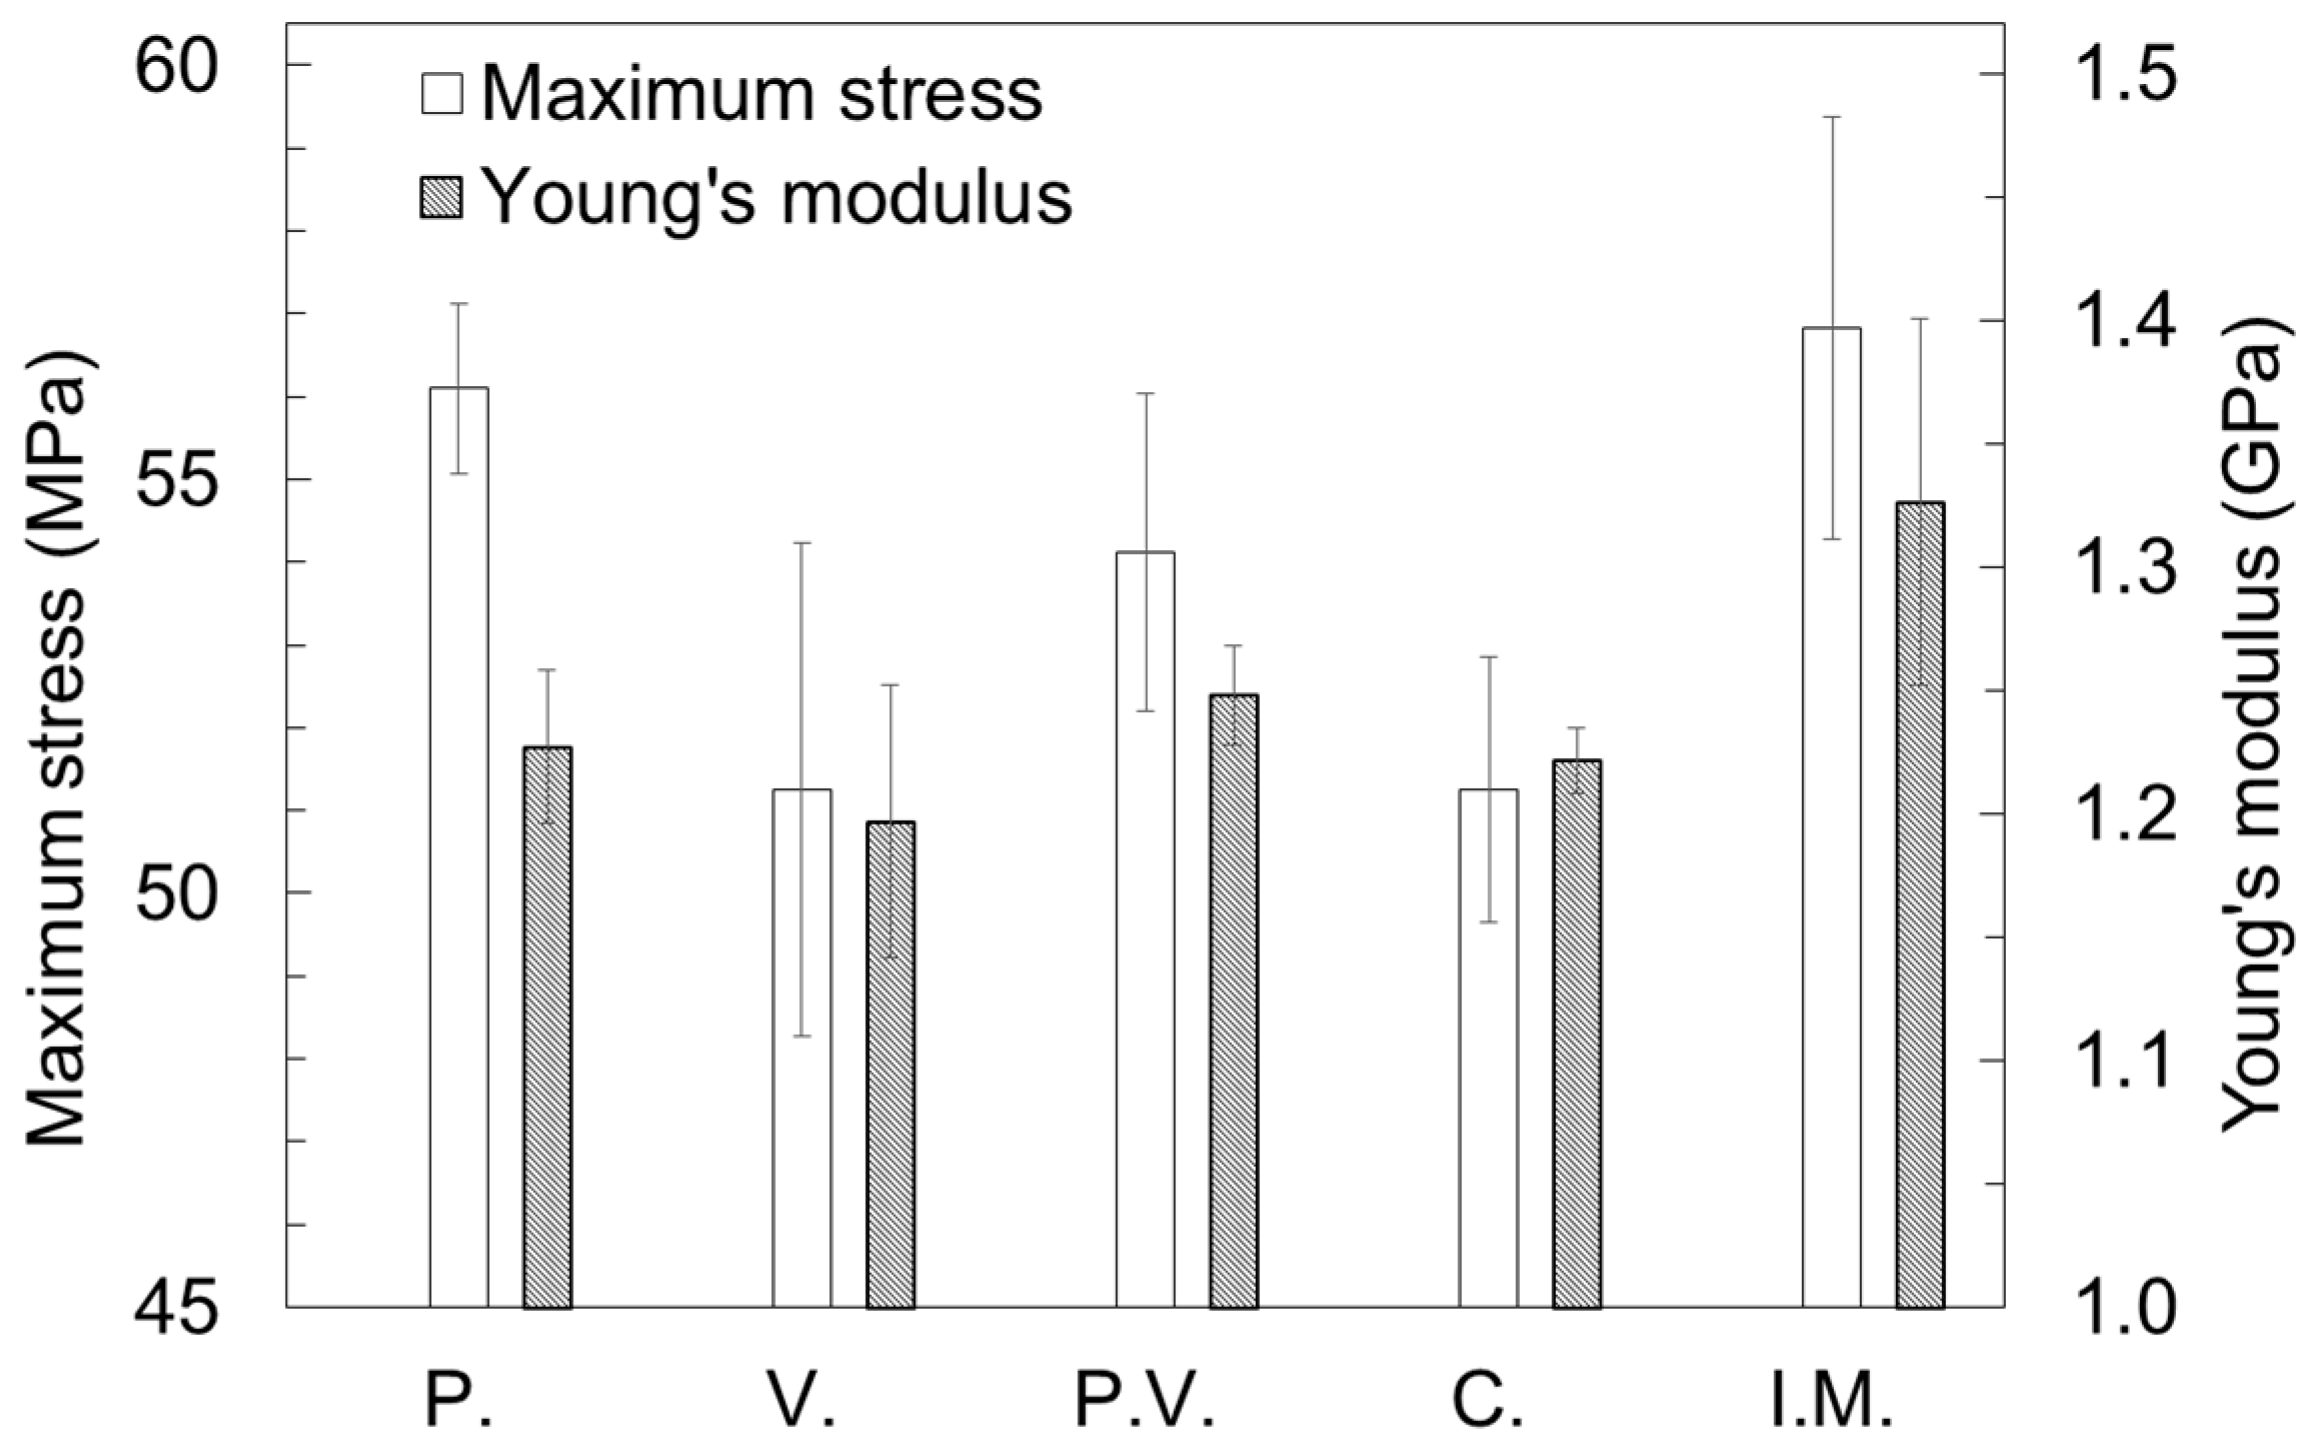
Figure 6 compares the maximum tensile stresses and Young’s moduli of the five test piece types measured without prior immersion in solution. The test pieces fabricated by I.M. withstood the largest average maximum tensile stress (56.83 MPa). The average maximum tensile stress was as follows in the test pieces fabricated with the FFF 3D printer: P., 56.10 MPa; V., 51.25 MPa; P.V., 54.12 MPa; C., 51.25 MPa. The maximum tensile stress in the FFF 3D test pieces was the highest in test piece P, reaching a level approximately equal to that measured in the I.M. test pieces. The I.M. test pieces exhibited the largest average Young’s modulus (1.33 GPa) out of the five test piece types. The average Young’s moduli of the FFF 3D test pieces were P., 1.23; V., 1.20; P.V., 1.25; C., 1.22 GPa. Test piece P.V. exhibited the largest average Young’s modulus out the test pieces fabricated by the FFF 3D printer. The average Young’s modulus of test piece P.V. was 6.06%, which was larger than those of the other three FFF 3D test pieces but smaller than that of the I.M. test pieces.
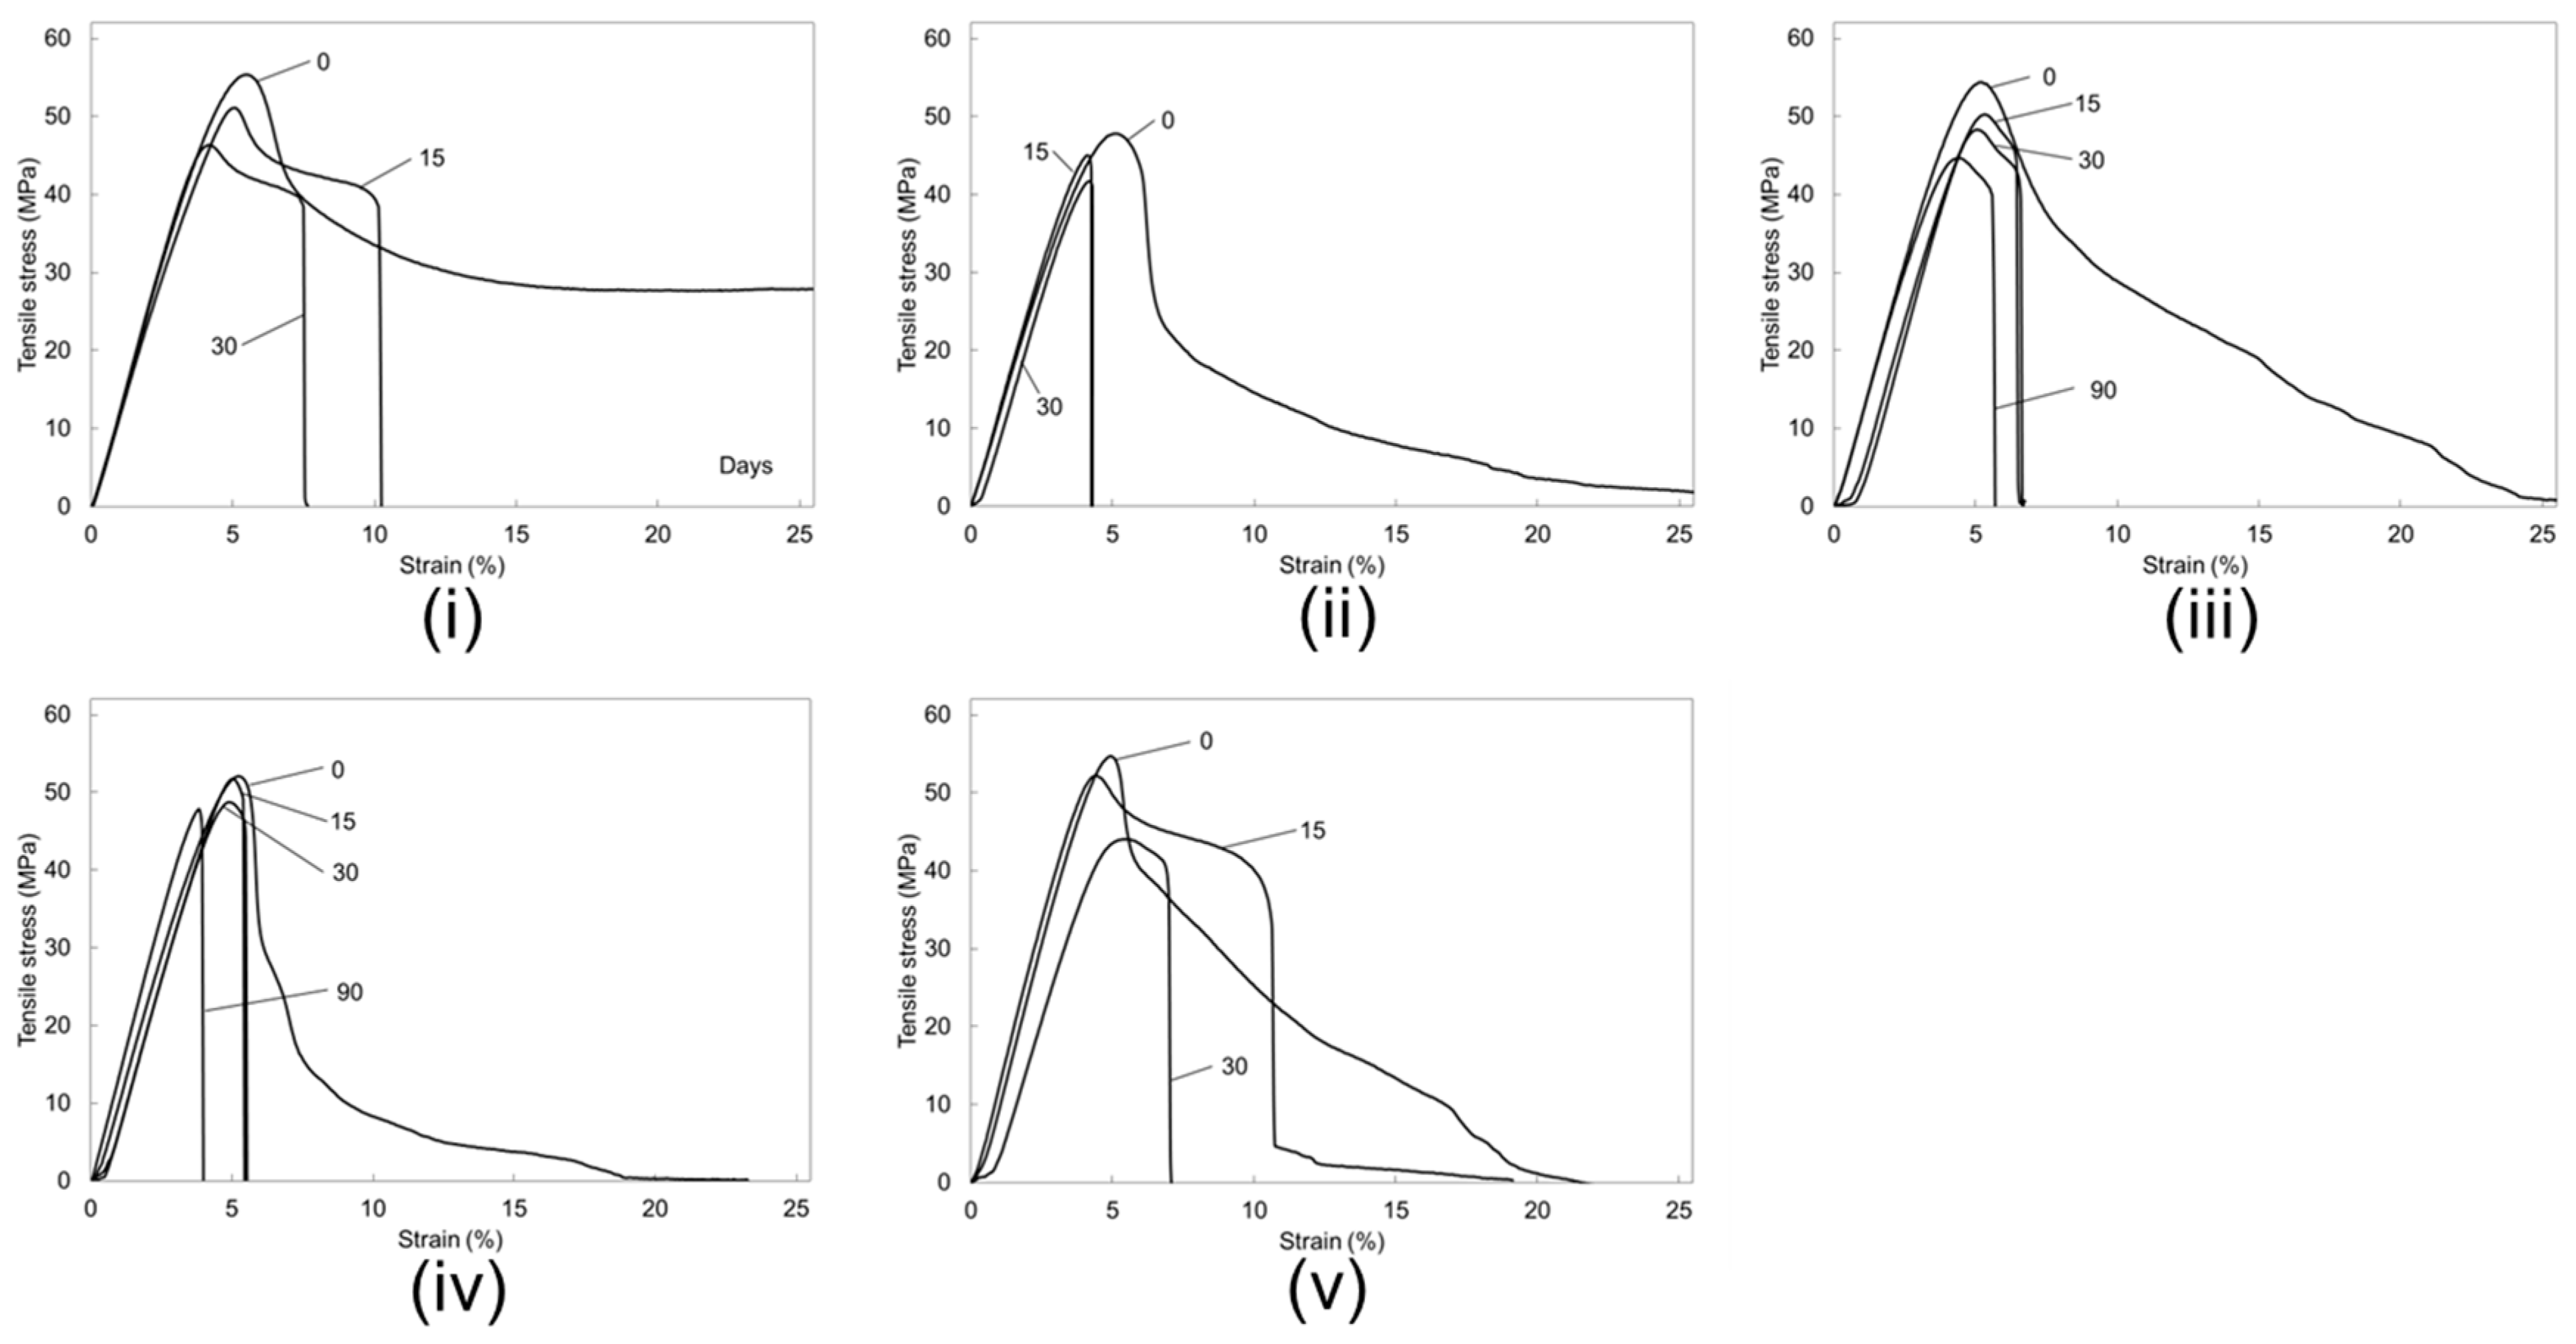
Figure 7 shows representative changes of the stress–strain curves in the tensile test resulting from the immersion in saline. The maximum stress progressively fell as the immersion period increased in all of the test piece types.
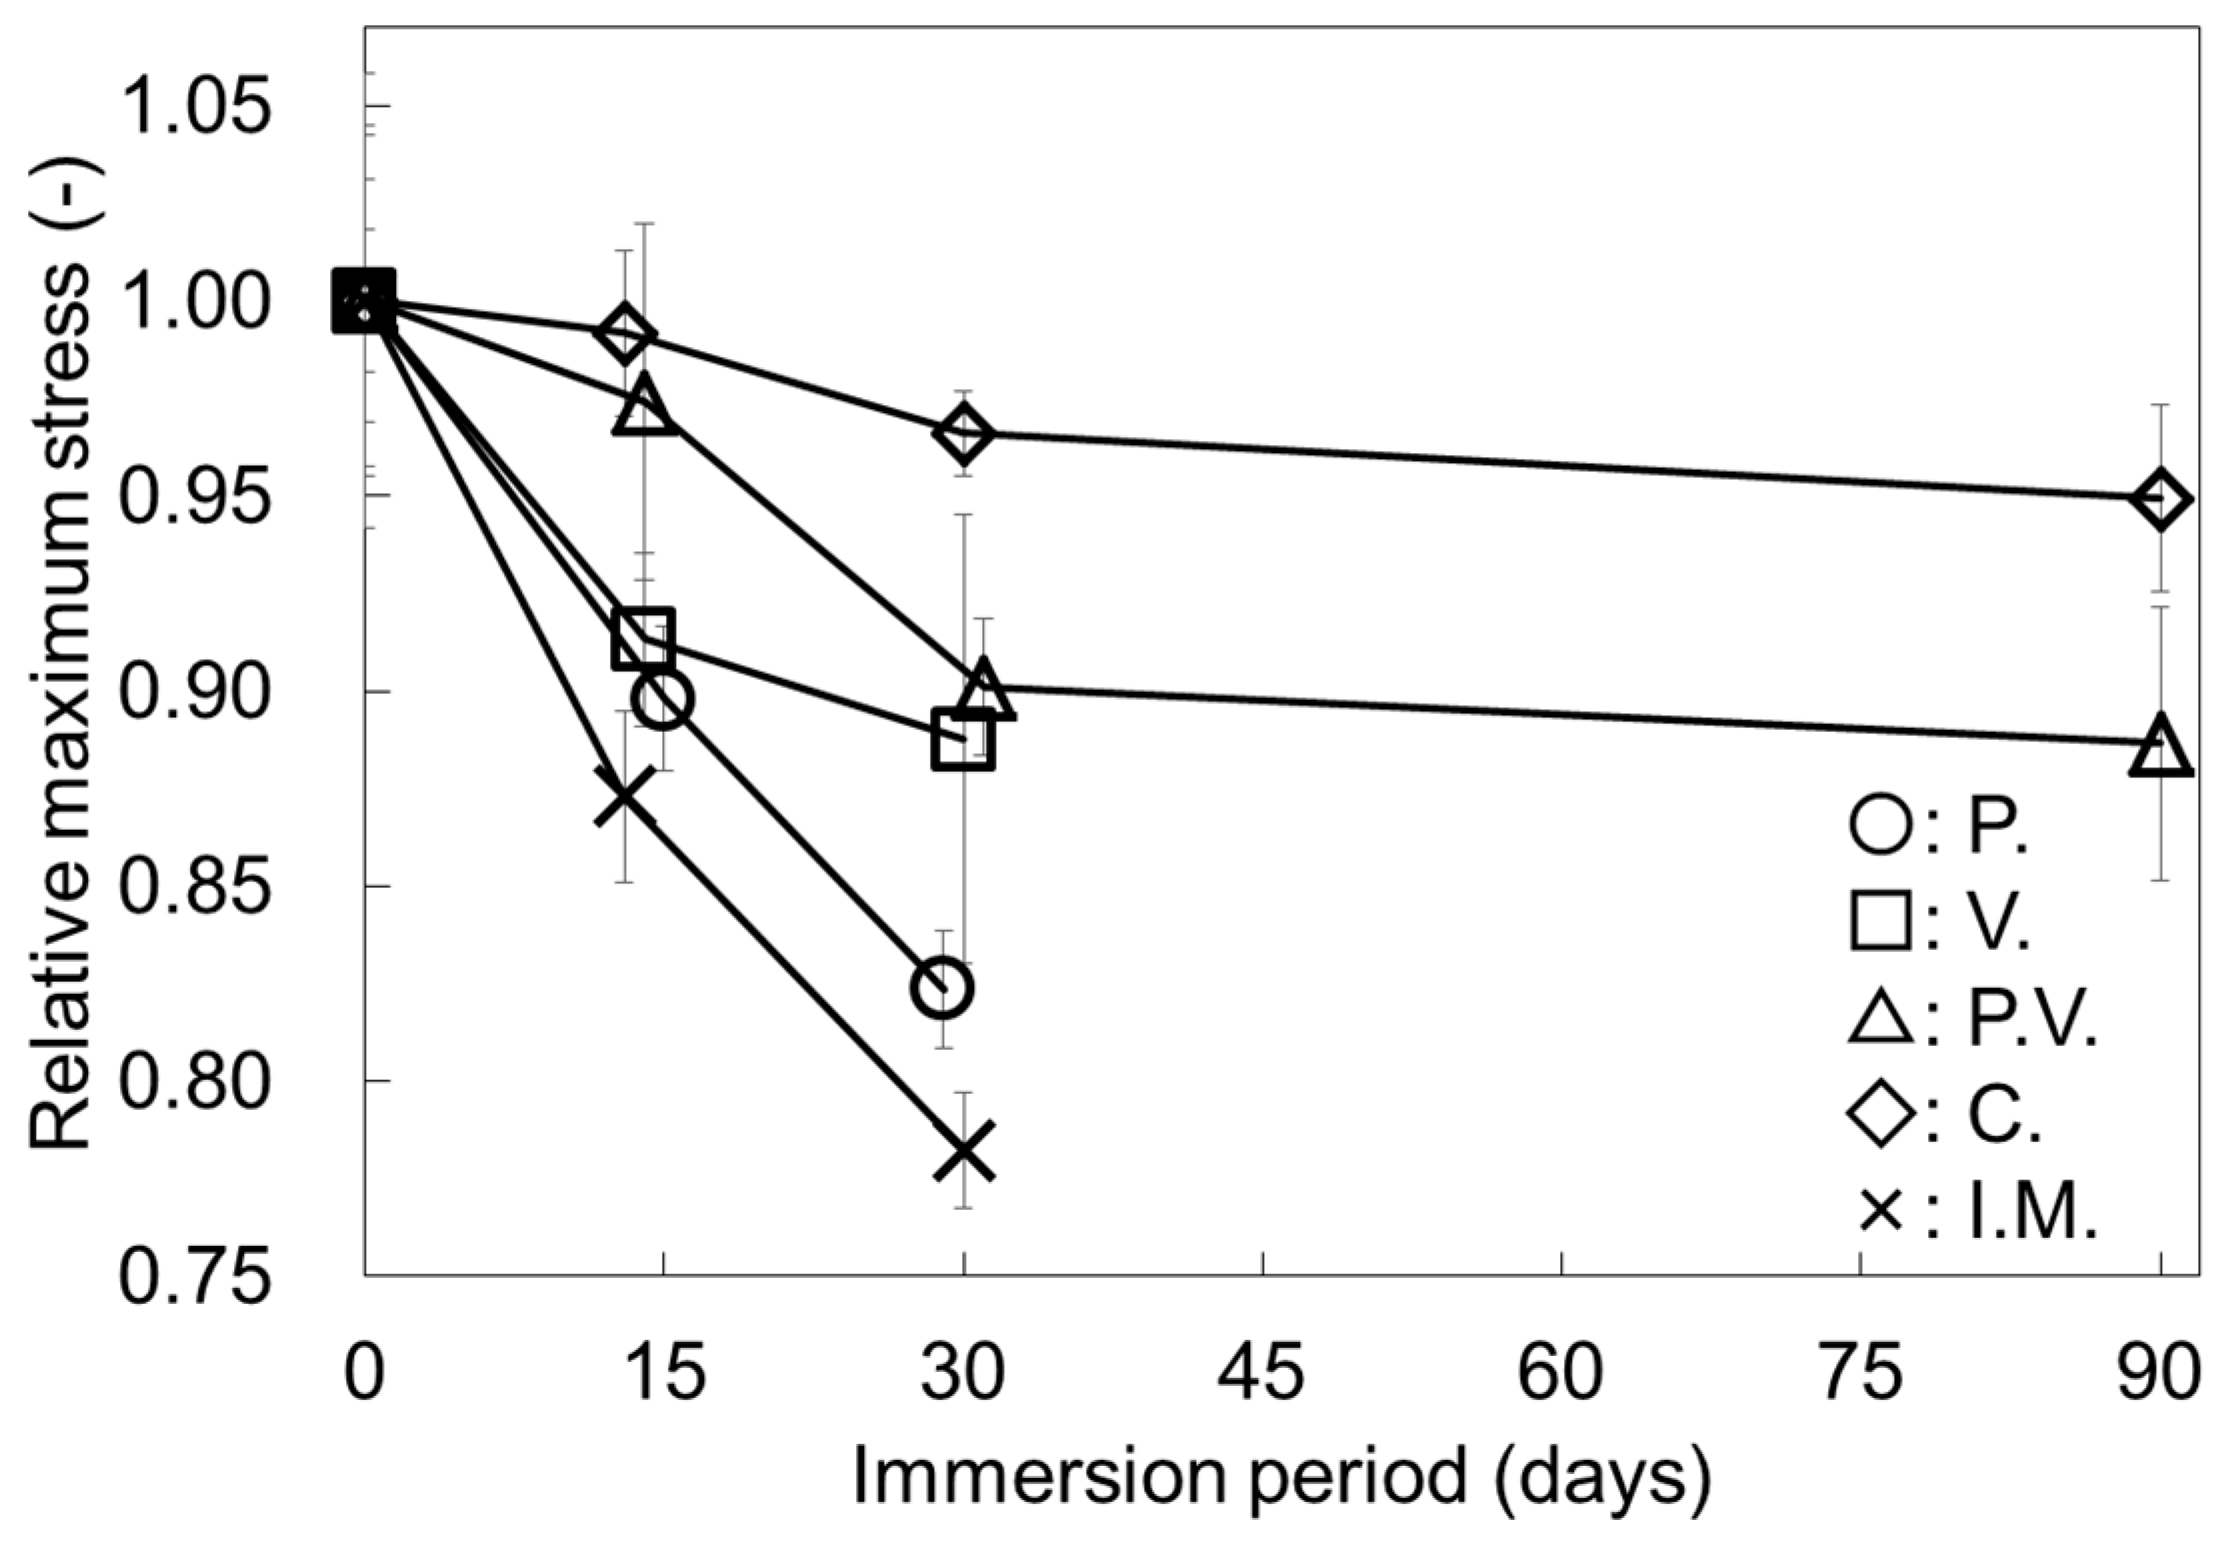
Figure 8 compares the rates by which the average maximum stress dropped in the five test piece types after immersion for certain periods. No data were obtained on the I.M. test pieces and test pieces fabricated using unidirectional scan patterns for the 90-day immersion, as these test pieces unavoidably broke as they were being set into the tensile jigs. The average maximum stresses dropped as the immersion period increased in all types of test pieces. After 15 days of immersion, the average maximum stress declined by the following rates: P., 10.20%; V., 8.68%; P.V., 2.59%; C., 0.82%; I.M., 12.71%. After 90 days of immersion, the average declines were 11.34 in the P.V. test pieces and 5.08% in the C. test pieces. Test pieces P. and V. showed large declines in the average maximum stress at the initial stage of the immersion. In contrast, test piece C. showed a very low rate of decline throughout the entire immersion period.
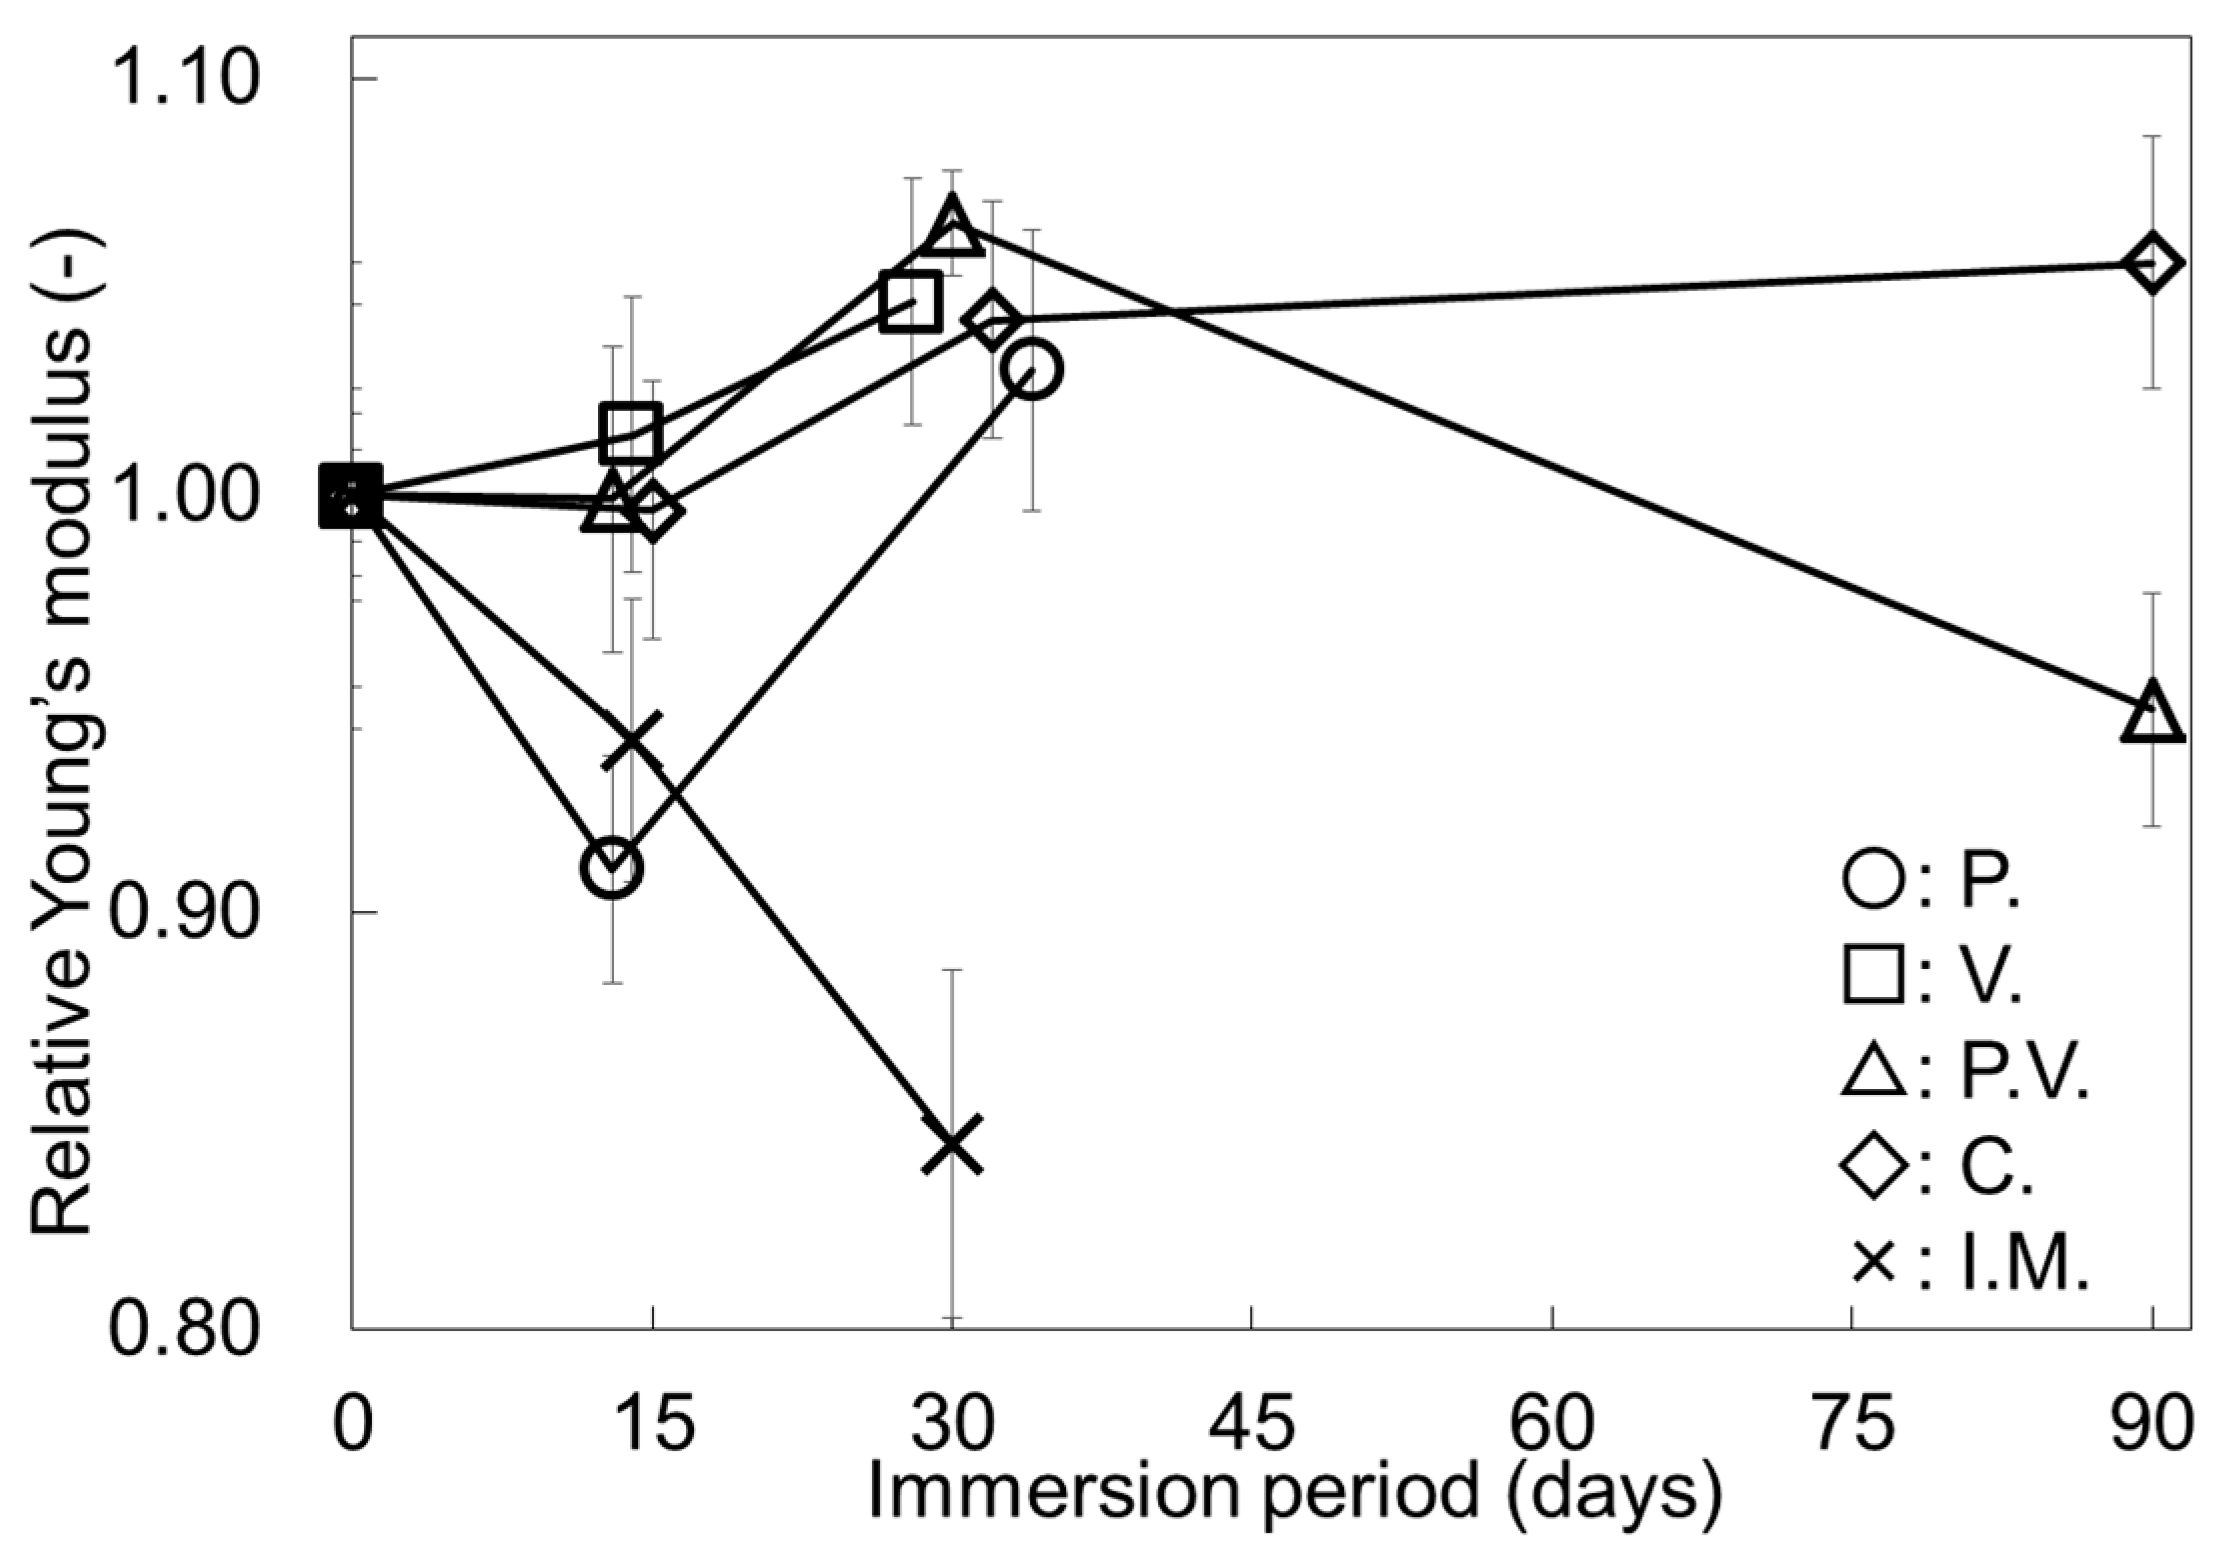
Figure 9 compares changes of the average Young’s moduli of the five test piece types after immersion for certain periods. The average Young’s moduli of the FFF 3D test pieces increased by the following rates after immersion for 30 days: P., 2.91%; V., 4.43%; P.V., 6.12%; C., 4.04%. In contrast, the average Young’s modulus of the I.M. test piece declined by 15.6%.
Figure 10 compares the declines of the breaking energies of the five test piece types after immersion. The average breaking energy of test piece P. was remarkably high in the non-immersed condition (71.80 MJ/m
3, Days = 0). Thirty days of immersion resulted in large declines in the breaking energy in all of the test piece types. The declines in breaking energy after 15 days of immersion were: P., 94.8%; V., 58.2%; P.V., 67.1%; C., 36.8%; I.M., 39.0%. Likewise, those after 30 days of immersion were: P., 96.4%; V., 69.3%; P.V., 74.3%; C., 38.9%; I.M., 57.9%.
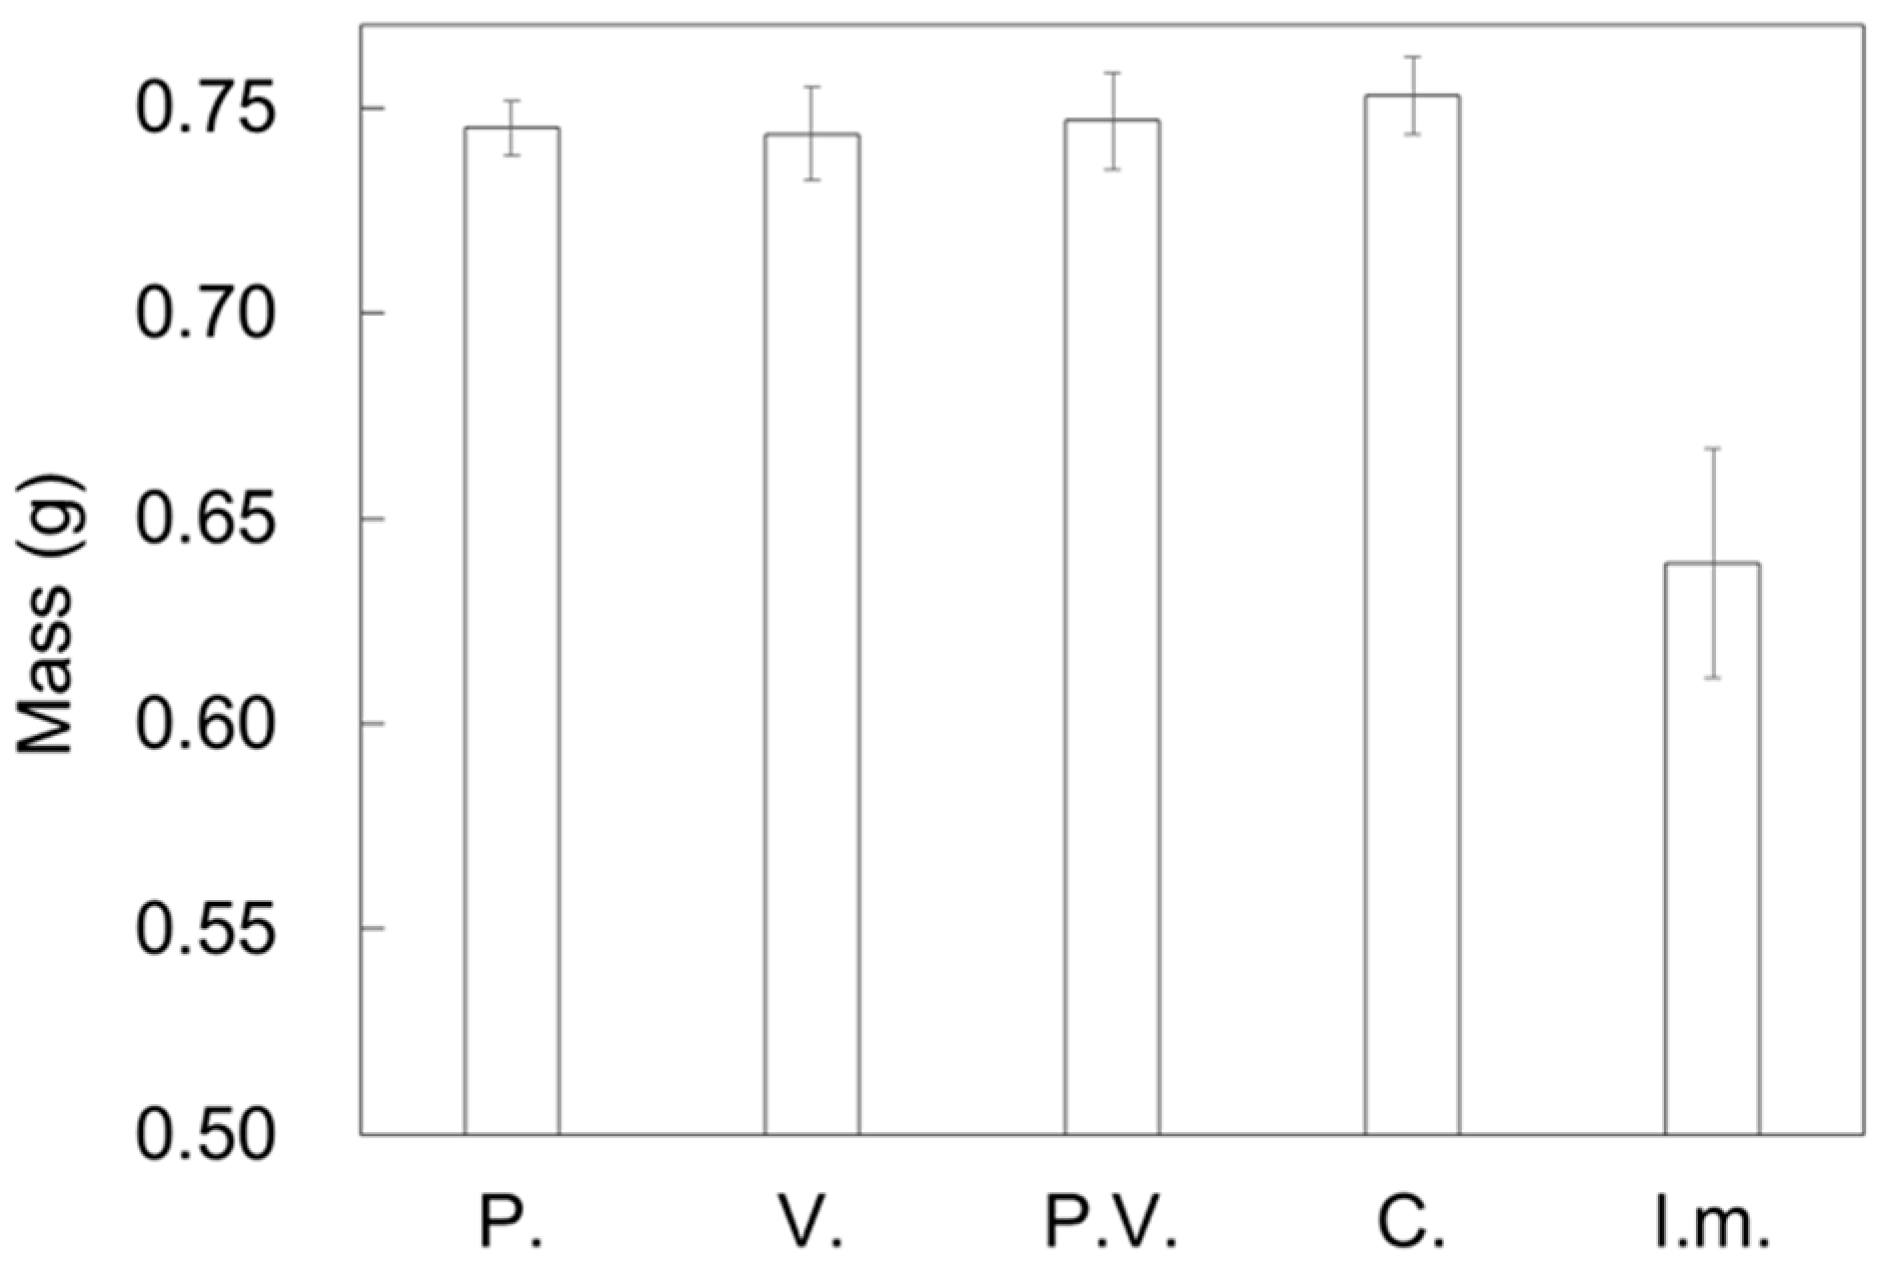
Figure 11 compares the masses of the five test piece types just after fabrication. The average mass of the FFF 3D test pieces was 0.74–0.75 g, while that of the I.M. test pieces was 0.64 g.
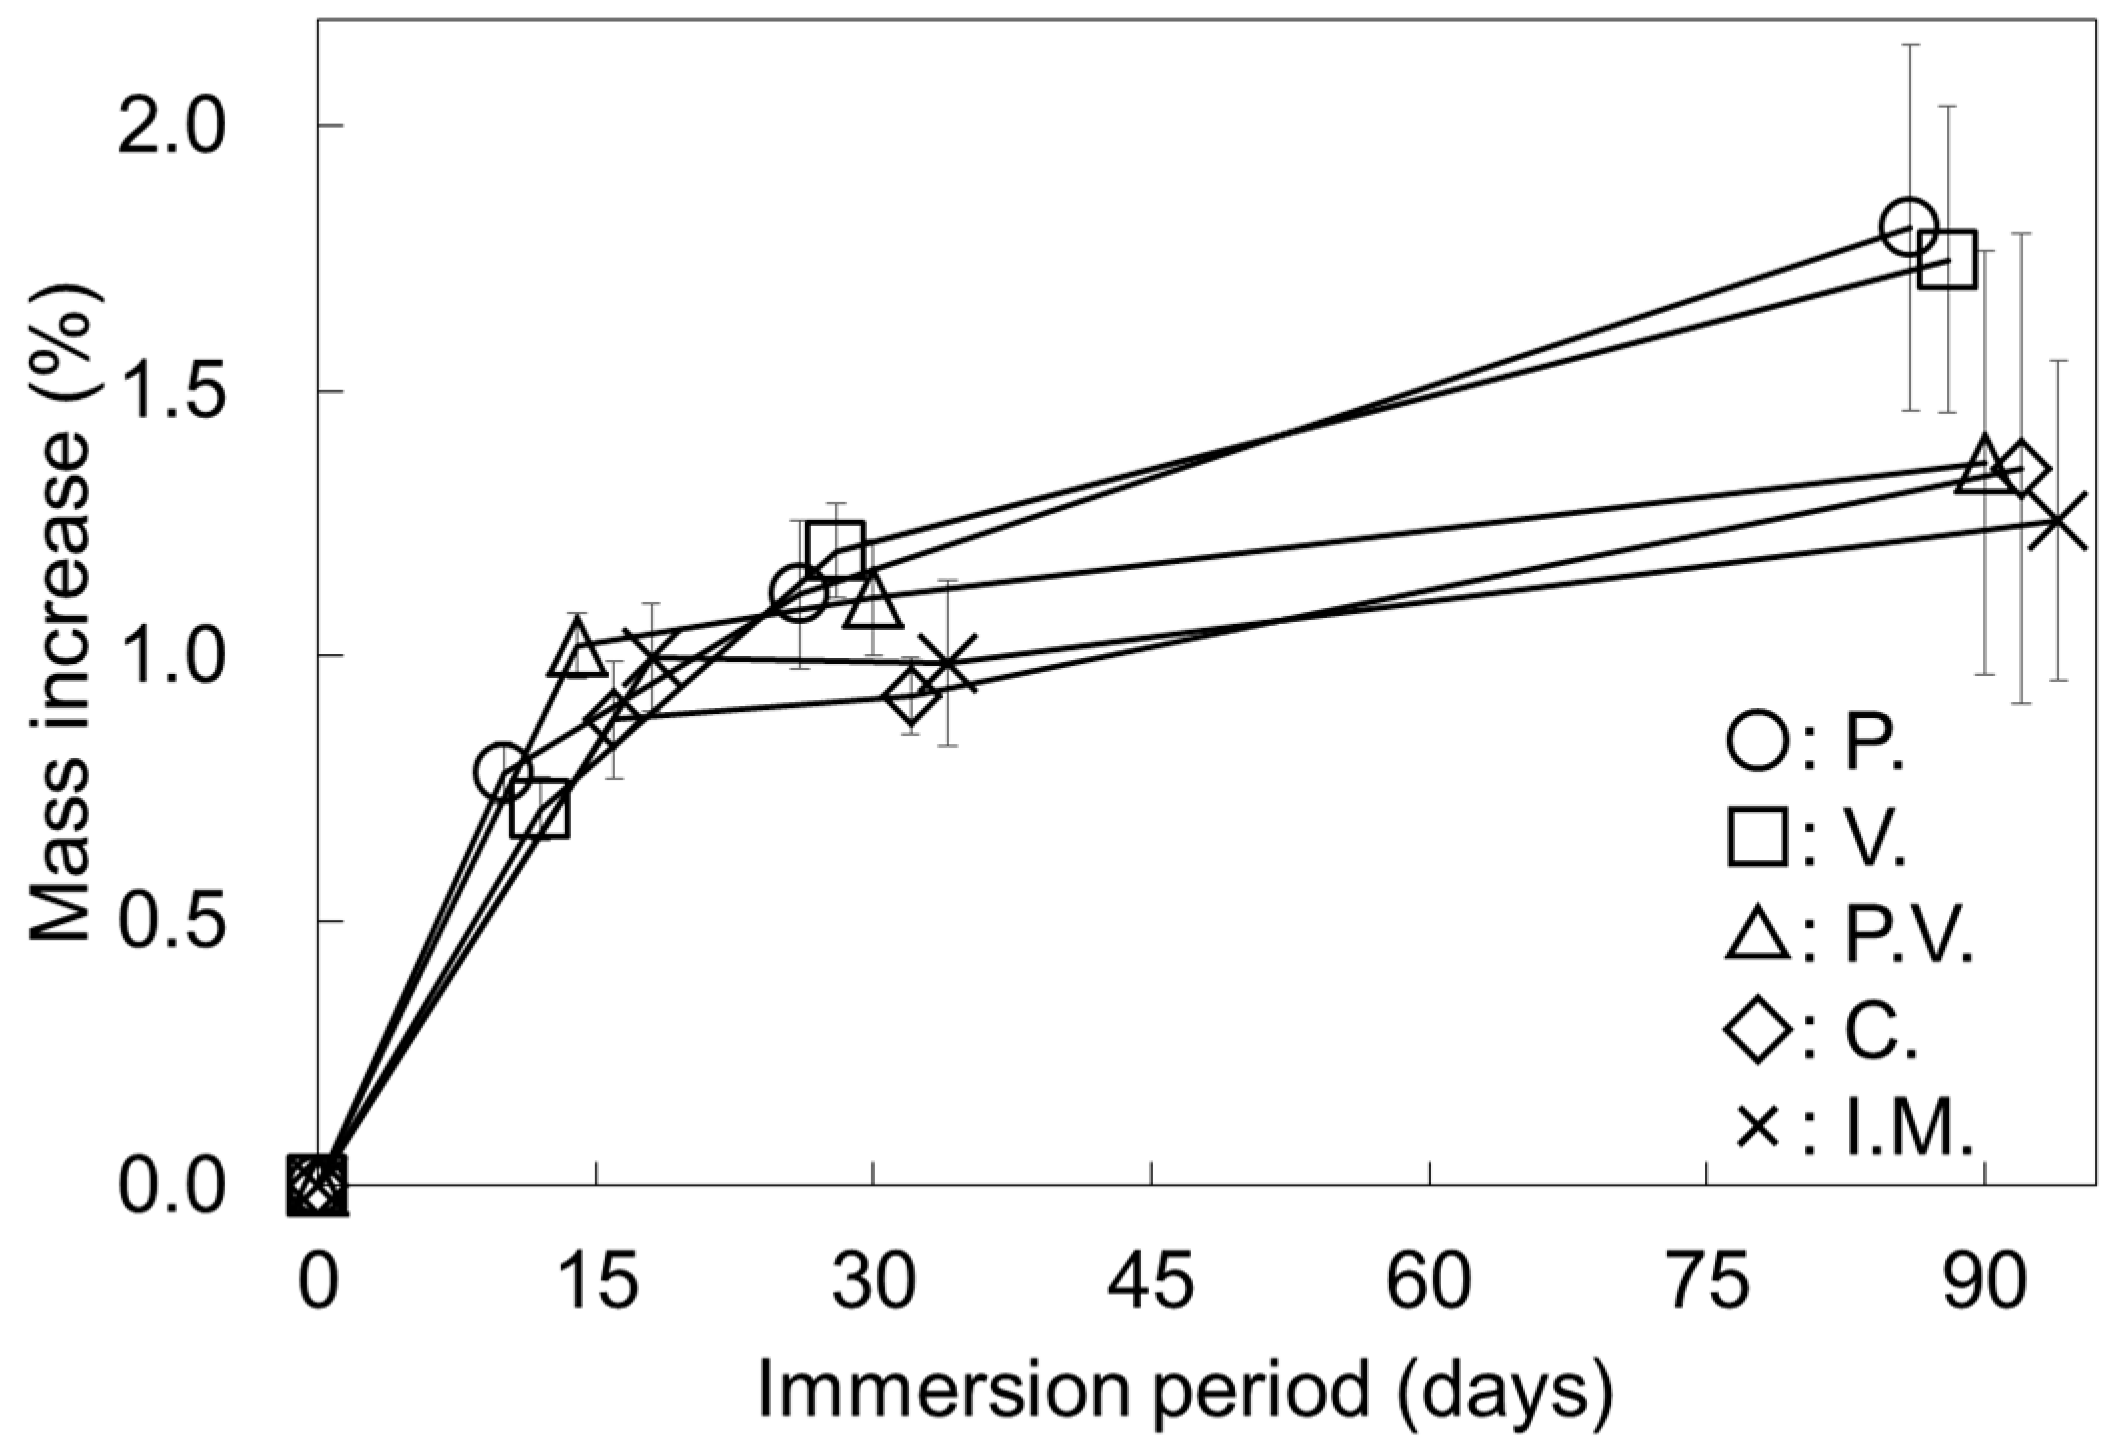
Figure 12 compares the mass increases of the five test piece types calculated from Equation (5). The average increases of mass after immersion for 15, 30, and 90 days were as follows: (15 days) P., 0.77%; V., 0.71%; P.V., 1.02%; C., 0.87%; I.M., 0.99%; (30 days) P., 1.11%; V., 1.19%; P.V.%, 1.11%; C., 0.92%; I.M., 0.98%; (90 days) P., 1.80%; V., 1.74%; P.V., 1.36%; C., 1.35%; I.M., 1.25%. The mass increased rapidly in the first 15 days of immersion, then continued increasing gradually up to 90 days. The plots in
Figure 12 reveal a peculiar pattern in the relation between the nozzle scan patterns and mass increases with immersion. In the first 15 days of immersion, the rates of mass increase were lower in the test pieces fabricated by unidirectional scan patterns than in the test pieces fabricated by bidirectional scan patterns. This relation then reversed from 15 days to 30 days, and the rate differential widened from 30 days to 90 days.
Figure 13 shows digital microscope images of the cross sections of the test pieces broken by the tensile tests. Pores appear on the broken surfaces of the P., P.V., and C. test pieces tested in both the non-immersed condition and 30-day immersion condition. These pores seem to have been formed between neighboring polymer lines extruded from the nozzle. The lines extruded from the nozzle during the fabrication process appear as sideways broken lines on the V., P.V., and C. test pieces. In C. test piece, the trace for the line-stacked cross is also observable. No pores or lines appear in the I.M. images.
4. Discussion
The focuses of our research were to evaluate the mechanical properties of PLA structures formed by a commercial-level FFF 3D printer and how they differed with adjustments in the nozzle scan patterns and structural deterioration by immersion in solution. Few earlier reports have examined these very important parameters for design structures. Here we discuss the details based on the data obtained.
4.1. Mechanical Properties of Non-Immersed Test Pieces
As
Figure 5 shows, the mechanical properties (maximum stress, Young’s modulus, and breaking energy) of the structures fabricated by the FFF 3D printer were similar to those of the I.M. structures. In
Figure 6 we see that the average maximum tensile stress in test piece P. was highest among the FFF 3D test pieces formed by different nozzle scan patterns, and that the maximum stress in test piece P. was slightly (1%) lower than that in the test piece formed by I.M. In contrast, the maximum stress of test piece V. was lower than that of the other test pieces formed by different scan patterns. To explain this, we surmise that the adhesive strength of the resin extruded from the nozzle is critical for the maximum stress. The maximal tensile stress was lower in the FFF 3D test pieces than in the test pieces fabricated by I.M. This difference can be explained by the difference between cross-sectional areas estimated from the outer size of the test pieces and the real cross-sectional areas: because the estimated areas were lower, the filling rates of the FFF 3D test pieces were lower relative to the 100% value set for the IFP parameter in the software.
As shown in
Figure 6, the Young’s moduli of the FFF 3D test pieces fabricated by the four scan patterns were lower than those of the I.M. test pieces. We surmise that the FFF 3D structures were more flexible than the I.M. structure, as the former were composed of laminated fiber sheets. The large breaking energy of test piece P. (e.g., 220.7%;
Figure 5b) could be attributed to the loading of the tensile force in the same direction as the nozzle scan and the high ductility of the structure resulting from the arrangement of the many filaments composing the structure in parallel with the tensile direction. In contrast, the small breaking energies of test pieces V. and C. could be attributed to irregularities produced on the sides of the test pieces when the direction of the nozzle scan changed during the fabrication. The hollows of these irregularities may act as starting points for cracks during the breakage process. The combined use of a shell/outline would be an effective countermeasure against the above.
The average maximum tensile stresses obtained in this work were almost equal to the values obtained by I.M. test pieces evaluated in previous works [
11,
12,
13]. The Young’s modulus obtained in this work was considerably lower than that reported in a previous study using an FFF 3D printer (1.20–1.25 GPa vs 3.48 GPa) under similar fabrication conditions [
23] and that reported in another study investigating I.M. (1.33 GPa vs 4–5 GPa) [
12]. This difference in the Young’s modulus may have stemmed from a difference in the method used to measure the strain of the test pieces. Because our test pieces were too small to attach to an outer strain gauge with high-precision, we had to estimate the strain from the gauge length and displacement of the crosshead of the tensile test machine. The differences also may have stemmed from fabrication conditions such as the heating temperature, heating time, and cooling rate of the material. In the FFF 3D method, these fabrication conditions are presumably affected by setting parameters such as the nozzle diameter, scan speed, layer thickness, and temperatures of the nozzle and molding stage of the printer. In I.M., on the other hand, the fabrication conditions are affected by the nozzle temperature, length of the runner, thermal characteristics of the mold, and so on. The cooling temperature influences the crystallinity of the material, which in turn affects the mechanical properties. While some papers have described a deterioration of mechanical properties caused by the progress of thermal oxidation [
9,
33,
34,
35], no remarkable deterioration was recognized in the test pieces fabricated by the FFF 3D and I.M. methods in the present study. Sufficient maximum tensile stresses were obtained in the test pieces fabricated by both methods.
Compared with the previous work formed by a similar FFF 3D printer, we have obtained comparable results on the maximum tensile stress [
23]. The strength values, however, highly depended on processing parameters such as the extrusion temperature and filament quality (e.g., molecular weight (M.W.)) of the material, and the results we obtained were considered appropriate. We evaluated the deterioration of the PLA structures with fixed fabrication parameters. The deterioration rate may have varied according to the fabrication parameters. When we compared the maximum tensile stress of FFF 3D printed PLA structures with the injection-molded structures in this research, the strengths obtained by the two fabrication methods were similar. For ABS structures, in contrast, the structures formed by the FFF 3D printer had substantially lower strength in tensile tests compared to structures formed by I.M. [
23].
We selected a natural, translucent white color for our PLA filament, a color with a higher maximum tensile strength than the alternatives such as black, gray, blue, and white [
36]. Dye is reported to increase the crystallinity and decrease the maximum tensile strength of PLA, and natural without color is reported to contain the lowest percent of crystalline regions.
The M.W. of the PLA used in this work was not specified by the vendor. Rather, an M.W. on the order of 10
5 was estimated based on the similar mechanical strength determined [
13,
19]. The M.W. of the PLA can be estimated by gel permeation chromatography (GPC), a simple method for measuring the average M.W. and distribution of M.W. GPC also may reveal the relation between the deterioration in the strength and decline of the M.W.
4.2. Mechanical Properties after Immersion in Saline and the Mechanisms by Which They Changed
The maximum tensile strengths and breaking energies of the test pieces decreased with the immersion in saline (
Figure 7,
Figure 8 and
Figure 10). In contrast, no clear tendency pieces in response to the immersion was found in the Young’s moduli of the FFF 3D test pieces (
Figure 9). If we are more daring in our conjectures, we can report that the Young’s modulus of the FFF 3D test pieces increased slightly after 30 days of immersion. For reasons that remain unclear, the Young’s modulus of the test piece P. temporary decreased after 15 days of immersion. On the other hand, the Young’s modulus of the I.M. test pieces decreased sharply after 30 days of immersion. The rates by which maximum tensile stress values fell in the P., V., and I.M. test pieces agreed well with the previous reports [
19]. For reasons that remain unclear, the strength of test pieces formed by scan patterns P.V. and C. declined slowly after 30 days immersion.
We can explain the effects of the nozzle scan patterns on the immersion-induced deterioration of mechanical properties as follows.
Figure 12 shows large increases in the masses of the test pieces after 15 days of immersion, while
Figure 8 shows large decreases in the maximum tensile stress over the same period of immersion. From these results, we surmise that the deterioration took place via the following mechanism: first, the saline solution permeates into the test piece and the degradation of the test piece commences; next, further water uptake and hydrolysis of the test piece proceeds in the solution. Because PLA is a material that degrades slowly [
37], the weakening of the mechanical properties is delayed. We have not looked into the elution of the decomposed material in this work, though we know that the eluted molecules exhibit a catalytic action that encourages the degradation of PLA [
38].
As shown in
Figure 8, the deterioration rates of the test pieces fabricated by the unidirectional scan patterns were larger than those fabricated by the bidirectional scan patterns after 15 days of immersion. In contrast to
Figure 12, the mass increases of the test pieces fabricated by the unidirectional scan patterns were lower than those of the test pieces fabricated by the bidirectional scan patterns after immersion for the same period. From these findings we can conjecture that the amount of water required to promote degradation of the material was lower in the test pieces fabricated by the unidirectional scan patterns than in the test pieces fabricated by the bidirectional scan patterns. The test pieces fabricated by the bidirectional scan patterns took in more water than the test pieces fabricated by the unidirectional scan patterns within the above period yet degraded less. As
Figure 12 shows, the masses of the test pieces fabricated by the unidirectional scan patterns continued to increase for 90 days, whereas those of the test pieces fabricated by the bidirectional scan patterns increased only slightly over the same time frame. The greater mass increases in the test pieces fabricated by the unidirectional scan patterns up to 90 days presumably can be explained by the space created for the water uptake as the polymer degraded over time. We can infer, from these findings, that the nozzle scan patterns have a very large influence on the rate by which maximum tensile stress is reduced.
The pores formed between the extruded polymer lines in the structure may be critically linked to the mechanical properties after immersion in saline (
Figure 13). The saline taken into the pores may influence the mechanical properties. In
Figure 9, the Young’s modulus of the I.M. test piece decreased continuously during the 30 days of immersion. In contrast, the Young’s moduli of most the FFF 3D printed test pieces either remained at the initial level or increased over the same period (the exception was P. test piece immersed for 15 days). The difference between the two processing methods may have been caused by the NaCl in the saline.
As shown in
Figure 11, the masses of the four test piece types fabricated by the FFF 3D printer were almost equal before immersion, whereas those of the I.M. test pieces were smaller. This mass difference can be explained by an error in the manufacture of the mold used for the I.M.
Degradation takes place roughly as either bulk erosion, which degrades the whole of a material equally, or surface erosion, which degrades from the exterior surface of a material. Polymers of alpha-hydroxy acid, such as PLA, degrade through the process bulk erosion [
31,
39,
40,
41]. When bulk erosion is dominant, the deterioration rate will not differ between test pieces of the same volume. We can infer that the scan pattern used for fabrication affects not only the deterioration rate, but also the type of degradation that takes place.
4.3. Immersion Test Method
We selected saline as the solution for test piece immersion in order to induce a process of degradation similar to what would take place under physiological conditions. The data we obtained were therefore relevant to mechanical properties for medical application. Another choice for the immersion solution would have been phosphate buffer saline, a solution proposed as a standard protocol for degradation tests on PLA [
29,
30] and poly (lactic-co-glycolic acid) (PLGA) [
42]. While immersion in distilled water would also have provided important data, the unstable pH of distilled water would have affected the degradation rate. Immersion tests in phosphate buffer saline and distilled water solutions should be performed in future studies for comparison with the results presented in this paper. We set the temperature of the incubator at 37 °C to match the condition used in previous studies [
17,
19,
26,
28,
29]. Immersion at higher temperature would have shortened the testing time by accelerating the degradation [
9,
33,
34,
35].
Our evaluations of the mechanical properties were performed after vacuum pumping the test pieces for only 5 min. While the state of the test pieces was not confirmed in detail, the test pieces were presumed to be swollen with saline during the measurements. The data on mechanical properties obtained could therefore reflect effects from the NaCl in the saline. Five minutes of vacuum pumping is considered an available method for obtaining a stable condition for mass measurement. Though ideally the mechanical properties of the test pieces should have been evaluated in a dried condition, our samples tended to break when we dried them. The drying of a structure often leads to deformation and/or cracking on the structure surface, a condition that renders a test piece ineligible for the tensile test. Water uptake is an important index to consider when evaluating the progress of the degradation of a material. The above-mentioned problem also prevented us from estimating the water uptake, because we would have had to dry test the piece to perform the calculation.
4.4. Observation of the Cross Section of the Test Piece
Figure 13 clearly shows the pores and lines in the cross sections of the broken test pieces. These are typical characteristics of a structure processed by an FFF 3D printer. The pore sizes of the structure may affect the uptake of saline. The images may also explain the strength differences between the structures formed by the different nozzle scan patterns, after they were deteriorated by immersion. The high magnification of a scanning electron microscope (SEM) would have revealed the surface erosion on the materials in better detail. A further investigation using imaging tools to characterize the deterioration of structures fabricated by an FFF 3D printer will be useful.
4.5. Practical Use of the Obtained Data in Design
Scan pattern P.V. is superior in practical use because the maximum tensile strength of objects formed by the P.V. pattern is the next largest after P. and can easily tolerate forces from several directions. Objects fabricated by scan pattern P. have superior maximum tensile strength but show high deterioration rates under immersion. A designer who wishes to take advantage of the strength drop properties positively should choose scan pattern P.
4.6. Future Prospects
We were unable to perform tensile tests on the test pieces with high rates of tensile strength decline in this study. Once they had begun degrading, these test pieces tended to easily break either before they could be fixed to the tensile test jigs or when the jigs were tightened around them. A workaround for future research would be to reconsider the method used to tighten the jig for the tensile test or to adopt another test method such as a three- or four-point flexural method.
The surface energy of a structure has an important bearing on the control of the rate at which structure deteriorates, as structures with different surface energies show different rates of water uptake. A hydrophobic or hydrophilic treatment of a structure surface could be used to control the surface energy. Plasma irradiation, for example, would improve the surface hydrophilicity, and a silicone coating using a chemical solution would improve the surface hydrophobicity.
Many FFF 3D printers can fabricate mesh structures when the parameters are properly set in the software. We set the IFP parameter to 100% in Simplify3D to investigate the deterioration of the mechanical properties in this work. A lower IFP enables the fabrication of peculiar structures that seem to express different deterioration characteristics, such as recess or light hole structures. Structures with lower IFPs (e.g., 50%, 80%, and 90%) fabricated by different nozzle scan patterns should be investigated in the future.
An easier method for estimating the deterioration of mechanical properties would be helpful. The degree of the deterioration can be estimated by the relation between the mechanical properties and the data obtained by M.W. measurement, infrared absorption spectrometry, differential scanning calorimetry, and the like. While the relations between these data and the deterioration of mechanical properties have been reported previously [
10], further investigations to realize a new estimation method are eagerly awaited.


