1. Introduction
The CSES (China Seismo-Electromagnetic Satellite) mission is an Italian–Chinese space mission developed by the China National Space Administration (CNSA) and the Italian Space Agency (ASI). Various Italian universities and research centers contribute to the mission.
The main objective is the investigation of the upper ionosphere phenomena to obtain information about the correlation between seismic events and perturbations of physical quantities such as the electric and magnetic field of the Earth, the plasma frequency, the composition of the ionosphere and the flux of particles precipitating from Van Allen belts [
1,
2]. Italy contributes to the mission in the context of the LIMADOU program.
The CSES-Limadou program will be a multi-satellite mission that foresees the development of a constellation of satellites that will be equipped with various detectors specifically developed for the study of ionospheric parameters. The first satellite of the constellation, named CSES-01, was launched on 2 February 2018 and is still in operation [
3,
4].
From CSES-01 first scientific data, it was possible to obtain different results that include the monitoring of the G3 geomagnetic storm, which happened on 26 August 2018 [
5], the study of the solar modulation of the cosmic rays [
6] and the trapped proton fluxes inside the South Atlantic Anomaly (SAA) [
7].
Furthermore, a retrospective analysis of high-magnitude seismic events, such as the Palu earthquake on 28 September 2018 (
) and the Papua New Guinea earthquake on 14 May 2019 (
) [
8], has been made using data collected by the CSES-01 detectors. From these studies, several ionospheric anomalies that could be related to the preparation phase of these seisms can be deduced [
6,
7,
9,
10].
The second satellite of the constellation, named CSES-02, will be launched in early 2024 and will be placed in an orbit with a 180° phase shift with respect to CSES-01 to increase the temporal resolution. Thanks to the improvements made on the HEPD-02 detector, the CSES-02 will operate also in polar regions and the SAA, while CSES-01 was designed to be operative only for latitude between ° and outside the South Atlantic Anomaly (SAA).
The instruments that will be onboard the CSES-02 satellite, are listed in
Table 1 with a brief description of their observation targets [
11].
The responsibility of the realization of the High-Energy Particle Detector (HEPD-02) and the Electric Field Detector (EFD-02), for the second satellite, has been assigned to the Italian collaboration.
The HEPD-02 will measure the flux of particles and their energies and will also be able to detect Gamma Ray Bursts in the range from MeV to tens of MeV [
12] and will be described in detail in the next sections.
The EFD-02 will measure the components of the electric field of the Earth, but its description is outside the scope of this article.
2. The HEPD-02 Detector
The High-Energy Particle Detector realized for the CSES-02 satellite (HEPD-02) is designed to detect electrons, protons and light nuclei in the energetic ranges from 30 to 200 MeV for protons and from 3 to 100 MeV for electrons.
The detector’s dimensions are 403.6 × 530 × 382.5 mm, and its mass is 50 kg. The power consumption, at the highest reachable trigger rate, is 43 W and the data budget is less than 100 Gbit per day.
It is structured in four main components:
The direction detection;
The trigger system;
The calorimeter;
The veto system.
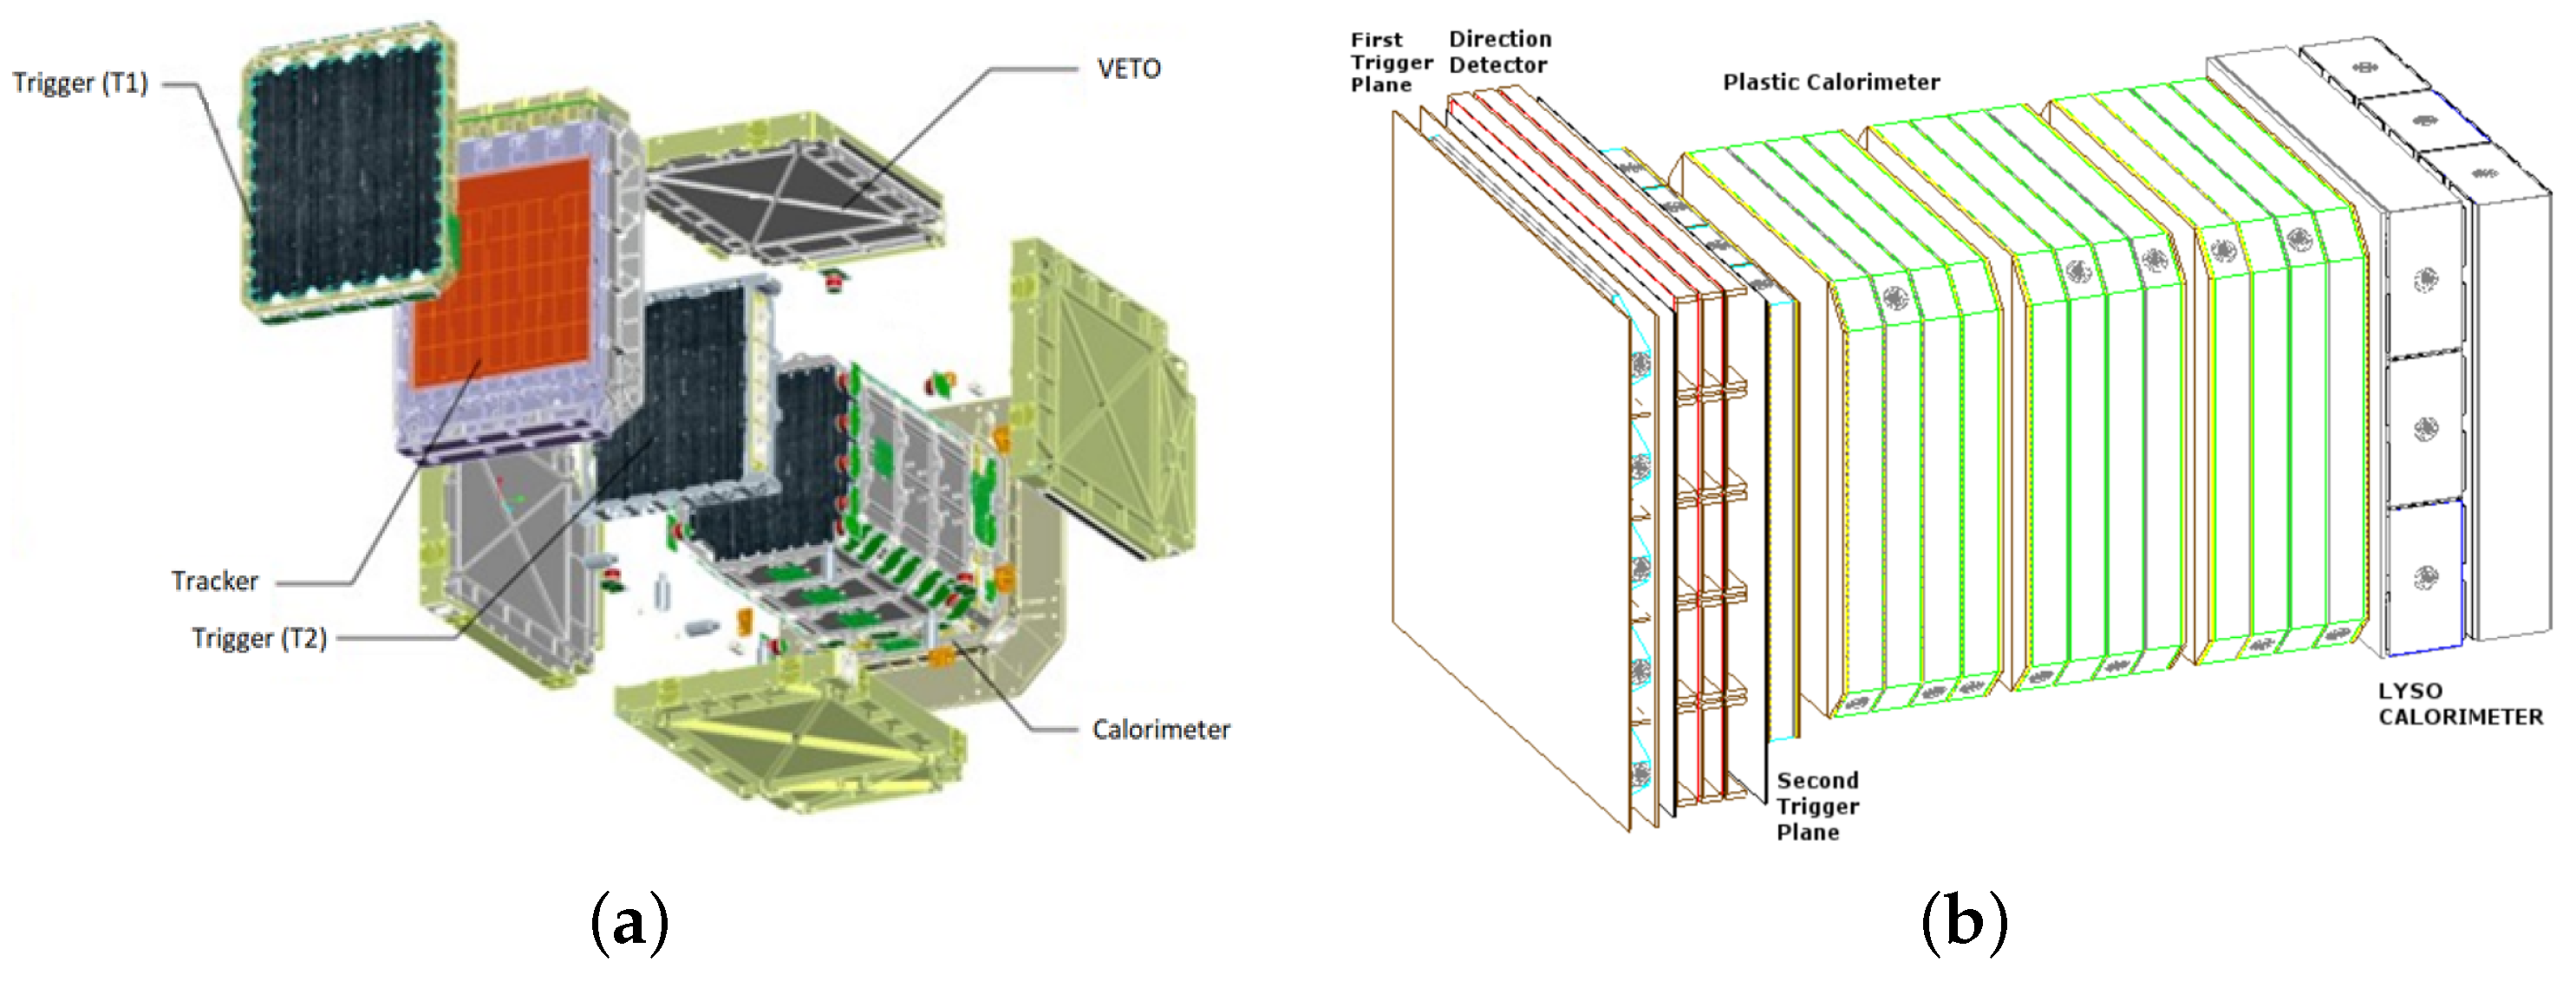
These components are represented in
Figure 1a [
13], and a brief description of the detector’s sections follows.
2.1. The Direction Detector
The direction detector is an innovative tracker made with Monolithic Active Pixel Sensors (MAPSs) and designed to measure the entrance angle of the particles.
It is composed of five turrets made by three sensitive planes that mount ten MAPS chips. These chips are composed of 512 × 1024 pixels with a size of 29.24 × 26.88 m and can reach a spatial resolution of approximately 4 m.
The turrets are acquired by a dedicated electronic board called T-DAQ (Tracker Data Acquisition) [
14,
15].
2.2. The Trigger System and the Calorimeter
The energy of particles entering inside the HEPD-02 is converted into light signals using several scintillators that differ in material and dimension depending on their function.
The light produced is then acquired by two photomultiplier tubes by Hamamatsu (R9880-210 PMTs), placed on the opposite sides of each scintillator, for a total of 64 PMTs.
The trigger system is composed of two segmented planes of plastic scintillators (EJ-200), displaced orthogonally with respect to each other, and surrounding the direction detector.
Five segments of EJ-200 constitute the first layer of the trigger system and are aligned with the turrets of the direction detector (154.6 × 32.5 × 2 m
). The second layer is realized with four segments (150 × 36 × 8 m
) placed orthogonally with respect to TR1 [
16].
A range calorimeter follows the trigger system, and it is made of twelve planes of plastic scintillators (150 × 150 × 10 m) and two segmented planes of LYSO scintillators, which extend the energetic range of the detector thanks to their high density.
The LYSO planes are segmented in three bars (150 × 49 × 25 m
) arranged orthogonally to each other (see
Figure 1b).
The plastic scintillators are named RAN_1 to RAN_12, while the LYSO planes are EN_1 and EN_2.
2.3. The Veto System
To identify particles that are not contained inside the detector or enter from the side or the bottom of it, the calorimeter is contained inside five planes of EJ-200 scintillators which constitute the veto system.
The lateral planes are called LAT, while the bottom scintillator is called BOT.
2.4. Electronics
The electronic boards used for HEPD-02 are listed below:
HV-CTRL (High-Voltage Control), which is designed for the control of the high voltages of the PMTs;
LV-CTRL (Low-Voltage Control), which controls the power of the other boards;
T-DAQ (Tracker Data Acquisition), which is used for the readout of the MAP sensors of the tracker;
PMT&T (PMT readout and Trigger), which is designed for the acquisition and digitization of the PMT signals and the generation of the trigger signal for the detector;
DPCU (Data Processing and Control Unit), which controls all the subsystems and manages the communication toward the satellite.
All the subsystems provide HOT/COLD redundancy and communicate with DPCU via SpaceWire Lite protocol.
In this contribution, the PMT&T board will be described in detail, while a brief description of the DPCU and T-DAQ boards follows.
2.5. T-DAQ Board
The T-DAQ board is based on XC7A100T FPGA (Xilinx, San Jose, CA, USA) and acquires data from the direction detector, performing the following operations: configures the MAPS chips and manages the acquisition and their calibration, manages signals from and to the PMT & T board, and packs the data and transfers it to the DPCU board.
2.6. DPCU
The DPCU is based on a Zynq XC7Z7045 FPGA (Xilinx, San Jose, CA, USA) and is designed to control the other subsystems (T-DAQ, LV/HV-CTRL and PMT&T) and communicate with the satellite platform with CAN BUS and RS422 protocols. It also manages the HEPD-02 modes (stand-by, safe mode and nominal mode) and the calibration or acquisition operations. When the PMT&T and T-DAQ boards have data, the DPCU reads it and transmits it to the satellite.
In case of malfunctioning of any of the HEPD-02 subdetectors, the DPCU also has the task of providing recovery procedures.
3. The PMT Readout and Trigger System
The signals produced by the calorimeter’s PMTs are digitized by a dedicated electronic board, called PMT&T, that mounts two CITIROC readout chips made by Weeroc that are managed by an A3PE3000L FPGA by Microsemi (Chandler, AZ, USA) [
16,
17].
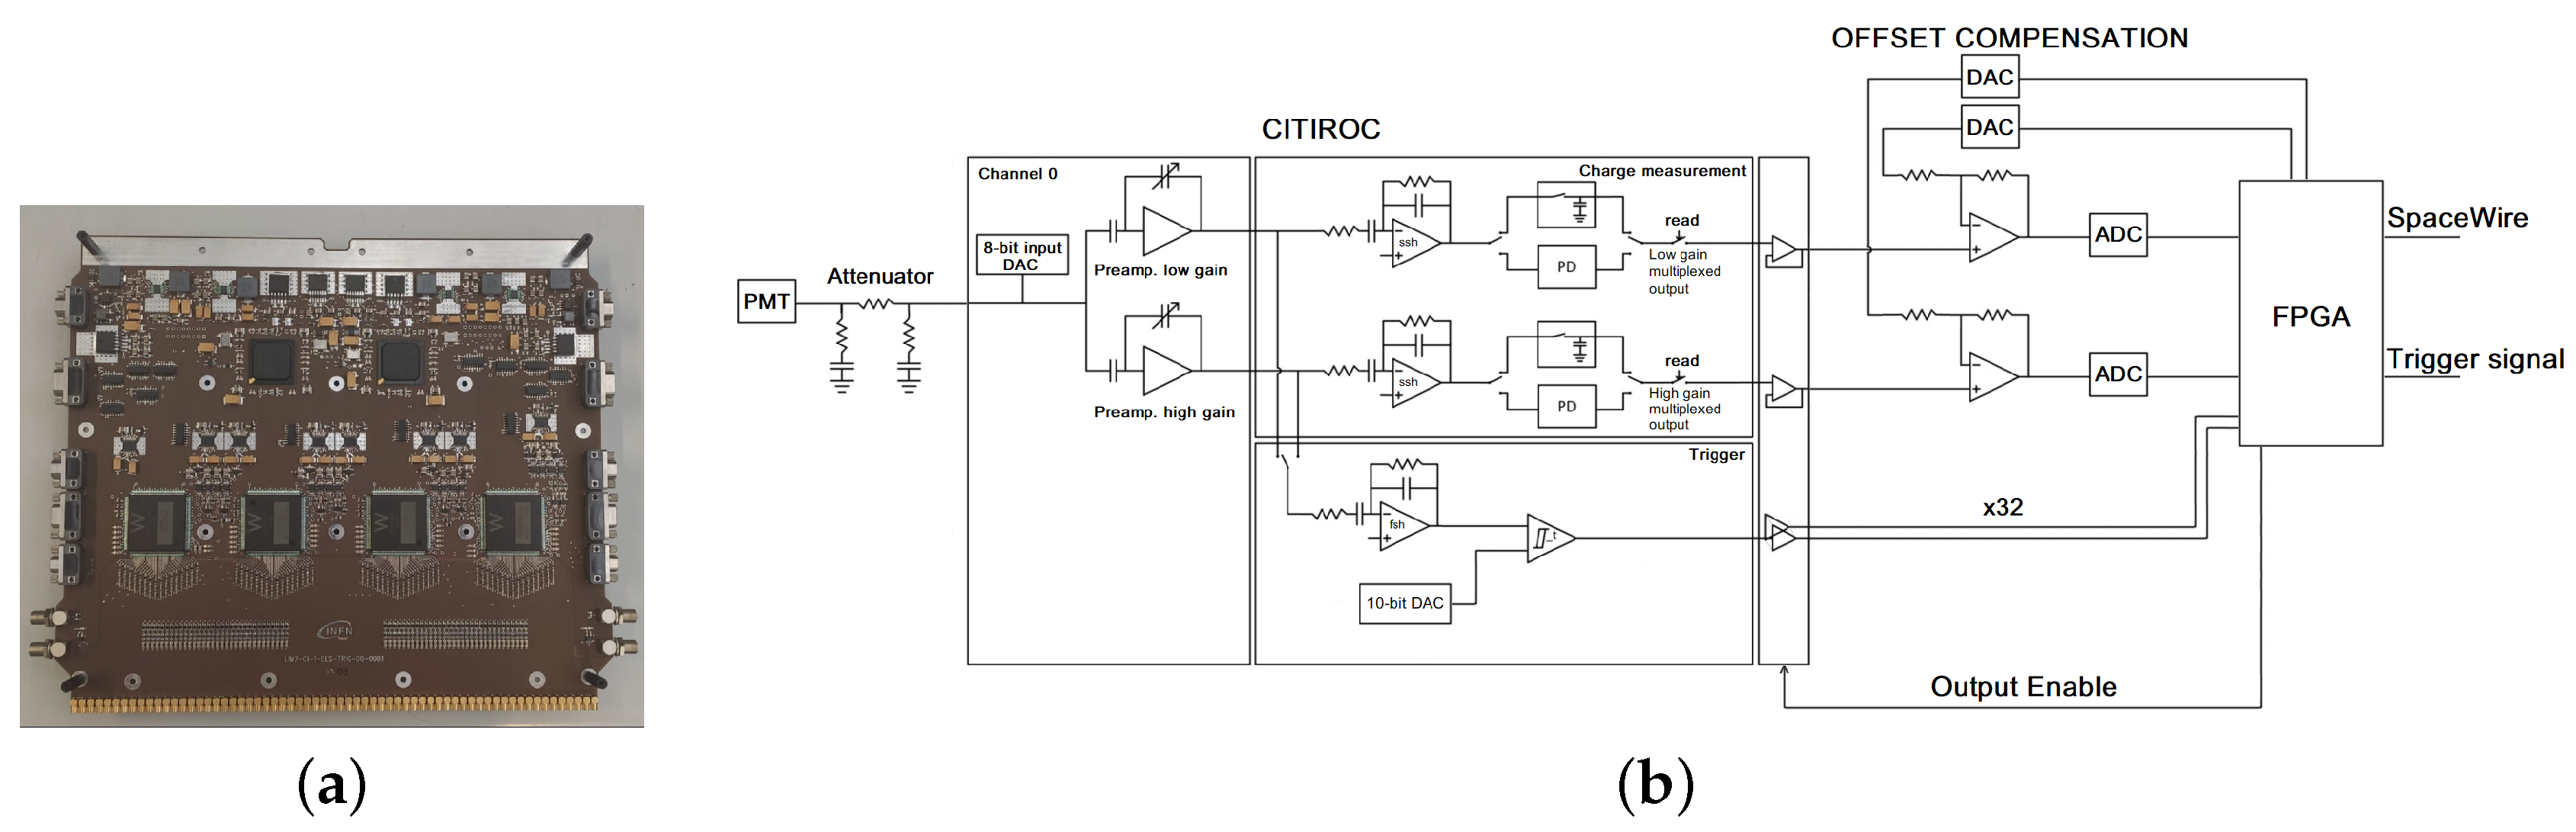
The PMT&T board configures CITIROCs parameters, starts and stops the acquisition, produces the trigger for the detector if certain logic conditions on PMT signals, called “trigger masks”, are met, and sends the data to the DPCU.
A schematic description of the board is shown in
Figure 2b.
Since CITIROCs are designed for SiPMs, which have positive polarity, the PMT signals are collected from the last dynode and not from the anode, making it possible to avoid the use of inverters and lowering the board consumption. To match the input range of the CITIROCs, the dynode signals are also attenuated with “pi pad” attenuators.
3.1. CITIROCs
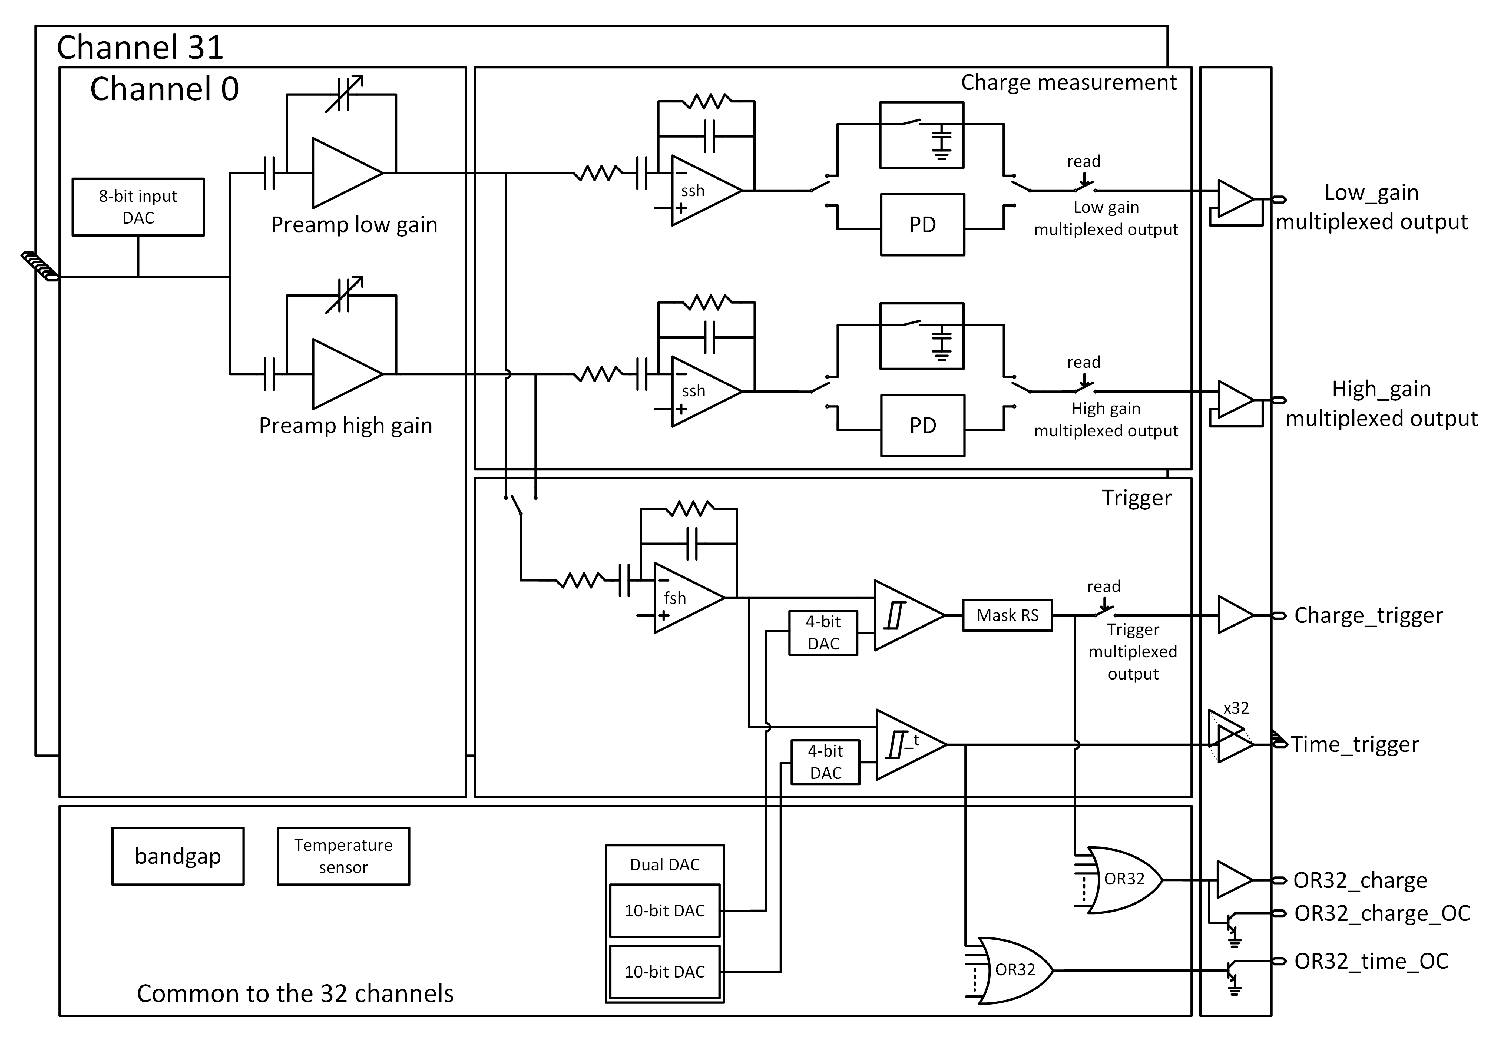
The internal structure of CITIROCs is shown in
Figure 3.
An amplification stage is present on each channel, featuring two independent charge preamplifiers with different gain ranges: the high-gain preamplifier, with a gain from 10 to 600 and the low-gain preamplifier, with a gain from 1 to 60. The presence of two independent acquisition chains ensures a wide dynamical range, which is essential in the case of HEPD-02 due to the wide energy range required by design.
A configurable shaper follows the preamplifier with shaping times that can be selected between 12.5 and 87.5 ns with 12.5 ns steps.
The shaper’s output can be stored in analogue memory circuits which can work in two operating modes: the Track and Hold mode, which samples the output of the shaper at a specific instant, and the Peak Detection mode, which follows the shaper’s output in a defined time window.
Since the scintillators of HEPD-02 have very different timing characteristics, the PMT&T board uses the Peak Detection mode.
The FPGA uses the “Time_trigger” signals produced by the two CITIROCs to generate the trigger for the experiment. This enables the analogue output of the CITIROCs and starts the ADC conversions.
3.2. Scientific Data
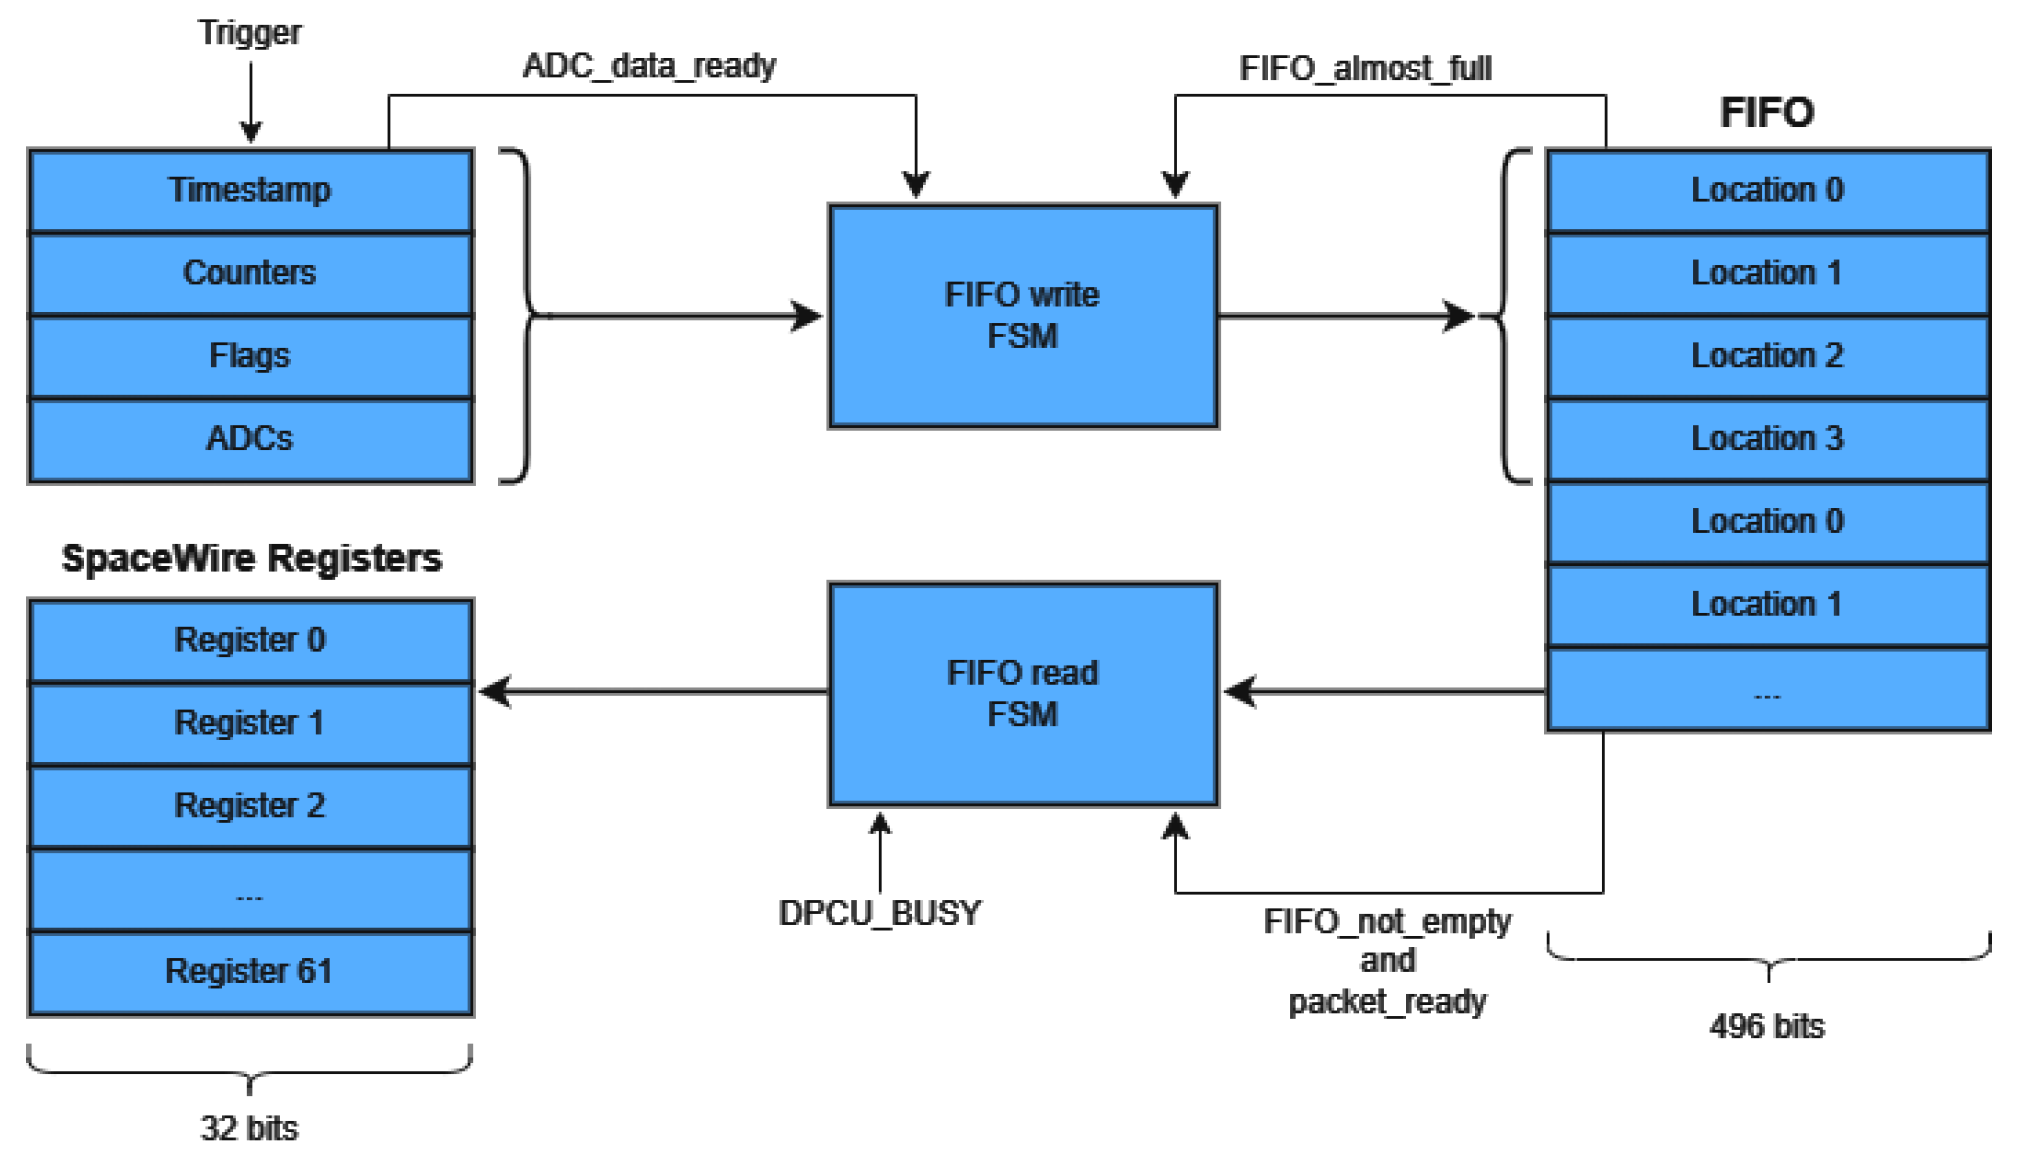
The PMT&T board produces 240 bytes of data at each trigger and stores it in a bytes FIFO. Since a single packet occupies four locations, the maximum amount of trigger events that the FIFO can store is 10.
The data content is described in
Table 2.
A Finite State Machine (FSM) packs the data in the FIFO as soon as the ADC finishes the conversions and if there is enough room in memory to store it. Another independent FSM unpacks data into 62 SpaceWire registers when the DPCU is ready to read it (see
Figure 4).
3.3. Boards Interwork
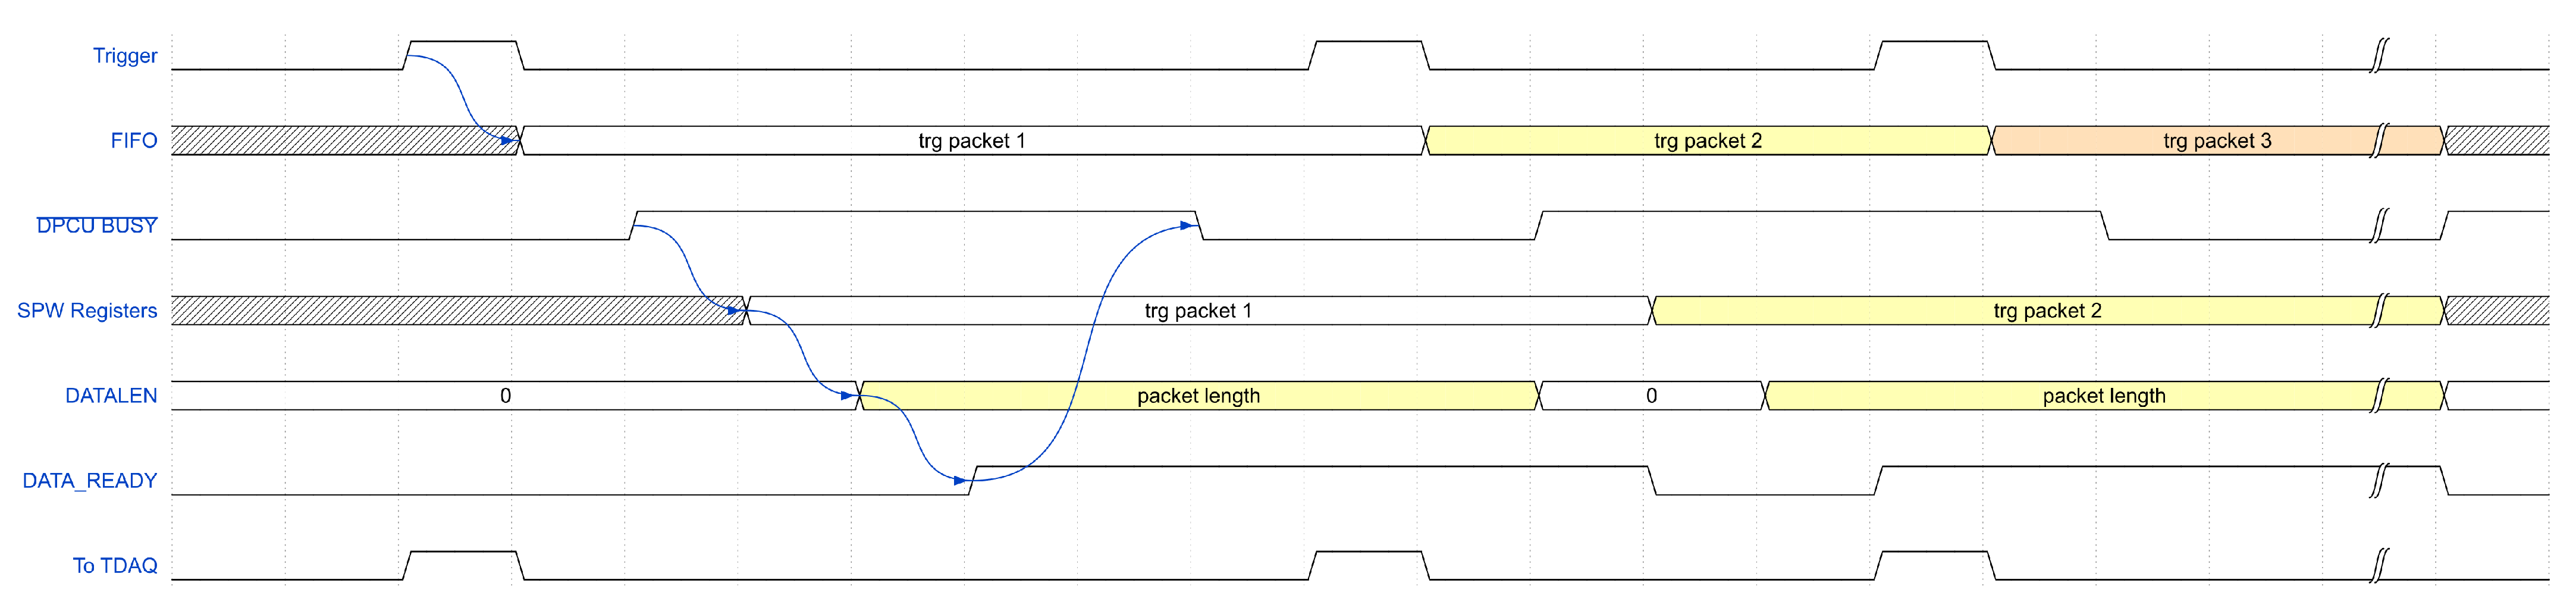
The communication between the PMT&T and the other subsystems is managed by a register-based SpaceWire protocol, which is described in
Figure 5.
At each trigger event, the PMT&T board sends the trigger signal to the T-DAQ and the DPCU and starts the ADC conversions. Once the conversions finish, the FIFO is filled with data (first arrow in
Figure 5).
If the DPCU is not busy (the
signal, as shown in
Figure 5, is high), the first packet in the FIFO is transferred to a series of SpaceWire registers and the total length of the data is stored in a separate register (second and third arrow of the timing diagram).
When the PMT&T board asserts the DATA_READY signal, the DPCU starts reading all the data registers.
3.4. Trigger Masks
The detector acquisition is conditioned by boolean expressions that are called “trigger masks”.
The PMT&T board implements three classes of trigger masks: the first class is named “event acquisition masks” and validates events produced by particles that are contained inside the detector. The “event monitor masks” class, instead, is used for efficiency measurements and to report particles that escape from the bottom or the sides of the calorimeter. The last class, named “GRB detection masks”, represents an innovation for the mission and is designed for detecting Gamma Ray Bursts in the 2 to 20 MeV energy range.
The event acquisition masks are defined as follows:
where the names of the detector sections (i.e.,
,
,
_xx and
_xx) identify the OR of the signals produced by the PMTs. The “
” suffix is used when the AND of the two PMTs connected to the same scintillator is used.
These three masks are designed for particles with gradually increasing energies: will produce a trigger for particles that lose all their energy in the first trigger plane. The other two masks allow the detection of particles that reach the TR2 scintillator () and the slab ().
The following masks belong to the event monitor class:
The masks allows for efficiency measurements if compared with , or .
Masks , and are designed for not contained particles.
Lastly, there are two GRB detection masks:
The mask will trigger when signals are produced only in the LYSO crystals and not in the preceding plastic scintillators. The mask, instead, is triggered by signals produced only in the central stages of the calorimeter and not in the surrounding scintillators.
In addition to these, a “generic trigger mask” can be configured to obtain the AND of any scintillator.
Six of these trigger masks can be selected to operate in concurrency and can be pre-scaled. This allows the control of the bandwidth occupation between different physics channels and to acquire data in regions of the orbit where the particle rate, especially for low energies, significantly increases and can reach hundreds of megahertz.
To obtain these features, six multiplexers are connected to the output of the 10 trigger masks, and their outputs can be selected via SpaceWire registers.
The outputs of four of these multiplexers are connected to counters that ignore a configurable number of triggers, actually accomplishing the pre-scaling.
3.5. First and Second-Level Triggers
All the trigger masks that include anticoincidences, such as the GRB masks, are prone to produce spurious triggers if signals present delays between them.
A second-level trigger system has been developed to minimize the occurrence of these problems. This system allows the sampling of the trigger masks twice, assuring that the overlap between signals is long enough to exclude spurious triggers.
If this overlap lasts at least 30 ns, a “valid trigger” signal is produced and the FPGA starts the acquisition and the ADC conversion. If not, the CITIROCs analogue memories are cleared and the peak detection circuit is reset.
4. PMT&T Board Measurements
Several measurements have been conducted on the PMT&T board to define operative parameters that optimize the signal acquisition.
For these measurements, which will be described in detail in the following sections, a Python script has been developed to automatize the configuration, the acquisition, and the analysis of data.
4.1. Optimization of the Input Signal Conditioning Circuit
A series of measurements were performed to find the minimum value of the input signal attenuation that ensures a good input dynamic range for the CITIROCs.
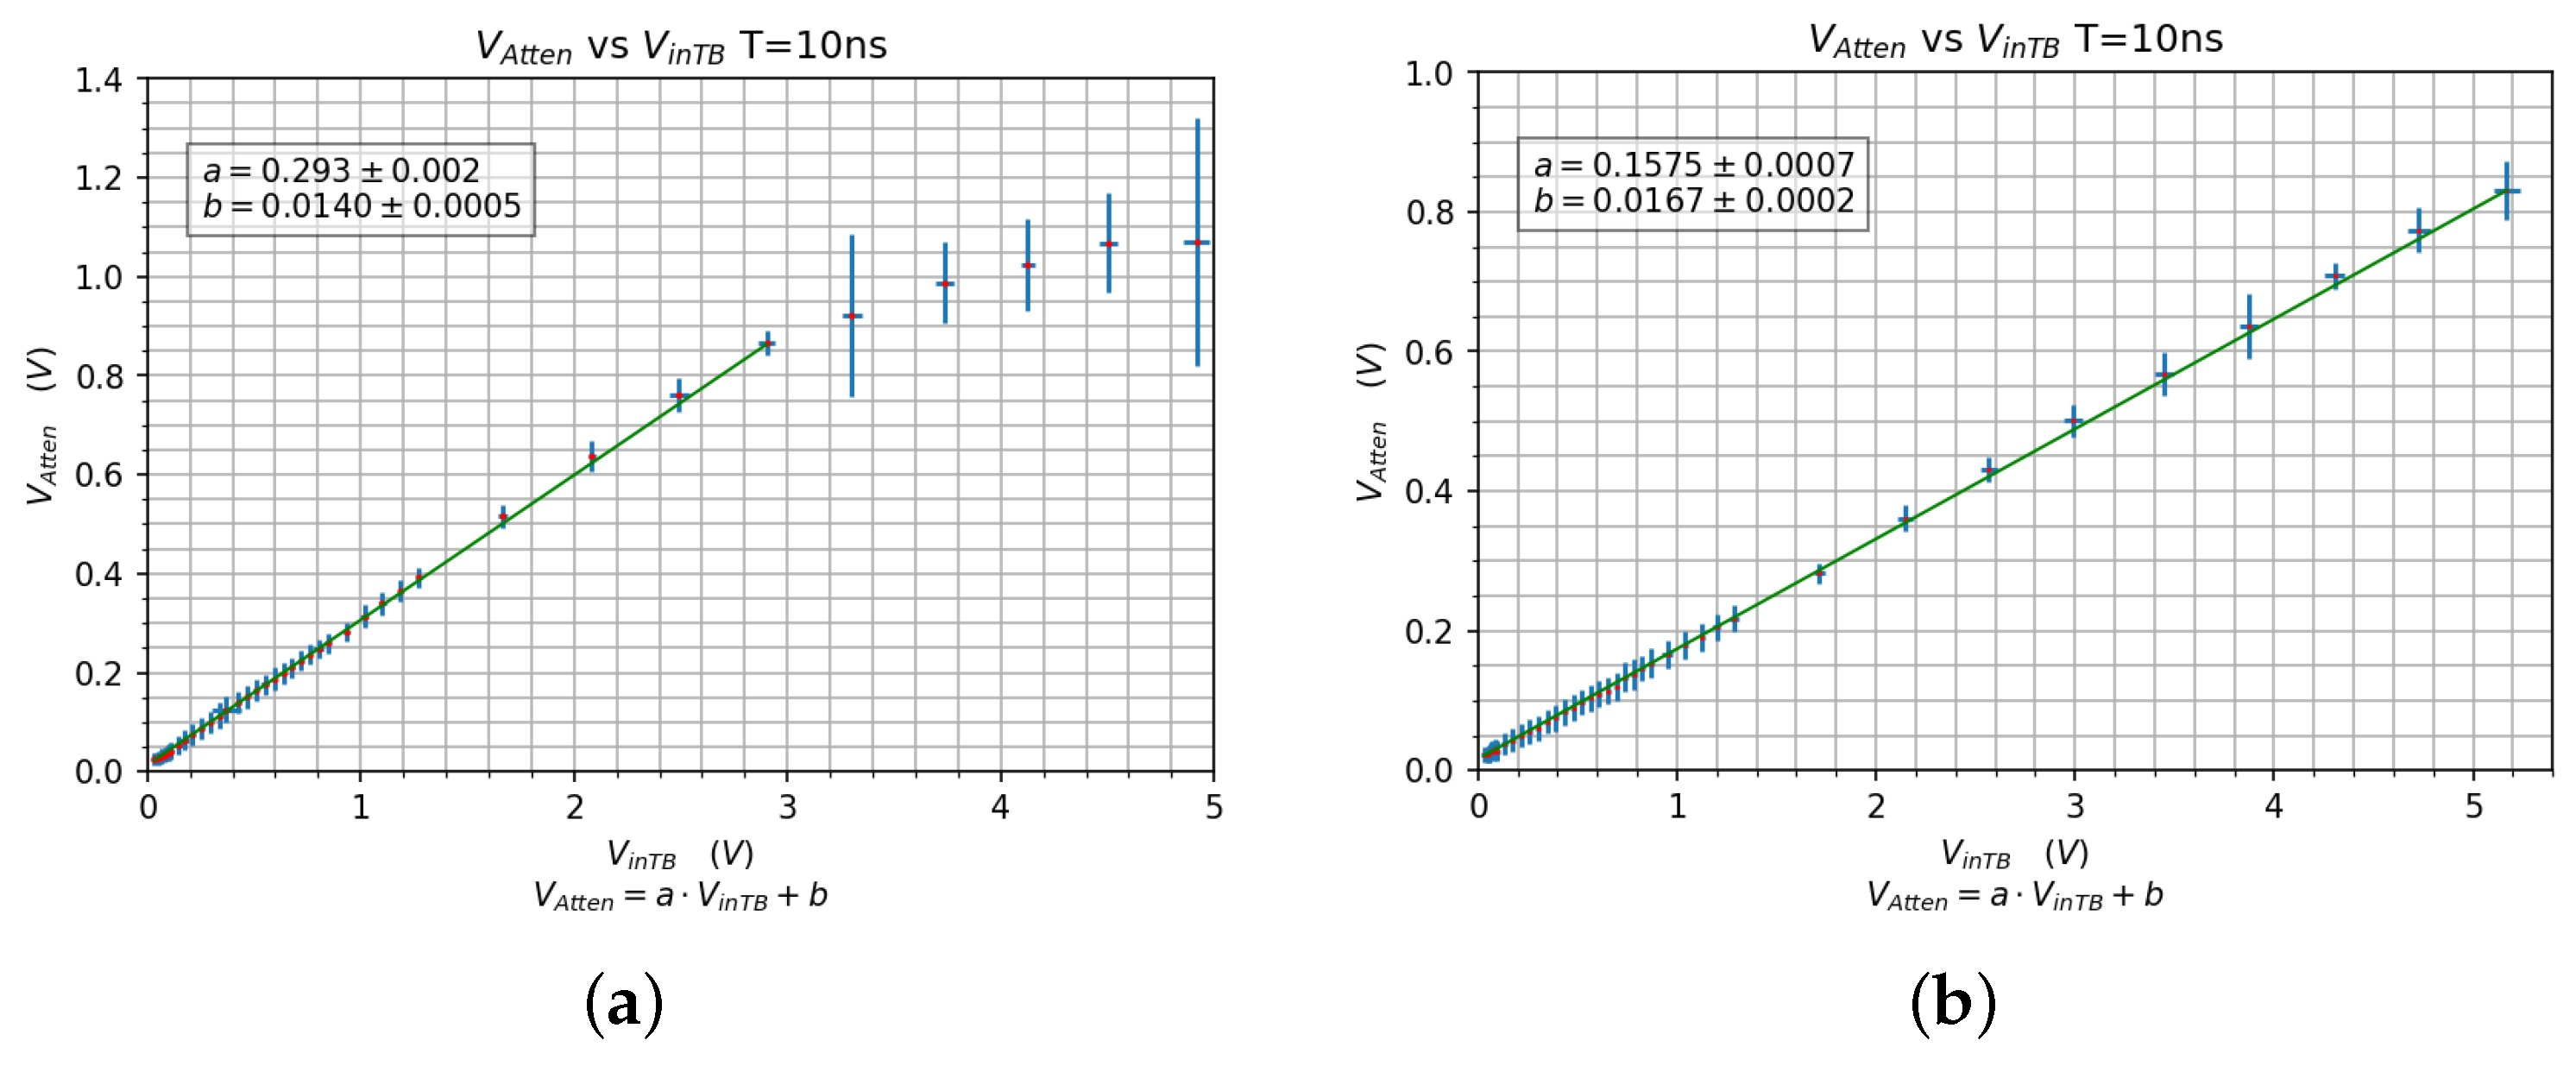
In
Figure 6a, it is possible to see that with a 3x attenuation, a compression for signals greater than 3 V is present.
This compression is caused by the protection diode inside the CITIROC’s inputs and would reduce the available input dynamic range since PMTs’ signals can extend up to 8 V.
The channel with the 6x attenuation, instead, shows a good linearity over the amplitude range of the input signal.
From these considerations, a good value for the attenuators would be 6x, but from the calibration curves that will be presented in
Section 4.2, it has been observed that doubling the attenuation and using higher gains for the preamplifiers allows the CITIROCs to work in a more linear region.
For these reasons, the final values of the attenuations have been chosen considering an attenuation of 12x for signals produced by almost all the scintillators except for those of T1. These scintillators, being thinner than all the others, produce smaller signals that would be wiped by the 12x attenuation, and therefore, the value 6x is used instead.
Table 3 shows the attenuation values for all the PMT&T channels.
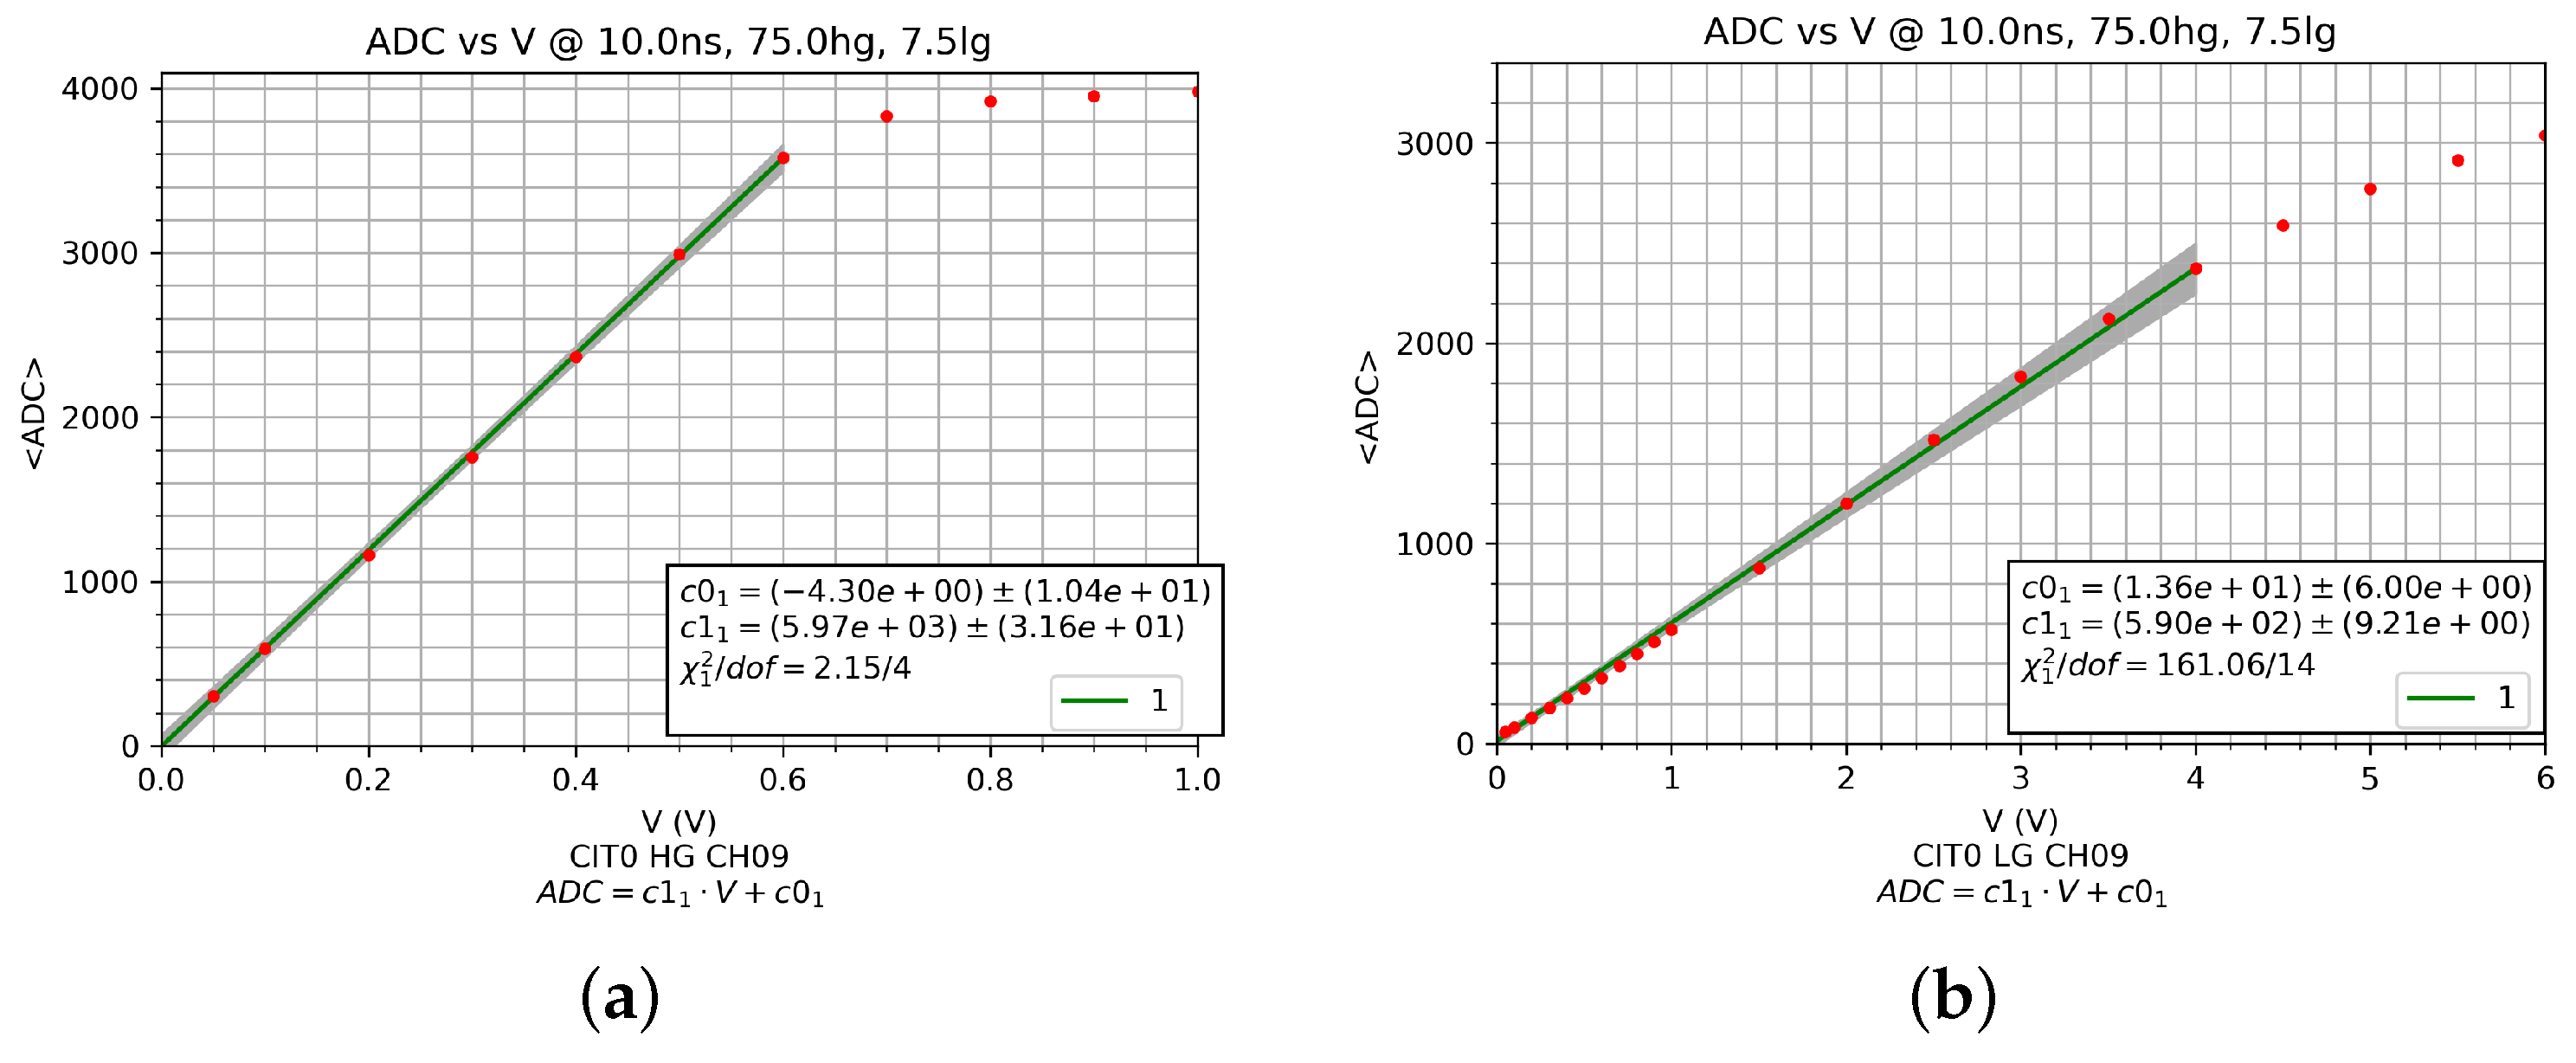
4.2. CITIROC’s Preamplifiers and Shapers Calibration
As mentioned before, the CITIROC’s preamplifiers and shapers can be configured with different values for the amplification and the shaping time.
To select the optimal combination of these parameters, a series of measurements have been conducted using square pulses with different amplitudes and durations.
Three classes of signals were used, considering the FWHM of the typical signal produced by the PMTs for different types of scintillators: 5 ns wide pulses for T1 scintillators, 10 ns for the calorimeter and 50 ns for the LYSO crystals.
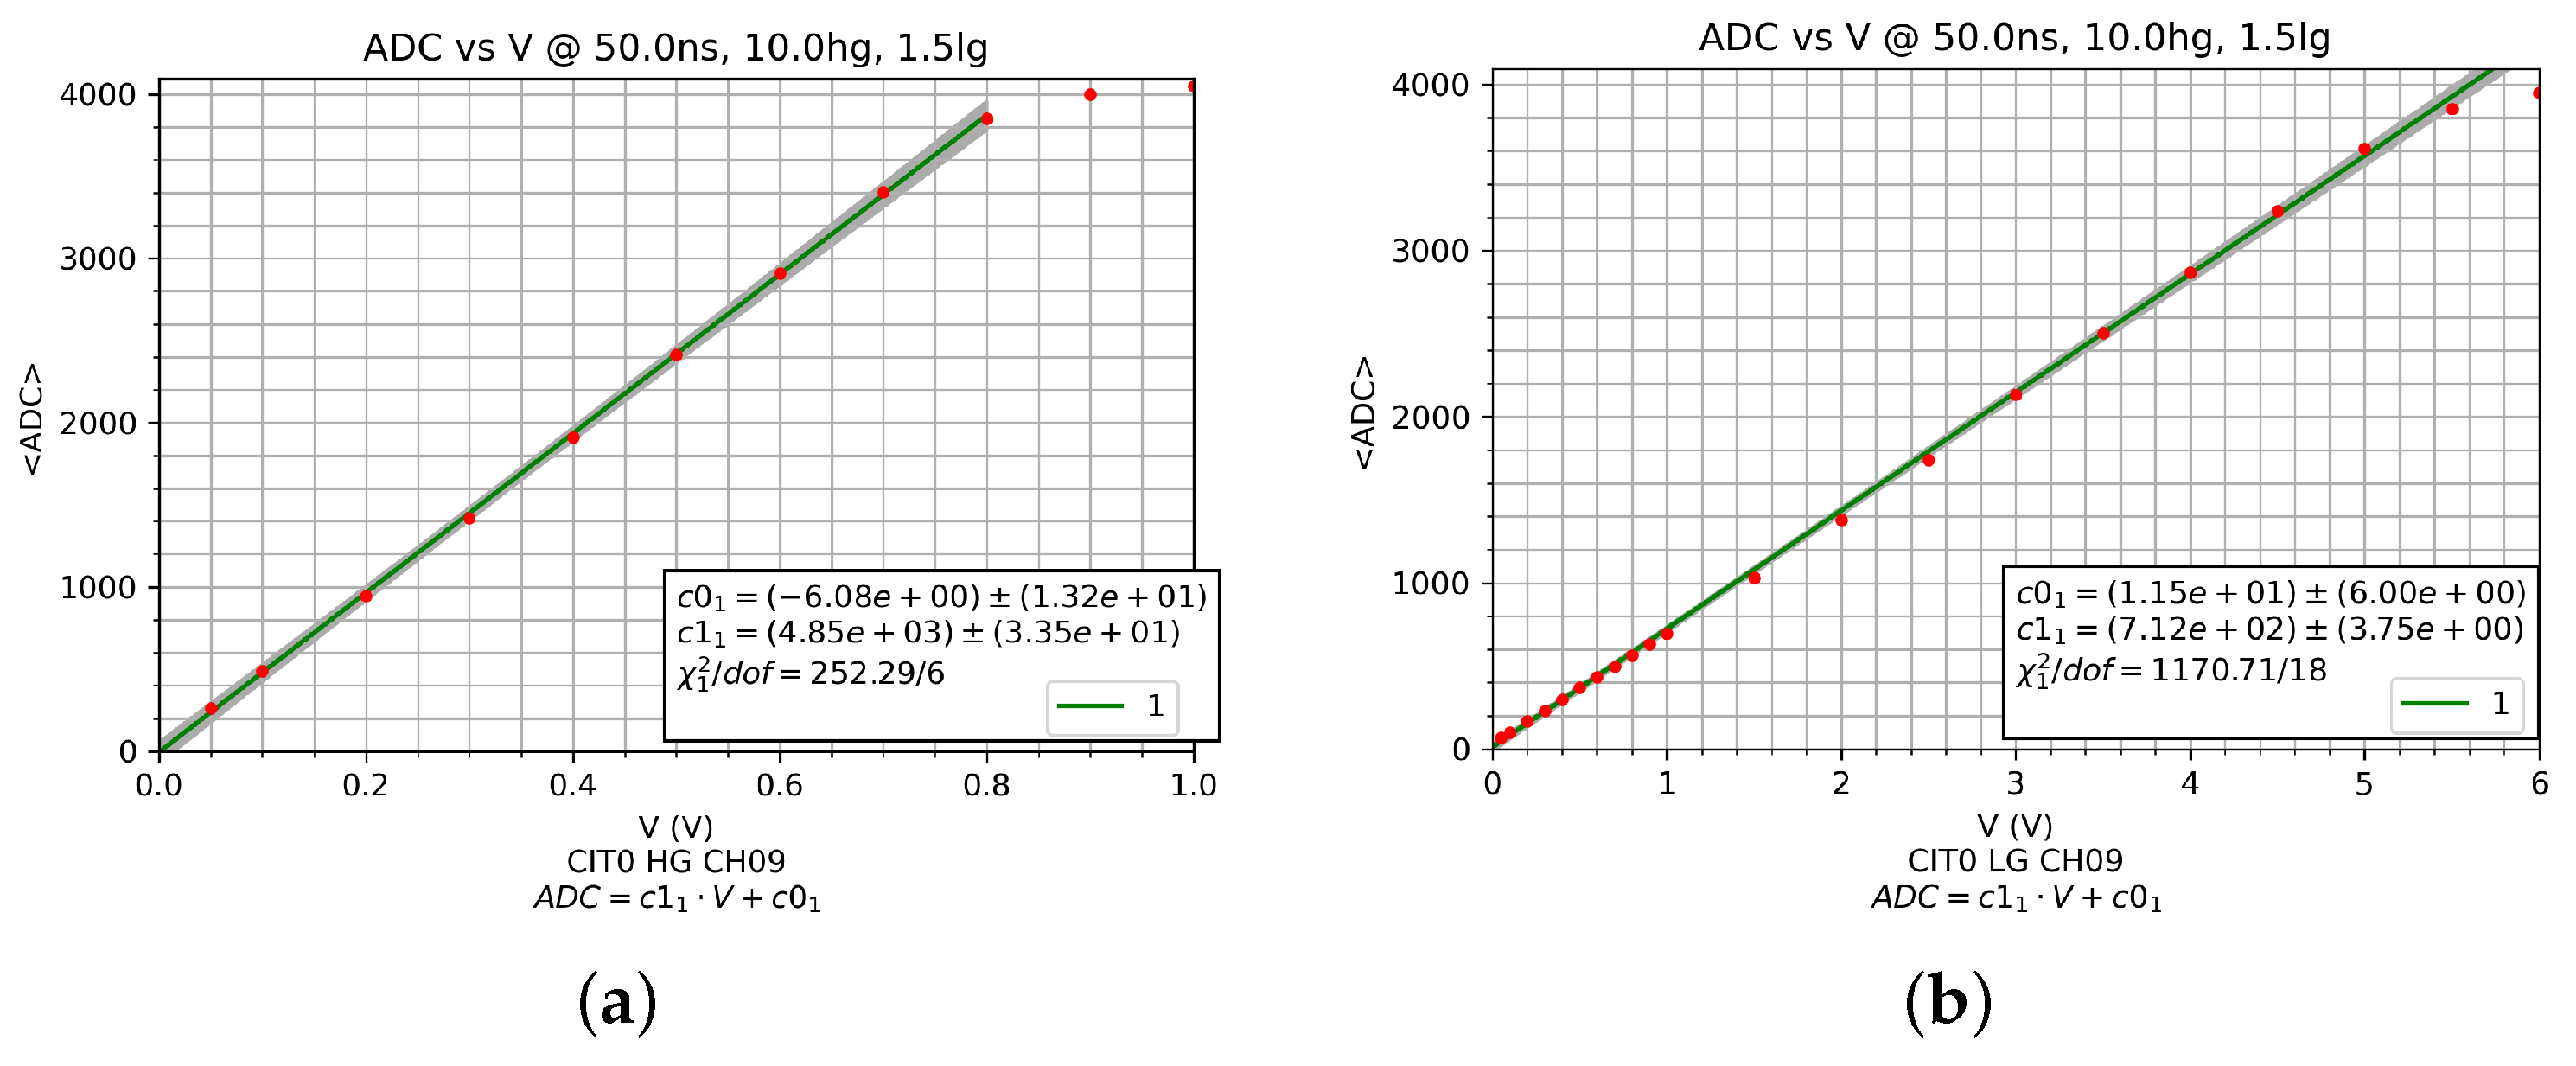
Figure 7 shows, as an example, the mean of ADC counts versus the amplitude of calorimeter-like signals, while
Figure 8 shows the same plots for LYSO-like signals.
At first, an amplification of 75 for high-gain preamplifiers and 7.5 for low gain was used, but after the detector integration, crosstalk between channels was observed for particles that produced high-amplitude signals in a large number of scintillators.
This effect was less evident for lower amplifications and led to a change in the selected parameters for the T1 and calorimeter preamplifiers.
The final values for preamplifiers gain are shown in
Table 3.
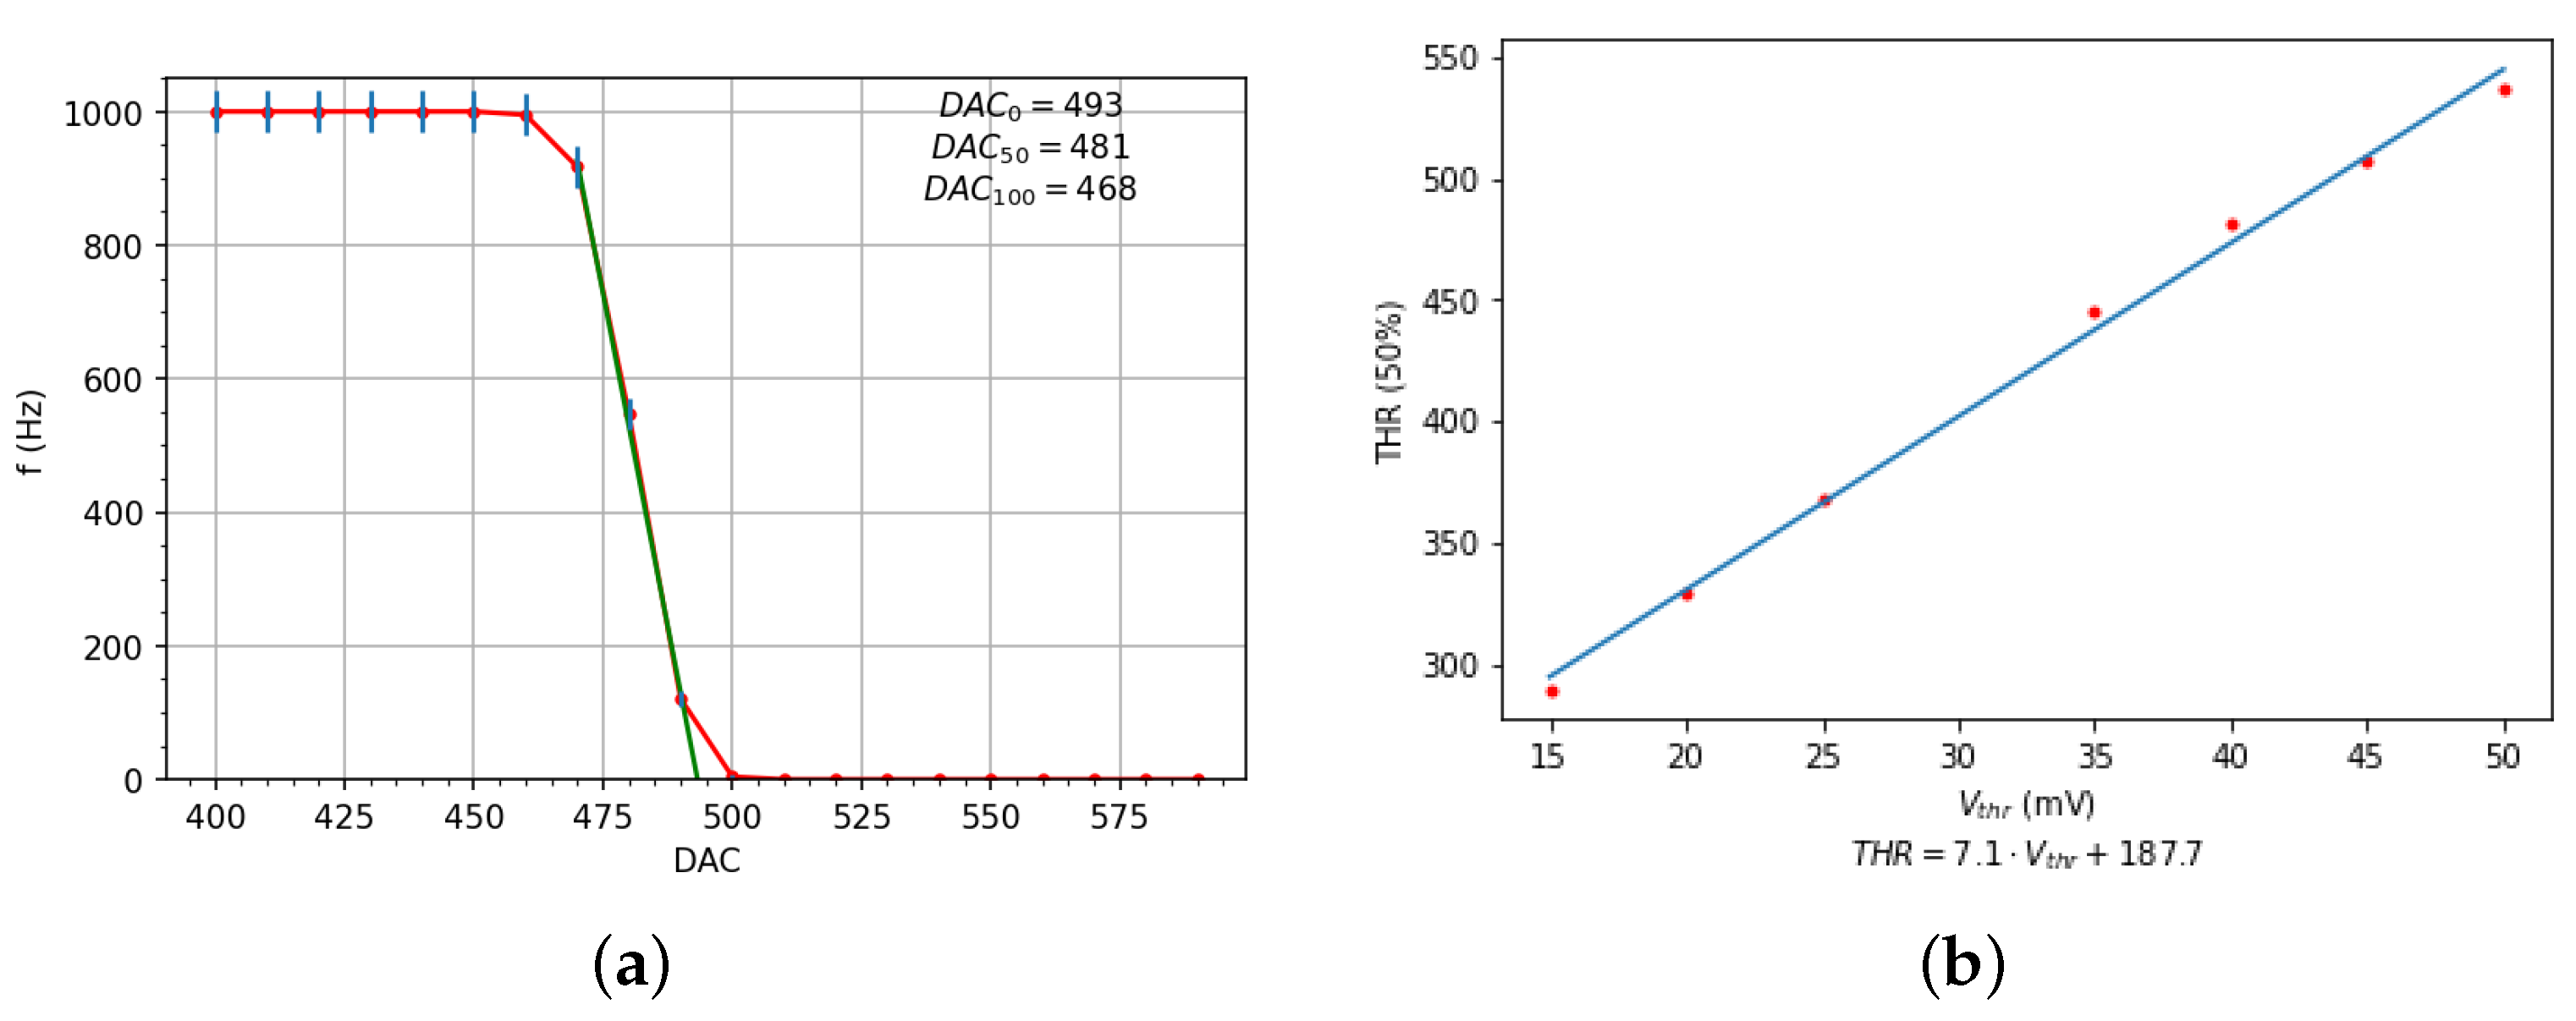
4.3. Threshold Calibration
The correspondence between the DAC value set for the threshold and the minimum signal that produces a trigger has been obtained with threshold scans at different input signal amplitudes.
An example of an S-curve made using 40 mV and 50 ns pulses, with a frequency of 1 kHz, is shown in
Figure 9a.
The threshold calibration curves have been obtained repeating this measurement for different signal amplitudes and using the DAC values that reduce the trigger efficiency to 50%.
5. Results
The working parameters for the PMT&T board, which include the preamplifier’s gain and the attenuation values for the input signal conditioning circuit, are reported in
Table 3.
The flight model of the HEPD-02 detector successfully used these values during the environmental tests and the beam tests.
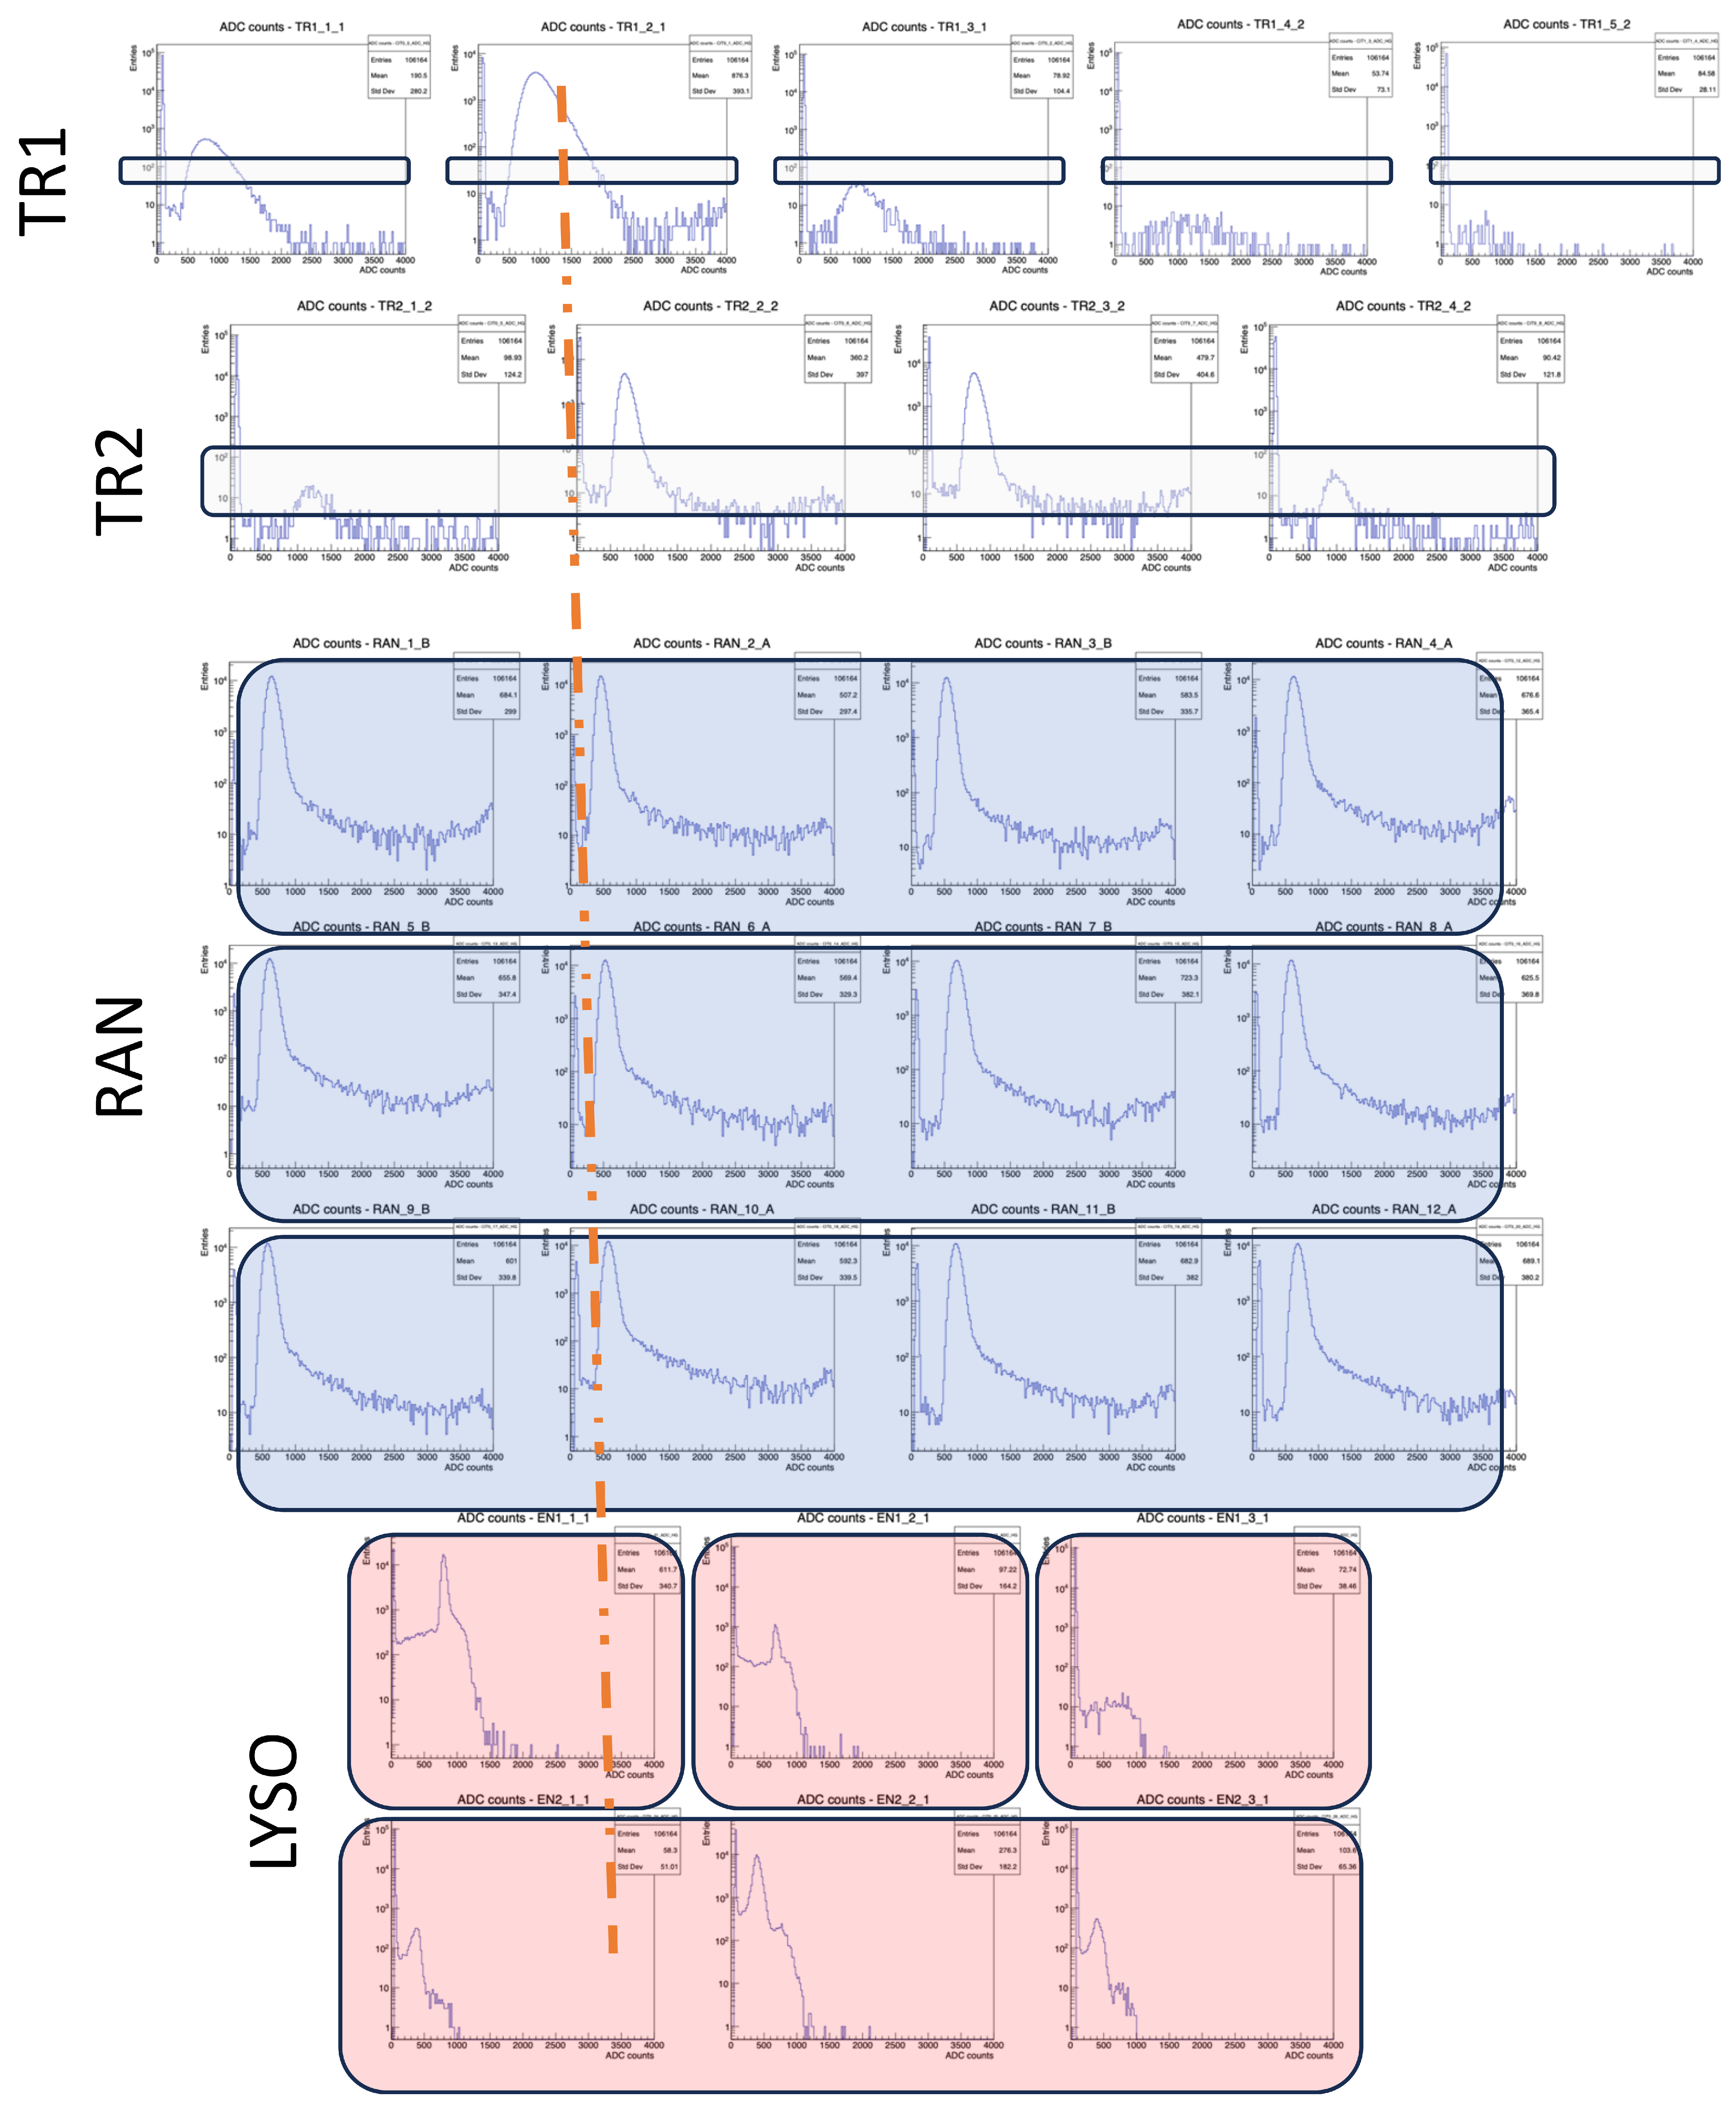
As an example of the acquisition made by the Flight Model of the HEPD-02, with the proposed parameters,
Figure 10 shows the ADC distribution produced by all the scintillators of the calorimeter, during a beam test with 228 MeV protons. For each scintillator, only one of the two PMTs has been taken into account.
The path of the protons can be followed by observing the peak of the ADC distributions: in TR1, most of the particles passed in the second segment (TR1_2_1), while the peaks in nearby scintillators (TR1_1_1 and TR1_3_1) are less pronounced, and almost no signal is produced in TR1_4_2 and TR1_5_2.
In TR2, the central slabs are mainly affected by the beam particles, as can be seen by the peak distribution of TR2_2_2 and TR2_3_2.
The presence of the peaks in all the RAN scintillators indicates that the energy of the particle is sufficiently high to pass through the whole detector.
The distributions from the last two segmented planes of LYSO crystal show that the particles exit mainly through EN1_1_1 and EN1_2_1 and EN2_2_1.
6. Conclusions
The PMT&T board, developed for HEPD-02, brings improvements to the flexibility of the instrument and allows the detector to operate in regions such as SAA and poles, extending the scientific significance of the mission.
Concurrent and prescaled triggers allow the use of different masks per orbital zone and also make possible the development of the GRB detection algorithm.
The added functionalities have been intensively tested and work as expected.
Author Contributions
Conceptualization, M.M., G.O. and V.S.; methodology, M.M., G.O. and V.S.; software, M.M.; validation and resources, A.A., A.B., V.M. and A.V.; data curation, F.P. and B.P.; writing—original draft preparation, M.M.; writing—review and editing, G.O. and V.S.; supervision, G.O. and V.S. All authors have read and agreed to the published version of the manuscript.
Funding
This work was supported by the Italian Space Agency in the framework of the “Accordo Attuativo 2020-32.HH.0 Limadou Scienza+” (CUP F19C20000110005) and the ASI-INFN agreement n.2014-037-R.0, addendum 2014-037-R-1-2017.
Data Availability Statement
The data presented in this study are available on request from the corresponding author.
Acknowledgments
We would like to thank the staff of Electronics and Detectors Service (SER) of the INFN Division of Naples, in particular V. Masone, A Boiano, A Vanzanella and A. Anastasio, for their strong and undivided support throughout this project.
Conflicts of Interest
The authors declare no conflict of interest.
References
- Pulinets, S.; Boyarchuk, K. Ionospheric Precursors of Earthquakes; Springer: Berlin/Heidelberg, Germany, 2004. [Google Scholar]
- Picozza, P.; Battiston, R.; Ambrosi, G.; Bartocci, S.; Basara, L.; Burger, W.J.; Campana, D.; Carfora, L.; Casolino, M.; Castellini, G. Scientific goals and in-orbit performance of the High Energy Particle Detector on board the CSES satellite. Astrophys. J. Suppl. Ser. 2019, 243, 16. [Google Scholar] [CrossRef]
- Ambrosi, G.; Bartocci, S.; Basara, L.; Battiston, R.; Burger, W.J.; Campana, D.; Caprai, M.; Carfora, L.; Castellini, G.; Cipollone, P.; et al. The electronics of the High-Energy Particle Detector on board the CSES-01 satellite. Nucl. Instrum. Methods Phys. Res. Sect. A 2021, 1013, 165639. [Google Scholar] [CrossRef]
- Ambrosi, G.; Bartocci, S.; Basara, L.; Battiston, R.; Burger, W.J.; Campana, D.; Carfora, L.; Castellini, G.; Cipollone, P.; Conti, L.; et al. Beam test calibrations of the HEPD detector on board the China Seismo-Electromagnetic Satellite. Nucl. Instrum. Methods Phys. Res. Sect. A 2020, 974, 164170. [Google Scholar] [CrossRef]
- Palma, F.; Sotgiu, A.; Parmentier, A.; Martucci, M.; Piersanti, M.; Bartocci, S.; Battiston, R.; Burger, W.J.; Campana, D.; Carfora, L.; et al. The August 2018 Geomagnetic Storm Observed by the High-Energy Particle Detector on Board the CSES-01 Satellite. Appl. Sci. 2021, 11, 5680. [Google Scholar] [CrossRef]
- Bartocci, S.; Battiston, R.; Burger, W.J.; Campana, D.; Carfora, L.; Castellini, G.; Conti1, L.; Contin, A.; Donato, C.D.; Persio, F.D. Galactic Cosmic-Ray Hydrogen Spectra in the 40–250 MeV Range Measured by the High-energy Particle Detector (HEPD) on board the CSES-01 Satellite between 2018 and 2020. ApJ 2020, 901, 8. [Google Scholar] [CrossRef]
- Martucci, M.; Bartocci, S.; Battiston, R.; Burger, W.J.; Campana, D.; Carfora, L.; Conti, L.; Contin, A.; De Donato, C.; De Santis, C.; et al. New results on protons inside the South Atlantic Anomaly, at energies between 40–250 MeV in the period 2018–2020, from the CSES-01 satellite mission. Phys. Rev. D 2022, 105, 062001. [Google Scholar] [CrossRef]
- Piersanti, M.; Materassi, M.; Battiston, R.; Carbone, V.; Cicone, A.; D’Angelo, G.; Diego, P.; Ubertini, P. Magnetospheric–Ionospheric–Lithospheric Coupling Model. 1: Observations during the 5 August 2018 Bayan Earthquake. Remote Sens. 2020, 12, 3299. [Google Scholar] [CrossRef]
- Ambrosi, G.; Bartocci, S.; Basara, L.; Battiston, R.; Burger, W.J.; Carfora, L.; Castellini, G.; Cipollone, P.; Conti, L.; Contin, A.; et al. The HEPD particle detector of the CSES satellite mission for investigating seismo-associated perturbations of the Van Allen belts. Sci. China Technol. Sci. 2018, 61, 643–652. [Google Scholar] [CrossRef]
- Available online: https://cses.web.roma2.infn.it/ (accessed on 13 October 2023).
- Shen, X.; Zhang, X.; Yuan, S.; Wang, L.; Cao, J.; Huang, J.; Zhu, X.; Piergiorgio, P.; Dai, J. The state-of-art of the China Seismo-Electromagnetic Satellite mission. Sci. China Technol. Sci. 2018, 61, 634–642. [Google Scholar] [CrossRef]
- Perciballi, S.; Iuppa, R.; Mese, M.; Nozzoli, F.; Osteria, G.; Scotti, V.; Ubertini, P. Performance of the HEPD-02 LYSO calorimeter and expected sensitivity to GRBs detection. Proc. Sci. 2021, 395, 583. [Google Scholar] [CrossRef]
- De Santis, C.; Ricciarini, S. The High Energy Particle Detector (HEPD-02) for the second China Seismo-Electromagnetic Satellite (CSES-02). PoS 2021, ICRC2021, 058. [Google Scholar] [CrossRef]
- Iuppa, R.; Beolé, S.; Coli, S.; De Cilladi, L.; Gebbia, G.; Ricci, E.; Ricciarini, S.B.; Serra, E.; Zuccon, P. The innovative particle tracker for the HEPD space experiment onboard the CSES-02 satellite. Proc. Sci. 2021, 395, 70. [Google Scholar] [CrossRef]
- Ricciarini, S.B.; Beolé, S.; de Cilladi, L.; Gebbia, G.; Iuppa, R.; Ricci, E.; Zuccon, P. Enabling low-power MAPS-based space trackers: A sparsified readout based on smart clock gating for the High Energy Particle Detector HEPD-02. Proc. Sci. 2022, 395, 71. [Google Scholar] [CrossRef]
- Mese, M.; Osteria, G.; Scotti, V.; Anastasio, A.; Collaboration, C.L. The HEPD-02 trigger and PMT readout system for the CSES-02 mission. Proc. Sci. 2021, ICRC2021, 063. [Google Scholar] [CrossRef]
- Scotti, V.; Mese, M.; Osteria, G. A Versatile Readout and Trigger System for the High Energy Particle Detector Onboard the Satellite CSES-02. In Proceedings of the 2019 IEEE Nuclear Science Symposium and Medical Imaging Conference (NSS/MIC), Manchester, UK, 26 October–2 November 2019. [Google Scholar] [CrossRef]
| Disclaimer/Publisher’s Note: The statements, opinions and data contained in all publications are solely those of the individual author(s) and contributor(s) and not of MDPI and/or the editor(s). MDPI and/or the editor(s) disclaim responsibility for any injury to people or property resulting from any ideas, methods, instructions or products referred to in the content. |
© 2023 by the authors. Licensee MDPI, Basel, Switzerland. This article is an open access article distributed under the terms and conditions of the Creative Commons Attribution (CC BY) license (https://creativecommons.org/licenses/by/4.0/).


 ,
, 


