1. Introduction
It is widely recognised that river fragmentation caused by artificial barriers is one of the major threats to river ecosystems [
1], severely altering the physiography of catchments [
2]. Almost 630,000 artificial barriers have been recorded on rivers in European countries alone, but it is likely that around the same number of barriers are not included in the databases [
3]. The disruption of flow and sediment regimes, degradation and fragmentation of physical habitats, changes in water physicochemistry, disturbances in energy and nutrient transport, direct and indirect mortality of aquatic biota and other severe consequences of river fragmentation [
2,
4,
5] have led to an increasing trend towards removing artificial barriers or implementing measures to mitigate their impact. An additional incentive for barrier removal is that many of the dams built in the past are filled with sediment, have become unsafe or inefficient or otherwise outlived their usefulness [
6]. It is therefore not surprising that removing dams, weirs, culverts and other artificial barriers from rivers has become a common and widespread practice in the United States and Europe [
5,
7,
8].
Despite being one of the most damaging anthropogenic pressures in river basins, most artificial barriers are also socio-economic structures that contribute to human well-being and economic development. Therefore, the feasibility of each barrier removal or the implementation of a mitigation measure is associated with an assessment of the environmental benefits versus socio-economic costs. When prioritising the barriers to be removed, it is recommended to consider three conditions: (1) removal should result in meaningful ecological gain; (2) removal can be achieved in a cost-efficient way; (3) removal will not cause significant or lasting environmental damage [
9]. Since it is essential to prioritize the removal of barriers where rivers, freshwater resources and ecosystem services would benefit the most [
7], assessment of the impact of an artificial barrier and the ecological effectiveness of its removal is an initial and crucial step in this process.
Different methods and metrics have been developed to assess river connectivity fragmentation [
10,
11], which in turn can be assessed as structural connectivity or functional connectivity [
12]. Although structural connectivity is an important attribute describing basin-wide processes, structural metrics are descriptive and unable to quantify the individual and cumulative ecological effects of each barrier [
13]. Therefore, functional connectivity needs to be considered when prioritizing barriers to removal or the implementation of mitigation measures. This requires taking into account both the size and quality of the habitat lost. More sophisticated methods for assessing river connectivity fragmentation (potential connectivity metrics in [
11]) also include additional environmental attributes (catchment size, discharge, etc.) and barrier passability metrics alongside simple structural metrics are spatially explicit and assess the habitat quantity. However, there have been few attempts to assess habitat quality in combination with habitat quantity for prioritising barriers or assessing the impact of the fragmentation of river connectivity [
12,
14,
15,
16].
The slope of the riverbed as well as the size of the river, defined as distance from the source, the wetted width or the size of the catchment are the main drivers of differentiation of fish types and the presence or dominance of certain species in the rivers of the European Western Plains and the Baltic Lowlands [
17,
18]. Rheophilic lithophilic fish choose specific habitats for spawning that meet certain criteria in terms of depth, flow velocity and bottom substrate composition [
19,
20,
21,
22,
23]. In lowland rivers, which are typically dominated by slow-flowing reaches, the area of shallower and higher-flow-velocity stretches suitable for the spawning and rearing of lithophilic migratory fish is therefore one of the most important factors determining the extent of reproduction and the abundance of the species in a river. Accordingly, ecologically meaningful prioritisation of artificial barriers in the lowland river basin can only be carried out by assessing the amount of habitat suitable for migratory fish reproduction. The aim of this study was therefore to develop a methodology that would allow the quantification of the area of habitat suitable for migratory lithophilic rheophilic fish blocked by artificial barriers in the lowland river basin, cover and assess the passability of the barriers, allow the prioritisation of the barriers according to their ecological importance, allow the assessment of the impact of the individual barriers as well as the cumulative impact and allow for the assessment of the scenario of either the complete removal of barriers or the application of mitigation measures. To this end, the proportion of the area suitable for the spawning of migratory fish in the total area of the river network above the barrier and the potential number of spawning fish were determined separately in the flooded and free-flowing sections of the river. The effect of the flooded area and fishway efficiency on the potential number of individuals above the barrier was assessed. The impact of the barriers was assessed, taking into account the current accessibility to migratory fish and the historical importance of the areas above each barrier.
2. Materials and Methods
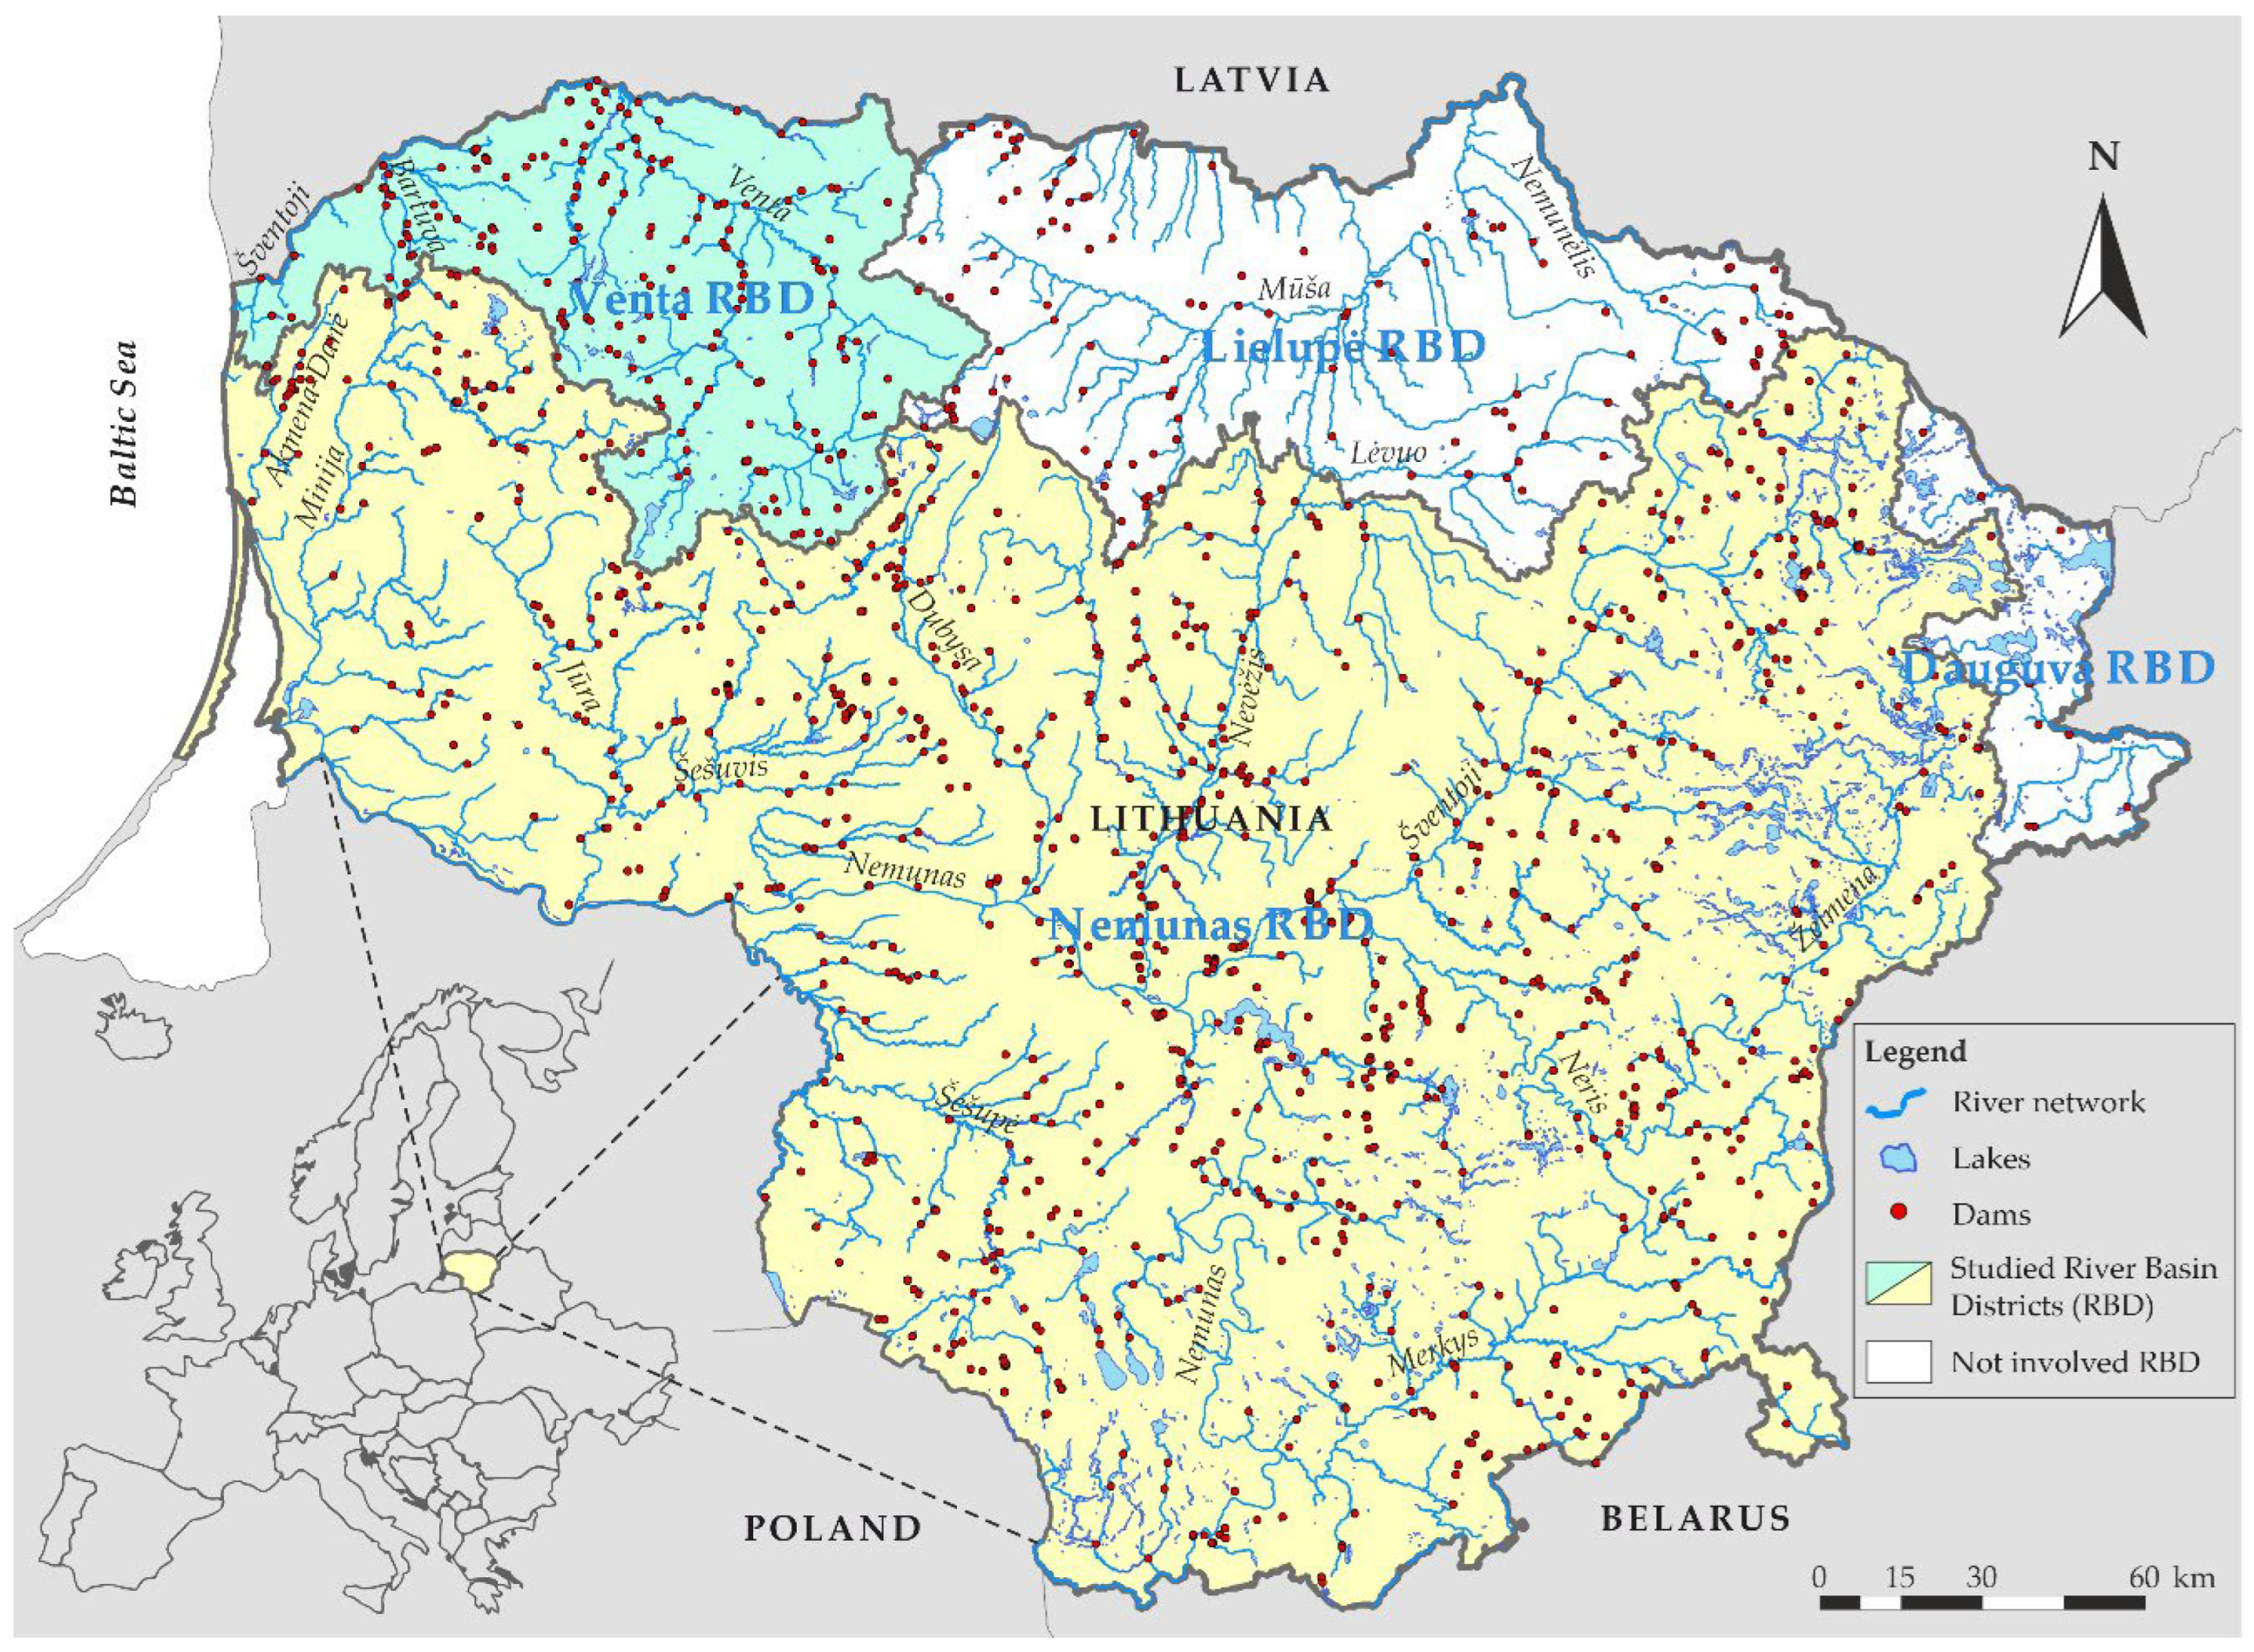
The study was carried out in Lithuania, in the south-eastern part of the Baltic Sea drainage basin. The entire territory (65,300 km
2) is in the lowlands. The average surface elevation is 99 m above sea level, with a maximum elevation of 220–290 m above sea level on some hilltops, so the average slope of river beds rarely exceeds 1 m/km, and typically ranges between 0.05 and 2.5 m/km. Only in single stretches of some small streams, the riverbed slope can reach up to 6–7 m/km. The area is drained by 4 large river basins: Nemunas, Venta, Lielupe and Daugava. The largest part, 72%, is covered by the basin of the large European river, Nemunas (catchment size 98,000 km
2), which flows into the Baltic Sea within the territory of the country. The other 3 rivers enter the Baltic Sea in the territory of neighbouring Latvia, but only the basin of the Venta is accessible to migratory fish in Lithuania. The other two river basins are fully (Daugava) or partially (Lielupe) blocked to fish migration by barriers in Latvia. Therefore, artificial barriers were prioritised only in the Nemunas and Venta river basins, which together cover 81% of the country’s territory. According to the state water cadastre, 1231 dams and weirs have been installed in these river basins, amounting to 1 barrier/24.4 km or 1 barrier/43.0 km
2 (
Figure 1).
The prioritisation of barriers according to the significance of their impact on migratory fish was carried out in 4 main steps: (1) delineating the boundaries of the river network suitable for target migratory species; (2) estimating the potentially suitable area upstream of the barrier; (3) calculating the potential abundance of spawners based on the area of suitable habitat and barrier passability; (4) prioritising barriers according to their impact on migratory fish production. The target migratory species for the development of the approach were the autumn-spawning salmonids Atlantic salmon (Salmo salar Linnaeus, 1758) and sea trout (Salmo trutta Linnaeus, 1758) and the spring-spawning river lamprey (Lampetra fluviatilis Linnaeus, 1758) and vimba bream (Vimba vimba Linnaeus, 1758), all of which still migrate to the barrier-free reaches of the river basins analysed.
2.1. Delineation of the River Network
In order to define the river network potentially supporting the target migratory species, the available dataset was analysed, including fish sampling records from more than 1000 different river sites sampled between 1993 and 2022 during routine fish monitoring or other fish surveys. In the study area, the size of the catchment is the main determinant of the size of the river [
24], which in turn determines the distribution of species. The minimum catchment size threshold for determining the potential range of the species was selected as the 10th percentile of the catchment area of the river stretches where the species occurs. The presence of species was analysed separately in natural and altered hydromorphology river reaches, as well as in stretches between and above lakes. Historical data going back to the 1930s were additionally analysed for the presence or absence of species in certain river sub-basins.
The present distribution of target species up to a specific migration barrier in the species-suitable part of the catchment has been determined, taking into account the presence of other migration obstacles located downstream of the barrier and the installed fish migration facilities. It was considered that if a functional fishway is installed on the barrier below, the section of the river up to the barrier above is also accessible to migratory fish.
2.2. Estimation of the Total and Potentially Suitable Area Upstream of the Barrier
Upstream of each barrier to migration, the total area of the river network sections to the next barrier, or to the boundary of a river basin of suitable size for the species, or to any other site limiting the species’ distribution was calculated. The areas of the river reaches were calculated by multiplying the lengths of the reaches by the average channel widths. The average channel widths of the reaches were calculated on the basis of the channel width–river basin area relationship established for Lithuanian rivers [
24]. The area of the river sections above the dams was calculated separately for the section flooded by the reservoir (area prior to impoundment) and for the river network upstream of the reservoir. The lengths of the river sections, the size of the catchment areas and the average slopes were calculated from a digital map of the country. Data on the length of currently flooded stretches were taken from the Lithuanian River Inventory, which also contains old cadastral data [
24].
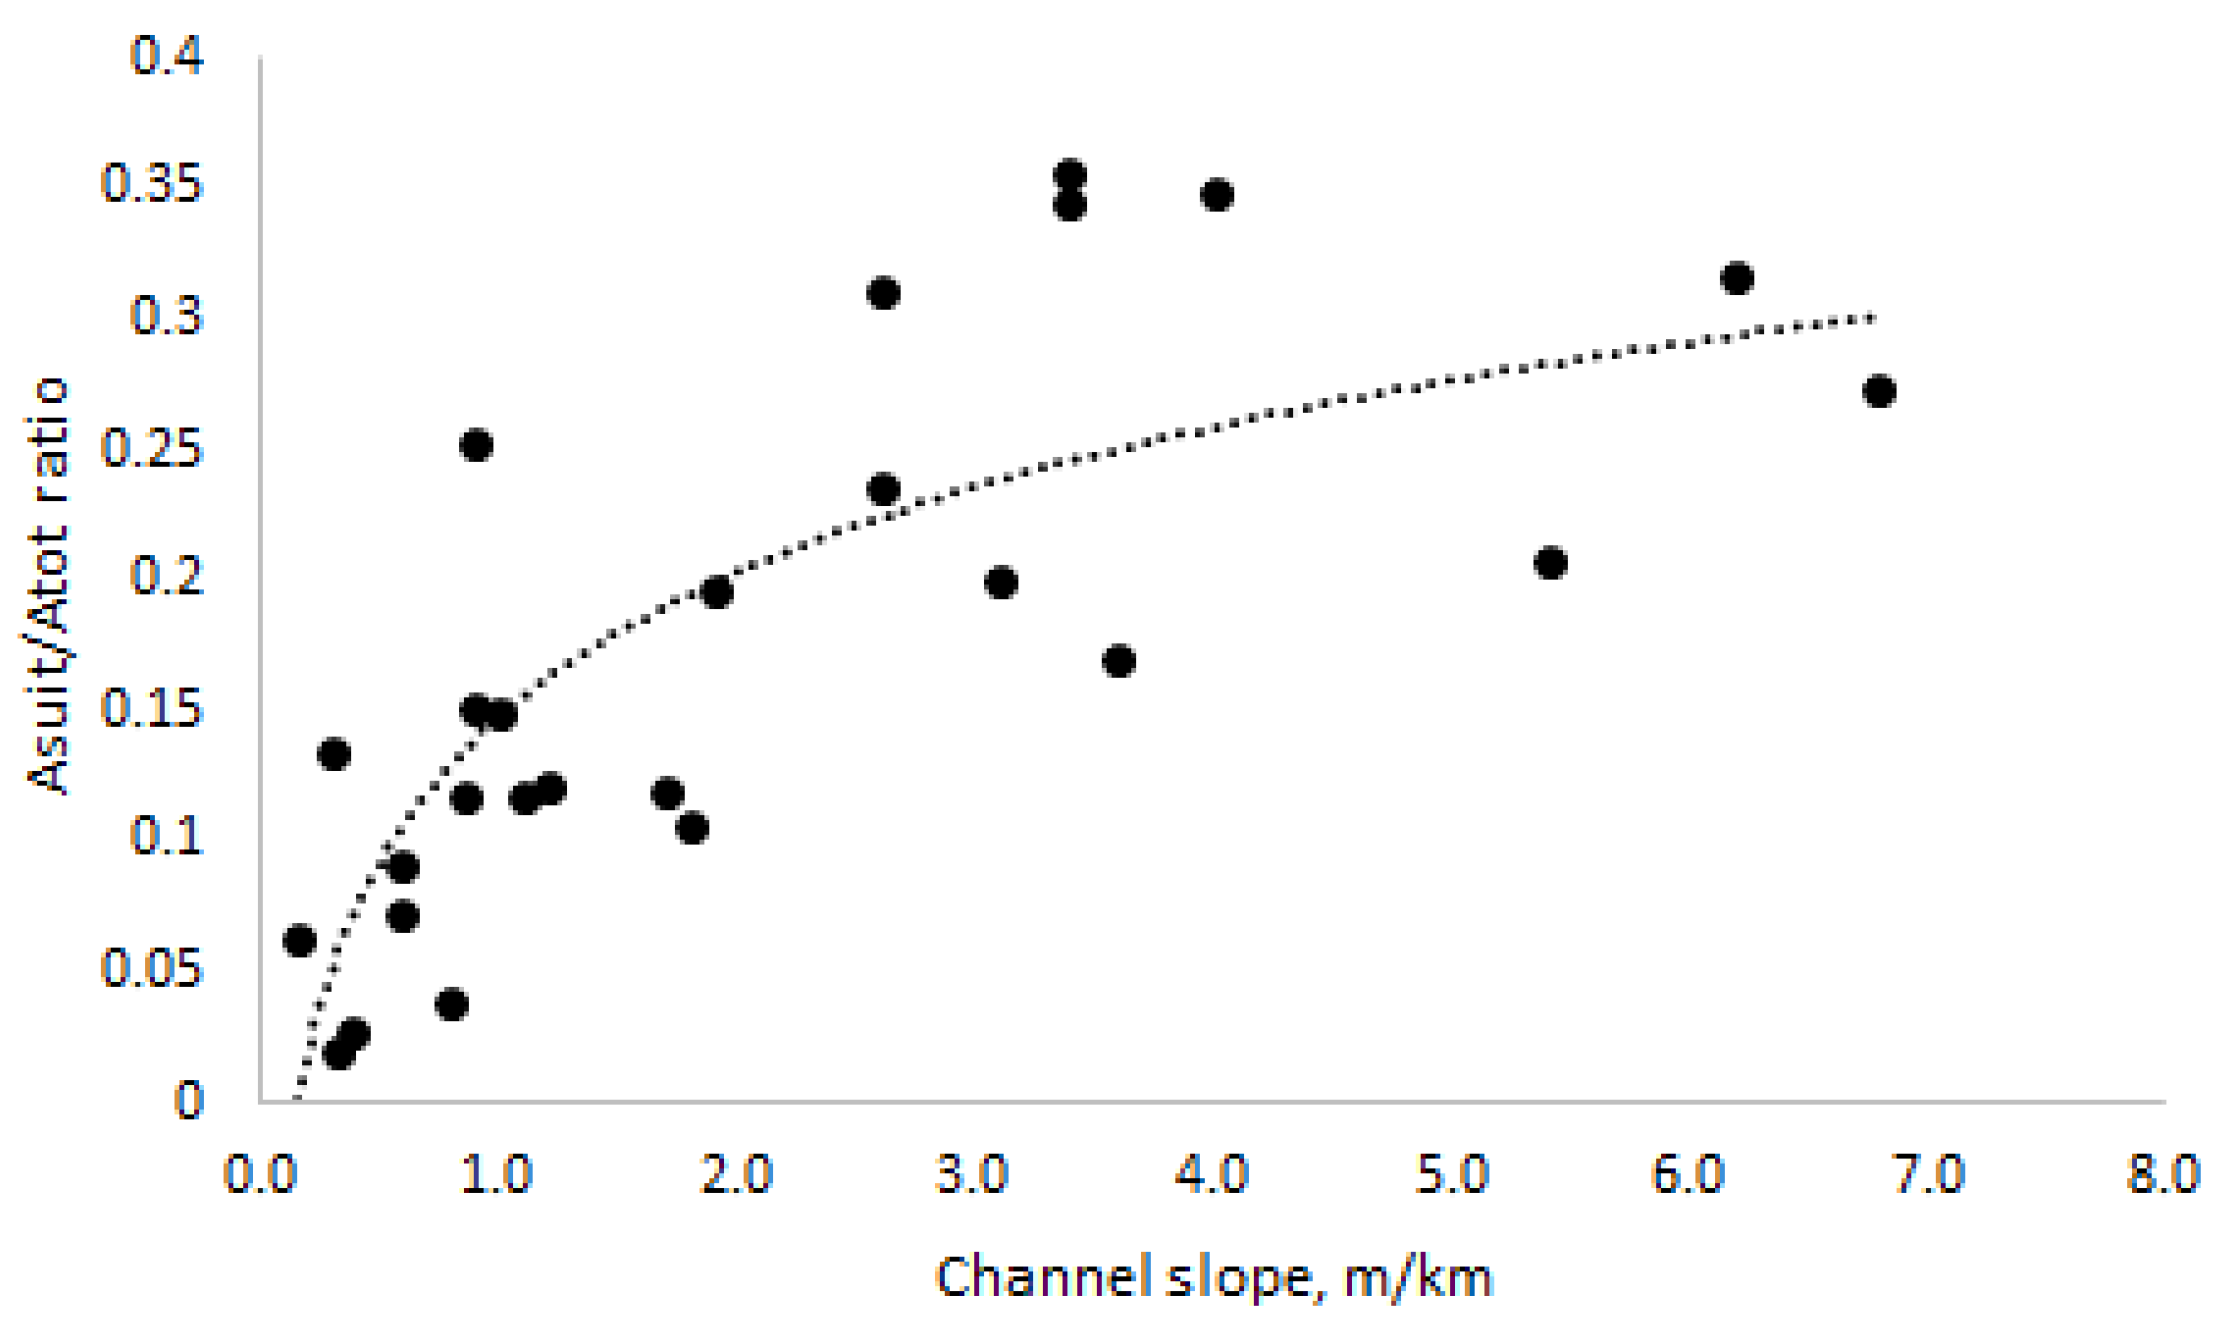
Calculation of the potentially suitable area was based on data on potential salmonid spawning areas collected and submitted through participation in the International Council for the Exploration of the Sea (ICES) Working Group on the Baltic Salmon and Trout Assessment (WGBAST). Rough estimates of the area of faster-flowing gravelly-stony stretches were made in 26 barrier-free rivers of varying size and gradient in different sub-basins in different parts of the study area. These data were used to determine the ratio of suitable area to the total area of the river stretch, as a function of the slope of the riverbed. This function was then used to predict the proportion of the potentially suitable area above the barrier, separately for the flooded river section and the river network above the reservoir.
2.3. Calculation of the Potential Abundance of Spawners Based on Area of Suitable Habitat and Barrier Passability
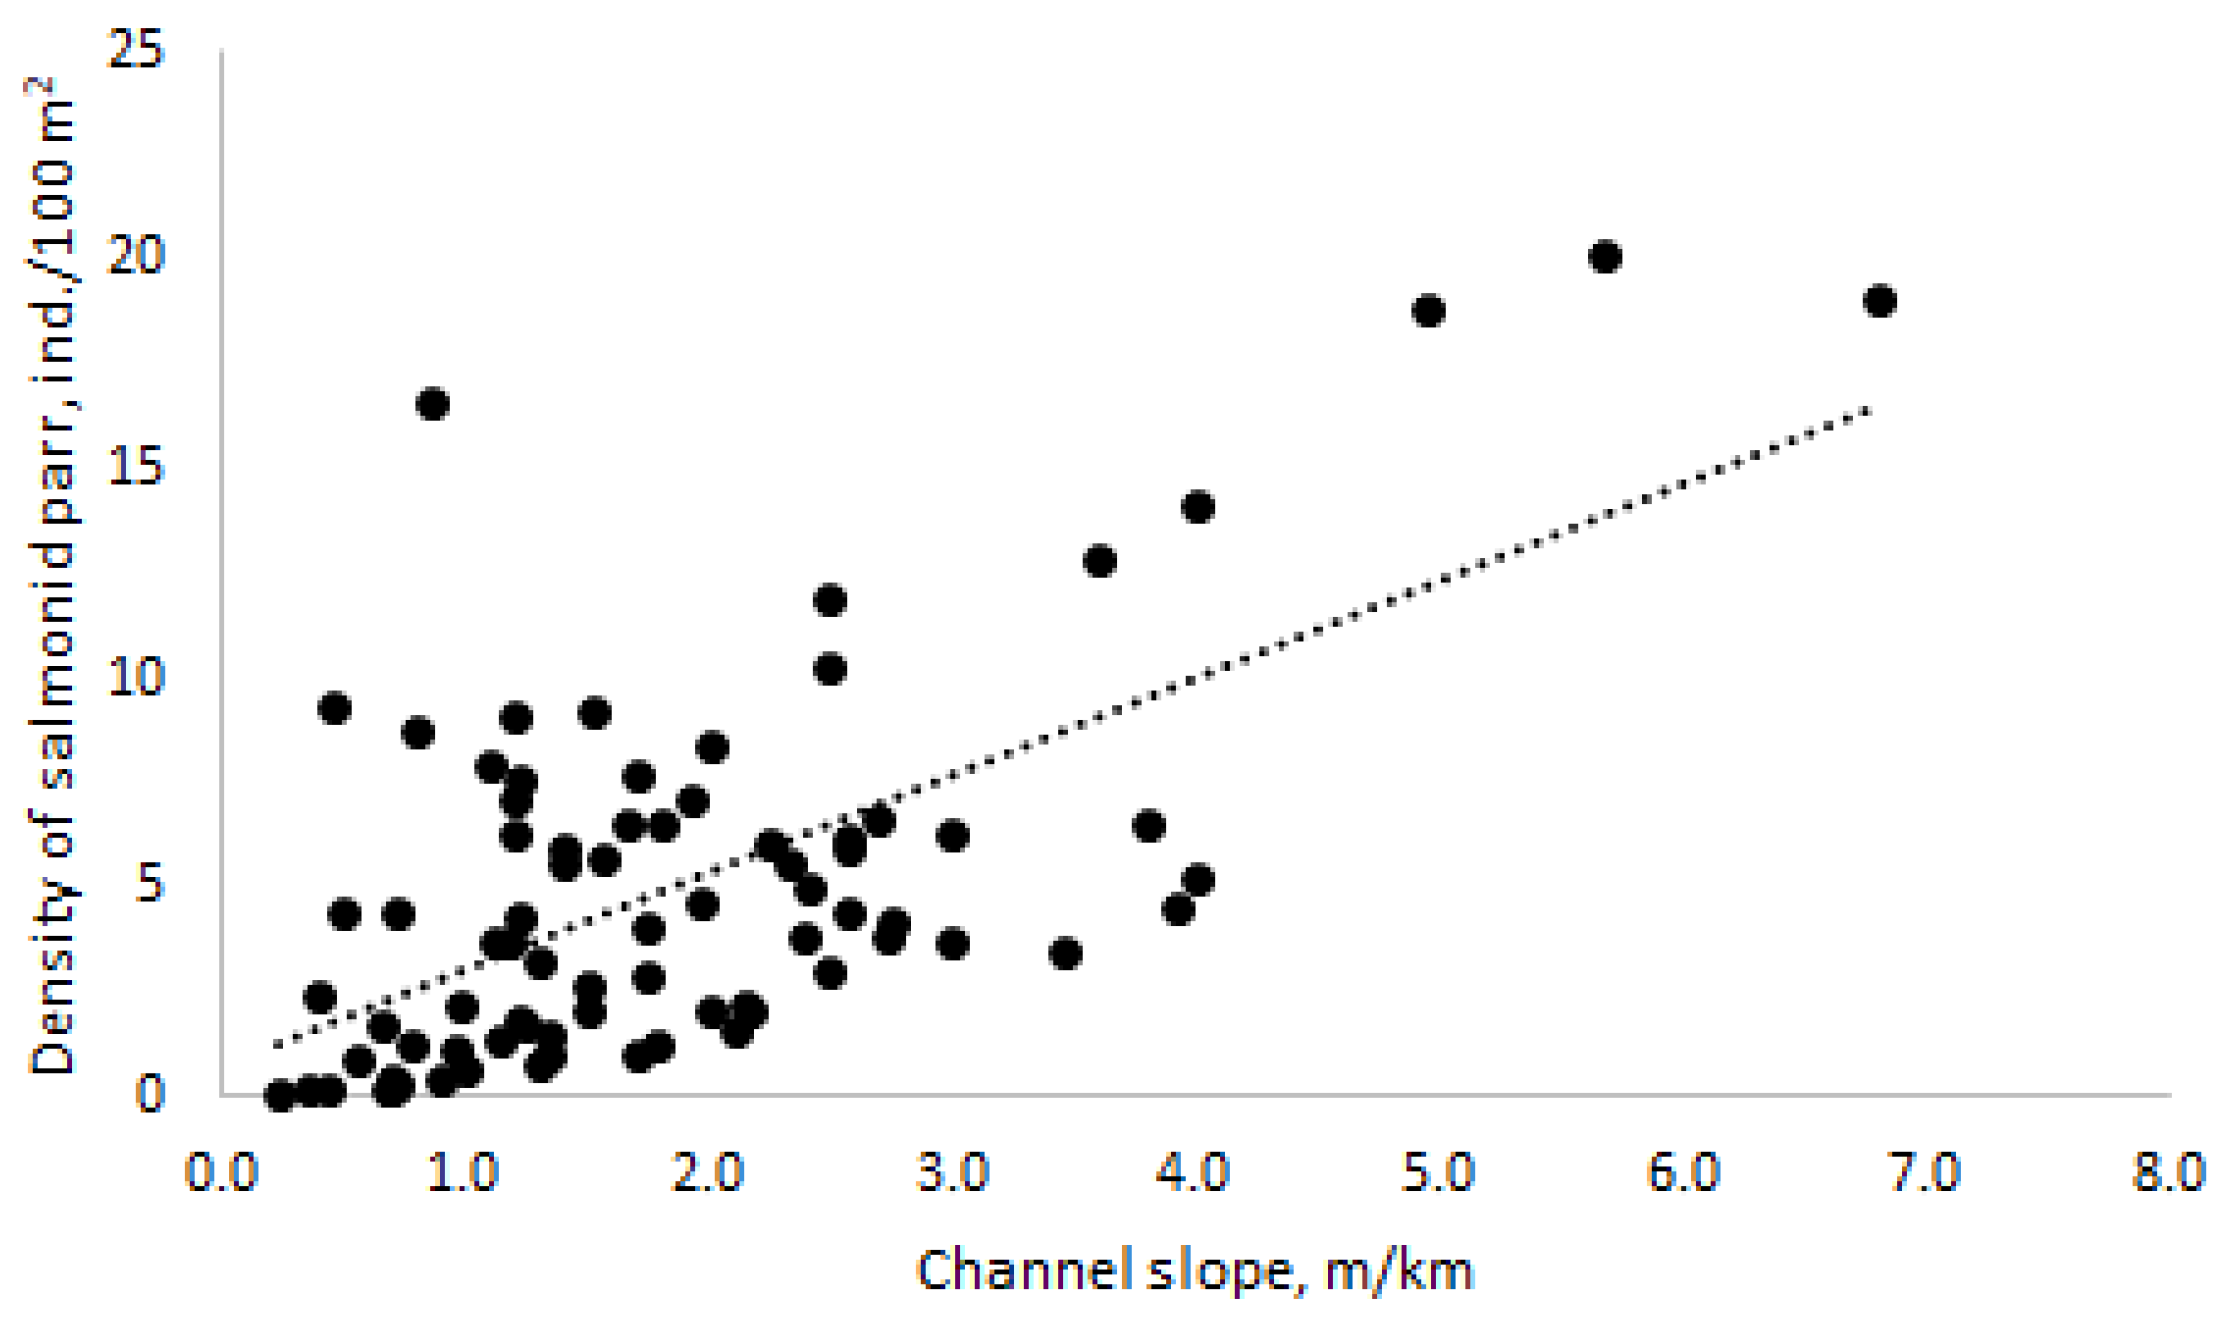
The estimation of the potential abundance of migratory fish spawners in potentially suitable areas was based primarily on salmonids, which are the best-studied of all the migratory species considered. First, an assessment of the dependence of ≥1 year old salmonid juvenile abundance on environmental variables was made on the basis of the salmonid juvenile monitoring data from 79 suitable areas located in rivers without barriers. The distance from the sea, catchment size and channel slope were chosen as environmental variables, which are sufficiently accurate and easy to calculate remotely from digital maps. Only the slope of the river channel, which is one of the indicators of salmonid habitat quality [
25], was found to be a significant determinant and was further used to predict juvenile salmonid densities in potentially suitable locations. Salmonid spawner abundance was then calculated from the predicted juvenile salmonid abundance in the suitable area using a survival rate of 10% [
26]. These estimates were based on the combined juvenile densities of both anadromous salmonid species. The proportion of juvenile Atlantic salmon and sea trout in suitable habitats varies in the study area. Both species are generally found in the same rivers, except for the smallest streams (typically, only sea trout is present in streams with a catchment area of less than 200 km
2 as indicated in the national reports submitted to ICES WGBAST), and spawn in the same river areas, as the depth, flow velocity and substrate composition of spawning habitats are similar for both species [
21,
27,
28]. The abundance of one of these co-occurring species can affect the egg-to-smolt survival of the other [
29], and therefore the combined juvenile density was a better reflection of habitat carrying capacity and was predicted with greater confidence than for individual salmonid species.
River lamprey and vimba bream spawn in river stretches that meet similar criteria for depth, flow velocity and bottom substrate [
19,
23] as migratory salmonids. But after hatching, lamprey ammocoetes migrate from spawning grounds and disperse to detritus-rich areas [
30], while juveniles of vimba bream migrate downstream as early as the first summer [
31]. For this reason, it was not possible to model their density in relation to the characteristics of the river stretch on the basis of available routine monitoring data. However, assessing the barriers solely in terms of their impact on salmonids would leave aside the potential significance of the river sections upstream of the barriers on rivers unsuitable for salmonids. Therefore, given that all migratory species spawn in areas with similar characteristics and only differ in timing, the theoretical abundance of river lamprey and vimba bream was extrapolated from the abundance of salmonids. Both species form large schools during spawning and are more than 10 times smaller in average weight than migratory salmonids at first maturity [
32]. Therefore, it was assumed that a suitable area sufficient for one pair of adult salmonids should also be sufficient for at least three pairs of river lamprey and/or vimba bream. This roughly corresponds to the proportion of salmonids and vimba bream in commercial catches or by-catches in the transitional waters bordering the Nemunas delta, and the directly observed proportion of river lamprey and sea trout reeds in the same river stretch [
23].
Data on the passability of the barriers with installed fishways, which was assessed by telemetry, were obtained from the Fisheries Service under the Ministry of Agriculture of the Republic of Lithuania, responsible for monitoring the fishway efficiency. For the fishways whose efficiency was not measured, the passability rate was determined as the average efficiency of the fishways monitored. This corresponded roughly to 0.7 for salmonids (70% of spawners pass the fishway upstream) and 0.5 for vimba bream.
The passability of the fishways for river lamprey was not assessed in the study area. Published data indicate that the ability of river lamprey to pass through conventional fishways is very low, ranging from 0 to 13.8% depending on the type of fishway [
33,
34,
35]. A high passage rate of 88% has only been recorded in the fishway, which has a very low slope and low drop height between sections [
36]. Given that most of the fishways in the study area were constructed without taking into account the specific needs of river lamprey for fishway design, it was assumed that they could be passed by no more than 5% of individuals (passability rate 0.05). Finally, the potential increase in spawner abundance in the case of free access to suitable areas above the artificial barrier was calculated by multiplying the abundance of spawners by the passability rate subtracted from 1. This has been performed only for areas that are not flooded by dams. Flooded sections are not suitable for the reproduction of the target species, even if they are freely accessible.
The potential number of individuals of each target species, covering all species-suitable elements of the river network above each migration barrier in the event of dam removal, was calculated as follows:
where
where
IMP refers to a river section flooded by impoundment;
RIV refers to the river network above the flooded section;
Nspadulttoti—total number of adults of a species above the i-th migration barrier, ind.;
Nspadult—number of adults of a species in each separate river network element above the barrier, ind.;
Rpass—the species-specific barrier passability rate (efficiency of the fishway, if any), from 0 (impassable) to 1 (fully passable);
Racc—species-specific rate of access to the migration barrier, ranging from 0 (no access) to 1 (free access). Calculated by multiplying the Rpass of other barriers below the barrier of interest, or set to 1 if there are now other barriers downstream;
Dsaljuv—density of ≥ 1 year old salmonid juveniles, ind./100 m2;
Asuit—area of suitable spawning habitat in a river network element, 100 m2;
Atot—total area of a river network element, 100 m2;
Slo—average slope of the riverbed in a river network element, m/km.
S—≥1 year old salmonid juvenile to adult survival rate, equal to 0.1;
k—species-specific abundance coefficient (1 for salmonids, 3 for vimba bream and river lamprey).
In order to test the methodology, the potential number of salmonid spawners (Nsaladult) was estimated in the sections of 4 rivers where salmonid redds are counted annually. For this purpose, using the above formula, Racc was set to 1 and Rpass to 0 for each river section. The estimated number of spawners was compared to the average number of redds over the last 10 years by calculating a Z-score (standard score) for each stretch.
2.4. Prioritisation of Migration Barriers
In order to rank the barriers according to the significance of their effects, the estimated total number of adults of each target species above each migration barrier was converted into an abundance ratio by dividing by the maximum estimated abundance among all the barriers compared. For the final prioritisation of the barriers, the abundance ratios of all species that would spawn above the i-th barrier were summed.
The formulae are given below.
where
Rbarri—the rank of the i-th barrier among all the barriers compared;
Nspadultratioi—the ratio of the number of individuals of a species estimated above the i-th migration barrier to the maximum number of individuals of the species among all the barriers compared;
Nspadulttotmax—the maximum number of individuals of the species among all the barriers compared, ind.
In order to estimate and compare the historical abundance of the target species in the area above each barrier prior to its construction, the same calculations have been carried out, assuming that each barrier is accessible. This was performed using the same formulae, but excluding accessibility and passability from the Nspadulttoti calculation (Racc equals 1 and Rpass equals 0). The calculated ‘historical’ Rbarri (HRbarri) was used both to determine the effect of removing the downstream barrier on the Rbarri value of the upstream barrier and to determine the cumulative effect of removing successive barriers. The cumulative effect was calculated by summing the HRbarri, starting with the farthest downstream barrier.
3. Results
According to an analysis carried out on river stretches open to fish migration, the smallest catchment size of the stretch of river still inhabited by migratory salmonids and river lamprey is 50 km
2 and that of the vimba bream is 200 km
2. In the vast majority of cases, these species were also absent from heavily modified river stretches due to channel straightening, stretches between lakes and above lakes. Based on actual and historical data, salmonid species, which, unlike vimba bream and river lamprey, are already experiencing thermal stress at water temperatures above 22 degrees [
37], were also absent from a Nevėžis River sub-basin, characterised by the highest water temperatures during the warm season and the highest hydrological drought hazard index scores in the study area [
38,
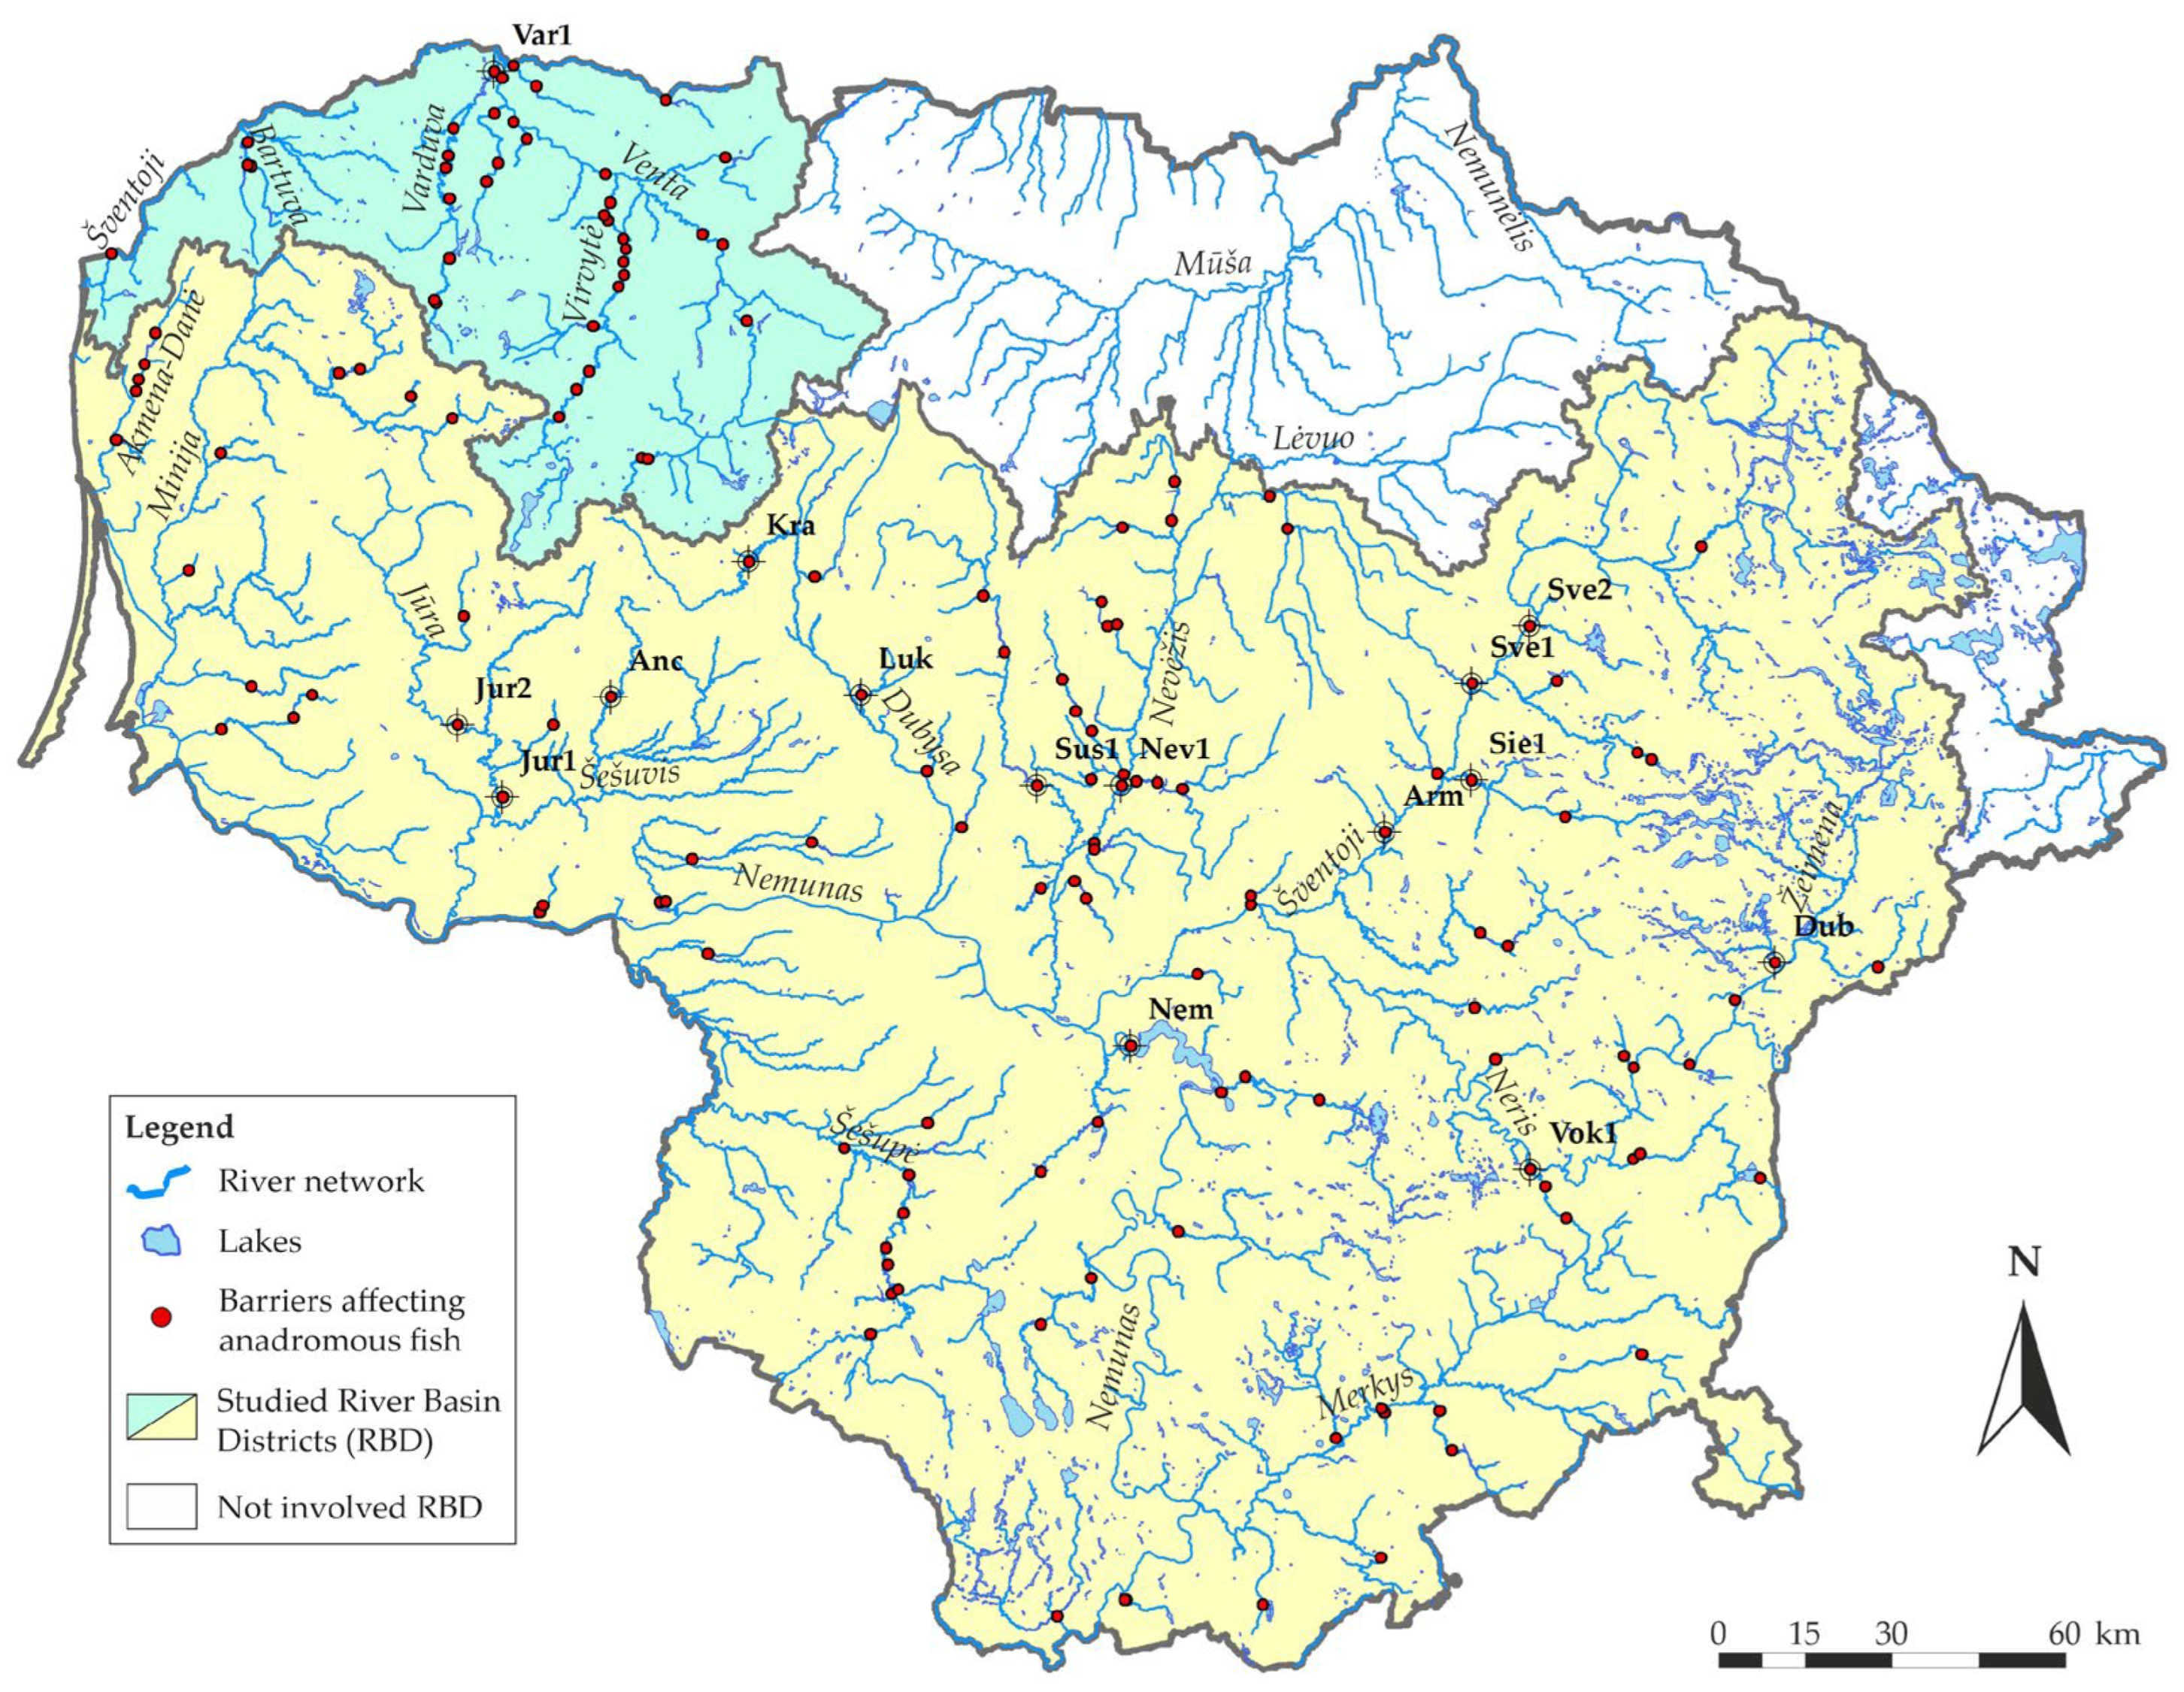
39]. The delineation of the river network according to these criteria showed that the majority (87.4%) of the 1231 dams and weirs present in the cadastre are outside the area potentially suitable for the target migratory species. These barriers are located on small, mostly channelized streams with very low or even temporary discharges (985 barriers), or on lakes or between lakes (91 barriers). Only 155 barriers (12.6%) are constructed on river stretches suitable for the spawning of target migratory species (
Figure 2). All of them are located in former migration routes of river lamprey, 129 in sections suitable for salmonids and 85 in sections previously accessible to vimba bream. More than half of these barriers (81) are equipped with hydropower plants. Currently, the migration of anadromous fish to the 87 barriers is completely blocked by other downstream barrier obstacles. Some of the remaining barriers are also only partially accessible due to other migration obstacles with fishways.
The total length of the river stretches completely or partially blocked to fish migration in the delineated network is almost 3.17 thousand km or 80 km2. The estimated area suitable for the spawning of migratory fish is 6.4 km2 or 8% of the total area, but the proportion of suitable area above the different barriers in the total area varies between 5 and 31% (mean 15.5 ± 5.1). Almost 1.2 km2 of the suitable area (18.6%) is currently flooded by reservoirs. According to estimates, 15.4 thousand individuals of anadromous salmonids, 40.4 of vimba bream and 53.6 of river lamprey may have been lost as a result of the construction of the dams and weirs. The installation of fishways may have allowed the upstream passage of about 2.4 thousand salmonids, 4.9 of vimba bream and only 0.5 of river lamprey, i.e., 16%, 12% and only 1%, respectively, of the total historical adult abundance in the river network above the artificial barriers.
Based on the Rbarr
i score of barriers still accessible to migratory fish, the first 15 rankings were given to dams whose removal would open up 3.66 km
2, or 57.2% of the total suitable area, which would provide spawning habitat for 58% to 60% of the total number of individuals of the target migratory species lost as a result of the construction of the barriers (
Table 1). Almost half of these losses are caused by a single dam built on a very large river, the Nemunas (Nem). This barrier impedes fish migration to an area that represents 56% of the total area and 33.5% of the suitable area in the delineated river network above all barriers.
Other dams on larger rivers, which hinder the migration of fish to relatively large parts of river basins, were also ranked among the 15 barriers having the highest negative impacts. Three of these dams (Jur1, Sve1 and Sie1) already have fishways, which allow some salmonids and vimba bream to migrate upstream. But despite the fact that the potential number of salmonid and vimba bream individuals above the dam is reduced in the Rbarri calculation by the fraction of individuals that pass the barrier through the fishway, these partial barriers still result in some of the highest potential losses of individuals of these migratory species. In addition, the installed fishways do not ensure the migration of river lamprey. Other dams on the same larger rivers (Jur2 and Sve2), which are situated upstream of dams with fishways and prevent access to an area suitable for a relatively large number of migratory species, were also ranked high. Among the barriers having the highest negative impact are also those that prevent migration to a relatively small (Vok1) but high-gradient area that are most suitable for migratory fish spawning and rearing in the lowland rivers.
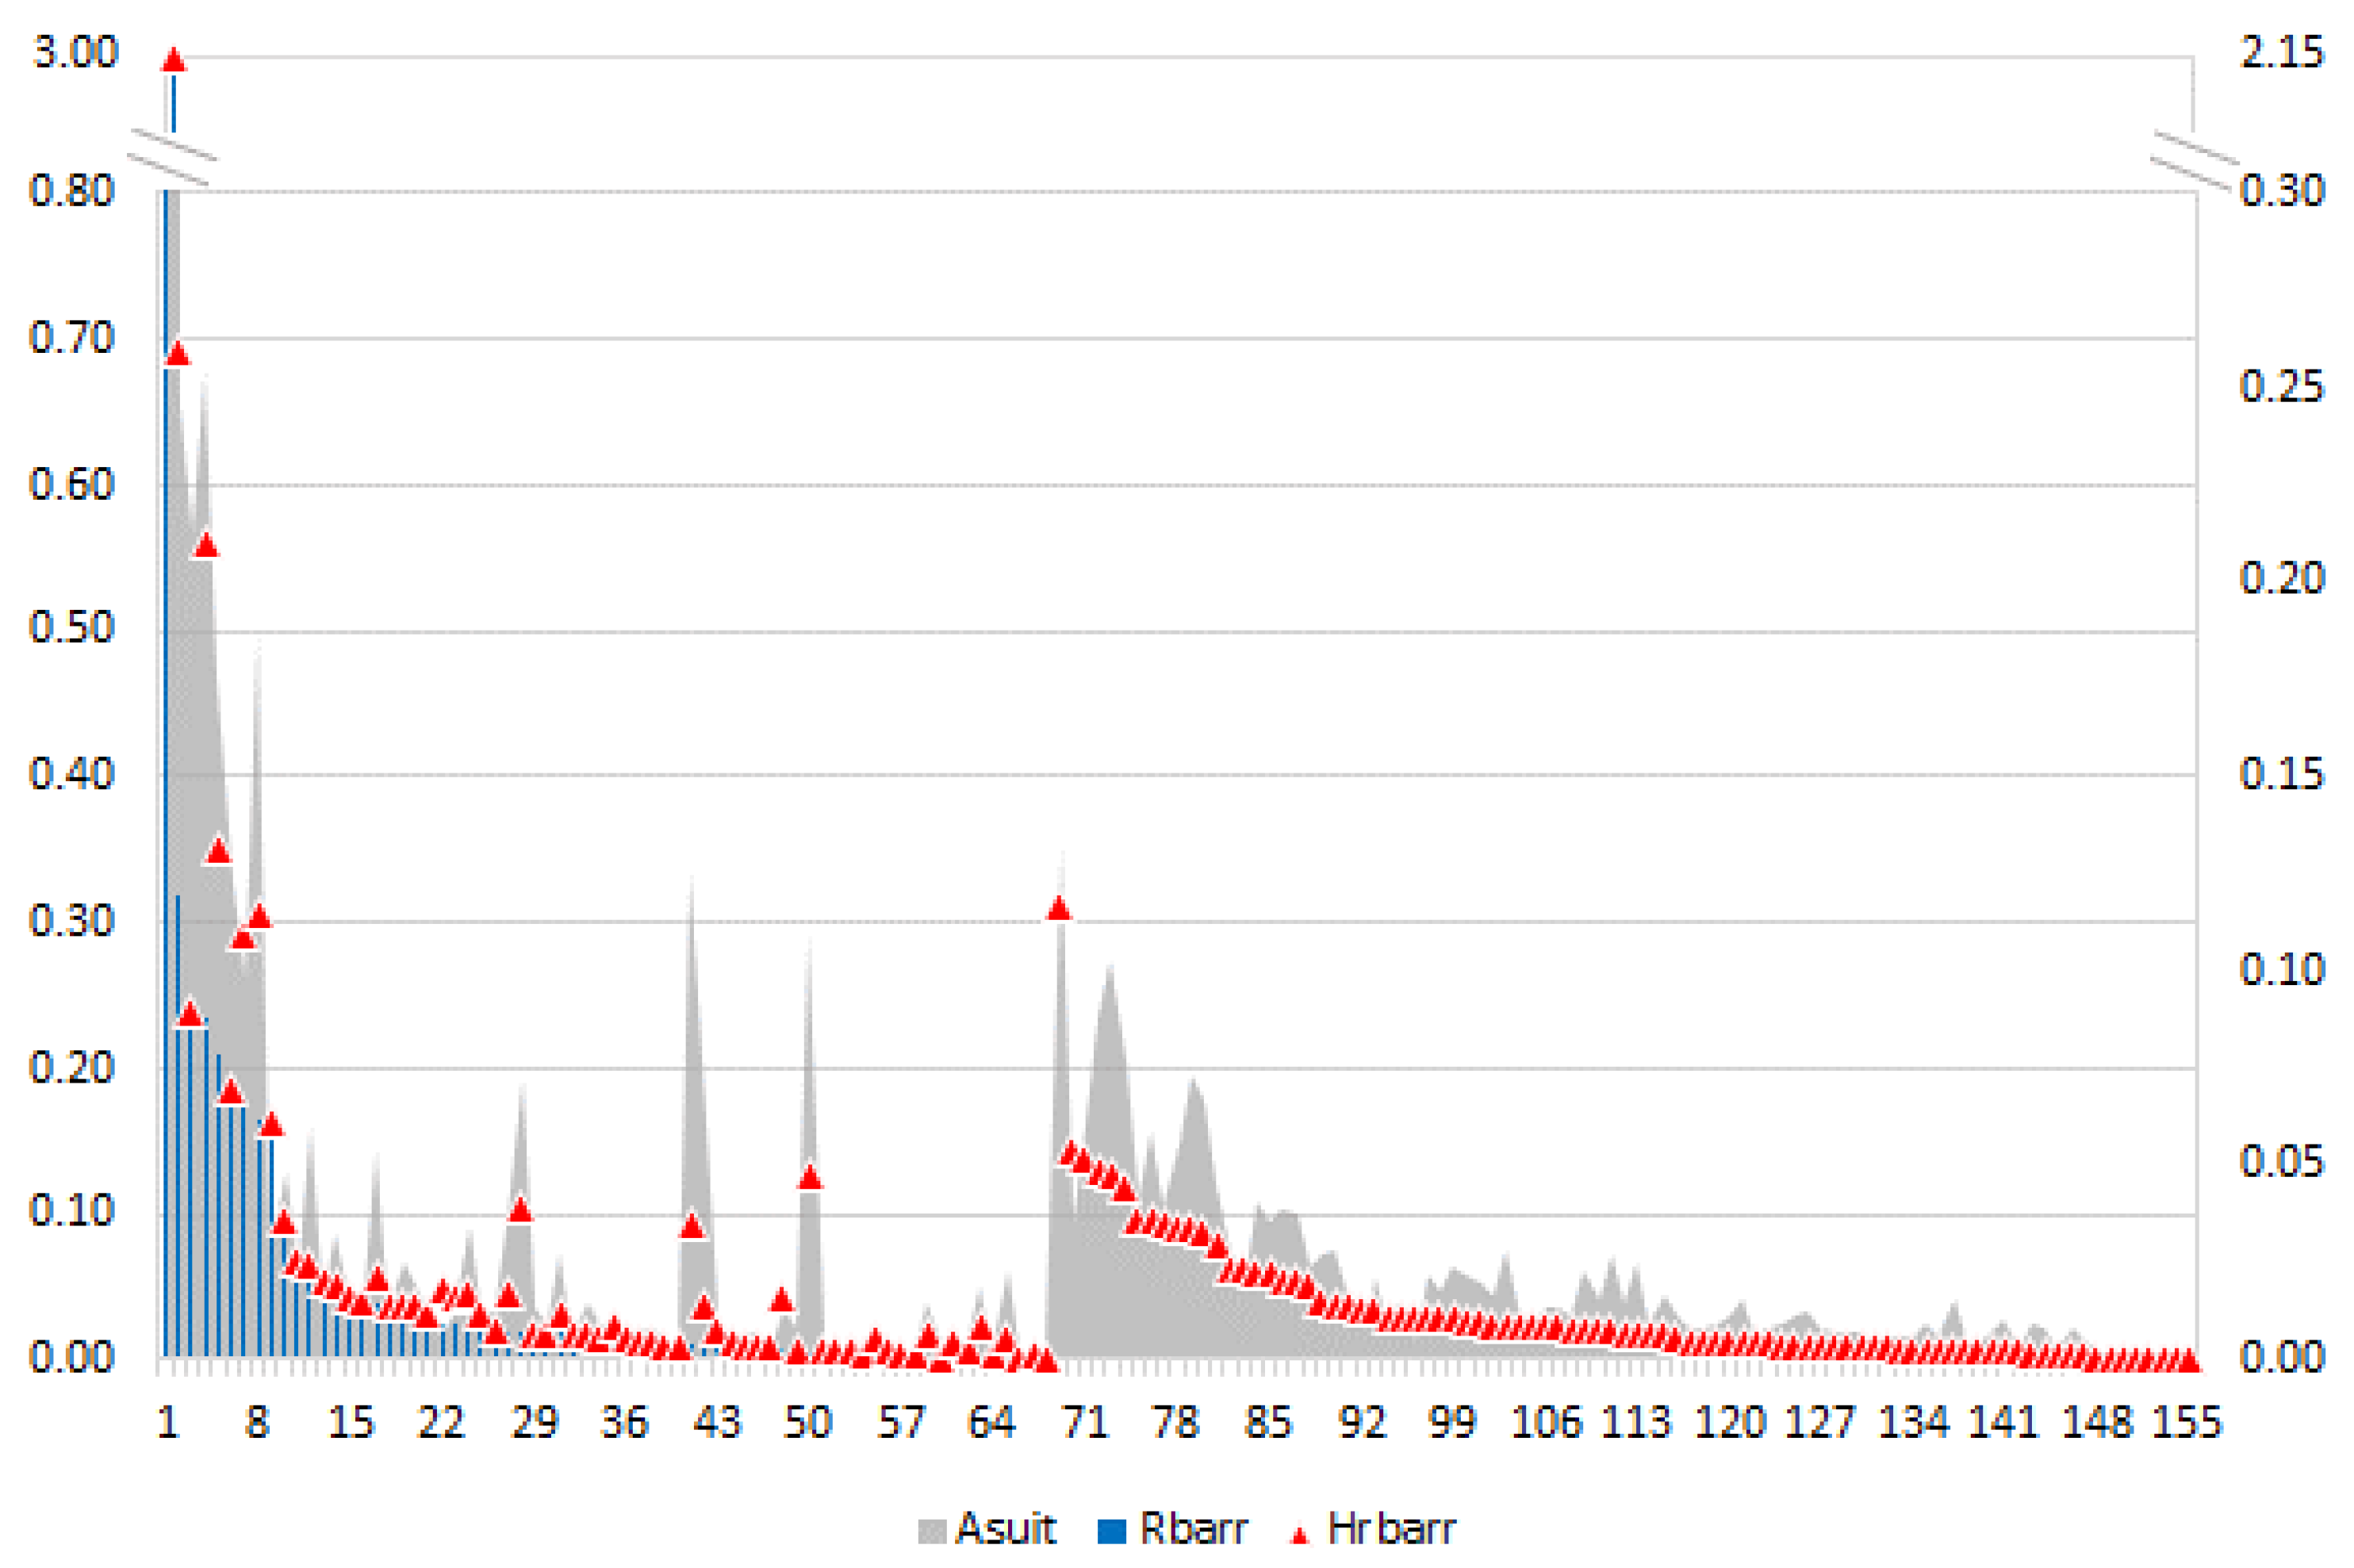
Ranking the barriers according to their relative historical importance identified the dams whose removal would have the greatest effect if the fish migration routes to them were opened (
Figure 3). If ranked by historical importance only, the list of the 15 barriers with the greatest negative impacts would include a further 5 dams that are currently inaccessible to migratory fish. Similarly, if the rivers were grouped according to the sum of the HRbarr
i values of all the barriers in each river, 6 new rivers would appear in the list of the top 15 rivers. Since the current and historical relative effects of dam construction are calculated using the same denominator (Nsp
adulttot
max), the values of Rbarr
i and HRbarr
i in the group of dams accessible to migratory fish are in most cases the same. Rbarr
i values are lower than HRbarr
i only for dams to which anadromous fish migration is partially blocked by a downstream barrier with a fishway and/or a fishway installed on the dam itself. In the group of barriers that are inaccessible to migratory species, all barriers have an Rbarr
i value equal to 0, as their removal under current conditions would have no effect on the abundance of the target migratory species. More details on barriers and ranks are provided in
Table S1.
4. Discussion
Dams are built for social and economic well-being, so the decision on whether to remove a dam or install a fishway is usually based on a cost–benefit assessment and sound reasoning. Simple structural indices, although easy to calculate, only provide a general assessment of river fragmentation, which may not reflect real ecological conditions and often cannot quantify the individual and cumulative impacts of each barrier [
10]. Those potential connectivity metrics that treat longitudinal gradient stream reaches as ecologically equivalent may also misrepresent the ecological importance of the area above the barrier. However, as the aim is to optimise barrier removal to maximise connectivity for target species or taxa [
40], the robustness and ecological significance of connectivity metrics are critical, and the relationship between these metrics and biotic communities should be quantified [
11]. The method described in this paper attempts to quantify the relative importance of each barrier in terms of the potential area and quality of habitat above the barrier, as well as the potential abundance of adult migratory fish, calculated as a proxy for the modelled abundance of juvenile salmonids. The method includes and assesses the cumulative effect of the passability of several consecutive barriers downstream of the barrier of concern. The developed methodology also allows the importance of each barrier to be assessed and evaluated in both a current and historical context, which provides a better understanding of the potential outcomes of barrier removal [
41]. The cumulative effect of several barriers subsequently removed can also be easily assessed by summing their HRbarr
i values or alternatively by summing the modelled potential increase in the number of adults of different species. This allows an easy assessment of how the removal of a downstream barrier, or the installation of a fishway of a given efficiency, would affect the relative importance of the upstream barrier, which is essential for cumulative impact assessment and decision making [
42].
While these aspects are also taken into account in some previously developed methodologies for ranking barriers according to their impacts (e.g., [
16]), the approach described in this paper takes into account additional features specific to lowland rivers. One of these is the possibility to separately assess the importance of river sections currently flooded by dams and the river network above the reservoir. A separate assessment of the flooded river sections and the upstream areas showed that ponds cover almost 19% of the area of habitat suitable for migratory fish in the lowland rivers, which is already equivalent to a medium cumulative impact in terms of habitat loss due to barriers [
43]. This aspect cannot be ignored when choosing between several alternatives, such as removing dams or installing fishways. Installing a fishway but retaining the dam reduces the comparative value of the potentially suitable area above the dam compared to the complete removal of the dam, not only due to the loss associated with the lower passability, but also due to the loss of the potentially suitable habitat area that remains inundated. The separate assessment of the importance of the flooded sections and the river network above the reservoir allows for the evaluation and comparison of the impact on migratory fish of both the complete removal of the dam and the installation of a fishway of one or another efficiency, i.e., the modelling of different scenarios. Another specific issue related to reservoirs in the lowland rivers is the mortality of downstream migrating fish, which may also be important in assessing the benefits of installation of a fishway compared to complete dam removal. In reservoirs of around 100 ha, the mortality of salmonid smolts migrating downstream can be as high as 70% or even 90% due to degraded flow velocity, reduced smolt migration speed and increased predation [
44,
45,
46]. In larger reservoirs, low smolt migration rate and rising water temperature can lead to even higher mortality, thus completely eliminating the impact of fishway installation on salmonid production. Some post-spawning returning adults may also be injured by turbines or otherwise die if there are no adequate protection or guidance measures or if fish passes are not functioning [
47]. Due to a lack of actual data, the mortality of migratory fish in the reservoirs during catadromous migration was not taken into account in the barrier ranking in this work. However, this type of mortality can easily be included in the methodology, as it considers the area inundated by the pond separately from the area of the above-river network.
In lowland areas, the slope of the channel is a factor that enhances reproduction, rather than a limiting factor as in steeper terrains [
14,
48]. With increasing channel slope, the proportion of suitable habitat also increases as well as supports higher densities of juvenile salmonids. For juvenile density, the best fit was obtained by linear regression, while Asuit showed a log-linear dependence. However, in lowland rivers these relationships cannot be exponential either. In the database used to model Asuit and salmonid juvenile abundance, the maximum channel slope reaches 6.8 m/km, but sites with a slope of less than 3 m/km are prevalent, which is a natural phenomenon in lowlands. The available data are likely to reflect the dependence of Asuit and juvenile densities on channel slope only at the scale below the threshold where the slope becomes a limiting factor. Both of these relationships should be unimodal, with different upper limits of the slope for the proportion of suitable area and juvenile density. Therefore, the barrier prioritisation method described in this paper can only be applied to rivers with a gradient of up to 6 m/km, i.e., the maximum gradient in the database used for the construction of the models. Another drawback is that the method was developed using the best-studied salmonids as a proxy, so that abundance estimates for other species are highly uncertain. The abundance estimate for adult salmonids is also uncertain as it has been tested in a limited number of reaches for which annual redd data were available. Although the comparison shows that the modelled abundance of adult salmonids is within ±0.5 standard deviations of the mean, the number of redds does not necessarily correspond to the actual number of spawners [
49]. In addition, the number of spawners can vary considerably due to differences in annual natural and fishing mortality [
25] or differences in hydrothermal regimes between years. However, the systematic error should not affect the results of the dam ranking, as the Rbarr
i metric is based on a comparative assessment using the same denominator. The extrapolation to the number of adults allowed to include in the overall ranking dams located in rivers where salmonids do not spawn due to specific conditions. It also helps to make the ranking more understandable for decision-makers, as the ranking value, which is not always sufficiently informative, is complemented by at least indicative information on potential ecological benefits.
In delineating a river network potentially suitable for migratory fish, barriers in lakes and a large number of barriers in streams with very low or temporary discharges fell outside the coverage. These barriers still lead to significant habitat fragmentation and ecological impacts that have not been assessed. However, the classification of dams in relation to migratory fish has shown that, if based solely on the total length of the river or the area above the dam, the effects of dams may be overestimated or underestimated, as has also been noted in other publications [
50]. Some of the higher-ranked dams prevent fish from migrating to river reaches up to five times shorter in length than the lower-ranked dams, but the area of suitable habitat they provide allows for greater numbers of adults to reproduce and supports higher densities of juveniles. Accordingly, the proportion of suitable habitat in the sections of the larger lowland rivers may be significantly less than in the sections of smaller rivers. Comparisons with historical production prior to dam construction also show that dams that cut off large parts of the catchment may still be among the most negatively impacting ones, even after the installation of fishways. The developed prioritisation framework, which covers all these aspects and allows taking into account the potential loss of migratory fish in flooded areas, provides the basis for a more detailed screening of dam management alternatives.


