Article

Numerical Study of the Hydrodynamic Response of Biodegradable Drifting Fish Aggregating Devices in Regular Waves

1
National Engineering Research Center for Oceanic Fisheries, Key Laboratory of Sustainable Exploitation of Oceanic Fisheries Resources, College of Marine Living Resource Sciences and Management, Shanghai Ocean University, Shanghai 201306, China
2
College of Marine Living Resource Sciences and Management, Shanghai Ocean University, Shanghai 201306, China
3
Business School, Nankai University, Tianjin 300071, China
4
Zhejiang Province Puto Ocean and Fishery Bureau, Zhoushan 316100, China
5
National Engineering Research Center for Oceanic Fisheries, College of Marine Living Resource Sciences and Management, Shanghai Ocean University, Shanghai 201306, China
*
Authors to whom correspondence should be addressed.
Fishes 2024, 9(4), 112; https://doi.org/10.3390/fishes9040112
Submission received: 8 February 2024 / Revised: 16 March 2024 / Accepted: 21 March 2024 / Published: 22 March 2024
(This article belongs to the Section Fishery Economics, Policy, and Management)

Abstract

:
Fish-aggregating devices play a significant role in tuna purse fisheries. The severe marine environment and the large number of non-biodegradable fish-aggregating devices impact structural safety and cause marine litter. Therefore, hydrodynamic performance and the use of biodegradable materials are crucial issues for ensuring the sustainability of fish-aggregating devices. In this study, a type of virtual biodegradable drifting fish-aggregating device (Bio-DFAD) was designed. Numerical simulations were conducted to investigate the motion responses and relative velocities of Bio-DFADs in regular waves (first- and fifth-order waves). The numerical model was applied based on unsteady Reynolds-averaged Navier–Stokes equations with the realizable k–ε model. For different scenarios of modeling, various conditions were modeled, including the relative length, wave steepness, and diameter of the balsa wood, to analyze their effects on the hydrodynamic response of the Bio-DFADs. The results indicated that the increased relative length, wave steepness, and diameter of balsa wood had a significant influence on the motion response amplitude operators (RAOs) and relative velocity of Bio-DFADs. The results suggested that a relative length (LF/B = 1.5) and smaller diameter (DF = 30 mm) were recommended for fewer motion responses and relative velocity. The obtained results provide insight for practical engineering applications of the hydrodynamic design of Bio-DFADs.
Key Contribution: The hydrodynamic performance of biodegradable drifting fish-aggregating devices (Bio-DFADs) subjected to first-order waves and fifth-order waves has been studied. An accurate wave-forcing method to estimate wave elevation has been developed and validated using new data. The relative length, wave steepness, and diameter of balsa wood have a great effect on the hydrodynamic response of DFADs. The results provide guidance for the hydrodynamic design of DFADs.

1. Introduction

Fish-aggregating devices are deployed by tropical tuna purse seine vessels to aggregate tuna and other species and facilitate their capture in pelagic oceans [1,2,3]. Tuna catches reach 4.6 million tons, with a landed value of USD 12.2 billion, serving as a vital food and trade revenue source for both developed and developing countries. However, improving the management of drifting fish-aggregating devices (DFADs) poses unique challenges [2]. Globally, approximately 4.8 million tons of tuna were caught in 2021, and approximately 36% of the catch was derived from the sets of purse seining on DFADs [4]. DFADs are extensively utilized, and it is estimated that more than 100,000 DFADs are deployed annually [5,6]. DFADs can freely drift in the ocean and are typically made of a raft (to ensure buoyancy) and a submerged substructure to slow down the drifting speed and provide shade, both of which are considered helpful for improving tuna aggregation. Currently, DFADs are essential auxiliary equipment for tuna purse seine fishing.
However, traditional DFADs are mainly made of non-biodegradable materials (e.g., plastic buoys, nets, nylon or polypropylene ropes, and metals), which slowly decay and contribute significantly to marine litter and impact the marine ecosystems [7,8,9,10,11]. Hence, since 2024, the tuna Regional Fishery Management Organizations (tRFMOs) mandates tuna purse seine fleets to predominantly employ biodegradable materials and completely non-entangling dFADs (without using netting material in any component) during fishing operations, with a sense of urgency regarding the timeline [12]. Moreover, because DFADs remain in seawater offshore for long periods, their structural integrity is affected by various factors (e.g., waves, currents, wind, and biofouling) in harsh marine environments. Excessive motion of DFADs can increase the loads on the connection between the raft and the submerged structure and may cause structural destruction, which can threaten the structural integrity of DFADs. The motion responses of the DFADs were mainly affected by waves, especially wave height and wave period [13].
Thus, investigating the hydrodynamic performance of DFADs in waves is important. Recently, several studies have investigated the hydrodynamic characteristics of DFADs in waves. Wan et al. [13] experimentally and numerically investigated the heave and pitch motions of DFADs with biodegradable bamboo and cotton ropes in waves. They concluded that the relative length, wave steepness, cover object, and hanging object significantly influenced the motion responses of DFADs. Rahmawati et al. [14] proposed a new type of FAD with a current turbine to study the characteristics of the fluid force on FADs in wave-current conditions, and the results indicated that surge, sway, and heave motion can be reduced significantly. Du et al. [15] evaluated the interactions between waves and a flexible piezoelectric device attached to the FAD by theoretical and computational analyses, conducted the test under real sea conditions, and revealed the effect of deformation, the strain rate, and output voltage of the device under waves. Overall, previous studies have used this structure as auxiliary equipment and not as the main object. However, the hydrodynamic response of DFADs to wave loads had merely been investigated.
A previous study revealed that the hydrodynamic response of DFADs is more susceptible to the relative length, wave steepness, and wave period (only heave and pitch motions were considered) [13]. Therefore, studying the hydrodynamic response of drift-free DFADs in waves would be helpful for practical engineering applications. Compared to experimental tests, numerical simulations can be performed under various conditions with high efficiency and cost savings [16]. Therefore, numerical simulations using computational fluid dynamics (CFD) were selected to analyze the hydrodynamic response of DFADs.
The primary focus of this study is to assess the difference in the hydrodynamic motion response of Bio-DFADs under different wave conditions, with the aim of evaluating the difference in motion tendency between the first- and fifth-order waves. As an extension of our previous work [13], in this study, Bio-DFADs were designed using biodegradable material, specifically balsa wood. Compared with the traditional raft material, balsa wood has greater buoyancy, lower density, and sufficient strength and hardness to prevent damage and sinking and could be the better biodegradable alternative identified [17]. The relevant international fisheries management organizations currently require DFADs to be made of low-entanglement structures, specifically prohibiting the use of nets; however, they do not require DFADs to be composed entirely of biodegradable materials [12]. Considering the necessity to ensure sufficient buoyancy of the DFADs and prevent potential marine pollution from sinking, this study follows the conventional approach of using floating buoys to provide buoyancy. The hydrodynamic responses, including heave, pitch, and surge motions, of Bio-DFADs with different lengths and diameters were investigated by numerical simulation. The aim of this study is not only to propose a relationship between the shape of Bio-DFADs and the wave conditions but also to provide insights for practical engineering applications of the Bio-DFADs structure design and stability assessment and lay a theoretical foundation for designing safer, more stable, and eco-friendly DFADs, in line with the requirements of relevant international fisheries organizations regarding DFADs, and also improving the efficiency of tuna purse seine fisheries.

2. Methodology

To improve the stability, different types of Bio-DFADs were tested under different wave conditions to determine the motion response tendency. However, to provide insights into Bio-DFADs engineering applications, the dominant influencing factors should be considered. For this purpose, the motion responses of the Bio-DFADs in the first-order wave were compared with those in the fifth-order wave. In this study, the effects of wave conditions (i.e., wave height, wavelength, wave steepness, and wave type) and the shape of the Bio-DFADs (i.e., length, width, diameter of balsa wood, and length of rope) on the motion responses were tested. The aim is to provide guidance that can be used to design Bio-DFADs and apply Bio-DFADs to supplement the actual production operations of the tuna purse seine fishery.

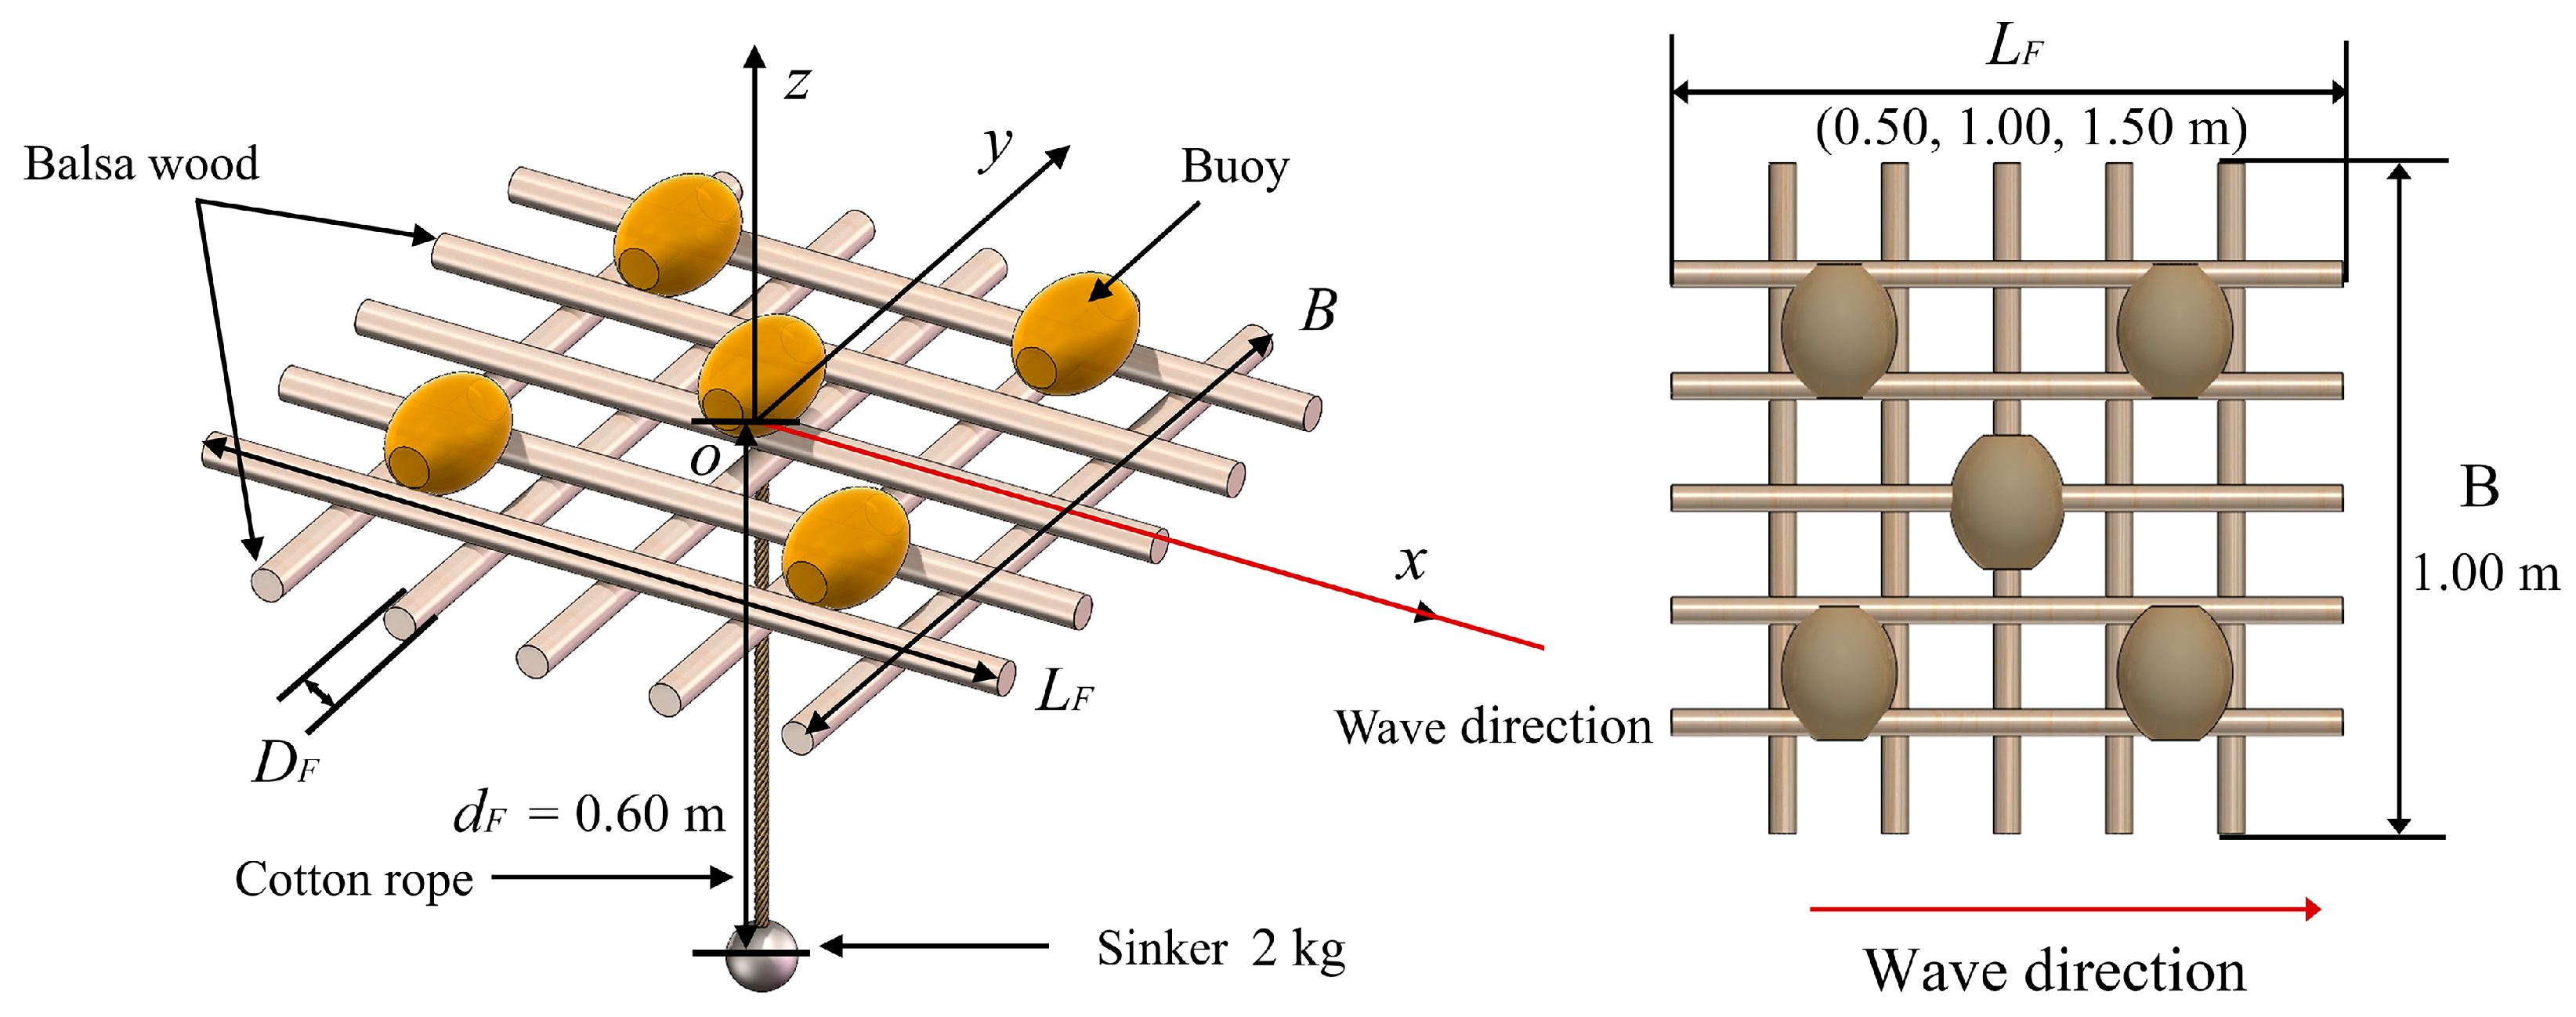
2.1. Description of Bio-DFADs

In this study, a three-dimensional Bio-DFAD with a scale ratio of 1:3 was adopted as the objective model. The Bio-DFADs and their main characteristics are shown in Figure 1 and Table 1. As shown in Figure 1, the Bio-DFAD has three components: a raft, a rope, and a sinker. A balsa wood raft comprises upper and lower balsa wood layers, which are perpendicular to each other and equally distributed. The lower layer was perpendicular to the direction of wave propagation. The lengths of the Bio-DFADs, LF, were selected to be 0.50, 1.00, and 1.50 m, respectively. The width of the Bio-DFADs, B, was a fixed value, 1.00 m. There were six diameters of balsa wood, DF, 0.03, 0.04, 0.05, 0.06, 0.07, and 0.08 m, respectively. The balsa wood rafts were designed to be more eco-friendly and have been employed in oceans [18]. Five buoys were fixed on the raft: one of the buoys was fixed on the center of the upper balsa wood, while the other four buoys were fixed on each of the four outermost frames formed by the upper and lower balsa wood layers. This arrangement, shown in Figure 1, ensures that the Bio-DFADs have enough buoyancy to prevent sinking. The balsa wood raft and sphere iron sinker were connected using a cotton rope. One end of the rope was attached at the center of the upper balsa wood layer, and the other end was connected with the center of the sphere iron sinker. The length of the cotton rope, dF, was 0.60 m long, and the sinker weighed 2.00 kg. The width of the Bio-DFADs, B, was fixed, and three structural lengths, LF, were designed. The details of the Bio-DFADs are listed in Table 2. The buoyancy of each experimental Bio-DFADs model is listed in Table 3, and obviously, the designed structures have sufficient buoyancy. The experiments were performed for each model.

2.2. Wave Conditions

According to the data from the tuna purse seine fleets, nine different wave conditions were selected for the numerical simulations, as listed in Table 4. Regarding the wave conditions, the wave period, T, and wave height, H, ranged from 1.5 to 2.5 s and 0.10 to 0.20 m, respectively. The water depth was 1.0 m. The investigated wave conditions were first-order (first) and fifth-order (fifth) waves. The first was modeled using a first-order approximation of the Stokes theory of waves. The fifth was modeled with a fifth-order approximation to the Stokes theory of waves and more closely resembles a real wave compared to the first.

2.3. Numerical Model

2.3.1. Governing Equations and Turbulence Model

In this study, the CFD software STAR-CCM+ v.14.02 was used to calculate the hydrodynamic characteristics of Bio-DFADs in regular waves. The unsteady Reynolds-averaged Navier–Stokes equation is applied to solve the governing equations. The continuity and momentum equations for the unsteady incompressible flows are as follows [19]:
  • Continuity equation:
ρ u i ¯ x i = 0
  • Momentum equation:
ρ u ¯ i t + x j ρ u i u j ¯ + ρ u i u j ¯ = P ¯ x i + τ ¯ i j x j ,
where ρ is the fluid density, P ¯ is the mean pressure, u i ¯ is the average velocity vector, τ i j ¯ is the mean viscous stress tensor components, and ρ u i u j ¯ is the Reynolds stress, which can be expressed as follows:
τ ¯ i j = μ u i ¯ x j + u j ¯ x i
ρ u i u j ¯ = μ t u i ¯ x j + u j ¯ x i + 2 3 ρ k + μ t u k ¯ x k δ i j ,
where μ is the dynamic viscosity, μ t is the turbulent eddy viscosity, κ is turbulent kinetic energy, and δij is the Kronecker delta. The Reynolds stress represents the influence of turbulence fluctuations on the mean flow field and is modeled using a nonlinear eddy viscosity model [20]. The finite-volume method (FVM) was applied to discretize the integral formulation of the governing equations and calculate the fluid flow. The governing equations are solved in a segregated manner using a predictor–corrector algorithm. A second-order upwind scheme was applied to the convection scheme, and second-order temporal discretization was used for the momentum equations. Implicit coupling between the pressure and the velocity was achieved using the semi-implicit method for pressure-linked equations (SIMPLE).

2.3.2. Turbulence Model

The realizable k–ε model with the two-layer approach and all y+ wall treatments was employed for solving the governing equations. The transportation equations for kinetic energy k and turbulent dissipation rate ε can be expressed as follows:
  • k equation:
t ρ k + · ρ k v ¯ = · μ + μ t σ k k + P k ρ ε ε 0 + S k
  • ε equation:
t ρ ε + · ρ ε v ¯ = · μ + μ t σ ε ε + 1 T e C ε 1 P ε C ε 2 f 2 ρ ε T e ε 0 T 0 + S ε
where v ¯ is the mean velocity; σk, σε, Cε1, and Cε2 are constants (model coefficients); Pk and Pε are production terms; Te is the large-eddy time scale; and ƒ2 is a damping function. Sk and Sε are the user-specified source terms. Cε1 = 1.44, Cε2 = 1.92, σk = 1.00, and σε = 1.30 [20,21].
The volume-of-fluid (VOF) model with the Eulerian multiphase, proposed by Hirt and Nichols (1981) [22], was applied to define the free surface (air–water interface). It is noted that for tracking sharp interfaces, the high-resolution interface capturing scheme was designed to mimic the convective transportation between immiscible fluid components [23].

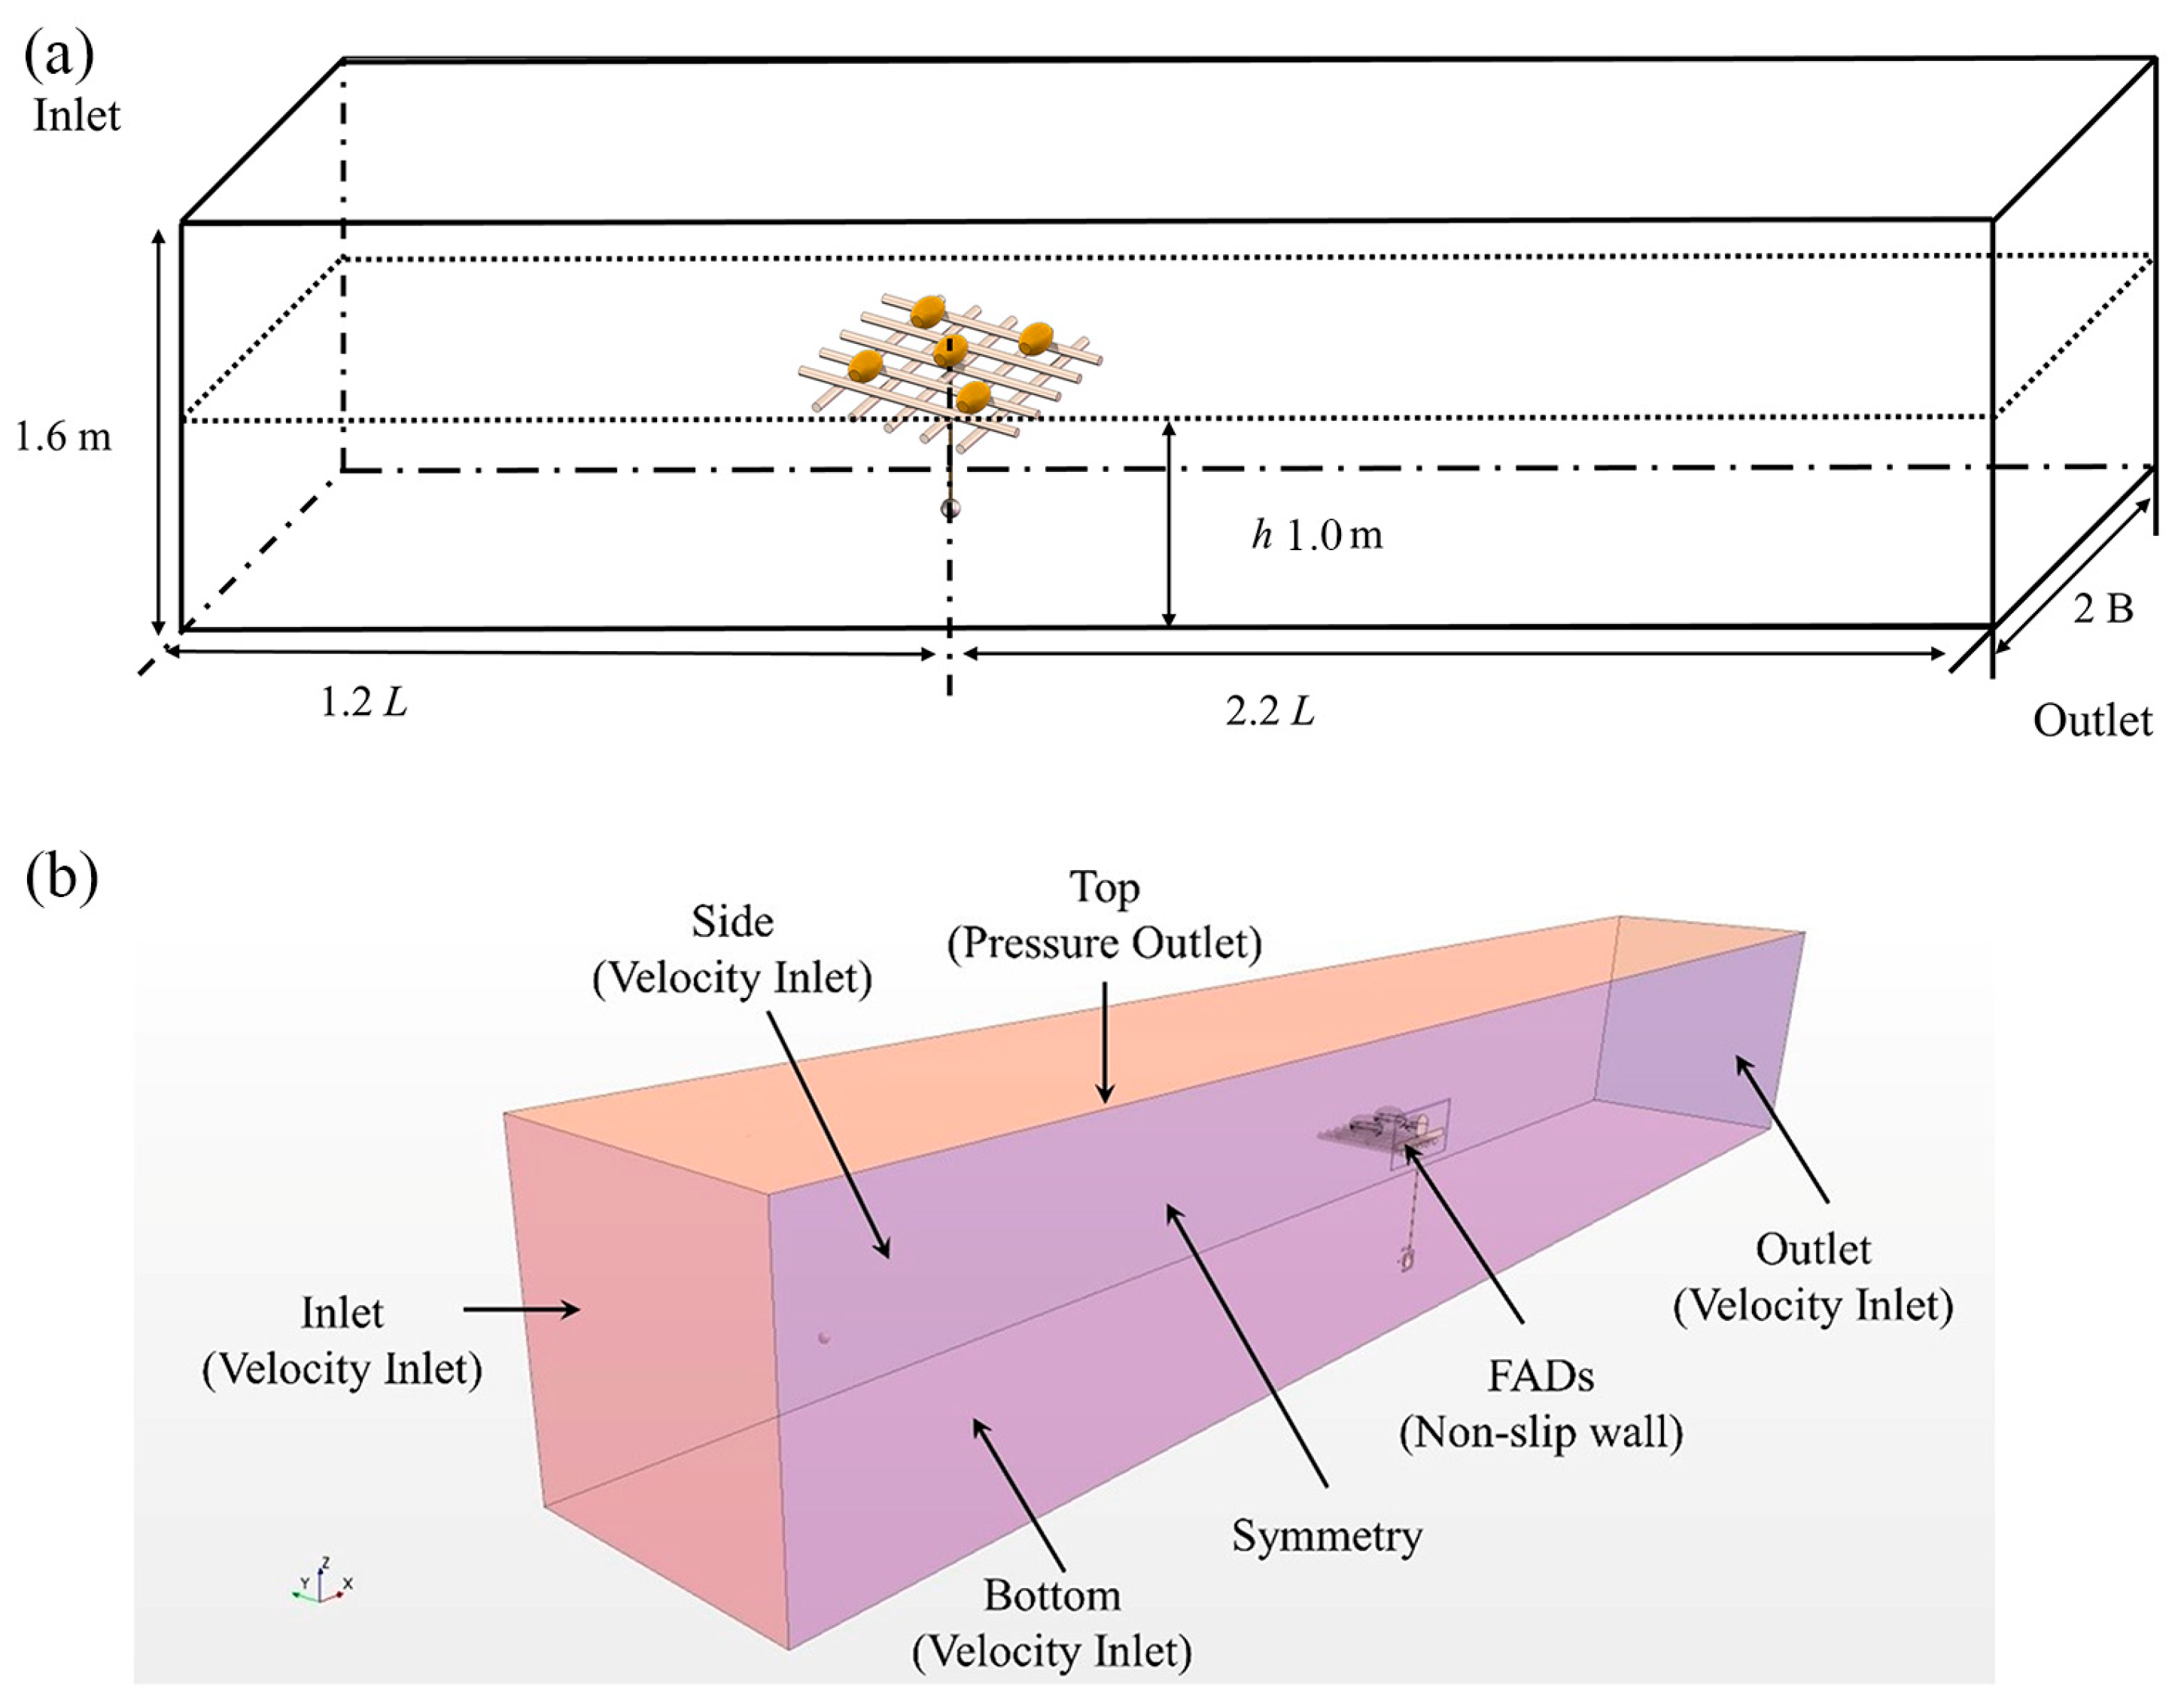
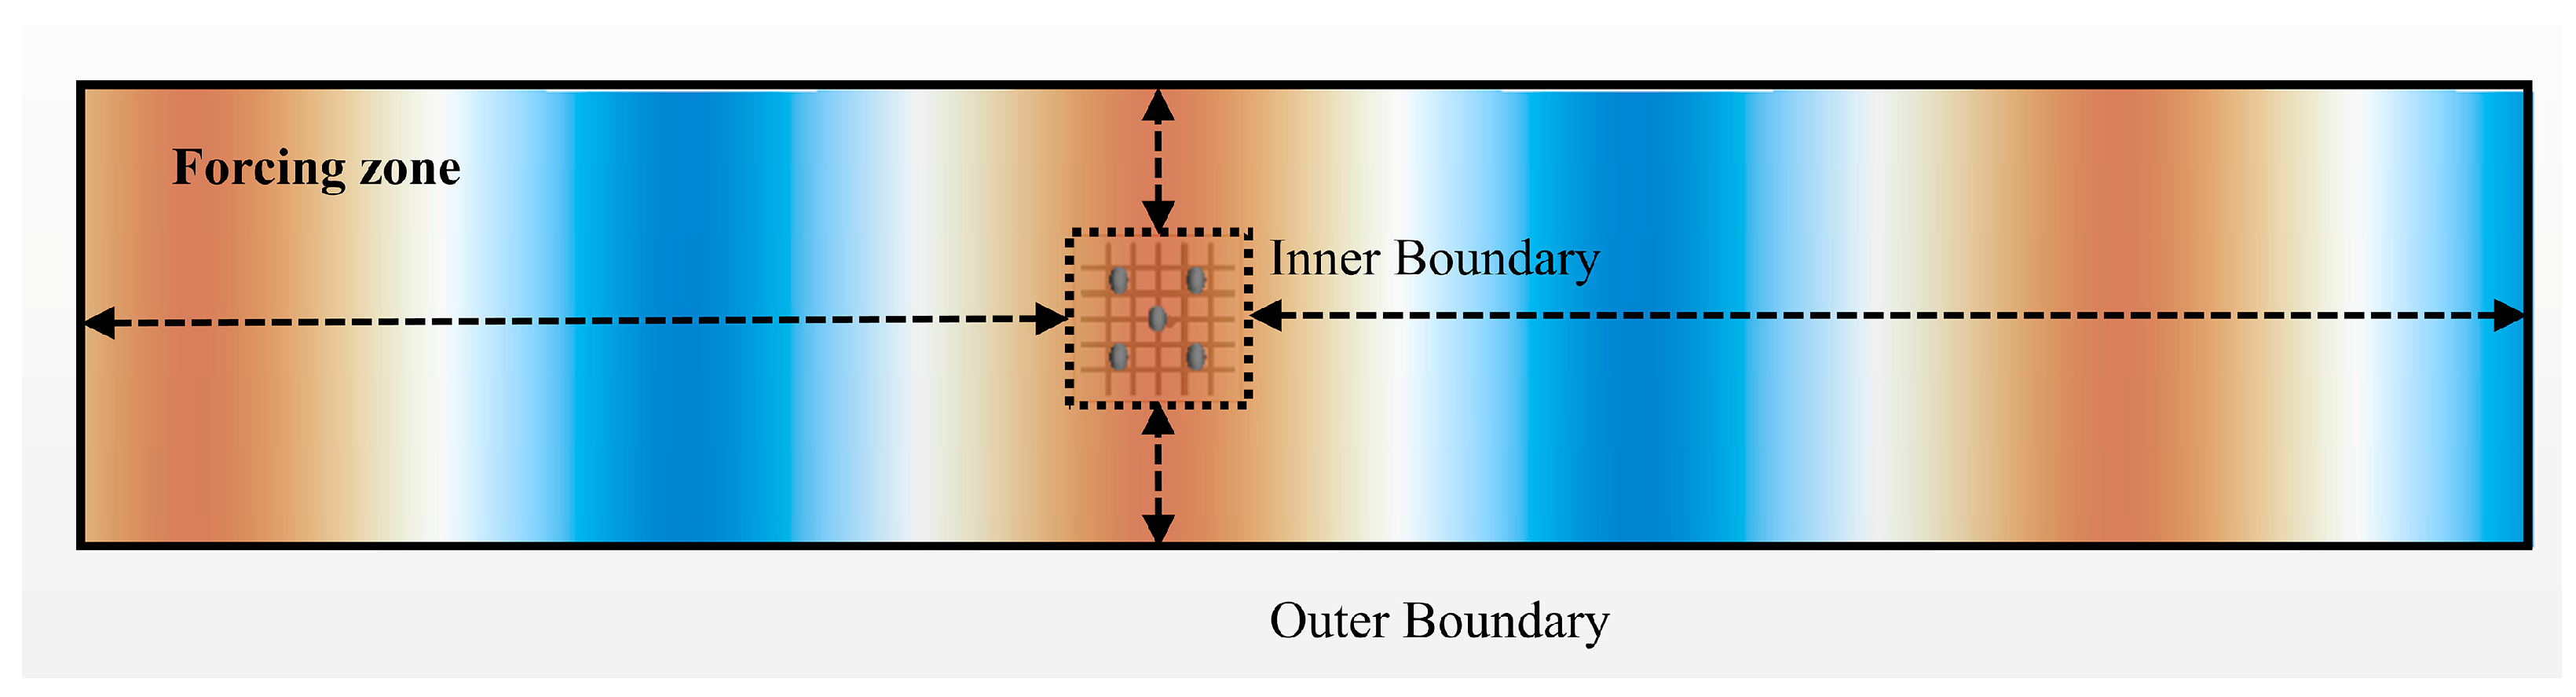
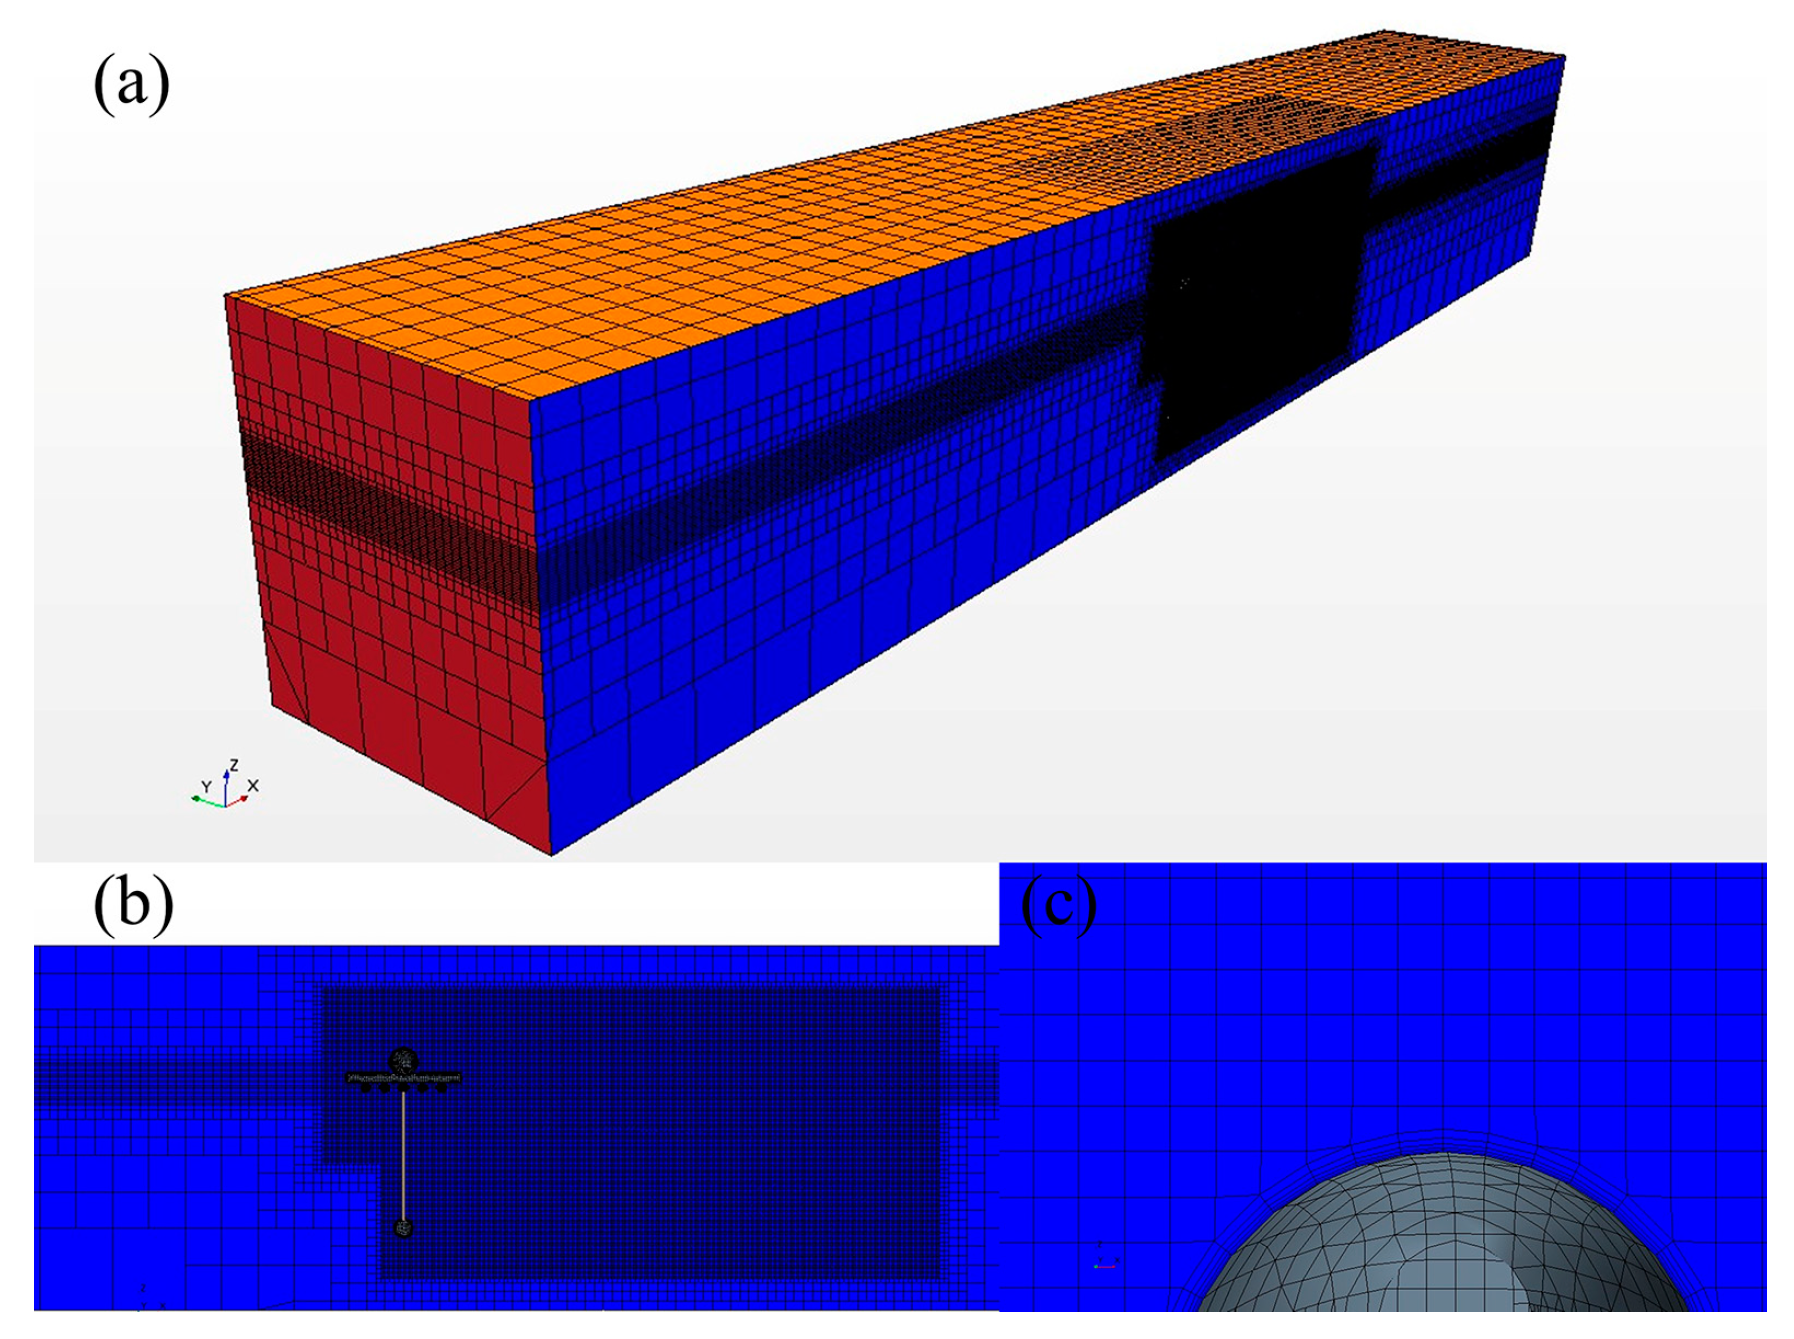
2.3.3. Computational Domain and Boundary Conditions

Figure 2 shows the computational domain and boundary conditions. A three-dimensional wave tank was designed in similar studies [12]. The inflow properties were analyzed based on first- and fifth-order wave models [24]. Based on the Cartesian coordinate system, the center of the coordinate system coincides with the center position of the raft of the Bio-DFADs model. To reduce computational resources, a half model of the Bio-DFADs was employed. As shown in Figure 1 and Figure 2, the x–z plane is the symmetry boundary. The inlet, outlet, side, and bottom boundary conditions were defined as the velocity inlet, whereas the top boundary condition was selected as the pressure outlet. A no-slip wall-type boundary condition was applied to the surface of the Bio-DFADs. For the size of the computational domain, the bottom boundary was 0.80 m away from the center, i.e., the water depth was 1.0 m. Height was defined as twice the depth of water, 1.6 m. The Bio-DFADs were set at a distance of 1.2 L from the inlet boundary and 2.2 L away from the outlet boundary. In the numerical simulation, the width of the computational domain was set to twice that of the Bio-DFAD, 2B.
A 6-DOF solver, dynamic fluid body interaction, was applied to capture the motion responses, hydrodynamic forces, and moments acting on the Bio-DFAD. In the numerical simulation, the Bio-DFADs had 3 DOFs (heave, pitch, and surge). The sway, roll, and yaw motions were constrained. The Bio-DFADs were moved according to the 3-DOF equations.
  • Translate equation:
m d v d t = f
  • Rotate equation:
M d ω d t + ω × M ω = n ,
where m is the mass of the body, f is the resultant force acting on the body, and v is the velocity of the center of mass. M is the tensor of the moment of inertia, ω is the angular velocity of the rigid body, and n is the resultant moment acting on the rigid body. The model’s response amplitude operator (RAO) was calculated based on the acquired motion response. The RAO is the ratio of the amplitude of the motion to the amplitude of the incident wave.
In this study, a dynamic overset mesh technique is applied to the computational domain. The overset method was used to capture the complex Bio-DFAD motions in regular waves. The raft and sinker were connected using a catenary. The catenary coupling method was applied to model an elastic quasi-stationary catenary.
However, the effect of the waves reflected from the boundary on the computational domain cannot be ignored. Many scholars have focused on this issue [25,26,27,28,29,30,31]. In this study, based on the Euler overlay method (EOM) proposed by Kim et al. [27], the VOF wave-forcing method was applied to numerical simulations for wave generation. The VOF wave-forcing method was employed for the inlet, outlet, and side boundary conditions.
Figure 3 shows a schematic of the EOM-based wave-forcing zone between the inner and outer boundaries. Wave forcing is employed for momentum and is achieved by adding the source term to the transportation equations as follows:
q ϕ = γ ρ ϕ ϕ *
where γ is the forcing coefficient, ρ is the fluid density, Φ is the current solution of the transportation equation, and Φ* is the value towards which the solution is forced.

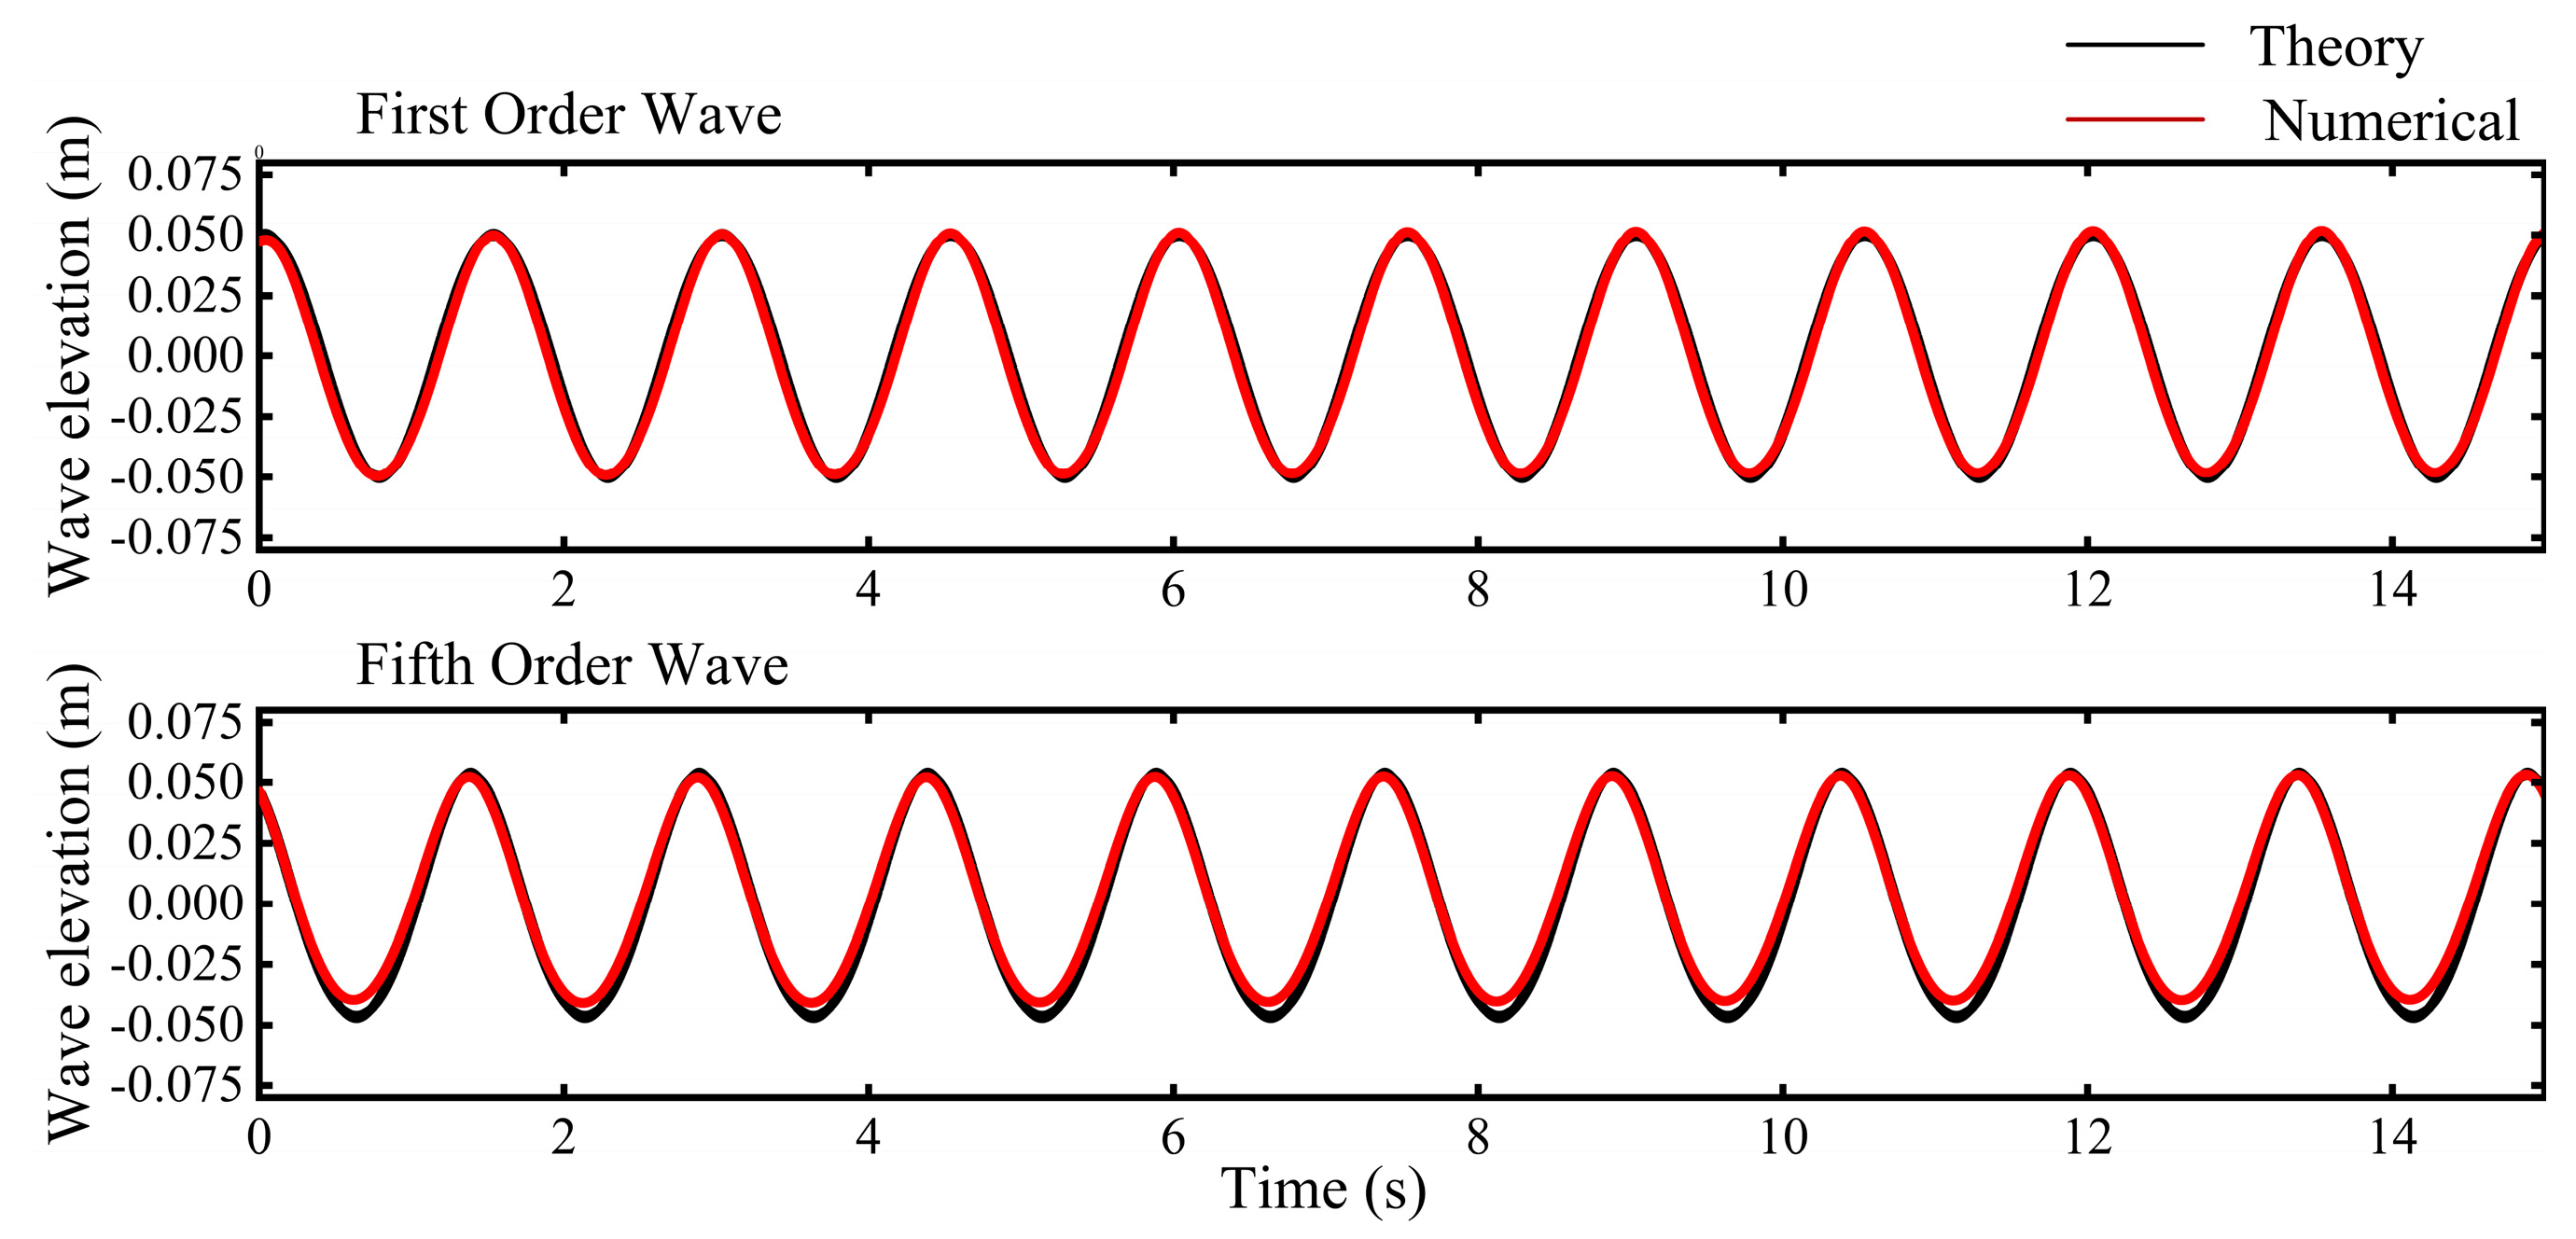
2.4. Verification of the Numerical Model

It is essential to evaluate the precision of numerical results by conducting a verification analysis. In this section, the influence of the mesh number within the range of the wave height and wavelength and the time step on the numerical simulation results is analyzed. The time step and mesh size were analyzed to guarantee the convergence and accuracy of the numerical calculations. The precision of wave elevation was selected as the main index of the verification of the numerical model (e.g., T = 2.0 s, H = 0.20 m). Six wave elevation monitors were set 1, 2, 3, 4, 5, and 6 m from the inlet boundary.

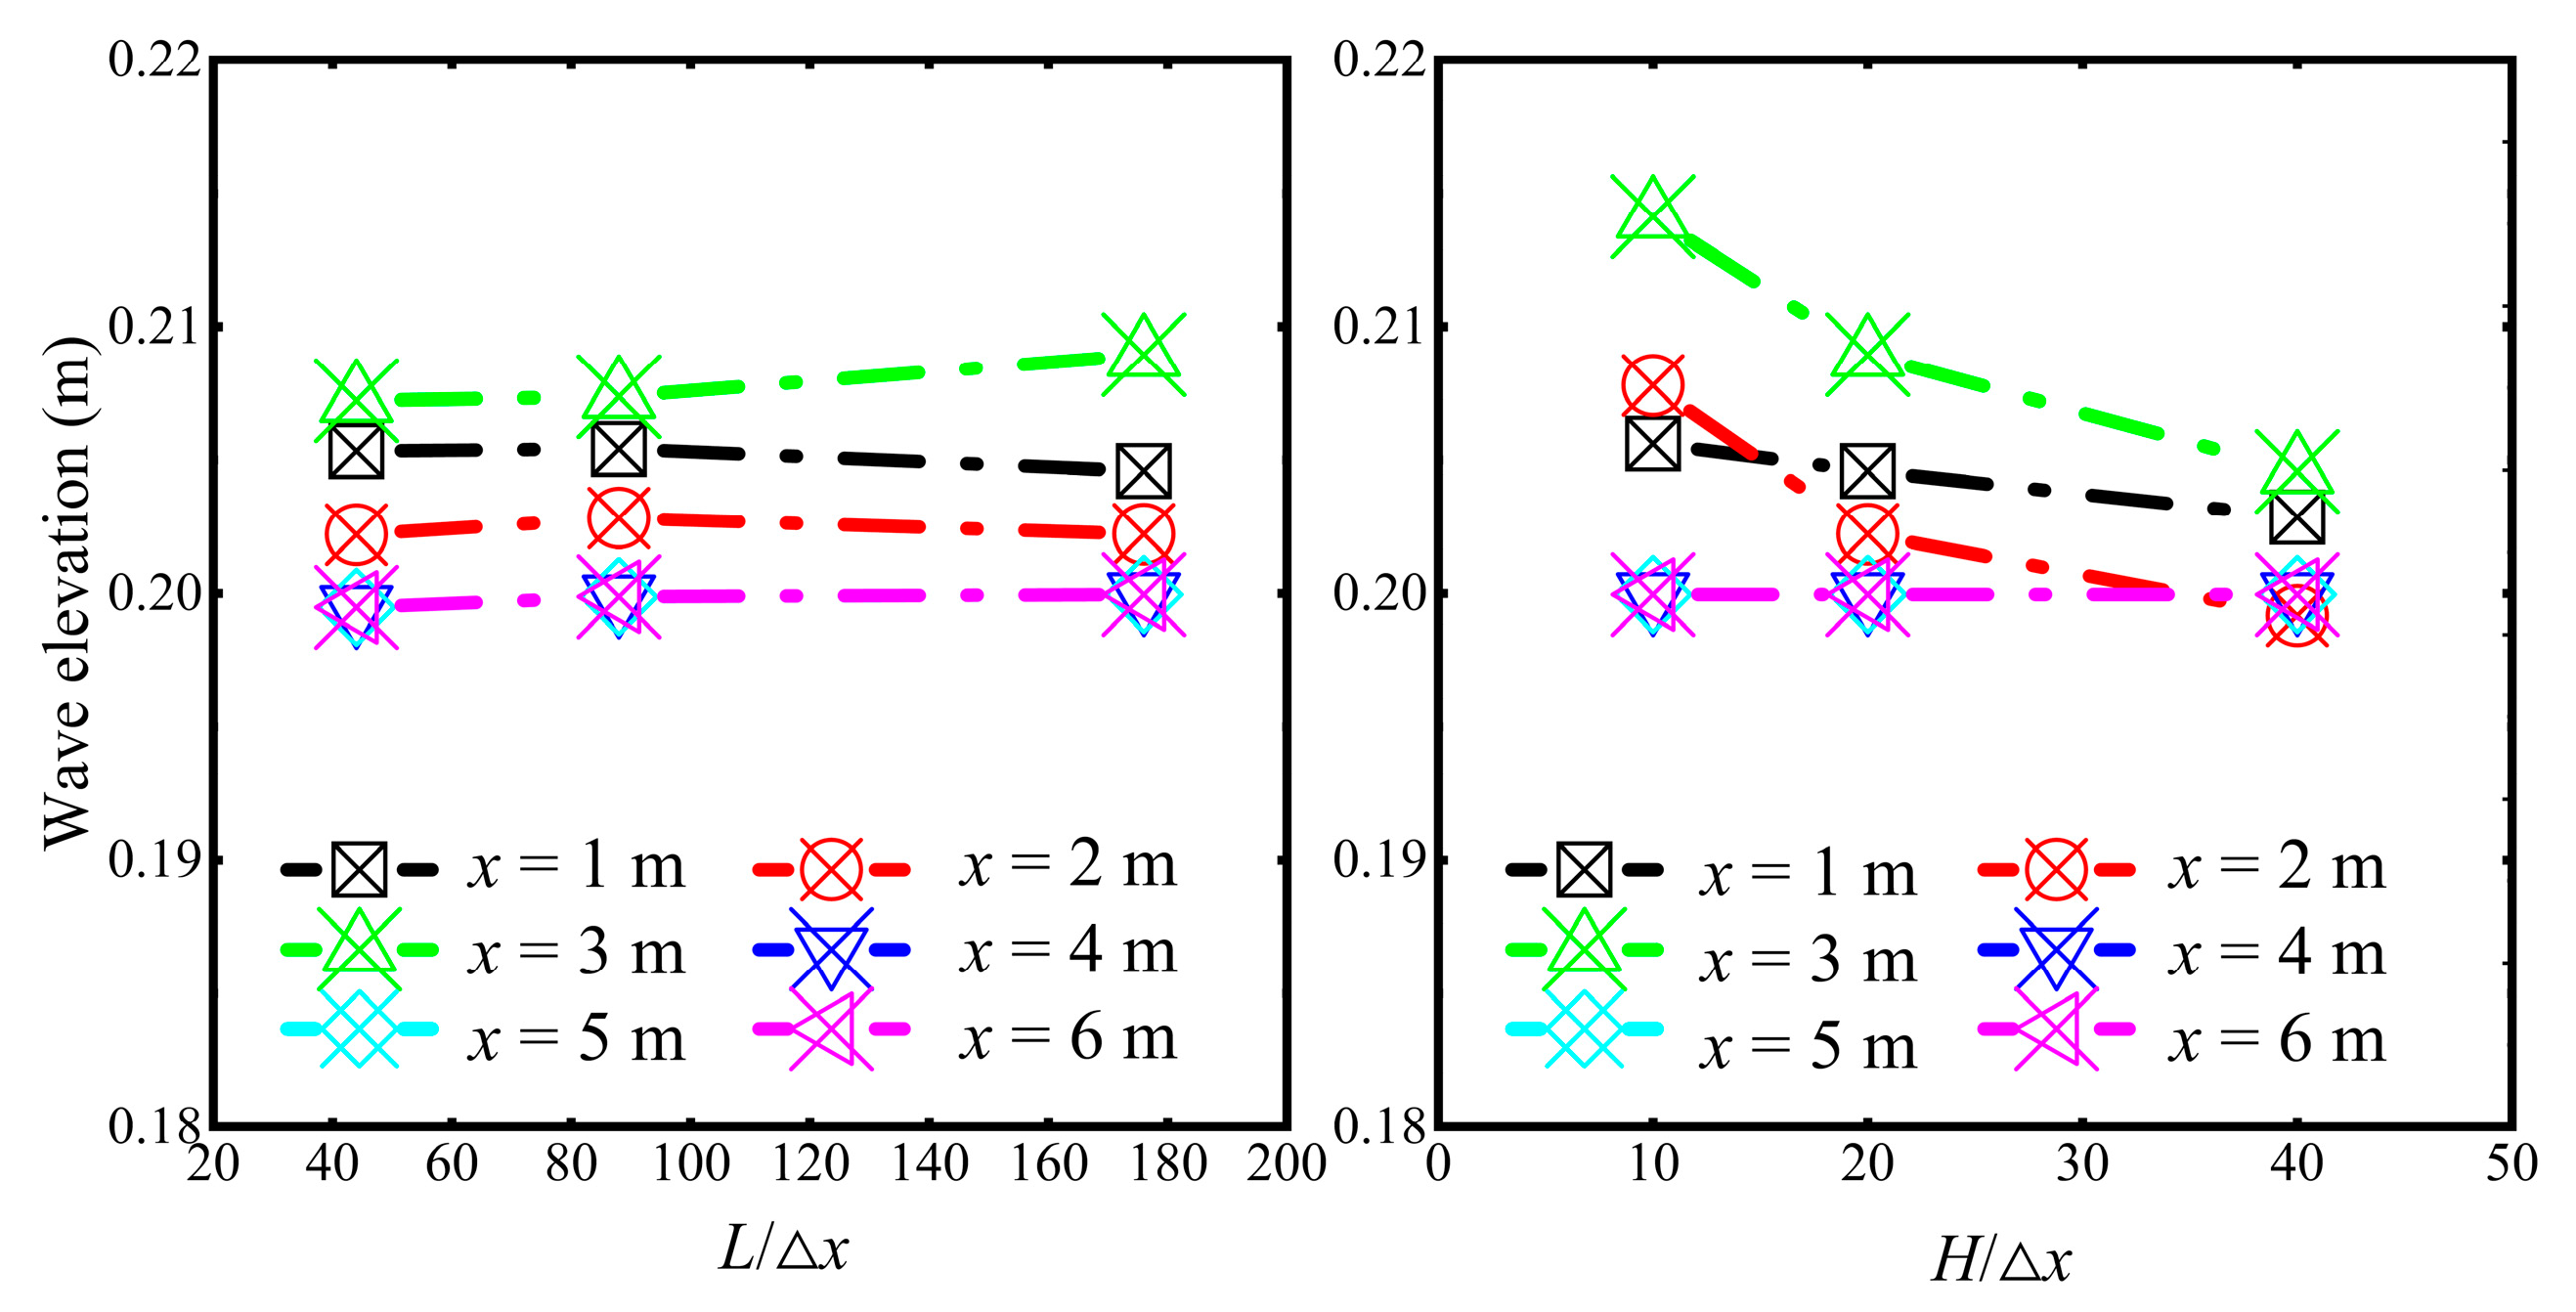
2.4.1. Mesh Sensitivity Analysis

To investigate the influence of the cell number within the range of the per-wave height and wavelength of the numerical model on the results, different mesh sizes were set for the computational domain. The mesh parameters are listed in Table 5. For these different cell numbers in the wave region, the base size (0.64 m) in the computational domain and time step (0.005 s) were used and maintained constant.
As shown in Figure 4, when the time step was 0.005, the mesh size scale L/Δx = 88 in the direction of wave propagation, and H/Δx = 20 in the vertical range of the free surface; the numerical simulation obtained a high accuracy and efficiency (Δx, the mesh size in x direction). Generally, compared with the cell number of the mesh N per wave height of 10 and 40, the cell number N = 20 provides similar results to the cell number N = 10 and shows a higher efficiency than the cell number N = 40. For the cell numbers N per wavelength of 44 and 176, the cell number N = 88 provided similar results to the cell number N = 176 and showed higher efficiency than the cell number N = 44. Therefore, when the cell numbers per wave height and the wavelength were 20 and 88, respectively, the numerical simulation had a lower calculation cost and a higher efficiency.

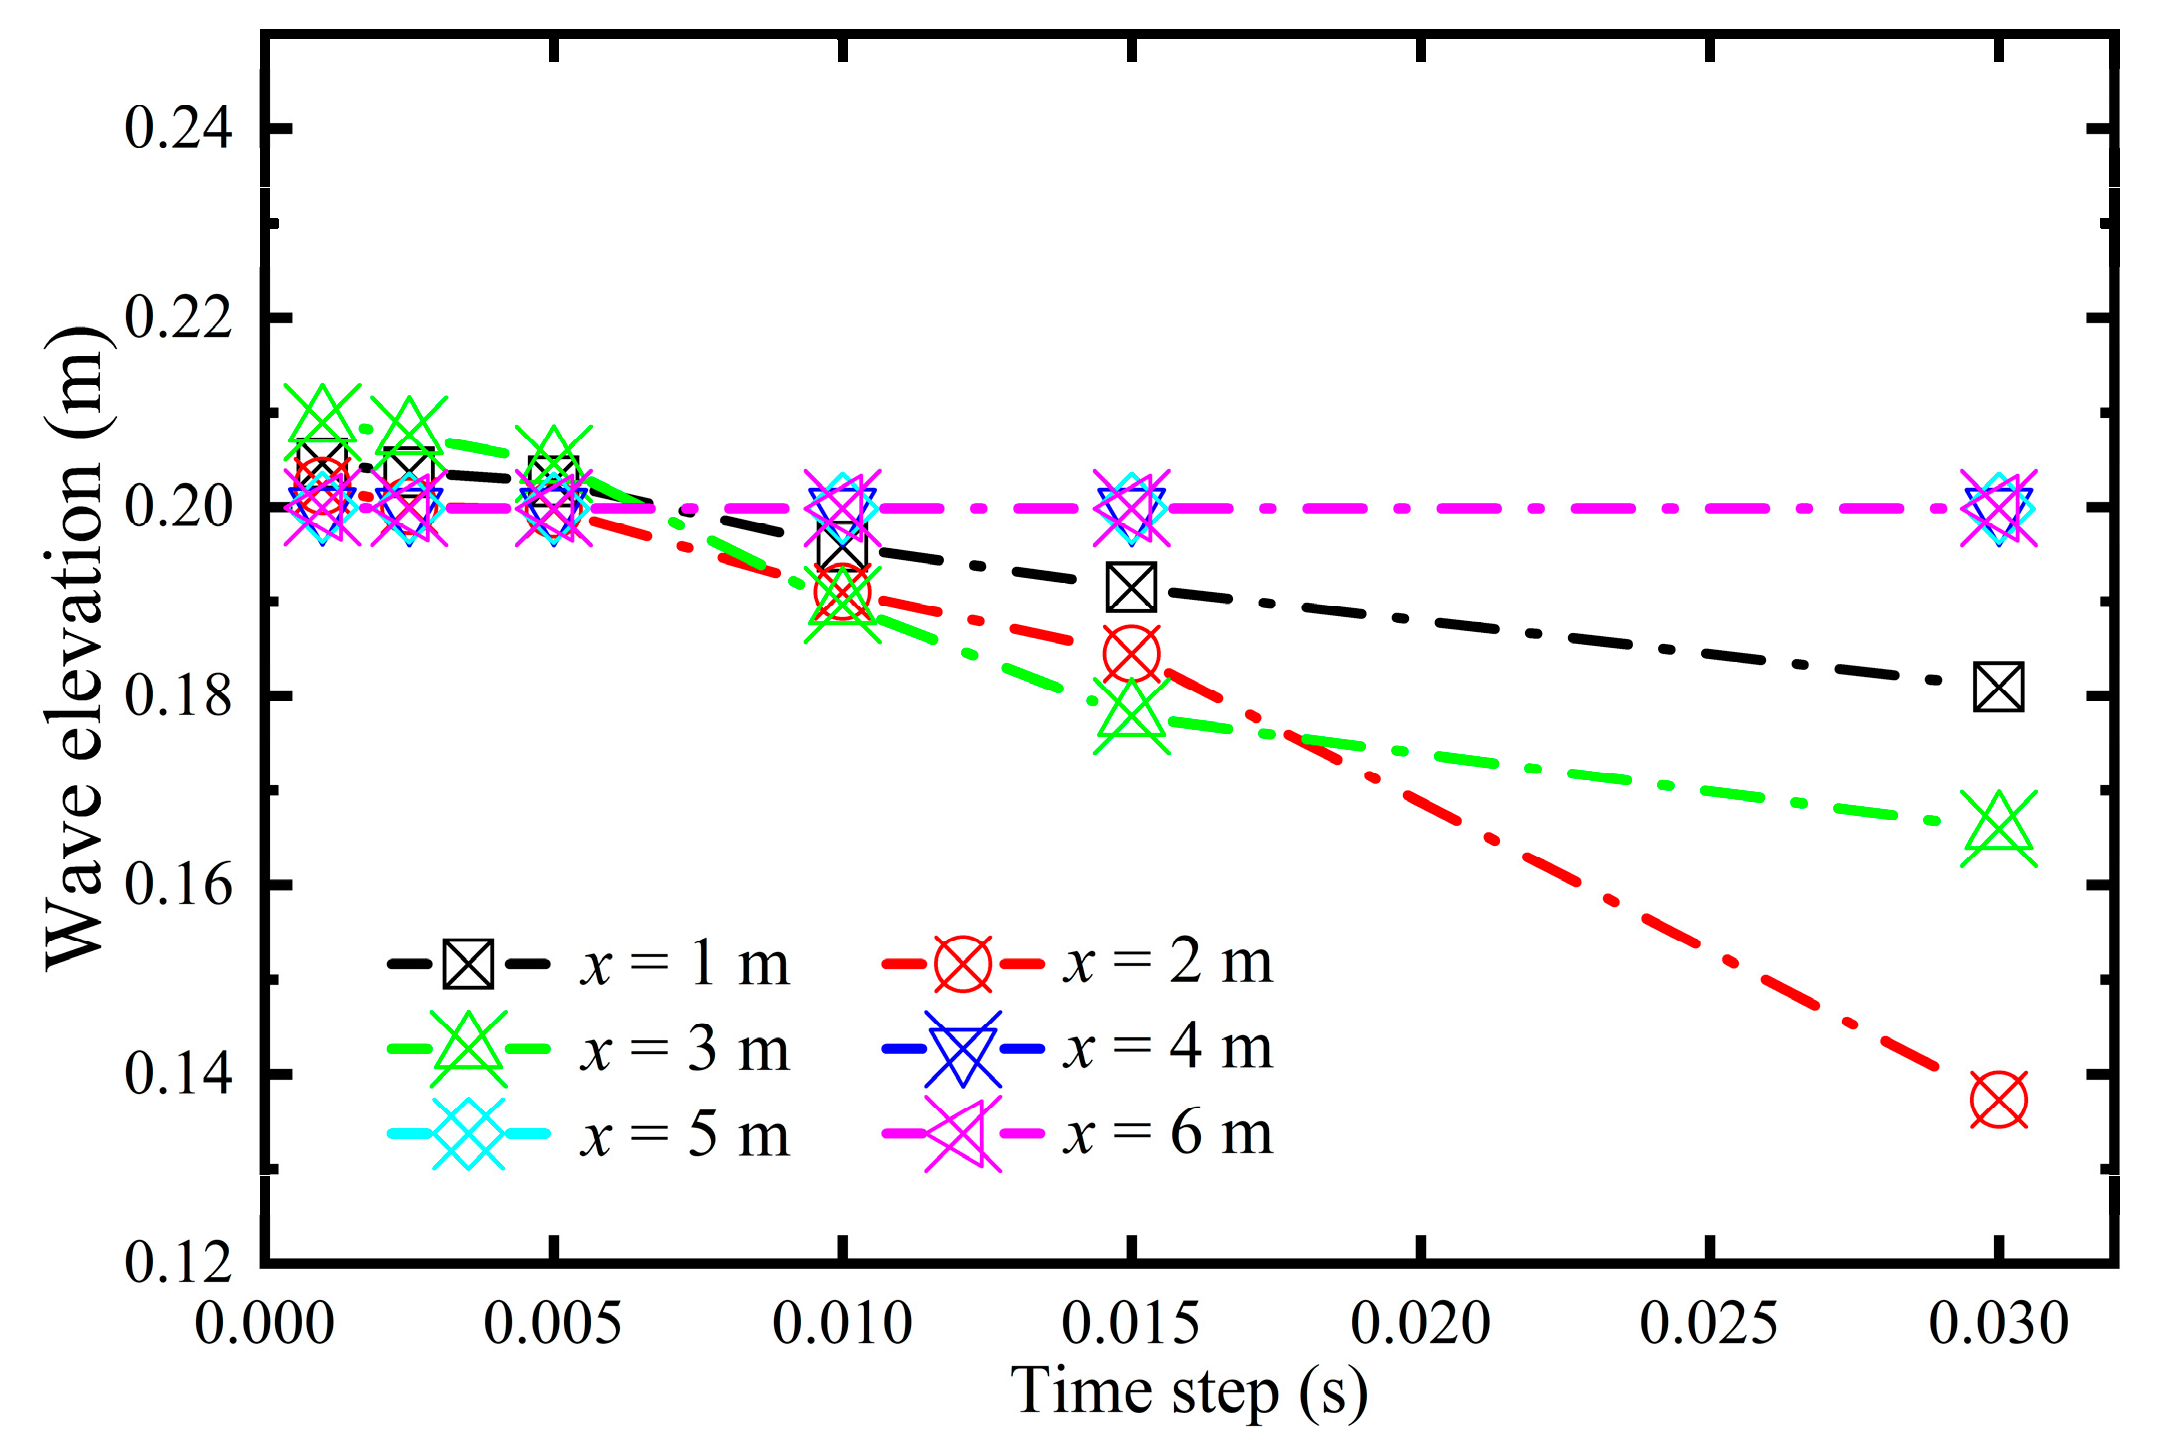
2.4.2. Time-Step Sensitivity Analysis

Time-step sensitivity tests were also performed for verification. For the precision of wave elevation in the Bio-DFAD simulation, the time step should be relatively small so that the wave elevation can be captured exactly. Based on the cell number per wave height and wavelengths of 20 and 88, six different time steps (0.001, 0.0025, 0.005, 0.010, 0.015, and 0.030 s) were set to verify a suitable time step for the Bio-DFADs simulation.
From Figure 5, it can be concluded that the time step influences the wave elevation significantly, and the accuracy of the wave elevation decreases significantly as the time step increases. When the time step was 0.005 s, the Bio-DFAD simulation captured the wave elevation more accurately and showed a higher efficiency.
The y+ value was maintained at approximately 60 using the prism-layer method. The courant number was less than 0.3. In our previous research (Wan et al., 2022 [13]), the simulated results revealed a high level of consistency with the experimental tests based on this numerical method. A comparative analysis between the numerical simulation and the physical experimental results, which revealed a high level of consistency, was performed. These results indicated that the numerical method was highly precise and reproducible. Therefore, it can be concluded that the numerical method can accurately capture the motion of Bio-DFADs in waves. Compared with our prior work, different materials were employed in the raft part of the Bio-DFADs, which was consistent with the numerical methods applied. This study aligns with the application requirements for biodegradable materials set by the Regional Fisheries Management Organization.
Figure 6 shows a comparison of the wave elevation between the numerical simulation and the theoretical values without the Bio-DFADs model. The results indicated that the numerical model, wave generation, VOF wave-forcing method, mesh size, and time step were reasonable, with an error of less than 0.5%. As shown in Figure 6, the wave features of the first- and fifth-order waves, particularly the nonlinear feature of the fifth-order wave (sharp crest and flat trough), can be identified precisely by the selected numerical model.

2.5. Mesh Generation

As shown in Figure 7, the computational domain consists of background and overset regions. A trimmed cell mesher, prism layer mesher, and surface remesher were employed in the computational domain. The predominantly hexahedral cells of the trimmed cell mesher are suitable for the geometric features of the Bio-DFAD model. Orthogonal prismatic cell layers adjacent to the wall boundaries of the Bio-DFADs were generated using a prism layer mesher, and five layers were generated.

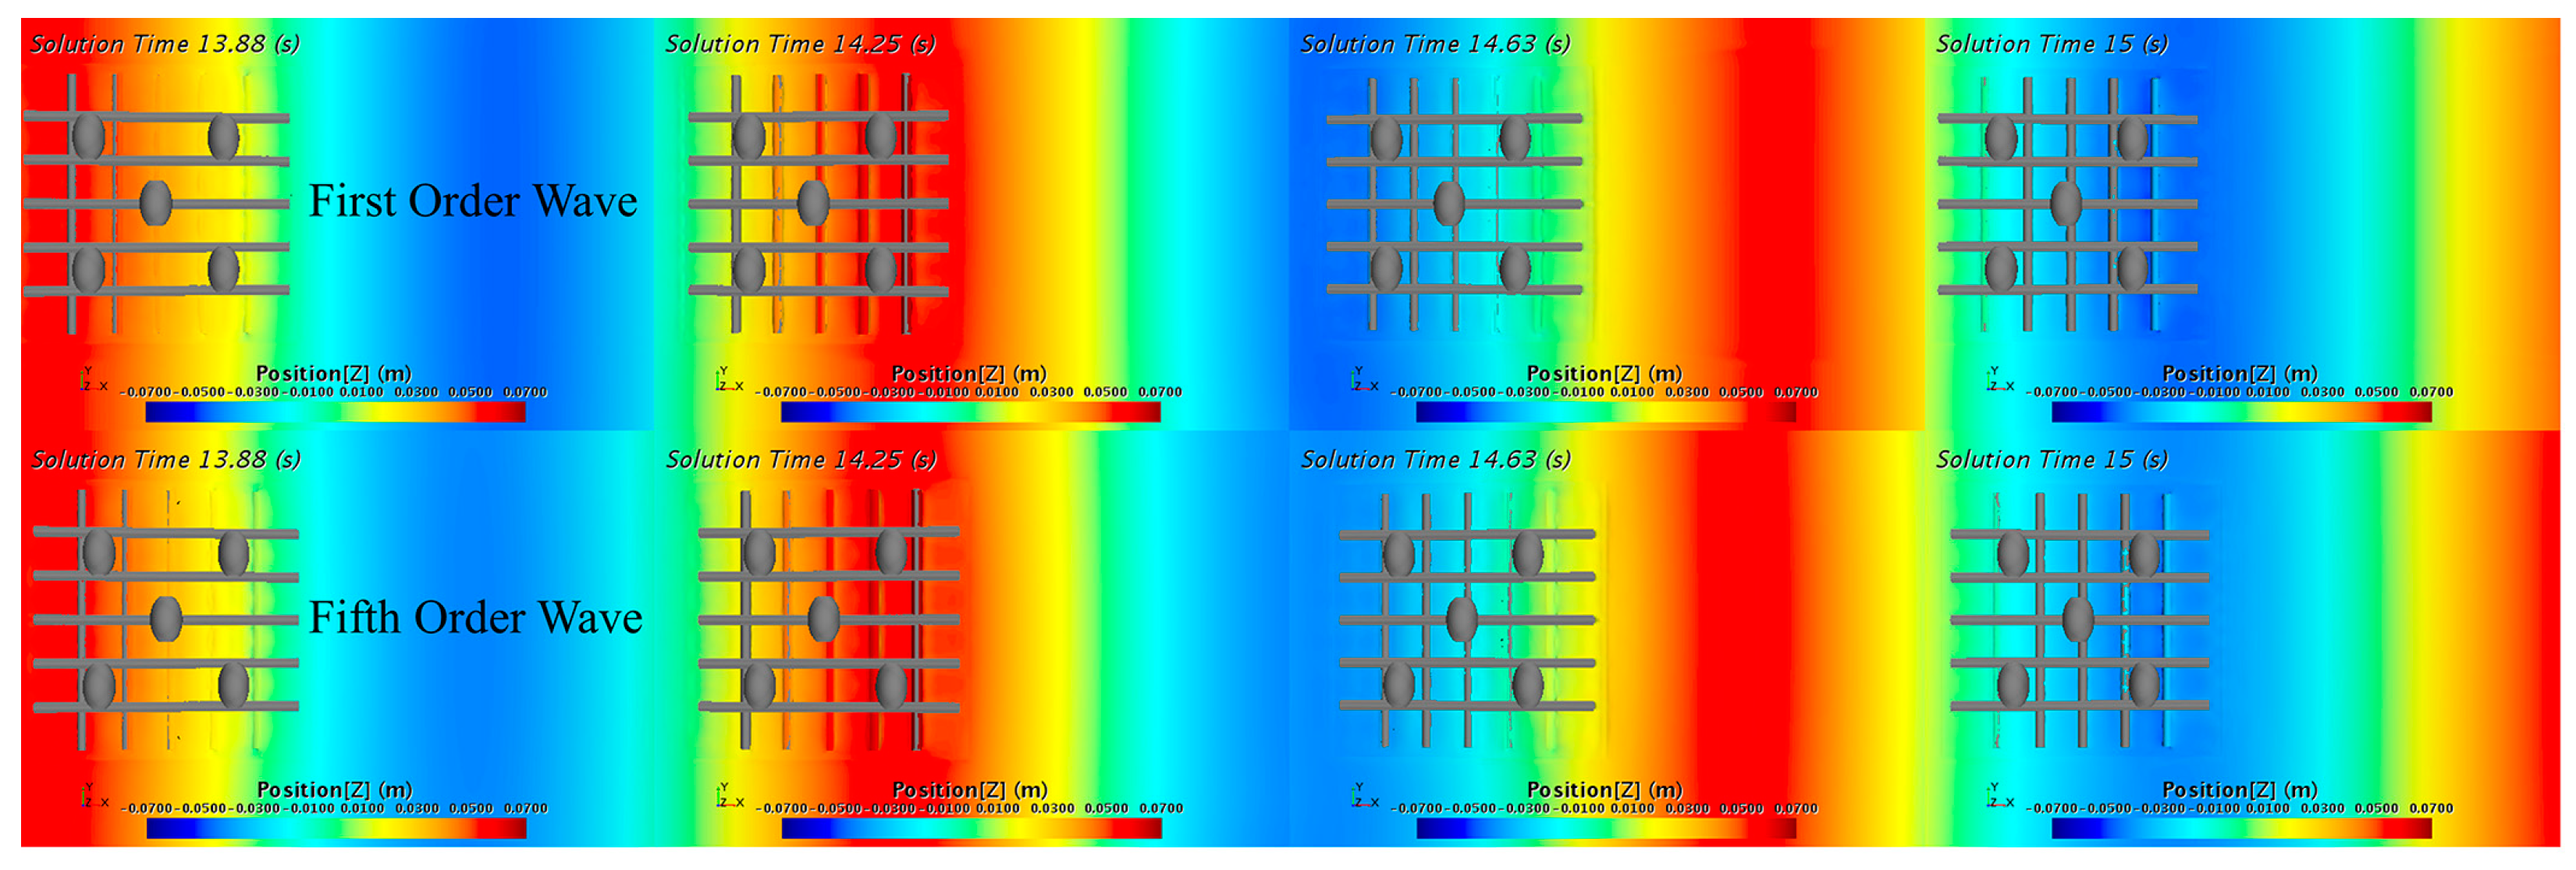
3. Results and Analysis

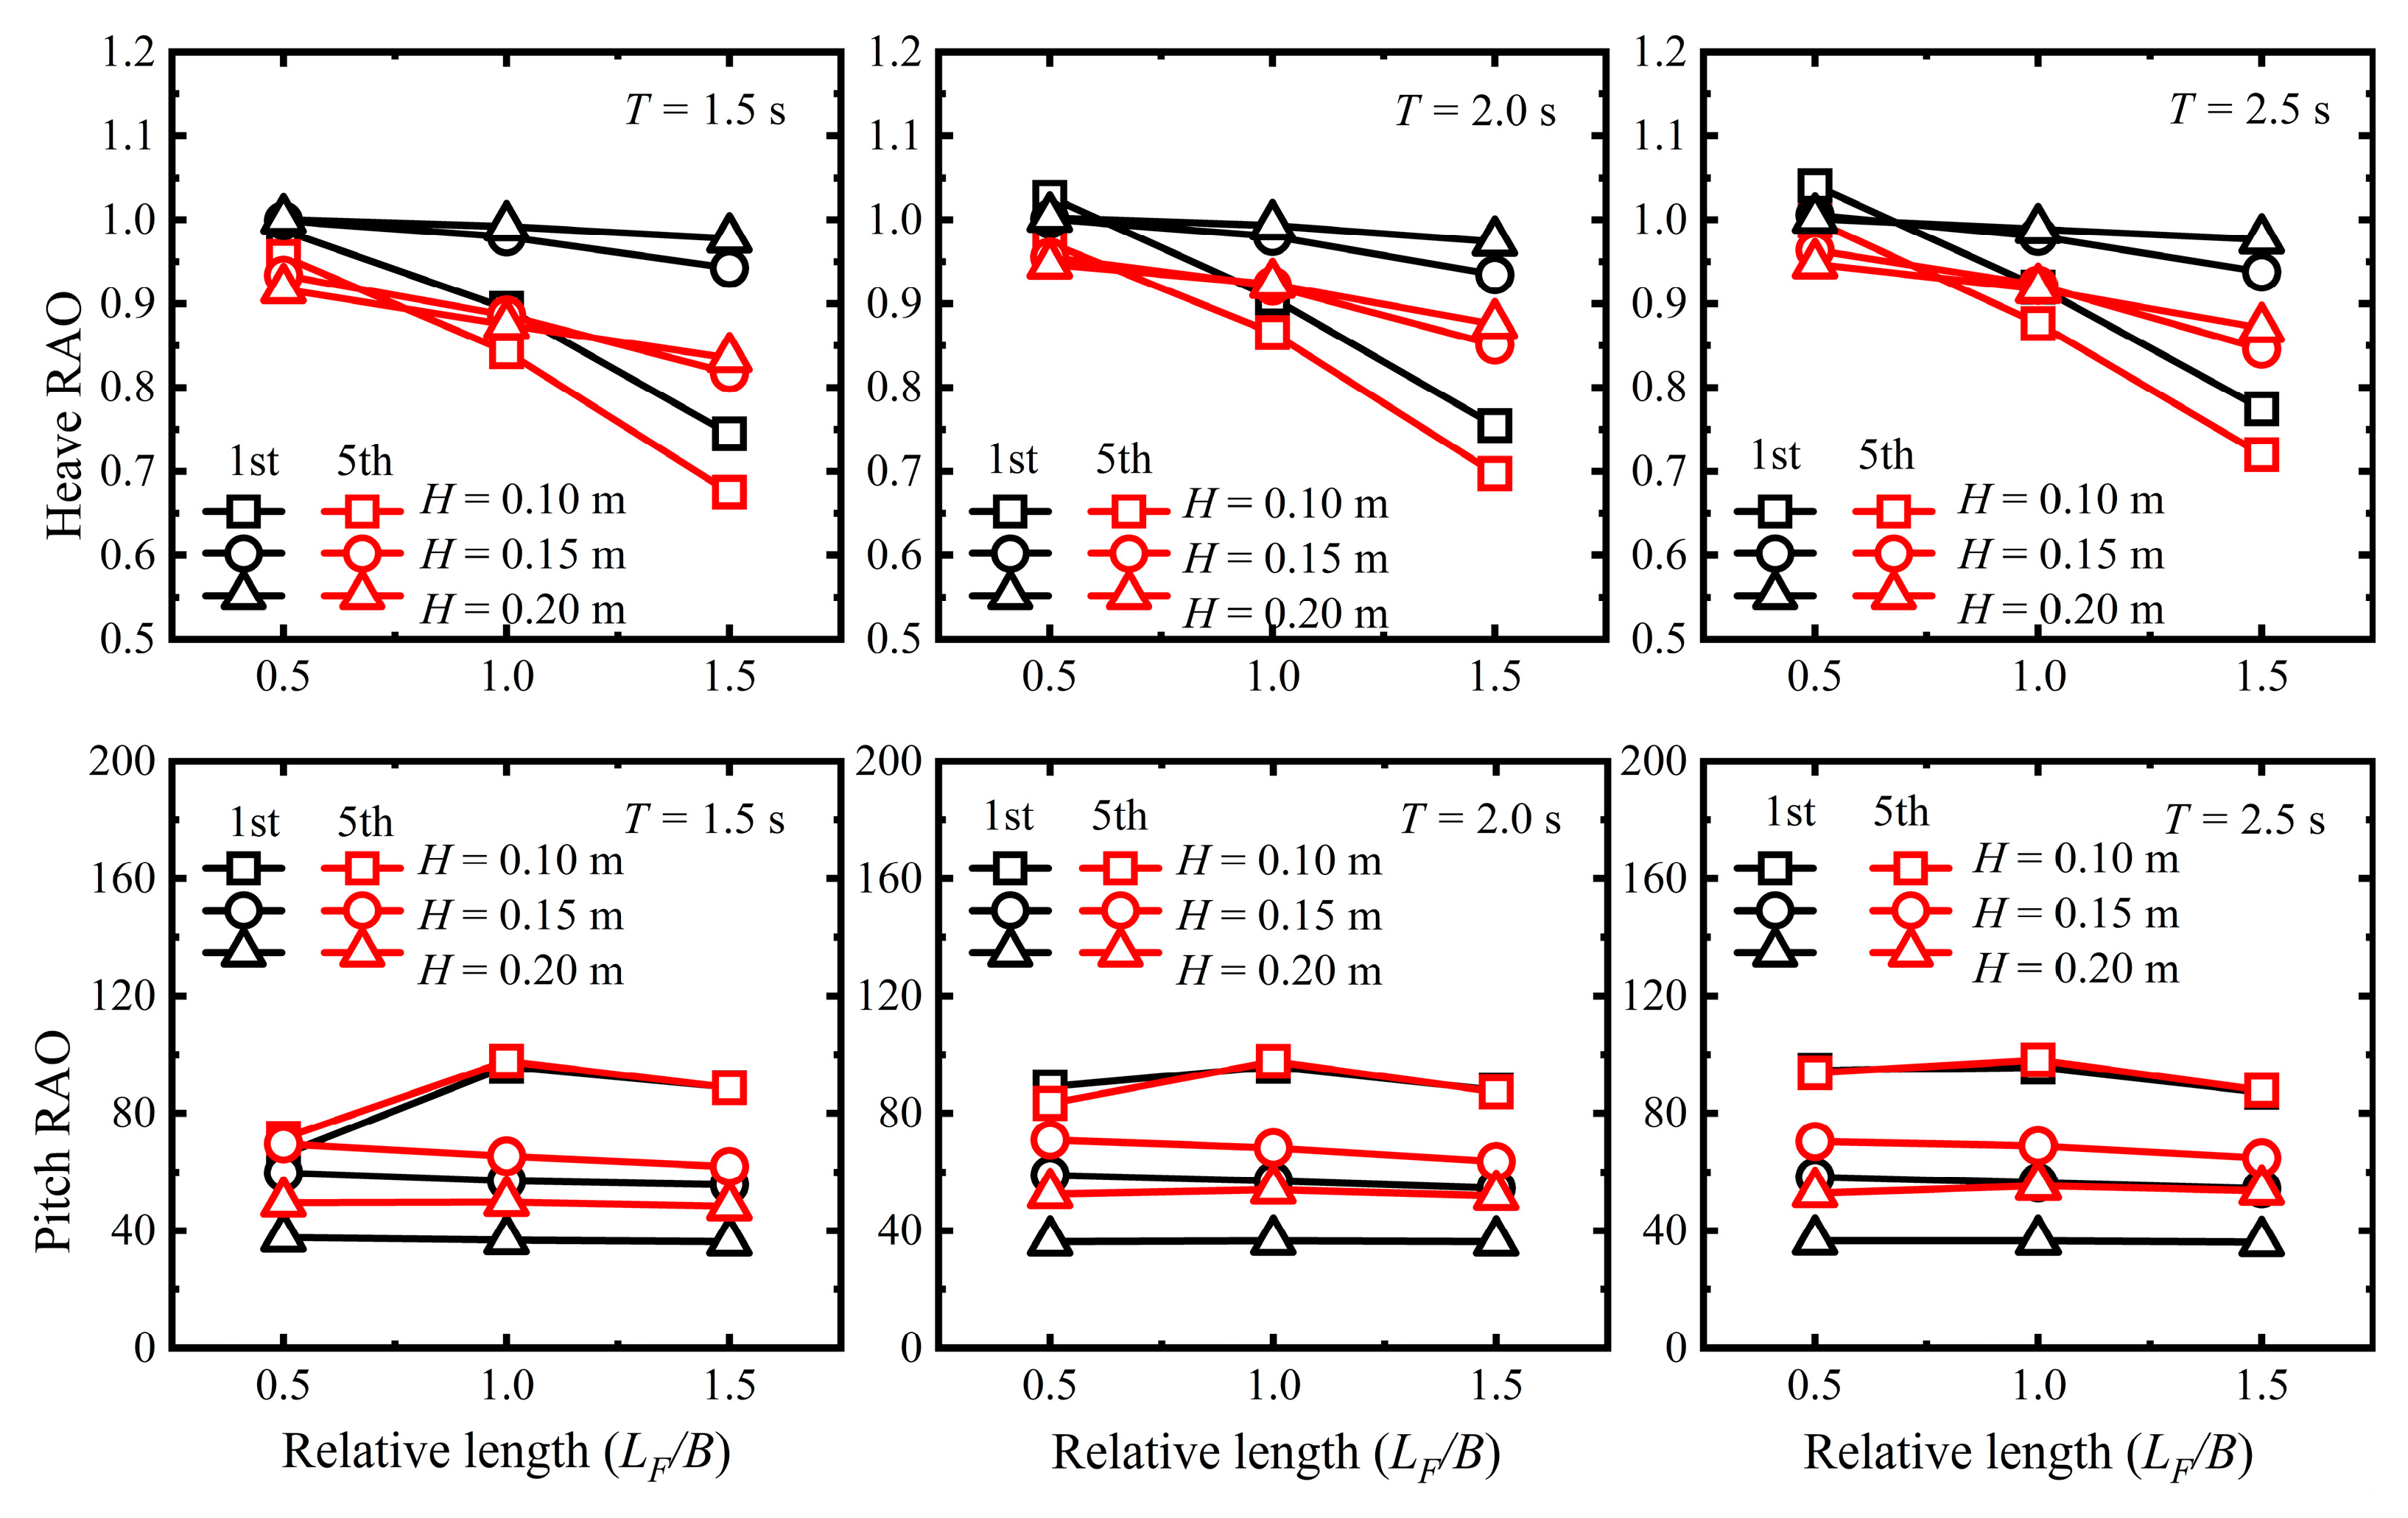
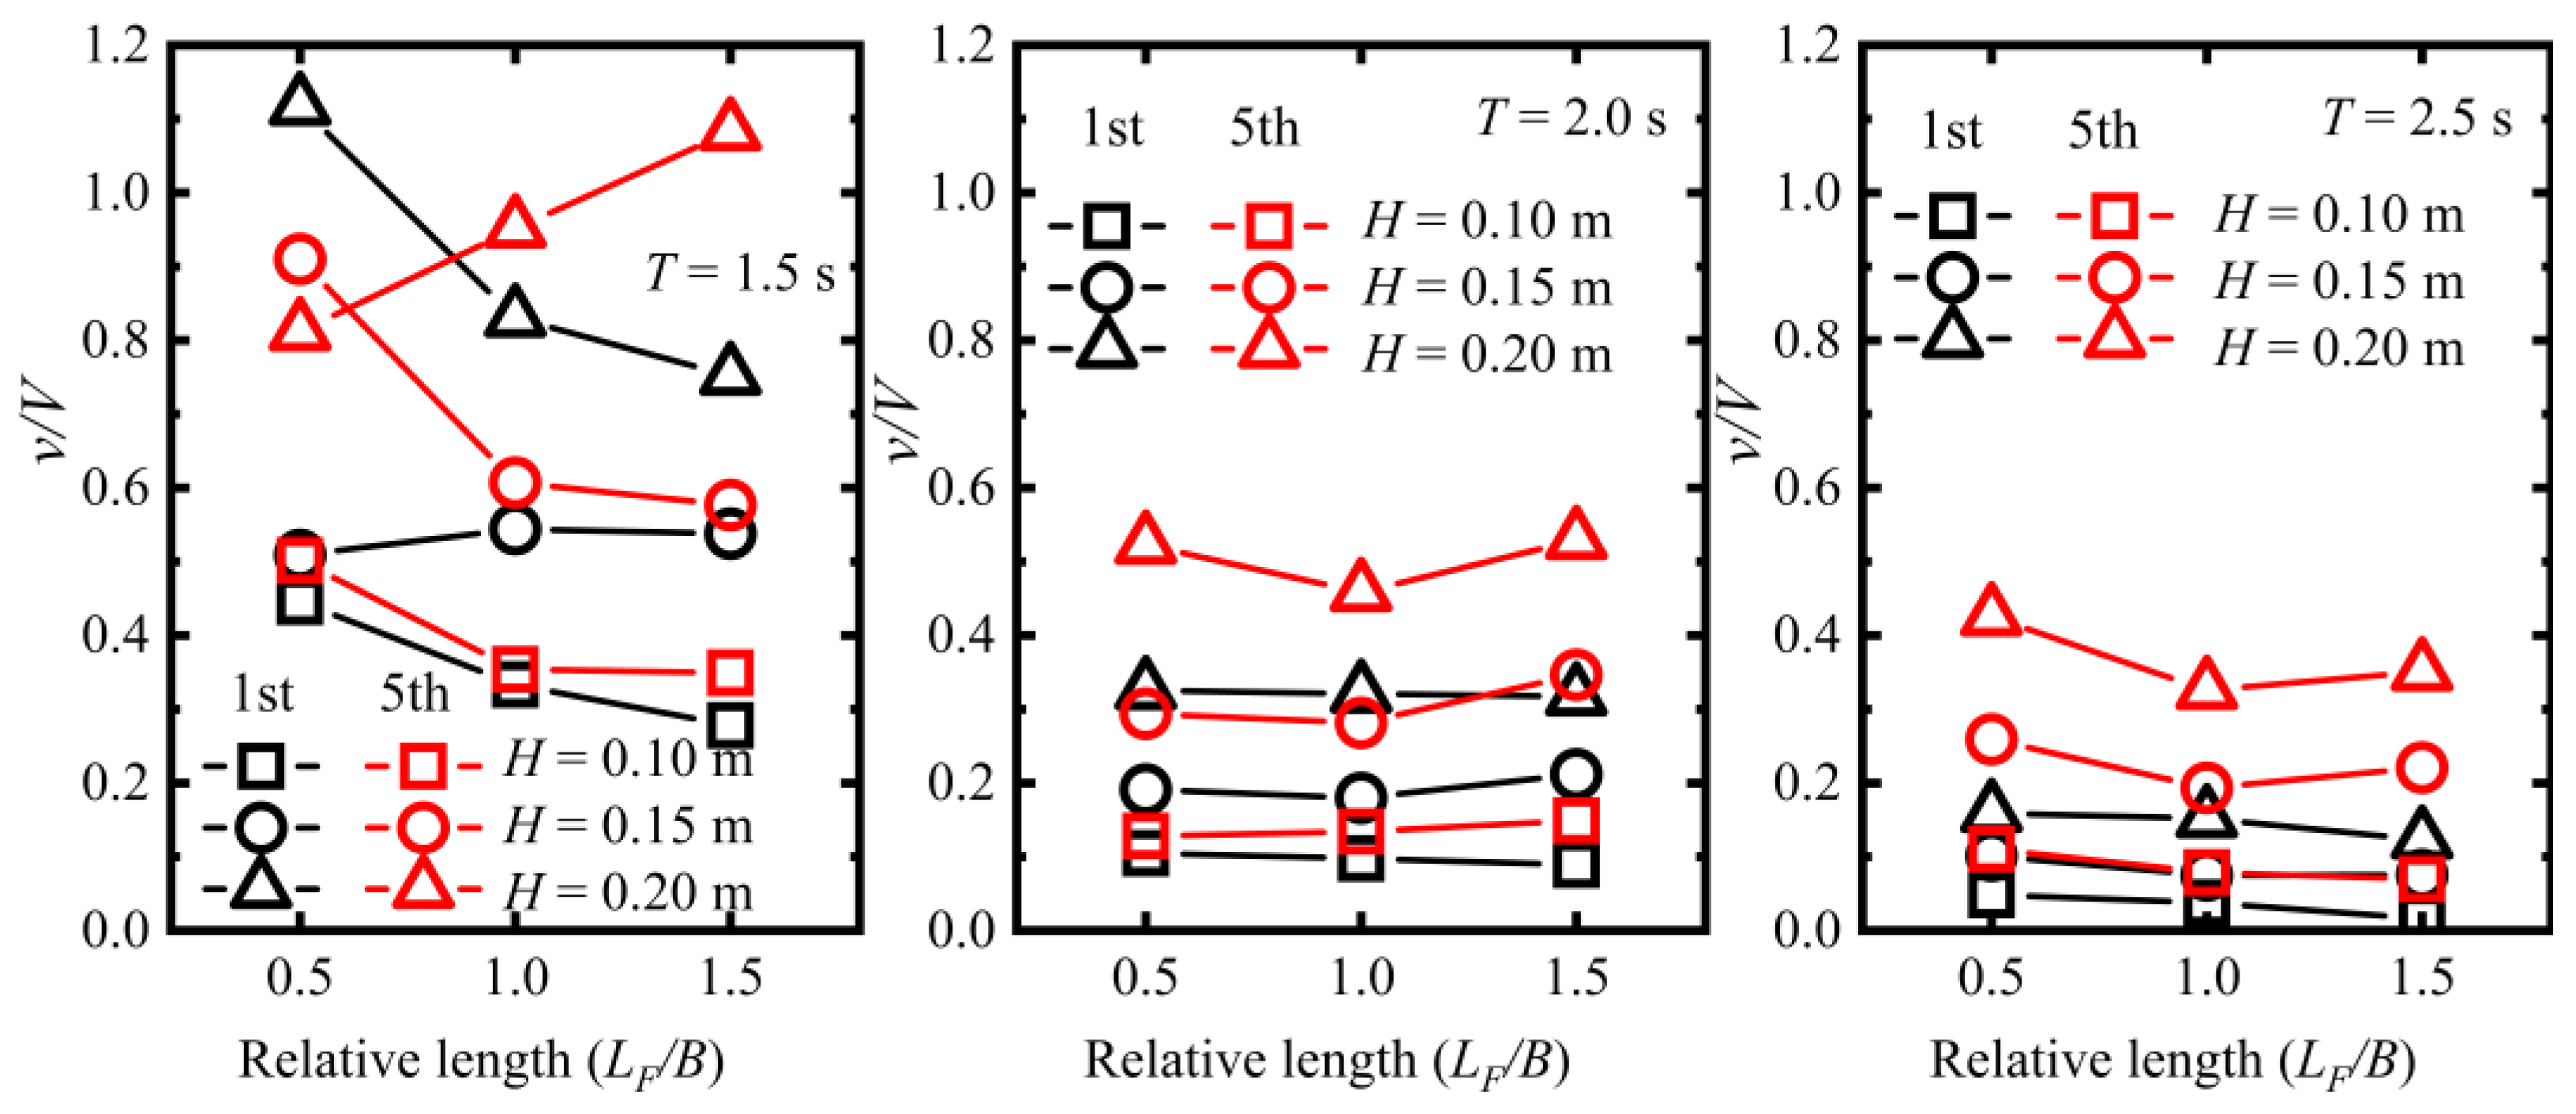
3.1. Influence of Relative Length on the Hydrodynamic Performance of Bio-DFADs

Figure 8, Figure 9, Figure 10, Figure 11 and Figure 12 show the comparisons of the motion response, velocity magnitude, and pressure distribution contours of the Bio-DFADs between the first-order and fifth-order waves in one wave period (top view, front view, and side view) (wave case: T = 1.5 s, H = 0.10 m), respectively. The results indicate that the numerical model can predict and visualize the hydrodynamic performance of Bio-DFADs in regular waves.
A comparison of the motion response of the Bio-DFADs, including the heave RAO and pitch RAO between the first-order wave (first) and fifth-order wave (fifth) under different wave conditions for various levels of relative length (LF/B), is shown in Figure 13. In terms of overall trends, the heave RAOs decreased significantly as LF/B increased, and the trend of the pitch RAOs was complicated by the change in LF/B. The heave RAOs of Bio-DFADs in the first-order wave (first) were larger than the heave RAOs in the fifth-order wave (fifth), whereas the pitch RAOs of the Bio-DFADs in the first wave were less than the pitch RAOs in the fifth wave. The results may have been affected by different wave types; the fifth had a sharper crest and a flat trough. This is because, for the heave RAOs, the fifth wave had a smaller upward total speed component than the first, resulting in a smaller wave force
When the wave period is constant, the heave RAOs decrease with increasing relative length (LF/B). For LF/B = 0.5 and T = 1.5 s, the heave RAOs decreased as the wave height H increased. However, as the LF/B ratio increases, the heave RAOs increase with increasing H. The heave RAOs increase slightly as the wave period T increases. For the pitch RAOs, when the wave height H = 0.10 m, the pitch RAOs first increase and then decrease as the LF/B increases. Additionally, the pitch RAOs decrease as the LF/B ratio increases. As the wave period T increased, this trend did not change significantly. The contact area between the Bio-DFADs and the fluid increases as the wave period and relative length increase, thus enhancing the interaction between the Bio-DFADs and the waves. The majority of the wave energy occurs within three times the wave height beneath the wave surface [32]. The downward wave energy along the wave surface was vertically distributed and increased with the wave period. Therefore, as the relative length, wave period, and wave height increased, the heave and pitch RAOs decreased. Nevertheless, the contact area and weight of Bio-DFADs increased as the relative length increased, and more wave energy acted on them. Therefore, the motion response tendency of Bio-DFADs is complex owing to those effect factors. The results indicated that the relative length LF/B and wave height H had a significant influence on the heave RAOs and pitch RAOs of Bio-DFADs, whereas the wave period T had less influence. A larger relative length corresponded to a lower heave RAO and pitch RAO. For fewer motion responses, a larger relative length (LF/B = 1.5) is recommended.
A dimensionless analysis of the relative velocities of the Bio-DFADs between the first-order (first) and fifth-order (fifth) waves for different relative lengths was performed (Figure 14). Overall, the relative velocities of the Bio-DFADs in the first wave were remarkably larger than those in the fifth wave; the relative velocity v/V increased with the wave height, and the relative velocities v/V decreased significantly as the wave period T increased. This can be attributed to the fact that the velocity of the wave transmission increases as the wave height increases but decreases as the wave period increases. Under the same wave condition, the horizontal velocity vector component of the fifth is larger than that of the first. Hence, the relative velocity v/V of Bio-DFADs in the fifth is greater than that in the first. The results indicated that the wave height H and wave period T had a significant influence on the relative velocity v/V of Bio-DFADs. When the wave period T was small, the relative velocity v/V changed significantly as the relative length LF/B increased. However, as the wave period increased, the relative length LF/B had less influence on the relative velocity. This can be explained by the fact that the mass of Bio-DFADs and the area of interaction with waves increased as the relative width LF/B increased, thus cushioning the relative velocity of Bio-DFADs (relative width LF/B = 1.0, wave period T = 2.0 s and 2.5 s). The results illustrate that the relative length LF/B has a significant influence on the relative velocity; however, as the wave period increases, the influence decreases. The wave period T and wave height H significantly influenced the relative velocity.

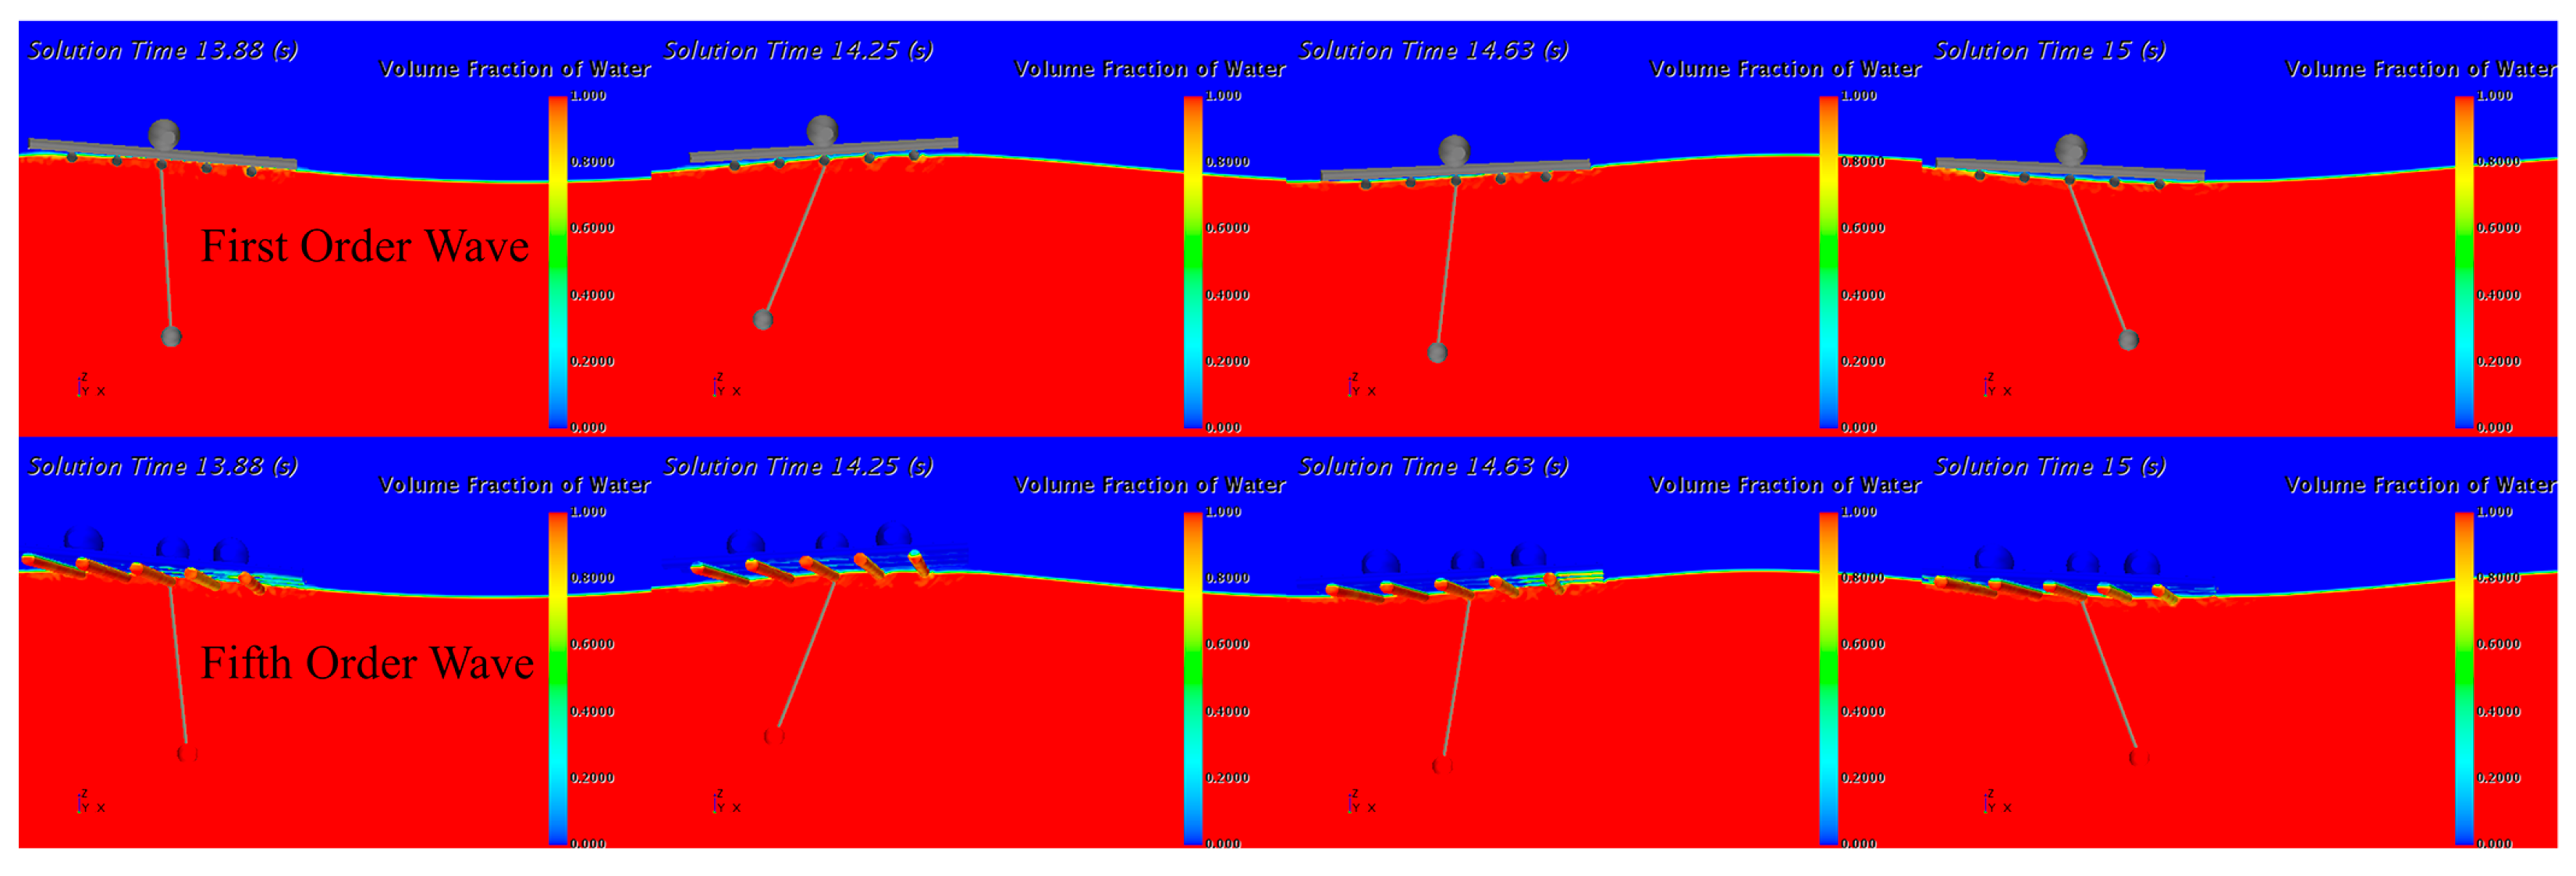
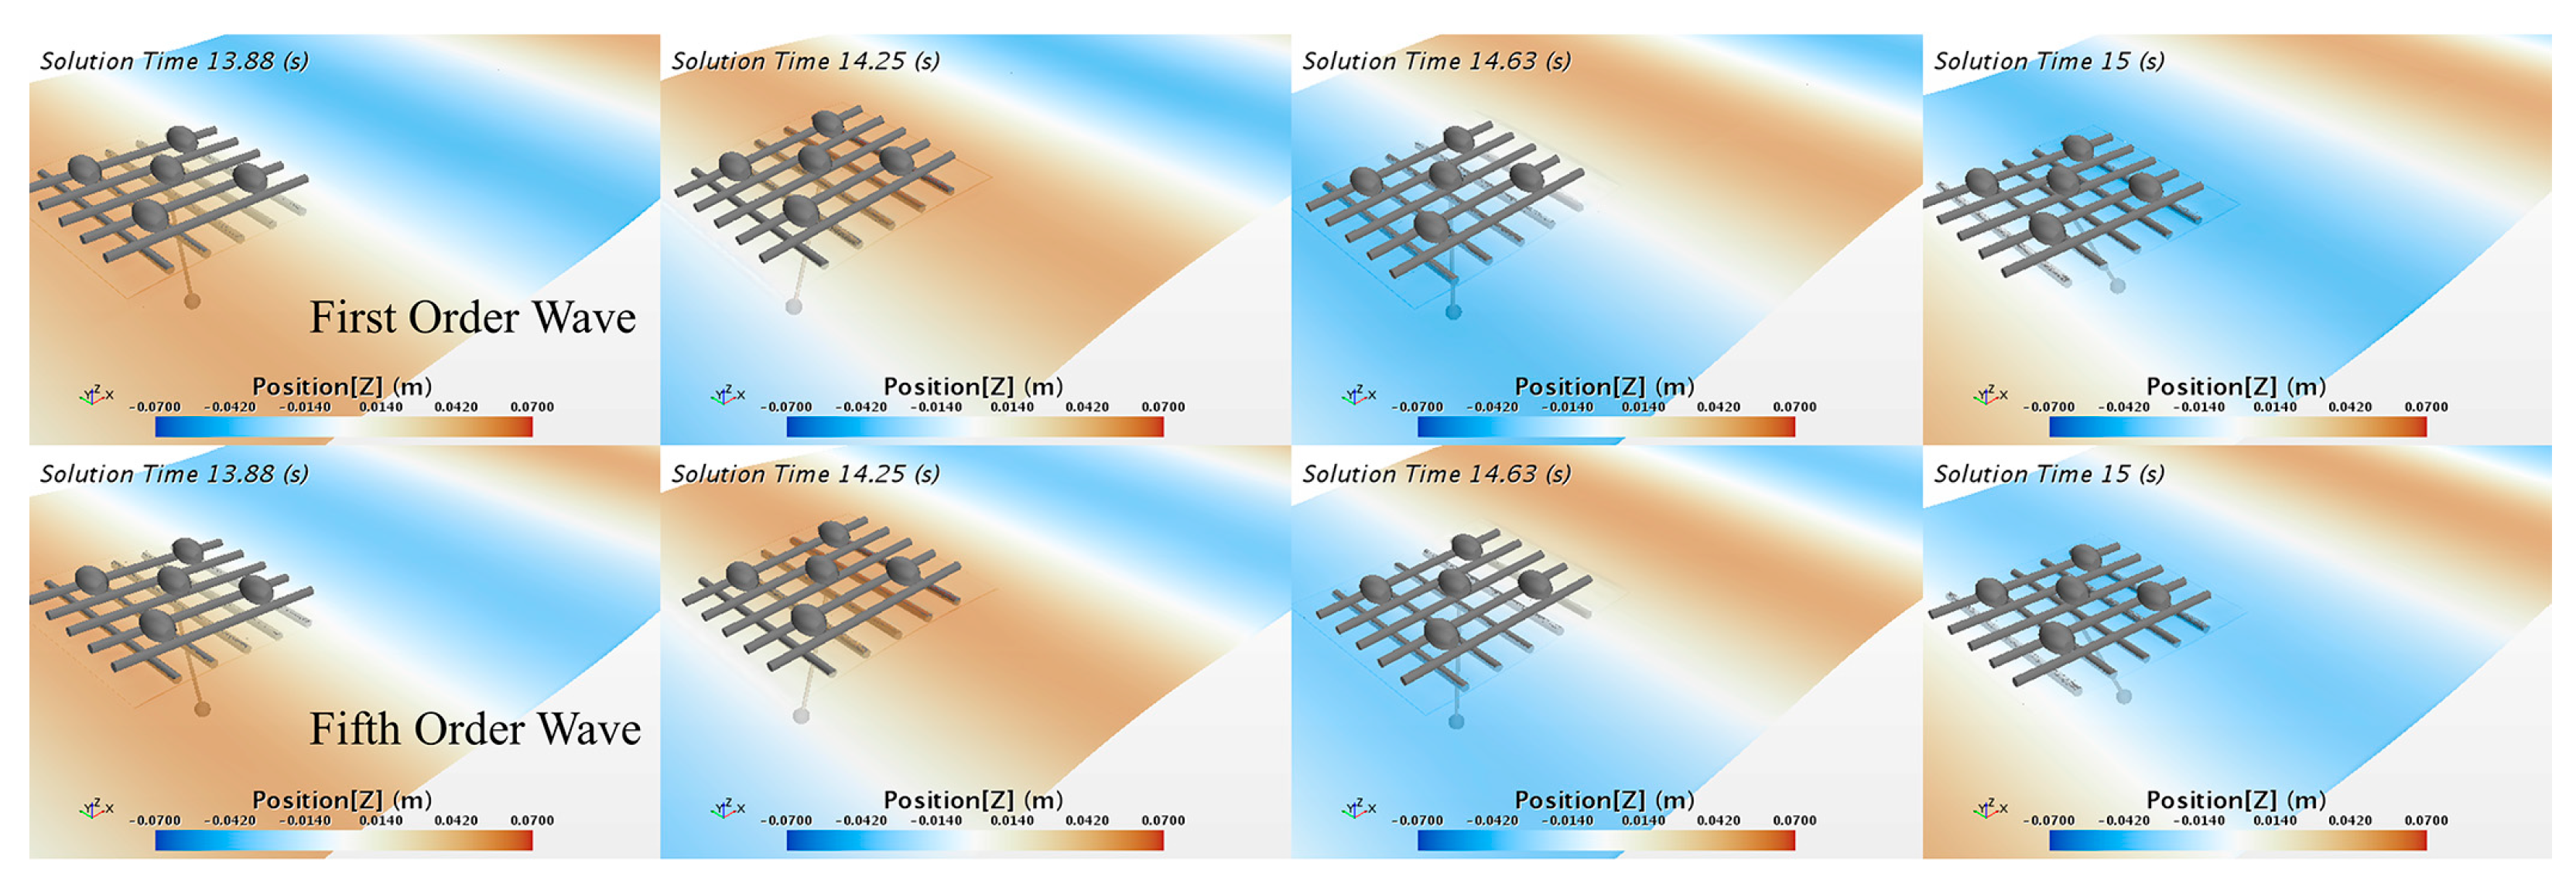
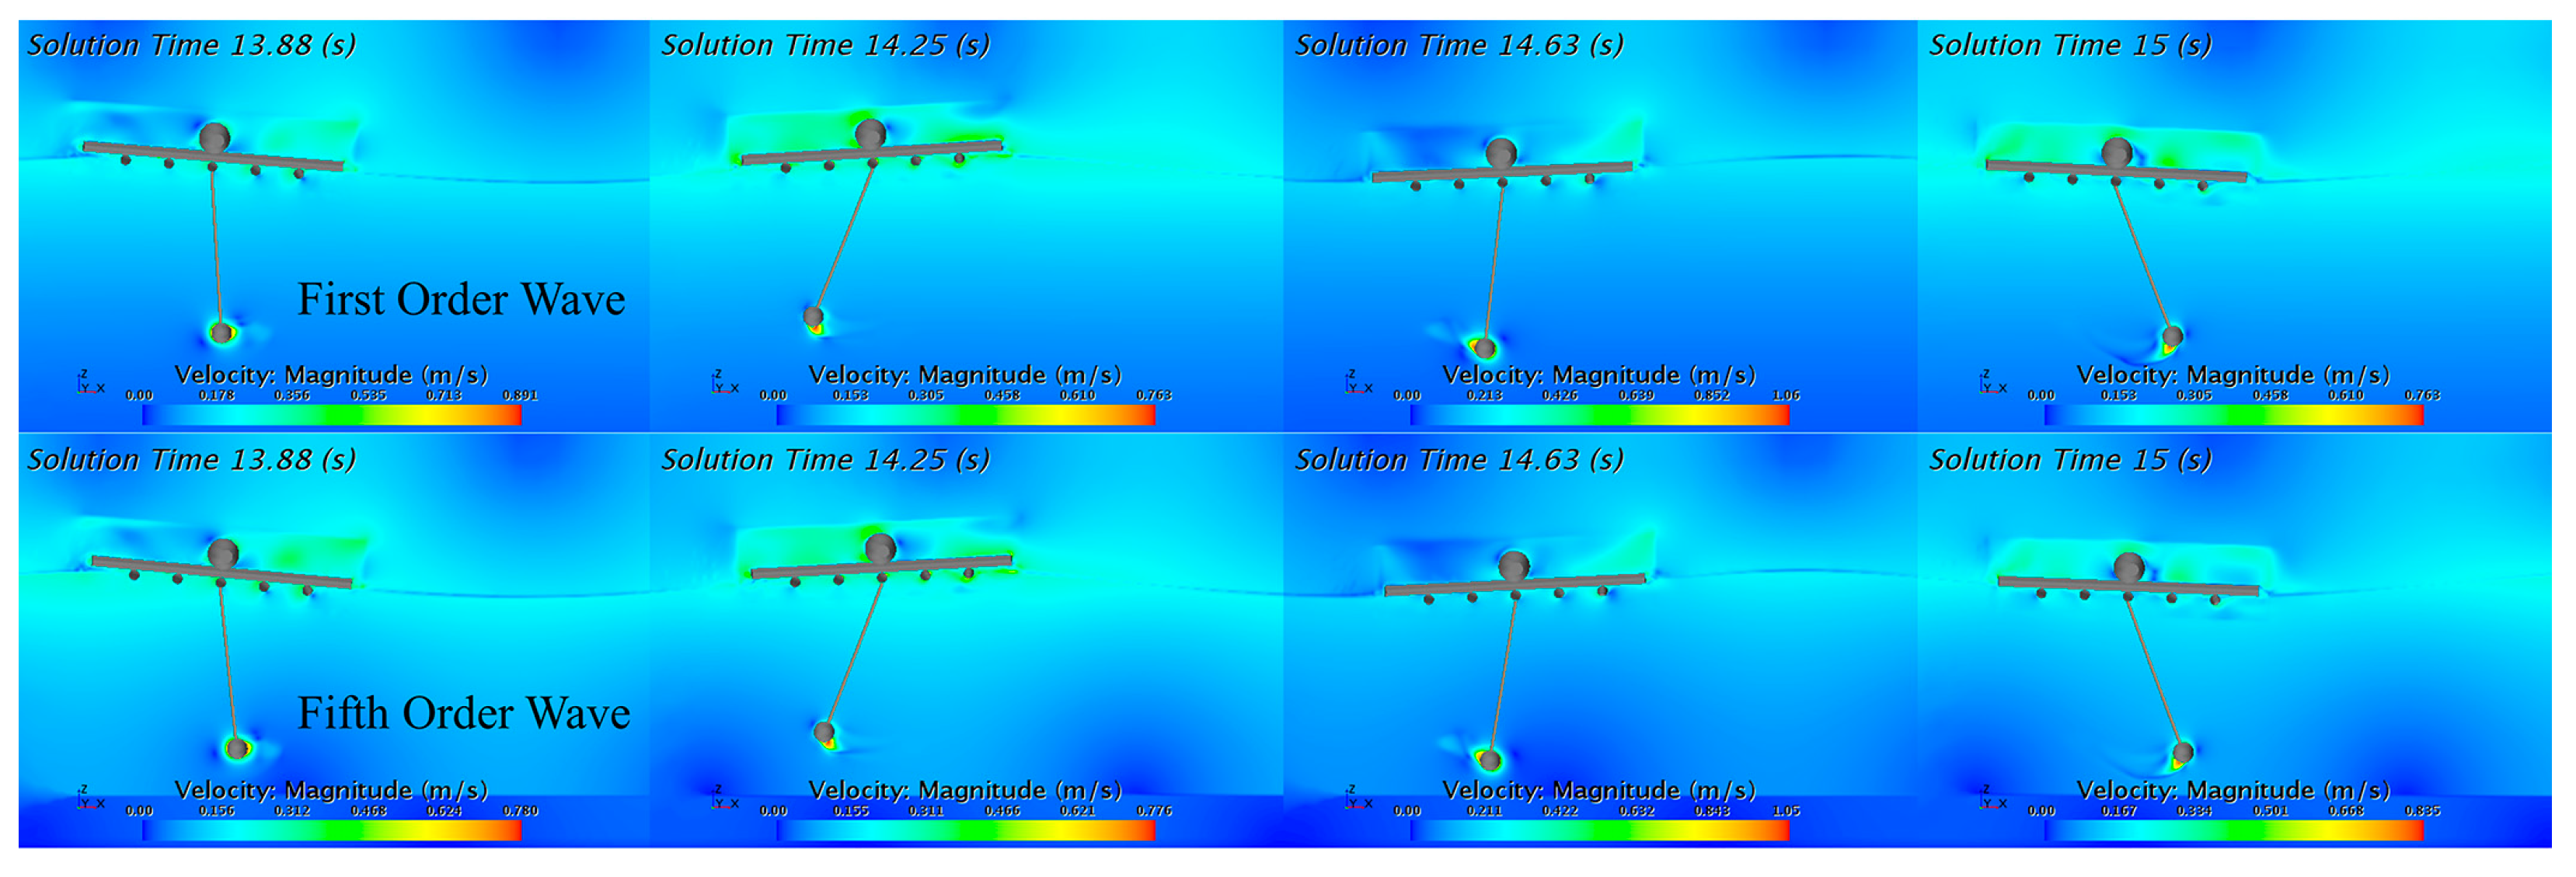
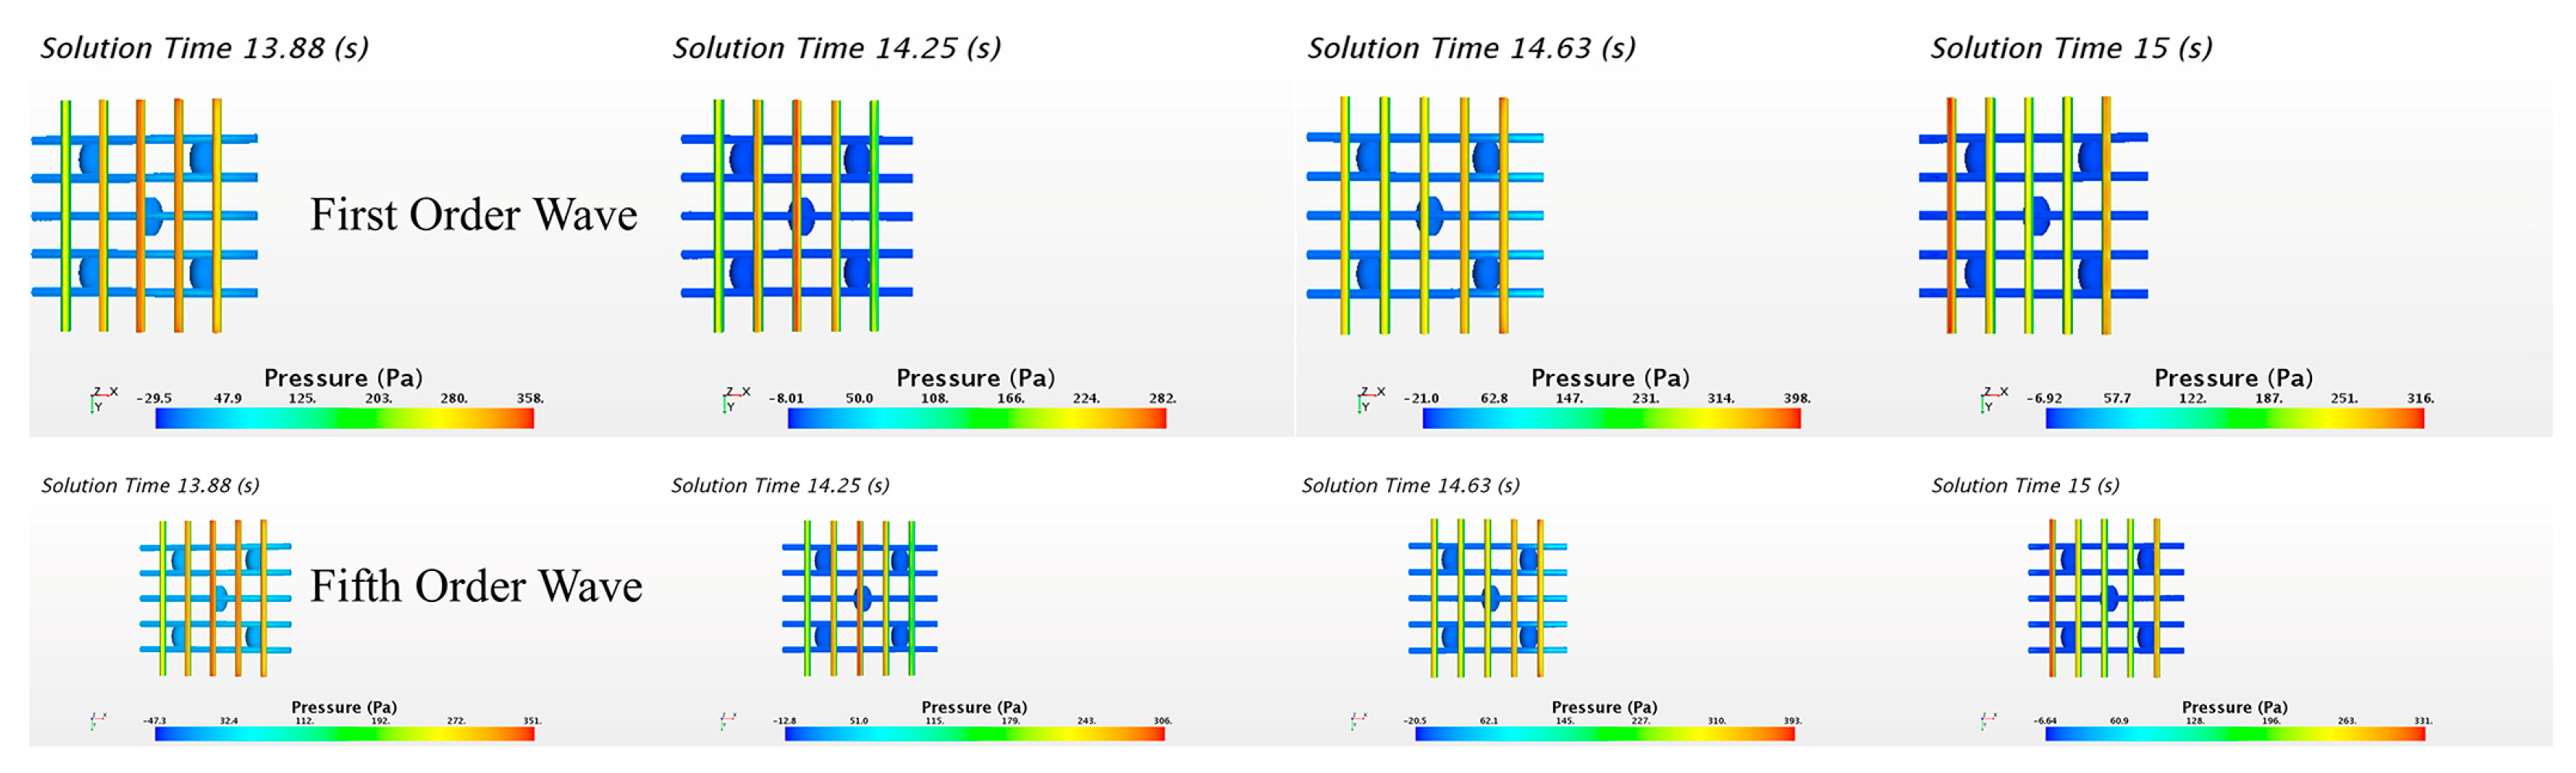
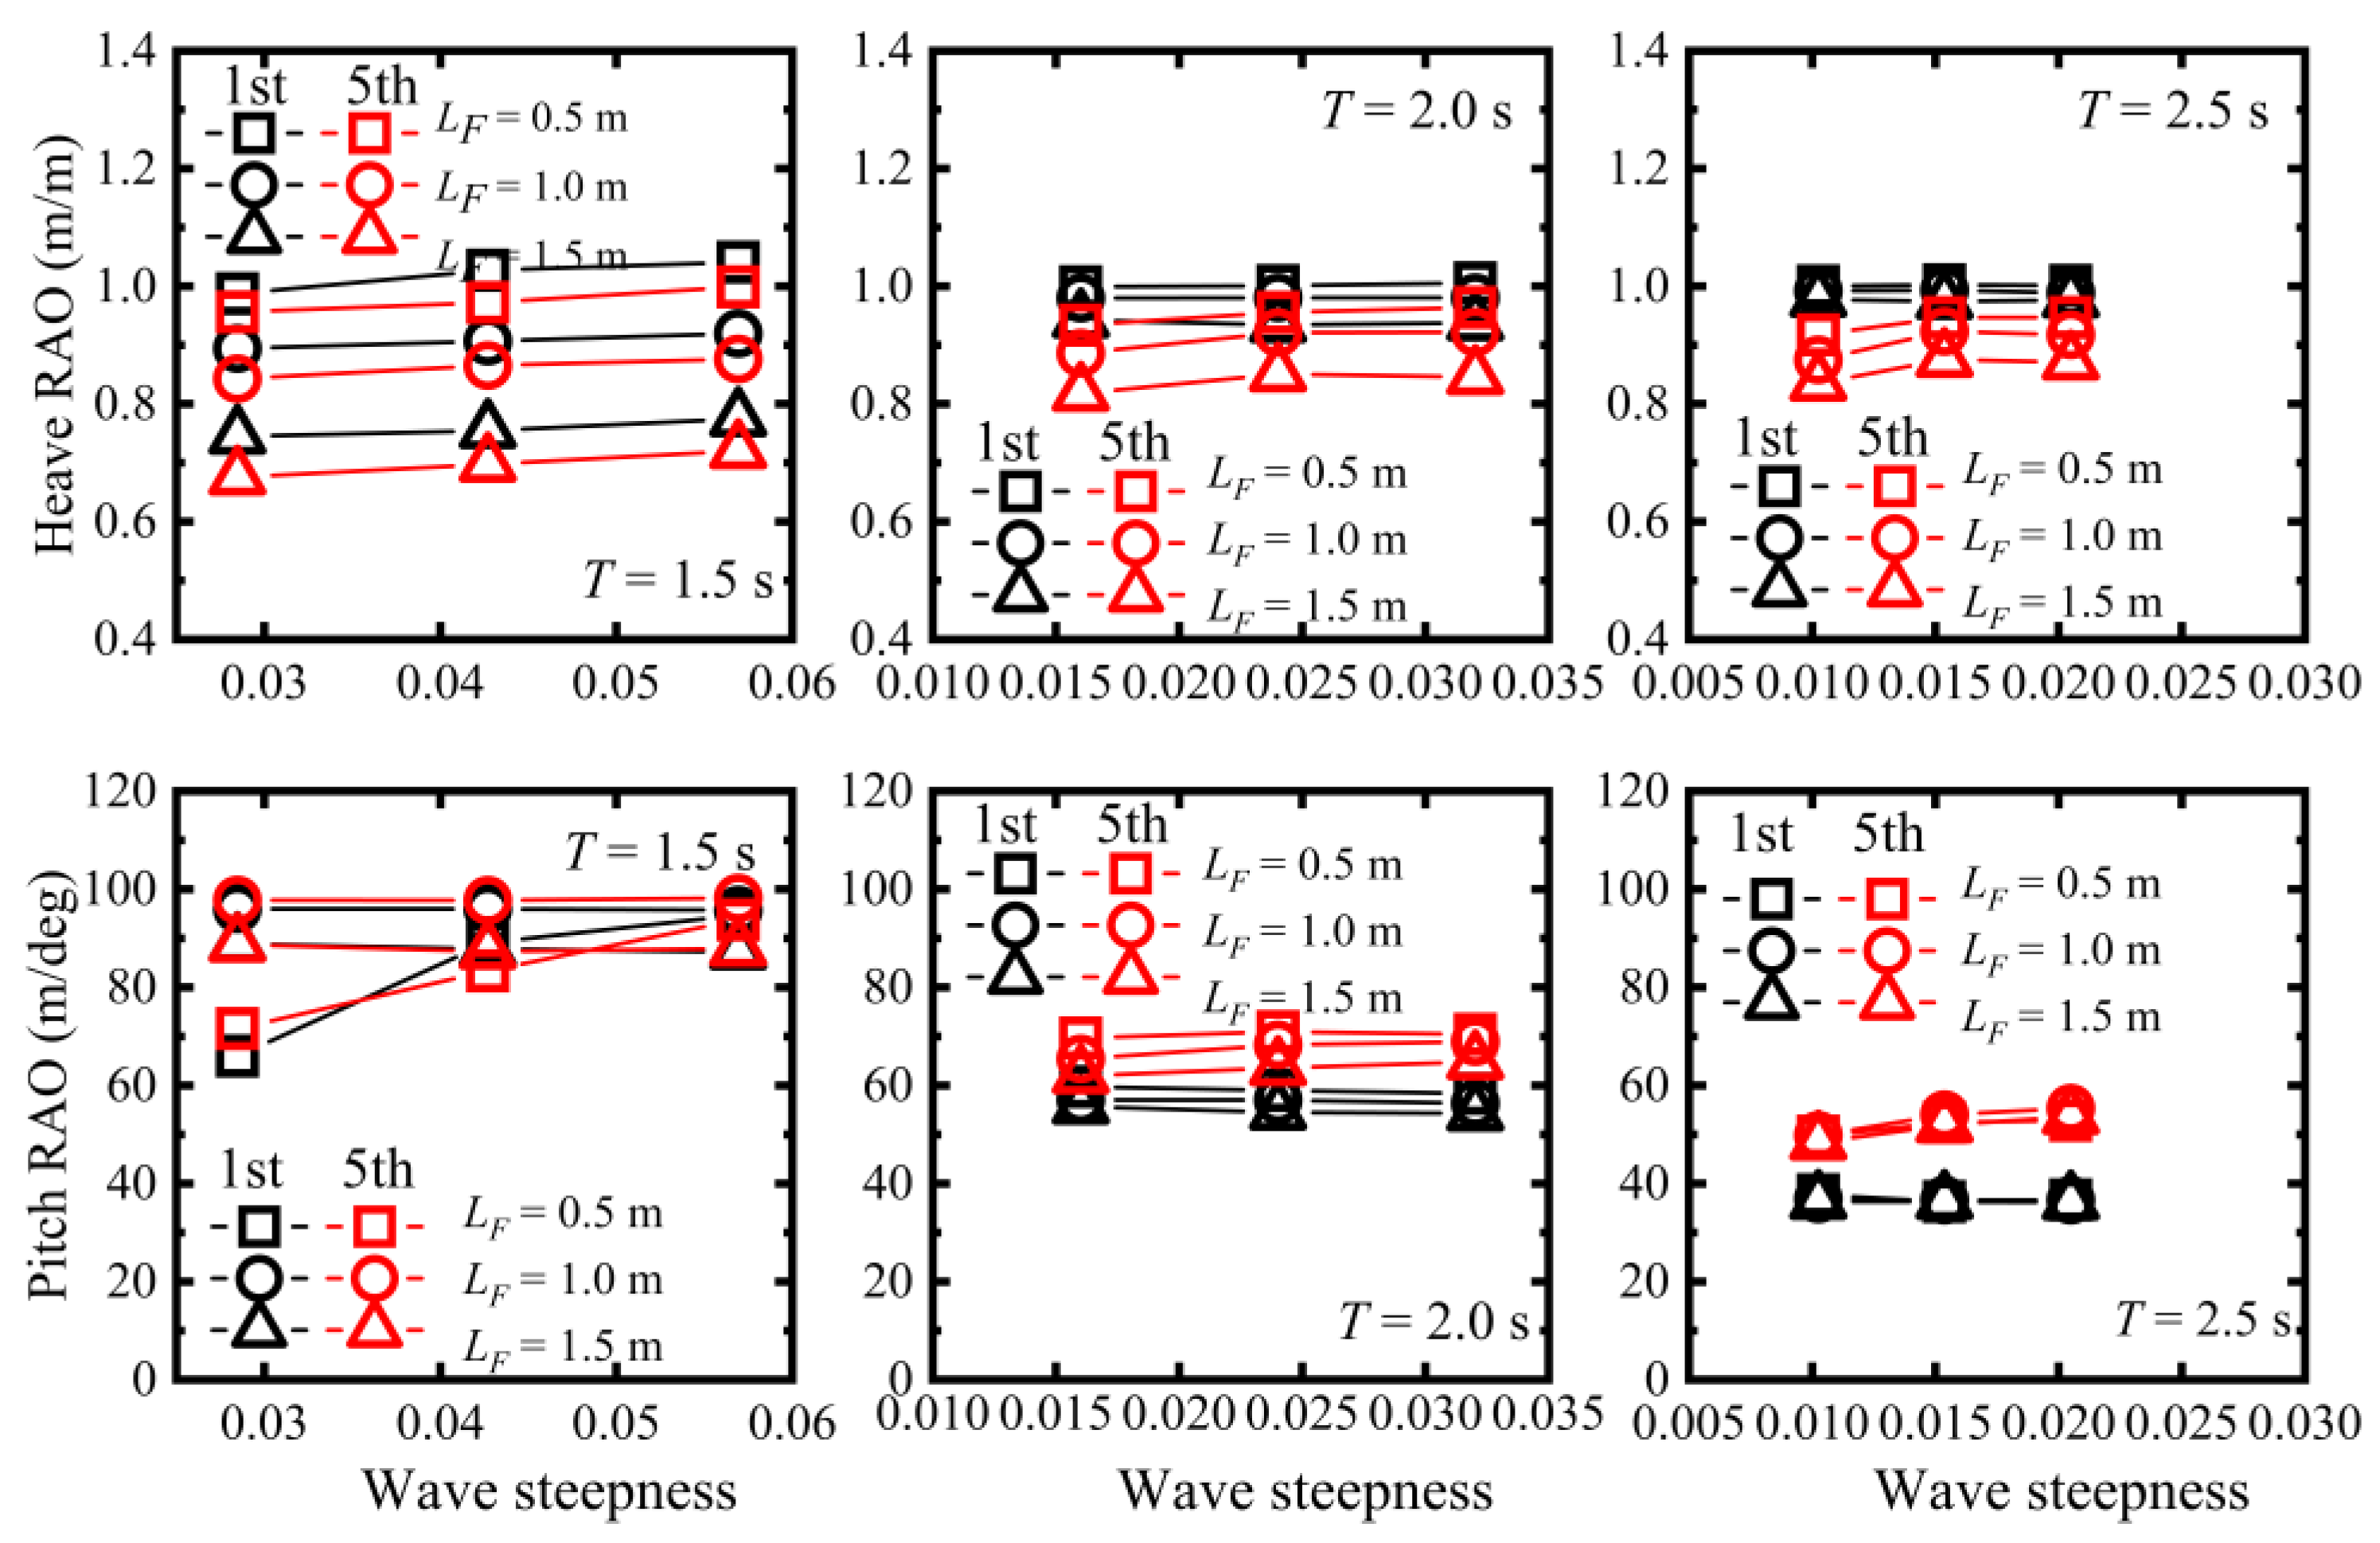
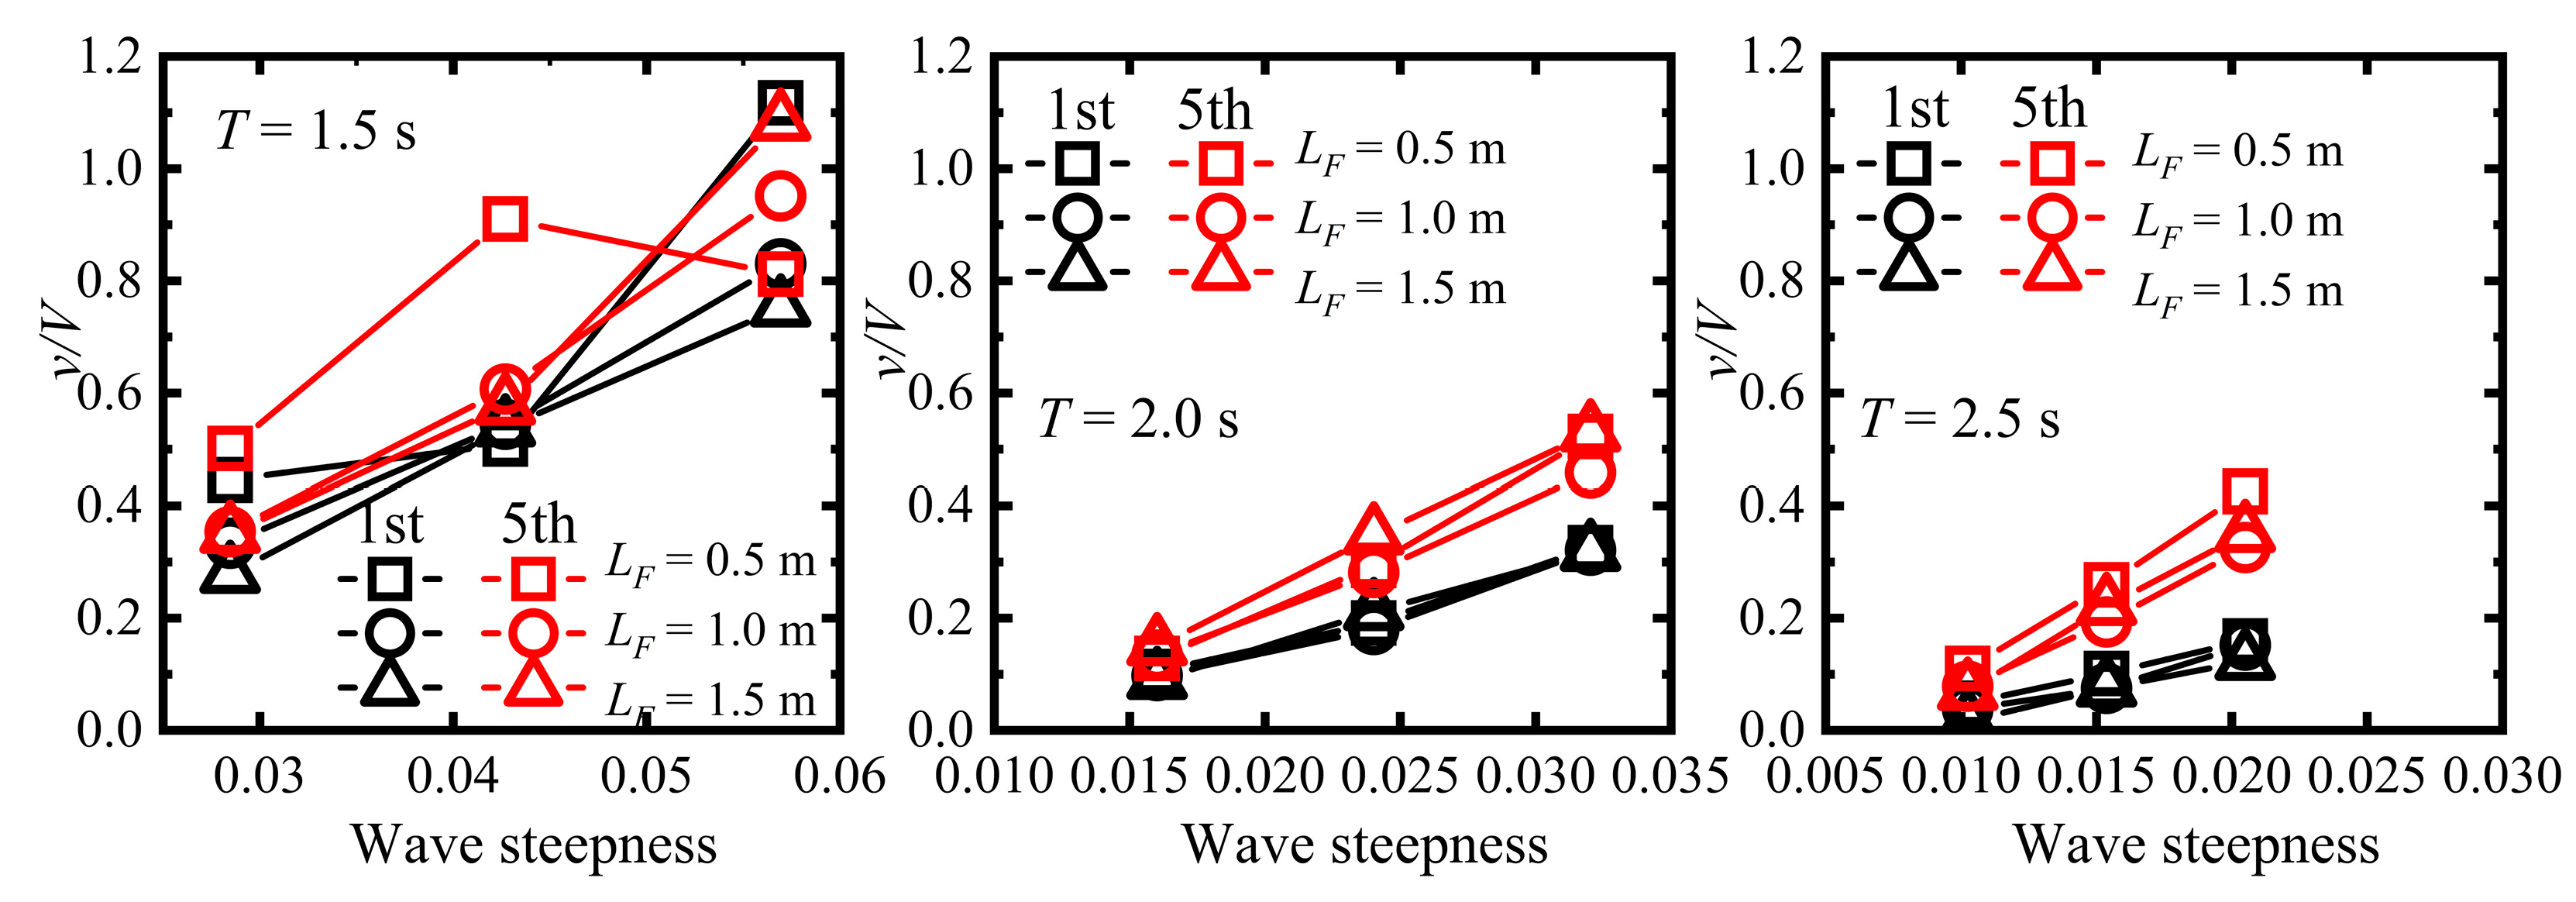
3.2. Influence of Wave Steepness on the Hydrodynamic Performance of Bio-DFADs

To further explore the motion response of Bio-DFADs under different wave conditions, the motion responses under different wave steepness were analyzed. As shown in Figure 15, the motion responses (heave RAO and pitch RAO) between the first-order and fifth-order waves varied with different wave steepness. Overall, the heave RAOs of Bio-DFADs in the first cycle were larger than those in the fifth cycle. In contrast, the pitch RAOs of Bio-DFADs in the first cycle were less than those in the fifth cycle. The fifth wave had a smaller total upward speed component than the first, resulting in a smaller wave force For the pitch RAOs, the fifth had a sharper crest and flatter trough than the first, and the incline between the crest and the trough was greater and more likely to lead to greater pitch RAOs during wave transportation. When the wave period T was constant, the heave RAOs increased as the wave steepness increased, and as the length LF increased, the heave RAOs decreased significantly. As the wave period T increased, the difference in the heave RAOs at different lengths LF decreased. For the pitch RAOs, when the wave period T was small, the pitch RAOs increased as the wave steepness increased, and as the length LF increased, the pitch RAOs had a different trend. As the wave period T increased, the pitch RAOs in the first increased with the wave steepness but decreased in the fifth. When the wave period increased, the pitch RAOs increased as the length LF increased, and the difference in the pitch RAOs at different lengths LF decreased as the wave steepness increased. The results suggested that wave steepness and length influenced the motion responses of Bio-DFADs, and as the wave period increased, the influence decreased. A larger length had lower heave and pitch RAOs. For fewer motion responses, a longer length (LF = 1.5 m) is recommended.
A dimensionless analysis of the relative velocity v/V of the Bio-DFADs between the first-order (first) and fifth-order (fifth) waves for different wave steepness was performed (Figure 16). In terms of overall trends, the relative velocity v/V in the first was less than that in the fifth. This is due to the difference in the waveform, wave energy, wave transmission velocity, and upward speed component between the first- and fifth-order waves. However, when the fifth waves interact with Bio-DFADs with larger wave steepness but smaller wave period, the wave energy tends to be lower, resulting in a lower relative velocity v/V. The relative velocity, v/V, exhibited different trends for different wave steepness and length LF. As the wave period T increases, the relative velocity v/V decreases, and the difference in the relative velocity v/V at different lengths decreases. This is due to the increased wave period and steepness, which allows for more waves to be transmitted through the Bio-DFAD with different lengths, interaction areas, and qualities. As the wave period increased, the wave transmission velocity decreased. As the wave steepness increased, the wave transmission velocity increased. Thus, the wave transmission velocity had a significant influence on the relative velocity v/V. The results indicated that wave steepness, wave period, and length LF had a significant influence on the relative velocity of Bio-DFADs.

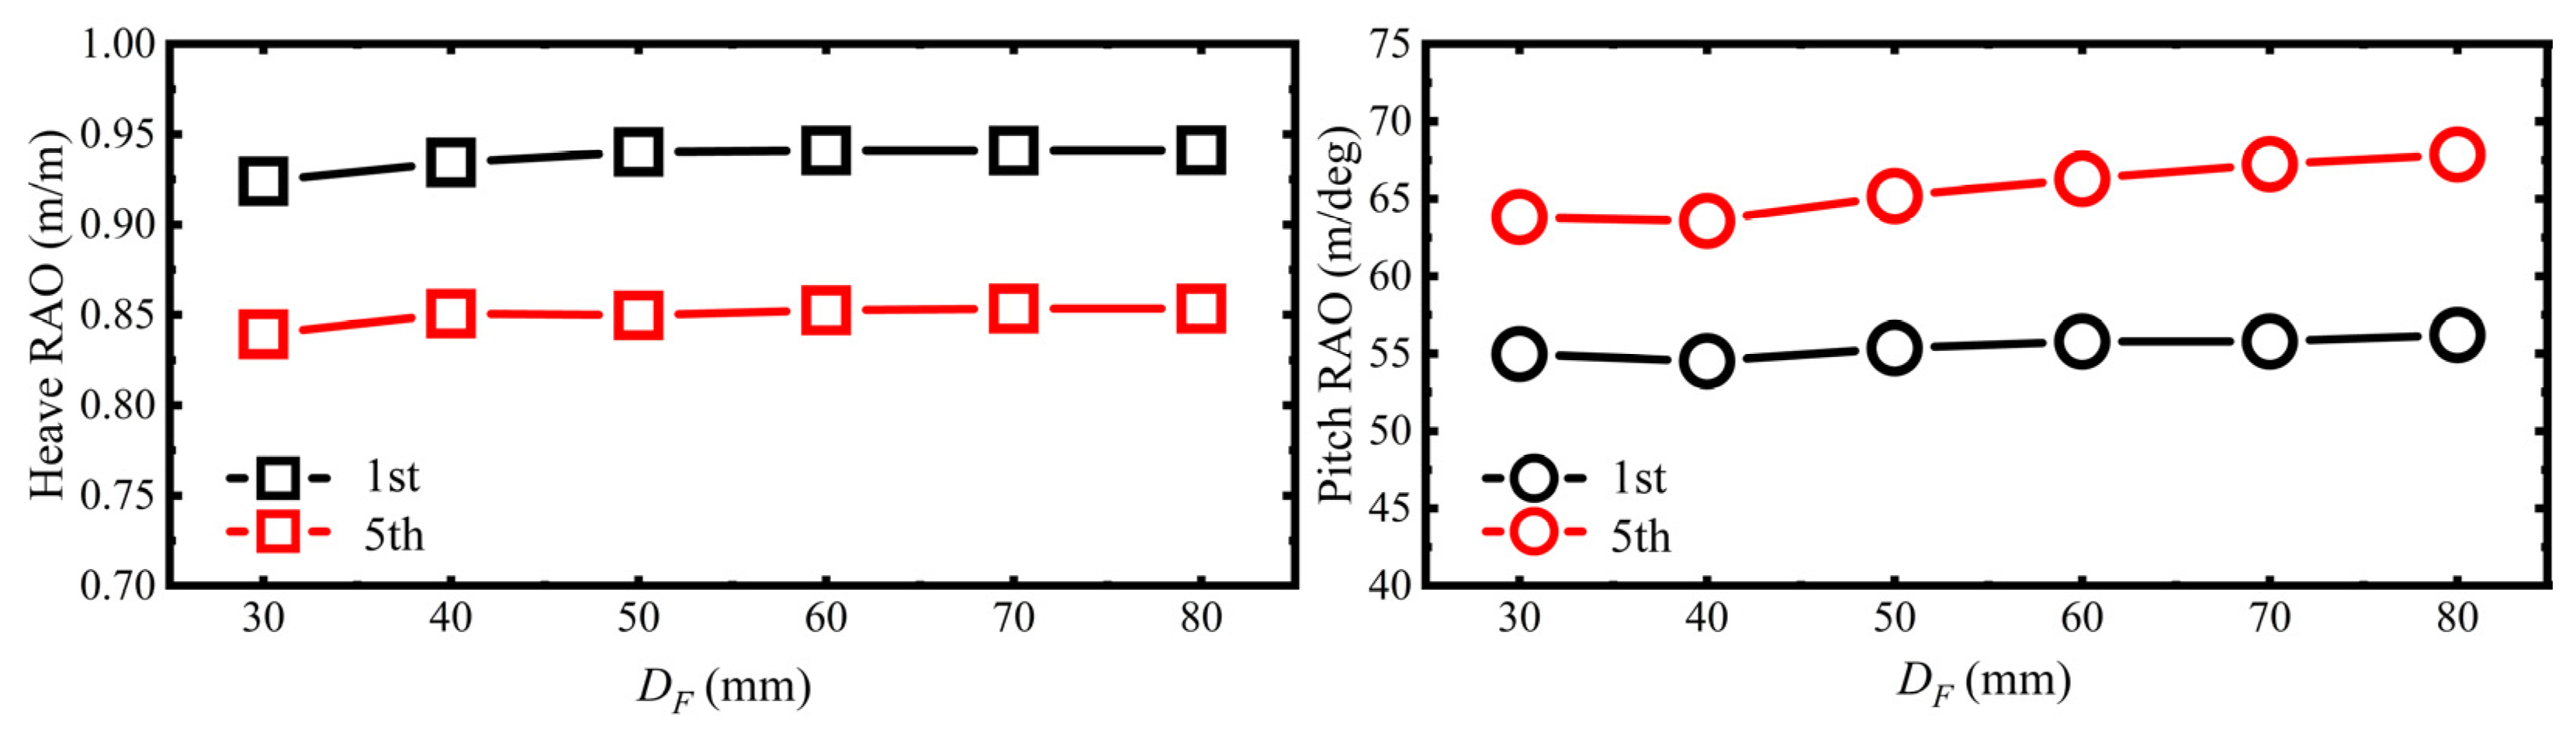
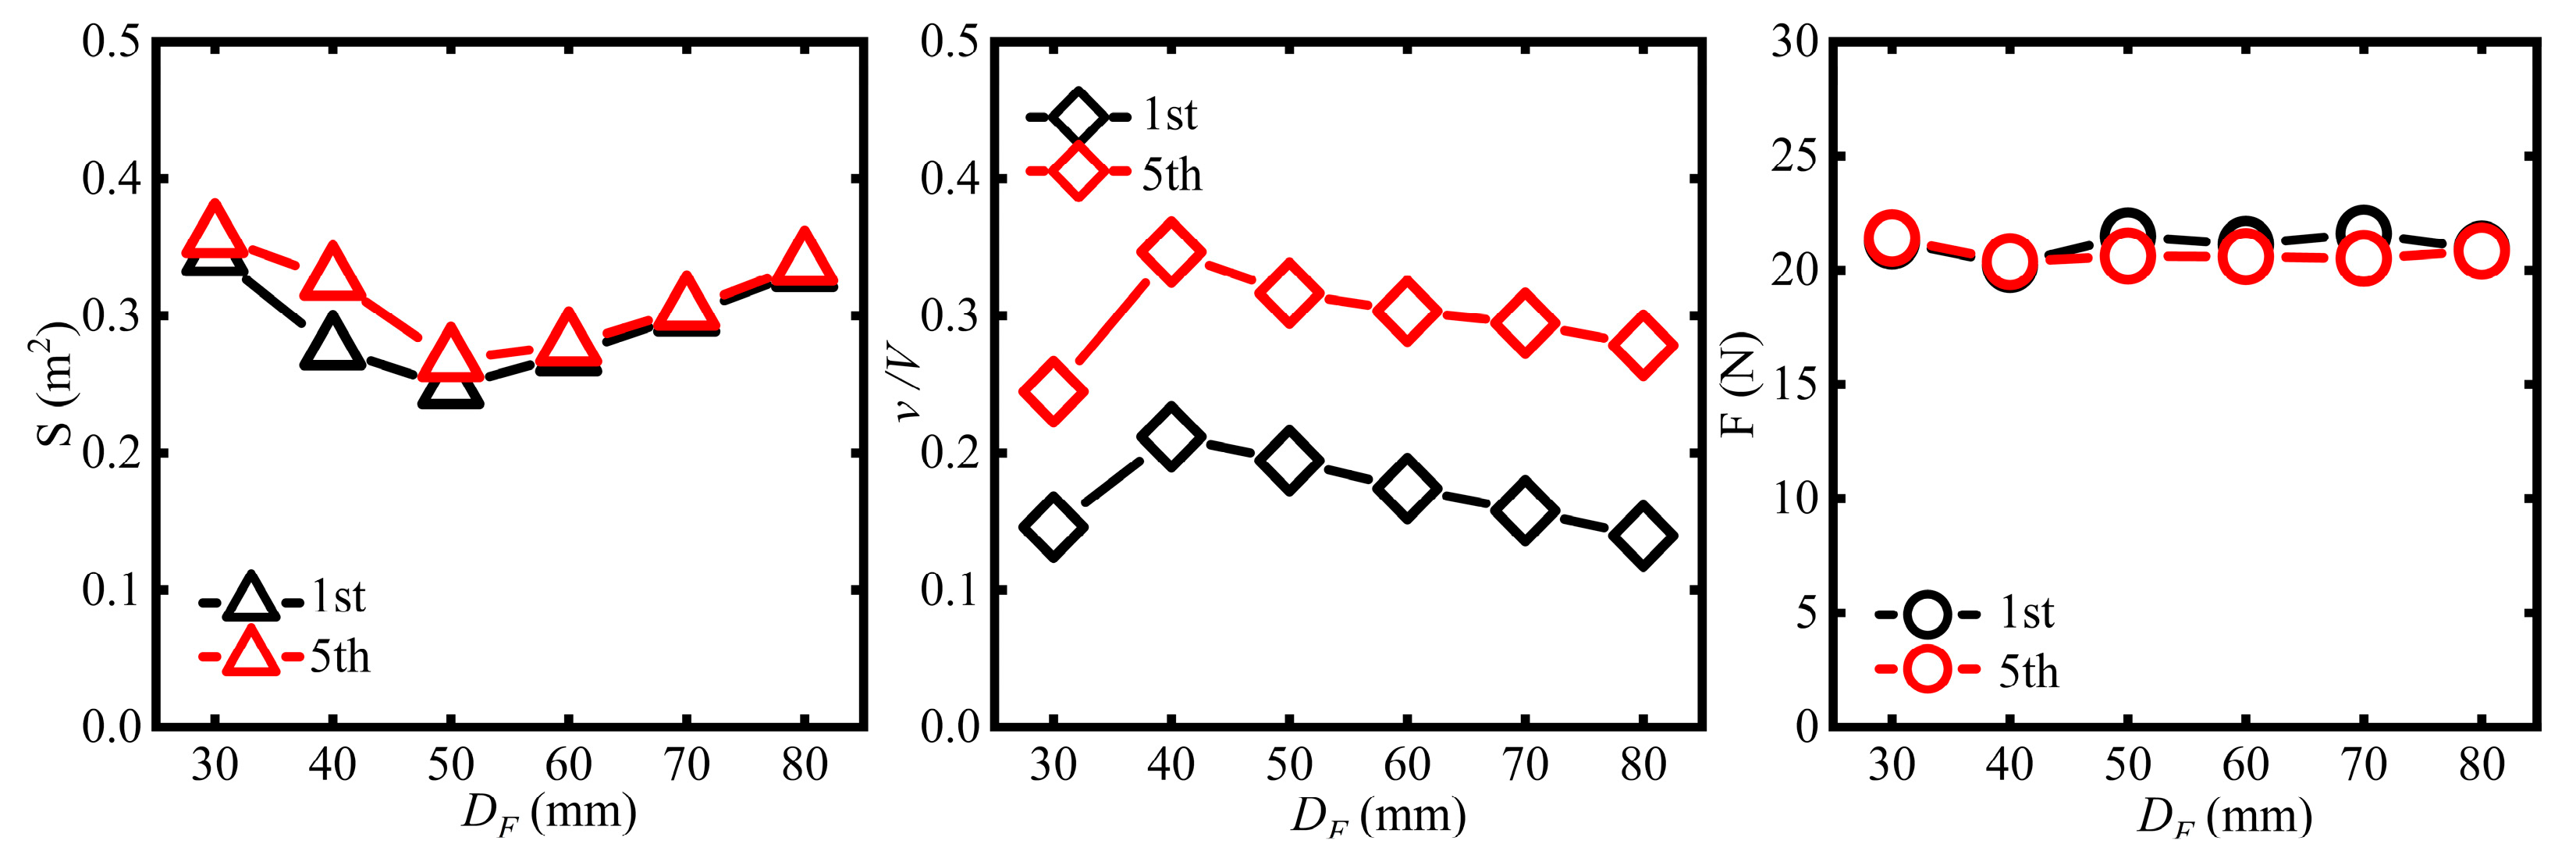
3.3. Influence of Balsa Wood Diameter on the Hydrodynamic Performance of Bio-DFADs

The motion responses of Bio-DFADs between the first-order (first) and fifth-order waves (fifth) in different diameters of the balsa wood were performed (L = 1.5 m, T = 2.0 s, H = 0.15 s) (Figure 17). The heave RAOs of Bio-DFADs in the first-order wave (first) were larger than the heave RAOs in the fifth-order wave (fifth), whereas the pitch RAOs of Bio-DFADs in the first wave were less than the pitch RAOs in the fifth wave. This is because, for the heave RAOs, the fifth wave had a smaller upward total speed component than the first, resulting in a smaller wave force For the pitch RAOs, the fifth had a sharper crest and flatter trough than the first, and the incline between the crest and the trough was greater and more likely to lead to greater pitch RAOs during wave transportation. As the diameter increased, the heave RAOs first increased and then stabilized, whereas the pitch RAOs first decreased, then increased, and finally stabilized. As mentioned above, as the diameter of Bio-DFADs and the interaction area with the wave increase, the wave force acting on the model increases, resulting in a subsequent increase in the pitch RAOs, and it has the same tendency towards equilibrium. As the diameter increases, the resulting values of the heave RAOs in the first wave are 0.924, 0.934, 0.940, 0.941, 0.941, and 0.941, respectively, and the pitch RAOs are 54.974, 54.517, 55.649, 55.780, 55.784, and 55.786, respectively. The results indicate that when the diameter is larger than 0.05 m, the differences in heave and pitch RAOs between different diameters are very small. The conclusion suggests that the buoyancy, gravity, and wave force may have reached the equilibrium as the diameter increases, and then the RAOs of the Bio-DFADs have no significant change. The results illustrate that balsa wood with a smaller diameter had lower heave RAOs and pitch RAOs. The relevant international fisheries organizations require that fish-aggregating devices should be smaller in size. Hence, balsa wood with a smaller dimensional diameter was recommended for designing the raft of Bio-DFADs.
In Figure 18, the influence of different diameters of the balsa wood on the wetted area S, relative velocity v/V, and rope tension F are shown. The relative velocities first increased and then decreased with increasing diameter, and the relative velocities in the first were significantly higher than those in the fifth. The wetted areas S first decreased and then increased as DF increased, and there were no significant differences between the first and fifth. For the first, as the diameter increased, the rope tensions were 21.286, 20.241, 21.482, 21.121, 21.608, and 20.918, respectively. For the fifth, the rope tensions were 21.405, 20.371, 20.613, 20.594, 20.513, and 20.831, respectively. The results indicate that as the diameter increased, the rope tension F showed no significant changes, and there was less of a difference between the diameters of the first and fifth. When the fifth waves interact with Bio-DFADs with larger wave steepness but smaller wave period, the wave energy tends to be lower, resulting in a lower relative velocity v/V. Initially, the relative velocity increased as the diameter of Bio-DFADs increased, and the wave force may have tended to increase in the horizontal direction. However, as the diameter increased, the weight of the model increased, and the force of gravity became greater than the wave force; therefore, the relative velocity tended to decrease. It is noteworthy that the wetted area minima and relative velocity maxima did not occur for the same diameter. The results suggested that the diameter of balsa wood had a significant influence on the relative velocity and wetted area but had no significant influence on rope tension. For Bio-DFADs, a smaller relative velocity was greater. Therefore, a DF of 30 mm is recommended.

4. Conclusions

In this study, the hydrodynamic performance of Bio-DFAD models in regular waves (first- and fifth-order waves) was numerically investigated. The heave RAOs, pitch RAOs, and relative velocities of Bio-DFADs were measured. The main conclusions are as follows:
  • The relative length LF/B and wave height H had a significant influence on the heave RAO, pitch RAO, and relative velocity of Bio-DFADs. The wave period T also has a significant influence on the relative velocity. For a lower heave RAO, pitch RAO, and relative velocity, a larger relative length (LF/B = 1.5) is recommended.
  • Wave steepness and length had a significant influence on the heave RAO, pitch RAO, and relative velocity. As the wave period increased, the influence of the wavelength on the heave RAO, pitch RAO, and relative velocity became increasingly insignificant. For a lower heave RAO, pitch RAO, and relative velocity, a longer length (LF = 1.5 m) is recommended.
  • The diameter of the balsa wood had a significant influence on the relative velocity and wetted area but had no significant influence on rope tension. Therefore, balsa wood with a smaller diameter (such as DF = 30 mm) should be selected based on the dimensional parameters of Bio-DFADs and regular wave conditions.
It should be noted that the interaction between the Bio-DFADs and different types of waves involves many factors, such as wave height, wavelength, wave steepness, relative length, relative width, diameters, and wetted area, and the coupling effect between these factors will be the focus of future research and provide insights for practical engineering applications of the Bio-DFAD structure design and stability assessment.

Author Contributions

Conceptualization, T.Z., J.Z., and R.W.; methodology, software, validation, formal analysis, investigation, visualization, and data curation, T.Z., Z.L., X.S., and J.C.; writing—original draft preparation, T.Z., J.Z., and R.W.; writing—review and editing, T.Z., J.Z., and R.W.; supervision, T.Z., J.Z., and R.W.; project administration, T.Z. and R.W.; funding acquisition, T.Z. and R.W. All authors have read and agreed to the published version of the manuscript.

Funding

This research was funded by the National Key R&D Program of China (Project No. 2023YFD2401301), the National Key R&D Program of China (Project No. 2023YFD2401305), and the Open Funding Project of the Key Laboratory of Sustainable Exploitation of Oceanic Fisheries Resources, Ministry of Education (Project No. A1-2006-23-200209).

Institutional Review Board Statement

Not applicable.

Informed Consent Statement

Not applicable.

Data Availability Statement

Data are contained within the article, and are available from the corresponding author upon reasonable request.

Acknowledgments

The authors would like to thank the Shanghai Ocean University members for their help with modeling and analysis.

Conflicts of Interest

The authors declare no conflicts of interest.

References

  1. Imzilen, T.; Lett, C.; Chassot, E.; Maufroy, A.; Goujon, M.; Kaplan, D.M. Recovery at sea of abandoned, lost or discarded drifting fish aggregating devices. Nat. Sustain. 2022, 5, 593–602. [Google Scholar] [CrossRef]
  2. Maufroy, A.; Chassot, E.; Joo, R.; Kaplan, D.M. Large-Scale Examination of Spatio-Temporal Patterns of Drifting Fish Aggregating Devices (dFADs) from Tropical Tuna Fisheries of the Indian and Atlantic Oceans. PLoS ONE 2015, 10, e0128023. [Google Scholar] [CrossRef]
  3. Imzilen, T.; Lett, C.; Chassot, E.; Kaplan, D.M. Spatial management can significantly reduce dFAD beachings in Indian and Atlantic Ocean tropical tuna purse seine fisheries. Biol. Conserv. 2021, 254, 108939. [Google Scholar] [CrossRef]
  4. ISSF. Status of the World Fisheries for Tuna; ISSF Technical Report; International Seafood Sustainability Foundation: Pittsburgh, PA, USA, 2023. [Google Scholar]
  5. Bode, M.; Game, E.T.; Wegmann, A.; Pollock, K. Fish aggregating devices could enhance the effectiveness of blue water marine protected areas. Conserv. Lett. 2023, 16, e12984. [Google Scholar] [CrossRef]
  6. Escalle, L.; Hare, S.R.; Vidal, T.; Brownjohn, M.; Hamer, P.; Pilling, G. Quantifying drifting Fish Aggregating Device use by the world’s largest tuna fishery. ICES J. Mar. Sci. 2021, 78, 2432–2447. [Google Scholar] [CrossRef]
  7. Murua, J.; Moreno, G.; Hall, M.; Dagorn, L.; Itano, D.; Restrepo, V. Towards Global Non-Entangling Fish Aggregating Device (FAD) Use in Tropical Tuna Purse Seine Fisheries through a Participatory Approach; ISSF Technical Report; International Seafood Sustainability Foundation: Washington, DC, USA, 2017. [Google Scholar]
  8. Zudaire, I.; Moreno, G.; Murua, J.; Murua, H.; Tolotti, M.; Roman, M.; Hall, M.; Lopez, J.; Grande, M.; Merino, G.; et al. Biodegradable DFADs: Current Status and Prospects. In Proceedings of the 2nd IOTC Ad Hoc Working Group on FADs (WGFAD02) 2021, Online/Virtual, 4–6 October 2021; IOTC-2021-WGFAD02-09, 9p. Available online: https://archimer.ifremer.fr/doc/00727/83862/ (accessed on 9 February 2021).
  9. Zudaire, I.; Santiago, J.; Grande, M.; Murua, H.; Adam, P.A.; Nogués, P.; Collier, T.; Morgan, M.; Khan, N.; Baguette, F.; et al. FAD Watch: A collaborative initiative to minimize the impact of FADs in coastal ecosystems. In Proceedings of the 14th IOTC Working Party on Ecosystems and Bycatch 2018, Cape Town, South Africa, 10–14 September 2018. [Google Scholar]
  10. Moreno, G.; Salvador, J.; Zudaire, I.; Murua, J.; Pelegrí, J.L.; Uranga, J.; Murua, H.; Grande, M.; Santiago, J.; Restrepo, V. The jelly-FAD: A paradigm shift in the design of biodegradable fish aggregating devices. Mar. Policy 2022, 174, 105352. [Google Scholar] [CrossRef]
  11. Dagorn, L.; Holland, K.N.; Restrepo, V.; Moreno, G. Is it good or bad to fish with FADs? What are the real impacts of the use of drifting FADs on pelagic marine ecosystems? Fish Fish. 2013, 14, 391–415. [Google Scholar] [CrossRef]
  12. Pons, M.; Kaplan, D.; Moreno, G.; Escalle, L.; Abascal, F.; Hall, M.; Restrepo, V.; Hilborn, R. Benefits, concerns, and solutions of fishing for tunas with drifting fish aggregation devices. Fish Fish. 2023, 24, 979–1002. [Google Scholar] [CrossRef]
  13. Wan, R.; Zhang, T.; Zhou, C.; Zhao, F.; Wang, W. Experimental and numerical investigations of hydrodynamic response of biodegradable drifting Fish Aggregating Devices (FADs) in waves. Ocean Eng. 2022, 244, 110436. [Google Scholar] [CrossRef]
  14. Rahmawati, S.; Mutsuda, H.; Doi, Y.; Moriyama, Y. Characteristics of a fish aggregating device with ocean energy harvester. J. Mar. Sci. Technol. 2018, 23, 435–452. [Google Scholar] [CrossRef]
  15. Du, X.; Mutsuda, H.; Tanaka, Y.; Nakashima, T.; Kanehira, T.; Taniguchi, N.; Moriyama, Y. Experimental and numerical studies on working parameter selections of a piezoelectric-painted-based ocean energy harvester attached to fish aggregating devices. Energy Sustain. Dev. 2022, 71, 73–88. [Google Scholar] [CrossRef]
  16. Hou, T.; Sun, H.; Jiao, B.; Wang, G.; Lin, H.; Liu, H.; Gao, B. Numerical and experimental study of oil boom motion response and oil-stopping effect under wave-current action. Ocean Eng. 2024, 291, 116439. [Google Scholar] [CrossRef]
  17. Moreno, G.; Murua, J.; Kebe, P.; Scott, J.; Restrepo, V. Design Workshop on the Use of Biodegradable Fish Aggregating Devices in Ghanaian Purse Seine and Pole and Line Tuna Fleets; ISSF Technical Report; International Seafood Sustainability Foundation: Washington, DC, USA, 2018. [Google Scholar]
  18. Moreno, G.; Salvador, J.; Murua, J.; Phillip, N.B., Jr.; Murua, H.; Escalle, L.; Ashigbui, B.; Zudaire, I.; Pilling, G.; Restrepo, V. A multidisciplinary approach to build new designs of biodegradable Fish Aggregating Devices (FADs). In Scientific Committee Sixteenth Regular Session; WCPFC: Washington, DC, USA, 2020. [Google Scholar]
  19. Ferziger, J.H.; Perić, M. Computational Methods for Fluid Dynamics; Springer: New York, NY, USA, 2002. [Google Scholar]
  20. Lin, P.; Liu, P.L.F. A Numerical Study of Breaking Waves in the Surf Zone. J. Fluid Mech. 1998, 359, 239–264. [Google Scholar] [CrossRef]
  21. Rodi, W. Turbulence Models and Their Application in Hydraulics; Routledge: London, UK, 2000; p. 124. [Google Scholar] [CrossRef]
  22. Hirt, C.W.; Nichols, B.D. Volume of Fluid (VOF) method for the dynamics of free boundaries. J. Comput. Phys. 1981, 39, 201–225. [Google Scholar] [CrossRef]
  23. Ravenna, R.; Song, S.; Shi, W.; Sant, T.; Muscat-Fenech, C.D.M.; Tezdogan, T.; Demirel, Y.K. CFD analysis of the effect of heterogeneous hull roughness on ship resistance. Ocean Eng. 2022, 258, 111733. [Google Scholar] [CrossRef]
  24. Fenton, J.D. A fifth-order Stokes theory for steady waves. J. Waterw. Port Coast. Ocean Eng. 1985, 111, 216–234. [Google Scholar] [CrossRef]
  25. Kraskowski, M. Simulating hull dynamics in waves using a RANSE code. Ship Technol. Res. 2010, 57, 120–127. [Google Scholar] [CrossRef]
  26. Ha, T.; Lee, J.W.; Cho, Y.-S. Internal Wave Maker for Navier-Stokes Equations in a Three-Dimensional Numerical Model. J. Coast Res. 2011, 511–515. Available online: http://www.jstor.org/stable/26482225 (accessed on 9 May 2011).
  27. Kim, J.; O’Sullivan, J.; Read, A. Ringing analysis of a vertical cylinder by Euler overlay method. In: International Conference on Offshore Mechanics and Arctic Engineering. Am. Soc. Mech. Eng. 2012, 44915, 855–866. [Google Scholar] [CrossRef]
  28. Wang, X.; Xie, J.; Luo, Y.; Wang, X.; Guo, G.; You, X. Experimental Investigation of the Hydrodynamic Characteristics of Longline Aquaculture Facilities under Current and Wave Conditions. Fishes 2023, 8, 204. [Google Scholar] [CrossRef]
  29. Xu, P.; Zhang, Z.; Li, S.; Song, Q.; Liu, W. Numerical Investigation into the Dynamic Responses of Floating Photovoltaic Platform and Mooring Line Structures under Freak Waves. J. Mar. Sci. Eng. 2024, 12, 96. [Google Scholar] [CrossRef]
  30. Cutajar, C.; Sant, T.; Farrugia, R.N.; Buhagiar, D. Analysis of the Wave Attenuating and Dynamic Behaviour of a Floating Breakwater Integrating a Hydro-Pneumatic Energy Storage System. J. Mar. Sci. Eng. 2023, 11, 2189. [Google Scholar] [CrossRef]
  31. Gao, Q.; Song, L.; Yao, J. RANS Prediction of Wave-Induced Ship Motions, and Steady Wave Forces and Moments in Regular Waves. J. Mar. Sci. Eng. 2021, 9, 1459. [Google Scholar] [CrossRef]
  32. Dai, J.; Wang, C.M.; Utsunomiya, T.; Duan, W. Review of recent research and developments on floating breakwaters. Ocean Eng. 2018, 158, 132–151. [Google Scholar] [CrossRef]
Figure 1. Model sketch of the Bio-DFADs.
Fishes 09 00112 g001
Figure 2. Computational domain (a) and boundary conditions (b) of the Bio-DFAD simulations model.
Fishes 09 00112 g002
Figure 3. Sketch of the EOM-based wave-forcing zone.
Fishes 09 00112 g003
Figure 4. Mesh sensitivity analysis test: L/Δx and H/Δx.
Fishes 09 00112 g004
Figure 5. Time-step sensitivity test.
Fishes 09 00112 g005
Figure 6. Comparison of wave elevation between the numerical simulation and theoretical values.
Fishes 09 00112 g006
Figure 7. Mesh generation: (a) overview, (b) overset region, and (c) prism layer.
Fishes 09 00112 g007
Figure 8. Comparison of the motion response of Bio-DFADs between the first-order and fifth-order waves in one wave period; top view.
Fishes 09 00112 g008
Figure 9. Comparison of the motion response of Bio-DFADs between the first-order and fifth-order waves in one wave period; front view.
Fishes 09 00112 g009
Figure 10. Comparison of the motion response of Bio-DFADs between the first-order and fifth-order waves in one wave period; side view.
Fishes 09 00112 g010
Figure 11. Velocity magnitude contours of Bio-DFADs between the first-order and fifth-order waves in one wave period; side view.
Fishes 09 00112 g011
Figure 12. Pressure distribution contours of Bio-DFADs between the first-order and fifth-order waves in one wave period; top view.
Fishes 09 00112 g012
Figure 13. Motion responses of Bio-DFADs between first-order (1st) and fifth-order waves (5th) for different relative lengths.
Fishes 09 00112 g013
Figure 14. Relative velocities of Bio-DFADs between first-order (1st) and fifth-order waves (5th) for different relative lengths.
Fishes 09 00112 g014
Figure 15. Motion responses of Bio-DFADs between first-order (1st) and fifth-order (5th) waves in different wave steepness.
Fishes 09 00112 g015
Figure 16. Relative velocities of Bio-DFADs between first-order (1st) and fifth-order (5th) waves for different wave steepness.
Fishes 09 00112 g016
Figure 17. Motion responses of Bio-DFADs between first-order (1st) and fifth-order (5th) waves for different diameters of the balsa wood.
Fishes 09 00112 g017
Figure 18. Wetted area, relative velocity, and rope tension of Bio-DFADs between first-order (1st) and fifth-order (5th) waves for different diameters of balsa wood.
Fishes 09 00112 g018
Table 1. Main characteristics of the Bio-DFADs model.
Main CharacteristicsParameterValue (m)
Lengths of Bio-DFADsLF0.50, 1.00, 1.50
Width of Bio-DFADsB1.00
Diameters of balsa woodDF0.03, 0.04, 0.05, 0.06, 0.07, 0.08
Length of ropedF0.60
Table 2. Details of the Bio-DFAD models.
Model No.LF (m)DF (m)Sinker (kg)
10.500.042.00
21.000.042.00
31.500.042.00
41.500.032.00
51.500.052.00
61.500.062.00
71.500.072.00
81.500.082.00
Table 3. Details of the buoyancy of each experimental Bio-DFADs model.
DF (m)0.030.040.050.060.070.08
LF (m)
0.50182.32 N216.30 N259.98 N313.38 N376.48 N449.30 N
1.00196.88 N242.19 N300.44 N371.62 N455.77 N552.85 N
1.50211.44 N268.07 N340.88 N429.87 N535.05 N656.40 N
Table 4. Parameters of regular waves.
Wave TypeWave Period T (s)Wave Height H (m)
First-order wave1.50.10
2.00.15
2.50.20
1.50.10
Fifth-order wave2.00.15
2.50.20
Table 5. Mesh parameters of each mesh scheme.
RegionTime Step (s)Cell Number (N)
Wave height (1 H)0.00510, 20, 40
Wavelength (1 L)0.00544, 88, 176
Disclaimer/Publisher’s Note: The statements, opinions and data contained in all publications are solely those of the individual author(s) and contributor(s) and not of MDPI and/or the editor(s). MDPI and/or the editor(s) disclaim responsibility for any injury to people or property resulting from any ideas, methods, instructions or products referred to in the content.

