Article

Sicklefin Chub (Macrhybopsis meeki) and Sturgeon Chub (M. gelida) Temporal and Spatial Patterns from Extant Population Monitoring and Habitat Data Spanning 23 Years

1
Columbia Environmental Research Center, U.S. Geological Survey (USGS), 4200 New Haven Road, Columbia, MO 65201, USA
2
Upper Midwest Environmental Science Center, U.S. Geological Survey (USGS), 2630 Fanta Reed Road, La Crosse, WI 54603, USA
3
Department of Ecology, Evolution, and Organismal Biology, Kennesaw State University, 370 Paulding Ave NW, Kennesaw, GA 30144, USA
*
Author to whom correspondence should be addressed.
Fishes 2024, 9(2), 43; https://doi.org/10.3390/fishes9020043
Submission received: 30 September 2023 / Revised: 9 January 2024 / Accepted: 11 January 2024 / Published: 23 January 2024
(This article belongs to the Special Issue Biomonitoring and Conservation of Freshwater & Marine Fishes)

Abstract

:
Sicklefin (Macrhybopsis meeki) and sturgeon chub (M. gelida) historically occurred throughout the Missouri River (MR), in some tributaries, and Mississippi River downstream of the MR. They have been species of U.S. state-level conservation concern and U.S. Endangered Species Act listing candidates since the 1990s. We applied analytical approaches from occupancy modeling to correlation to monitoring data spanning 23 years to assess relationships between occupancy and time, space, environmental factors, habitat, and other species. Sicklefin chub occupancy appeared higher in the early to mid-2000s and mid-to-late 2010s. A potential decline in occupancy occurred for sturgeon chub in the mid-to-late 2010s. Spatially, chub occupancy was depressed for 159 to 438 km downstream of MR dams. Among macrohabitats, inside bends had relatively high occupancy for both species; secondary connected channels had relatively high values for sturgeon chub. Co-occurrence was likely between sicklefin and sturgeon chub and between chubs and shovelnose sturgeon (Scaphirhybchus platorybchus) and channel catfish (Ictalurus punctatus). The observed co-occurrence of chubs and pallid sturgeon (Scaphirhynchus albus; PS) was potentially higher than expected for adult PS. For juvenile PS, co-occurrence was lower than expected in the Lower MR and potentially higher than expected in the Upper MR, warranting future research. Results from this research suggest management for the improvement of sicklefin and sturgeon chub populations may benefit other MR fish populations.
Key Contribution: Based on monitoring data spanning 23 years (1996 to 2018), we found sicklefin chub occupancy to be higher in the early to mid-2000s and mid-to-late 2010s, in contrast to a decline for sturgeon chub in mid-to-late 2010s. We also found lower site occupancy by chubs below dams, with inside bend macrohabitat having the highest chub occupancy for both chub species and a very strong co-occurrence between sicklefin and sturgeon chub and between chubs and shovelnose sturgeon and channel catfish, suggesting management for the improvement of sicklefin and sturgeon chub populations may benefit other Missouri River fish populations.

1. Introduction

Sicklefin chub (Macrhybopsis meeki) and sturgeon chub (M. gelida) have historical ranges throughout the mainstem Missouri River (MR) and in selected tributaries and the mainstem Mississippi River downstream from the confluence with the MR, where they are an important part of the benthic fish community [1,2]. However, analysis of annual fish monitoring surveys has indicated declining population trends in these chubs prior to 2010 [3]. Sicklefin chub is on state-level conservation concern lists in Montana, South Dakota, Iowa, Kentucky, North Dakota, Nebraska, Kansas, Missouri, and Tennessee. Sturgeon chub is listed as a conservation concern in these states, as well as in Wyoming and Illinois. Both species have been candidate species for listing under the United States Endangered Species Act (ESA) since the 1980s and 1990s [4]. In 2001, the 12-month finding for sicklefin and sturgeon chub found they did not warrant listing under the ESA but documented losses of over 46% and 45% of their historical habitat in the MR basin, respectively [4]. These results, along with the U.S. Fish and Wildlife Service (USFWS) 12-month finding in 2001 [4], motivated USFWS to produce an assessment in 2023 investigating whether sicklefin and sturgeon chub warranted listing as threatened or endangered. Following the 2016 petition to list these chub species under ESA [4] and the apparent declines of both chub species in recent years, USFWS reassessed the status of both species and did not find definitive evidence for listing in 2023 [5]. Despite the 2023 decision not to list these species, the variation in patterns presented in the 2023 assessment highlight the need to further investigate sicklefin and sturgeon chub trends spatially, temporally, and relative to abiotic and biotic factors to help determine whether they are prone to further declines.
Sicklefin and sturgeon chub are components of the diet of adult federally listed endangered pallid sturgeon (Scaphirhynchus albus). Pallid sturgeon consume chubs as a large part of their diet [6]. Given that over 175,000 pallid sturgeon have been stocked into the MR between 1992 and 2017 [7], it is possible that increased predation on chubs may have reduced sicklefin and sturgeon chub populations. Additionally, pallid sturgeon diet and dependency on fish prey were also identified as a top priority in a 2004 assessment of research needs for pallid sturgeon research on the Missouri River [8]. Chubs are also consumed by walleye (Sander vitreus), sauger (Sander canadensis), and a variety of piscivorous fishes, birds, and mammals [9].
Past activities associated with river or fish species management may have either degraded or improved conditions for sicklefin and sturgeon chub. The U.S. Army Corps of Engineers (USACE) Missouri River Recovery Program’s current channel reconfiguration efforts are focused on interception-rearing complexes for juvenile pallid sturgeon, i.e., modifying hydrologic conditions to promote free-floating pallid sturgeon juveniles’ arrival in suitable nursery habitat [10]. By 2014, USACE channel reconfiguration through dike notching, top-width widening, and side channel addition activities have modified the majority of dikes in the MR to gain shallow water habitat credit for pallid sturgeon recovery. Current research is limited as to how these activities affect MR sicklefin and sturgeon chub populations. However, Ridenour et al. [11,12] reported a loss of chub nursery habitat due to dike notching activities.
In support of USFWS management decisions associated with sicklefin and sturgeon chub, there is a need for comprehensive, long-term data analyses of both chub populations. The only such data to date have been collected on the MR and Kansas River (KR). Two large data sources for sicklefin and sturgeon chub and a wide range of other species are the MR Benthic Fishes Study (MRBFS) [13] and the Pallid Sturgeon Population Assessment Project (PSPAP) [3]. Since the MR represents a major portion of the historical range of both species [14], these data can provide valuable insight into their management. Previous studies using these data have documented declines in sicklefin and sturgeon chub populations [3,15], along with other anecdotal observations from practitioners.
Occupancy models predict species occurrences while accounting for imperfect detection, i.e., the fact that species can be undetected where they are present [16]. When assessing habitat associations for a species, occupancy models can reduce the bias compared to models that use relative abundance data without accounting for imperfect detection [17,18]. In addition to their ability to reduce bias compared to other methods, occupancy models can be useful for rare or hard-to-detect species, allowing researchers to evaluate occurrence trends [19]. Sicklefin and sturgeon chub are difficult to detect; a detection-focused occupancy modeling research study in the Lower MR found detection probabilities in benthic trawls ranging from approximately 0.05 to 0.48 [20]. In terms of rarity, other research suggests that these species are in low densities in the MR, with only 18.46% and 5.41% of benthic trawl deployments catching sicklefin and sturgeon chub, respectively, in the Lower MR [3]. In the context of other fish species of conservation concern, occupancy modeling has been used to investigate the effects of water development on imperiled fish species in the deserts of the Southwestern United States and to assess the validity of managing these species as one unit [21]. One group of occupancy models, multispecies occupancy models, can be used to examine interactions among species that affect co-occurrence [22,23]. For example, two-species occupancy models were created for threatened eastern sand darter (Ammocrypta pellucida) with the goal of informing reintroduction efforts based on interaction with other species [24]. Because occupancy and detection rates are often related to abundance [25], determining factors related to the occupancy of sicklefin and sturgeon chubs could also provide insight into factors related to population expansion and contraction and changes in overall population size over space and time.
Because of their potential rarity and the relative importance of sicklefin and sturgeon chub as prey for the endangered pallid sturgeon, there is a need to develop a better understanding of the relationship between system conditions and sicklefin and sturgeon chub populations, and how these conditions may help quantify the associated risk of chub declines. The goal of this study is to better understand how the occurrence patterns of sicklefin and sturgeon chub in the MR are related to abiotic and biotic factors, with the expectation that this information would inform USFWS efforts in assessing the current status of these two chub species, as well as future conservation of these species. To do so, this study used PSPAP and MRBFS data and multiple analytical approaches to (1) describe temporal, spatial, and environmental factors associated with the occupancy patterns of sicklefin and sturgeon chub, (2) assess the co-occurrence of the two chub species, (3) assess the relationship between annual site occupancy coefficients and river discharge, and (4) investigate the co-occurrence patterns of these chub species with other important fish species found in the MR benthic fish community using either three-species occupancy models or comparisons of observed co-occurrence.

2. Materials and Methods

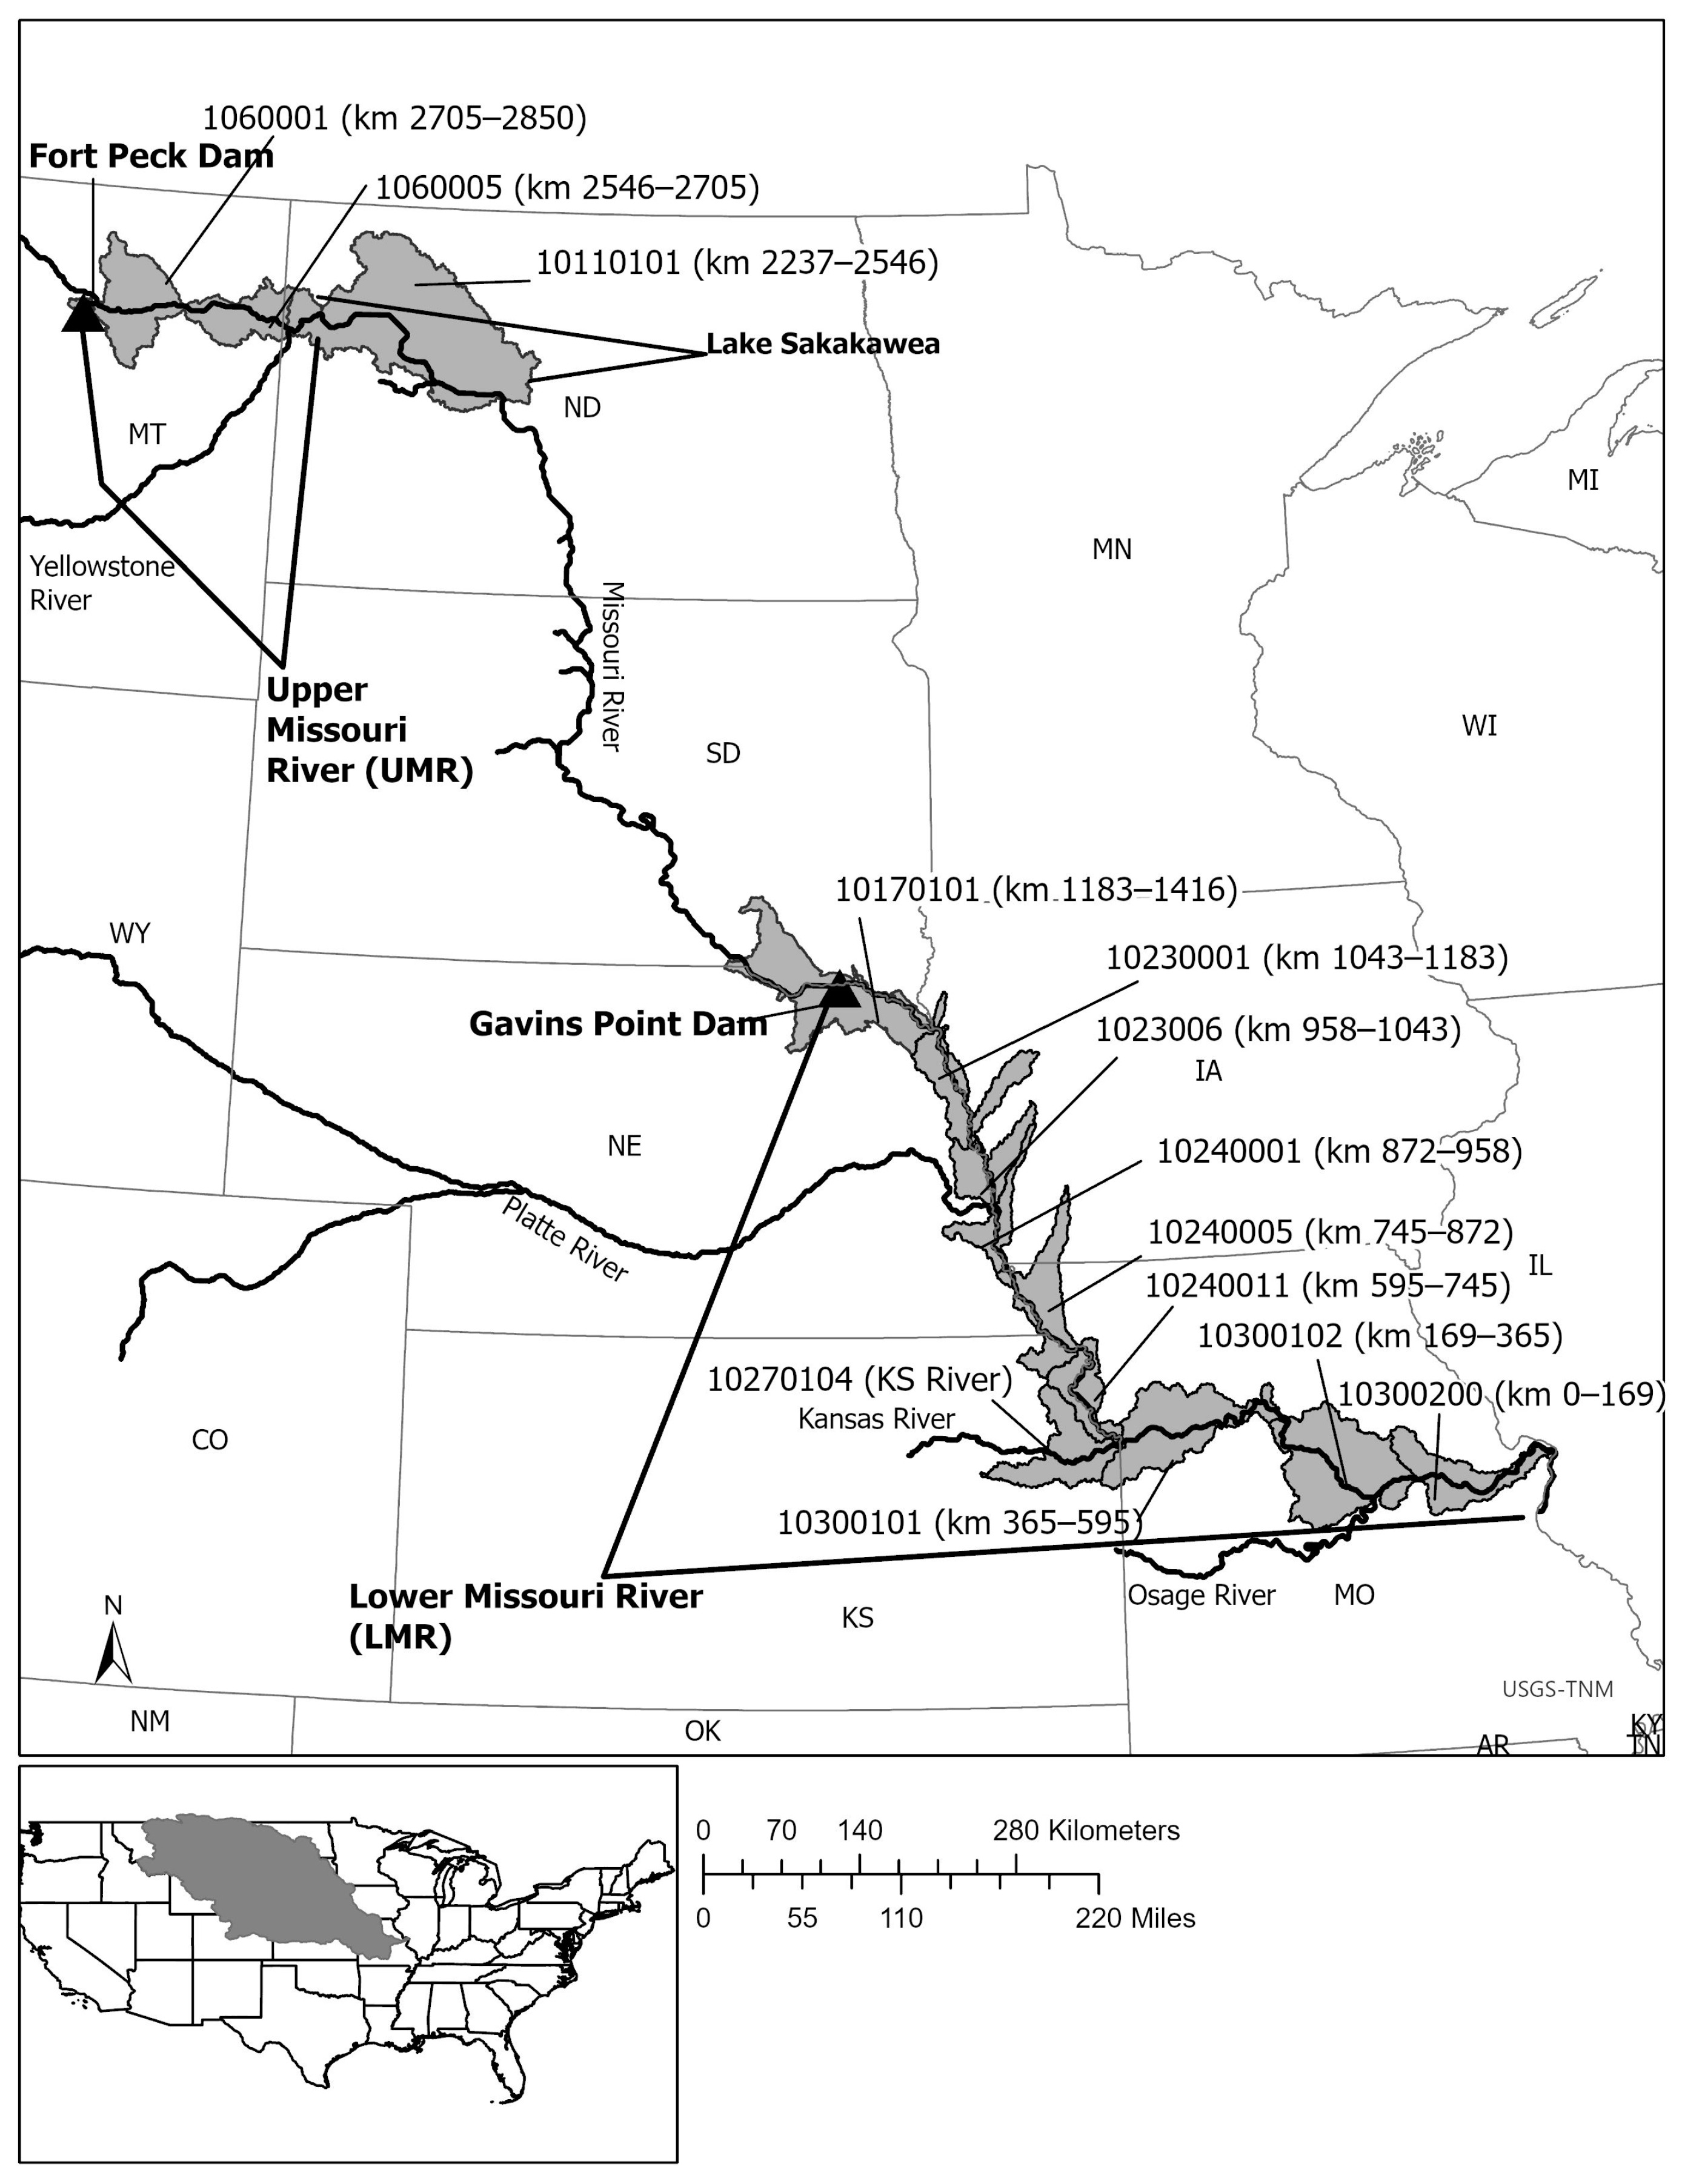
2.1. Extant Data and Study Area

To inform models for sicklefin and sturgeon chub, we used extant data from two projects, the Missouri River Benthic Fishes Study (MRBFS) and the Pallid Sturgeon Population Assessment Project (PSPAP). The MRBFS was conducted from 1996 to 1998, sampling benthic fishes and environmental variables in the mainstem of the MR and lower portion of the Yellowstone River [13,26]. The PSPAP began in the fall of 2003 and sampled fish species in the Missouri River from Fort Peck Dam to the confluence with the Mississippi River [3,27]. The PSPAP was divided into two seasons: fish community season from 1 July to 31 October, focused on sampling small, juvenile pallid sturgeon and the fish community, and sturgeon season, when colder water temperatures allowed for the use of gill nets to catch larger juvenile and adult pallid sturgeon with a decreased chance for mortality from stress. For our analyses of PSPAP data, we used data from the fish community season because the sampling was consistent and used types of gear aimed at catching non-pallid sturgeon species [28]. We only used PSPAP data collected between 2003 and 2018, due to large changes in protocol in 2019 that eliminated the fish community season [10].
Both projects used stratified, random sampling of locations and divided sampling locations into macrohabitats including main-channel crossover, outside bend, inside bend, tributary mouth, secondary connected channel, and secondary non-connected channel. Both projects collected the following water conditions: depth, velocity, temperature, and turbidity. For more information on MRBFS and PSPAP, see Appendix A, associated MRBFS data release [29], PSPAP Standard Operation Procedure [27], and previous studies incorporating these data sets [3,13].
For our analyses, the study area encompassed two regions of the MR, the Upper MR (UMR) and the Lower MR (LMR), and the Lower Kansas River (Figure 1). For the purposes of this study, we defined the UMR as the 8-digit Hydrologic Unit Code (HUC 8) subbasins [30] containing mainstem MR between Fort Peck Dam (MR kilometer 2850) and Lake Sakakawea (MR kilometer 2546). We defined the LMR as the HUC 8 subbasins containing the mainstem MR just upstream of Gavins Point Dam (MR kilometer 1416) to the MR confluence with the Mississippi River (MR kilometer 0). These sections were the only MR sections used in this study because they were sampled in the PSPAP at least 75% of the years between 2003 and 2018; tributaries other than the Kansas River were not part of the standard sampling protocol [10,27]. Reservoirs were also excluded because the focus was on riverine species. Importantly, dams along the mainstem MR, such as Fort Peck and Gavins Point dams, are hydro-electric dams.

2.2. Benthic Fish Species of Interest

Although sicklefin and sturgeon chub were the primary species of interest in this study, we also wanted to investigate potential interactions of these two chub species with other species in the MR benthic fish community. Channel catfish (Ictalurus punctatus) was included in this study because of its recreational value [31] and to investigate the hypothesis of high co-occurrence of chubs and channel catfish. Channel catfish are found in similar riverine macrohabitats as sicklefin and sturgeon chub [13,32]. If co-occurrence exists, it may suggest that management actions that improve sicklefin and sturgeon chub populations could also improve channel catfish status and vice versa.
Shovelnose sturgeon (Scaphirhynchus platorynchus) was included in this study because of its potential for competition for habitat and food resources with sicklefin and sturgeon chub [33] and piscivorous species such as pallid sturgeon, sauger, and walleye. Pallid sturgeon were chosen for their potential roles as competitors to chubs in their juvenile stage and predators of chubs as adults [34,35]. Sauger and walleye were chosen due to their role as potential chub predators since they are known to prey on benthic fishes of similar size to chubs [36].

2.3. Data Processing

Prior to modeling, we used several data filtering and processing steps. A summary of these steps is provided here; more detailed information is contained in Appendix B. The purpose of these steps was to ensure that the data used to fit our occupancy models (1) fell within standard sampling protocols for the PSPAP and the MRBFS; (2) included primary gear type that caught sicklefin and sturgeon chub; (3) were properly structured for modeling; (4) met model assumptions; and (5) allowed for use of PSPAP and MRBFS data together.
Except for analyses detailed in Section 2.4.3 “2.4.3. Observed co-occurrence”, we exclusively used benthic trawl samples because no other gear utilized caught sicklefin or sturgeon chub consistently. In fact, of all sites (i.e., macrohabitat within a river bend) where either a sicklefin or sturgeon chub was detected, >95% of chub samples had at least one detection of that species in a benthic trawl. The PSPAP and MRBFS used different benthic trawls; the PSPAP used a 4.8 m-wide otter trawl (OT16; [27]), and the MRBFS used a 2 m bottom trawl (BT; [26,29]). To structure data for an occupancy model with spatially replicated visits [37], the full definition of a site was a macrohabitat within a river bend sampled during a particular year. Each river bend was only visited once during the fish community season within a year. A visit was a pull of a benthic trawl. Only sites with multiple visits were retained, as multiple visits are required for occupancy modeling [38]. Additionally, only macrohabitats sampled by both the MRBFS and PSPAP, i.e., main-channel crossover, outside bend, inside bend, tributary mouth, secondary connected channel, and secondary non-connected channel, were used. All environmental data were averaged across visits to the level of the site. As a way of examining spatial patterns with a categorical variable, each site was assigned to a subbasin designated by a U.S. Geological Survey-standardized 8-digit Hydrologic Unit Code [30] (HUC 8, Figure 1).
Due to the shorter duration of MRBFS compared to the PSPAP, MRBFS data were only analyzed in combination with PSPAP-FC data. Spatially, MRBFS data were limited to standard sampling areas of the PSPAP [27]. When the PSPAP-FC and MRBFS data were used in combination, Kansas River data were excluded from the PSPAP data due to this river not being sampled by the MRBFS. In the combined MRBFS+PSPAP-FC data set, there were 12,160 trawls and totals of 6618 sicklefin and 3360 sturgeon chub individuals collected. For the raw detection rate by trawl, 17.7% and 12.4% of trawls collected at least one sicklefin or sturgeon chub, respectively. For the raw detection rate by site, that is, macrohabitat, 24.7% and 29.2% of sites had at least one sicklefin or sturgeon chub detected, respectively. The size range of sicklefin and sturgeon chub collected was 11–177 mm and 16–121 mm, respectively. The low detection rates for sicklefin and sturgeon chub was one reason for using occupancy modeling, and not relative abundance, in this study. Final data sets at the end of processing were PSPAP–fish community season (PSPAP-FC; n = 3631 sites, v = 11,500 visits across sites) and MRBFS+PSPAP-FC (n = 3926, v = 12,160).

2.4. Statistical Analyses

2.4.1. Occupancy Models

To address our primary goals, we developed three multispecies, single-season occupancy models. The first was a two-species occupancy model to examine sicklefin and sturgeon chub occupancy and co-occurrence relationships to temporal, spatial, and environmental factors. This model was fit using the MRBFS+PSPAP-FC data set because this data set contained the longest span of data with the most sites. The two-species model had fully parameterized detection and occupancy components and a co-occurrence component parameterized with continuous water condition covariates. The remaining models were three-species occupancy models of occupancy and co-occurrence of focal chub species and either channel catfish or shovelnose sturgeon. Three-species models were fit using only the PSPAP-FC data because the BT in the MRBFS was inefficient at capturing channel catfish and shovelnose sturgeon. At MRBFS sites where a channel catfish or shovelnose sturgeon had been captured by at least one type of gear, 62.6% of channel catfish sites had channel catfish caught in BT, and 39.6% shovelnose sturgeon sites caught shovelnose sturgeon in BT. Corresponding rates were much higher for the OT16 in the PSPAP (90.7% for channel catfish and 87.2% for shovelnose sturgeon; see Appendix B). Three-species models had fully parameterized detection components and intercept-only occupancy and co-occurrence components. The primary purpose of the three-species models was to examine the co-occurrence of each chub species with either channel catfish or shovelnose sturgeon; they were also used to estimate the overall occupancy and co-occurrence of sicklefin and sturgeon chub more easily due to their simpler model structure. For all models, we used a multispecies occupancy modeling framework [23] within statistical software (R version 4.2.2; “occuMulti” function of “unmarked” package version 1.2.5 [39,40]). Given the structure of extant data, we followed the spatially replicated visit definition used by previous fishery research [20,37], not traditionally repeated visits [38].
The detection component of occupancy models was used to calculate a detection probability, that is, probability that a species is detected during a visit to a site where that species is present [38]. For the type of multispecies occupancy models we used, detection probabilities were calculated independently for each species, and these probabilities were modeled as functions of covariates [23]. Across all models and species, the detection component had trawling distance, depth, and velocity as covariates (Table 1). Trawling distance (i.e., level of effort) is an important factor in detecting most fish species using trawls, including focal chub species [3,13,41]. Additionally, depth and velocity can affect the efficiency of benthic trawls [42,43], but they were collected for only a fraction of visits (i.e., trawl deployments) at a site (i.e., macrohabitat). Consequently, site-level depth and velocity means across visits were used for the detection component of models. For the two-species models, which used MRBFS+PSPAP-FC data, we added a covariate for project because each monitoring program used different types of benthic trawls (i.e., BT versus OT16) and predicted detection probabilities for each program separately, using median continuous covariate values specific to each project. For the detection component of each three-species model, we report predicted occupancy probability for the median value of each continuous covariate. Detection probability estimates were made with 10,000 bootstrap samples to estimate 95% confidence intervals (default “predict” methods for the detection component of multispecies occupancy models in “unmarked” version 1.2.5 [23,40]).
For the two-species model, the occupancy component for individual species was modeled using the categorical factors of year, HUC 8 subbasin, and macrohabitat (Table 1). Year and subbasin provided means of assessing large-scale temporal and spatial patterns of occupancy, and macrohabitat is known to be related to the occurrence of our focal species in the Missouri River [13]. We assessed differences among levels of different categorical variables by comparing confidence interval overlap among coefficients; levels where 95% confidence intervals of coefficients did not overlap were considered significantly different. The categorical variable levels used as a reference condition were included in these comparisons as a value of 0. Continuous covariates used in the individual species occupancy component and co-occurrence components of the two-species models were four measures of water conditions: depth, velocity, turbidity, and temperature (Table 1). These variables were the only site-level environmental variables consistently collected by the PSPAP [3]; they were also among the environmental variables collected by the MRBFS [13]. Depth, velocity, turbidity, and temperature have all been shown to affect the presence or spawning of sicklefin chub, sturgeon chub, and similar species [13,15,44]. As temperature and depth are related to the co-occurrence patterns of other fish species [45]; we hypothesized that these factors—along with velocity and turbidity—could also affect the co-occurrence of focal chub species. The categorical factors of years, HUC 8 subbasins, and macrohabitats were not included in the co-occurrence component of these models because their use made it impossible to estimate uncertainty for all factor levels. This was due to limited information as a result of smaller sample sizes on observed co-occurrence for years, HUC 8 subbasins, and macrohabitats.
In the three-species models, we sought to describe differences in sicklefin or sturgeon chub occupancy given the presence or absence of each other, shovelnose sturgeon, or channel catfish. We also used these models to report an overall occupancy probability for each species independent of the other species. Because we were not interested in the factors underlying overall occupancy or co-occurrence for these purposes, we set both occupancy and co-occurrence components of the three-species models as intercept-only (Table 1). The co-occurrence components of the three-species models only included second-order interactions between species because we only wanted to compare pairs of species. To obtain overall occupancy probabilities, we calculated marginal occupancy probabilities. To calculate differences in sicklefin or sturgeon chub occupancy given the presence or absence of other chub species, shovelnose sturgeon, or channel catfish, we calculated conditional occupancy for each chub species in each model based on the conditions of presence and absence of one of each of the other species in the model. For marginal and conditional occupancy probabilities, we used 10,000 bootstrap samples to estimate 95% confidence intervals (default “predict” methods for occupancy models in “unmarked” version 1.2.5 [23,40]). For conditional occupancy probabilities, we checked for overlap of 95% confidence intervals between each pair of estimates, where a pair consisted of occupancy probability conditional on presence and occupancy probability conditional on absence for each possible combination of primary chub species (sicklefin or sturgeon chub), secondary species used as the condition (the other chub species, shovelnose sturgeon, or channel catfish), and model (shovelnose sturgeon or channel catfish). We compared predicted conditional occupancy probabilities instead of coefficients because, in preliminary analyses, we found that significant differences in co-occurrence coefficients did not always translate into differences in predicted occupancy.
Single-season occupancy models, including specific multispecies models we used, have five assumptions. Given the limitations imposed by the data sets and specific model outputs required by our research objectives, relaxing some of these assumptions was sometimes necessary. The assumptions are as follows: (1) closure: occupancy status at each site does not change over the sampling period; (2) occupancy probability is constant or modeled as a function of covariates; (3) there is no unmodeled heterogeneity in detection probability; (4) independence: detections of a species and detection histories are independent among sites and visits; and (5) identification: species are correctly identified such that there are no false positives [23,38].
To address assumption 1, closure, we filtered the PSPAP component of each data set to include only visits conducted ≤7 days apart at the same site. In cases where >7 days elapsed between samples, the first 7-day period with at least two samples was retained per site. These criteria resulted in the exclusion of 85 (~0.007%) possible visits from the PSPAP-FC data set. Multi-day sampling was rare and >98% of sites had all visits for each site conducted on the same day for each data set. We address assumption 2 in the two-species models by modeling occupancy probability as a function of habitat covariates. In the three-species model, assumption 2 is not explicitly addressed using habitat covariates, but we treat co-occurrence like a covariate for the purpose of this assumption. We address assumption 3 across all models by modeling detection using covariates known to affect trawl capture probability (i.e., trawl distance, water depth, water velocity; [42]). For assumption 4, we used multiple levels of data processing to maintain independence throughout data sets (Section 2.3). Though three main-channel macrohabitats of MRBFS (i.e., inside bend, outside bend, and channel crossover) were considered statistically non-independent in the stratified, random design of Wildhaber et al. [13], independence for the purpose of occupancy modeling was considered met given the size of each MR bend; this made sites and visits, i.e., trawl samples, spatially far enough apart to minimize potential for sampling of the same fish. Assumption 5 was addressed by MRBFS and PSPAP protocols requiring crews to be trained in fish identification and to send unknown specimens to experts [28].
To assess the predictive ability of occupancy models, we calculated the area under the receiver operating characteristic (ROC) curve (AUC; [46]) with statistical software (“roc” function of the “pROC” R package version 1.18.4, [47]). Predicted values for ROC curves were the products of (predicted cumulative detection probability across visits to each site) × (predicted occupancy probability at that site). These products were calculated at each site for each species included in a model, and each combination of species × site was used in the predicted data set for the ROC curve. Mean predictions for visit-level detection probabilities and site-level occupancy probabilities were calculated directly from data used from each specific model (“predict” methods for multispecies occupancy models in “unmarked” version 1.2.5 [39,40]). Cumulative detection probabilities were calculated as 1 i = 1 n ( 1 p i ) , where i was a visit, n was the total number of visits to a site, and pi was the predicted detection probability for visit i. For the AUC analysis, known site-level occurrence of co-occurring species was used to inform occupancy predictions for each primary species, i.e., the species for which occupancy probability was being calculated. If a co-occurring species was detected at a site during at least one visit, the predicted occupancy of the primary species was calculated as conditional upon the presence of the detected species [23]. If a potentially co-occurring species was not detected, no prediction condition was applied for non-detected species.
In terms of interpreting AUC values, AUC > 0.5 indicates the model makes predictions better than random chance [46]. AUC = 1.0 means that all sites with (occupancy probability) × (detection probability) ≥ 0.5 had observations of a given species and that all sites with (occupancy probability) × (detection probability) < 0.5 had no observations of a given species [46]. One potential way of qualitatively assessing AUC can be found in Hosmer et al. [48].

2.4.2. Post Hoc Missouri River Discharge Analyses

Previous research indicates that the abundance and distribution of focal chub species in the MR may be linked to variability in annual river discharge [12]. We wanted to conduct exploratory analyses to further examine potential patterns of focal chub species site occupancy related to annual mean MR discharge across a time scale spanning multiple decades. Annual hourly mean MR discharge, in m3/s, was calculated for each sampling year using data from USGS hydrological stations near Wolf Point, Montana (Site ID 06177000), and Hermann, Missouri (Site ID 06934500), representing the UMR and LMR, respectively [49]. Wolf Point had the only station between Fort Peck Reservoir and Lake Sakakawea with continuous discharge records during the study period, whereas Hermann was the downstream-most station on the MR with continuous discharge records during the study period. To calculate annual hourly mean discharge for each station, discharge was averaged hierarchically by hour, then day, and then sampling year, that is, November 1 of one calendar year to October 31 of the following year. For all analyses involving the UMR (i.e., Wolf Point station), sampling year 2011 was excluded because its annual hourly mean discharge of 798 m3/s was an extreme outlier; the mean ± 1 standard deviation across 19 sampling years for Wolf Point station was 279 ± 150 m3/s.
For the response variable of occupancy-related exploratory discharge analyses, we used yearly occupancy coefficients for each focal chub species from the two-species occupancy model. We were unable to include discharge as a covariate within occupancy models for several reasons. First, there were few stations along the MR that measured discharge for the duration of the study, making it difficult to assign discharge values to individual sites. Second, biological processes likely influenced by discharge, such as chub spawning and recruitment, generally happen on an annual scale [1,2]. Third, annual discharge is related to location along the river (i.e., HUC 8) and year, creating multicollinearity concerns. Fourth, because we averaged hourly discharge across entire years, there would be pseudo-replication of discharge observations within each year if incorporated into a site-scale occupancy model.
We conducted eight linear regression models for occupancy coefficients versus discharge. Models were separated by species (2; sicklefin or sturgeon chub), MR section (2, UMR or LMR), and relative year of discharge (2; current year or prior year). We analyzed prior-year discharge in addition to current-year discharge separately because both current sampling year and prior sampling year could result in possible lag effects of discharge that have been observed for previous fishes [50]. We only examined the current-year and prior-year discharge because most chubs in the Missouri River are less than 2 years old [1,2,51]. Linear regressions were conducted in statistical software (“lm” function of the “stats” package in R version 4.2.2 [39]).

2.4.3. Observed Co-Occurrence and Simulations

In addition to channel catfish and shovelnose sturgeon, we were also interested in focal chub species co-occurrence patterns related to uncommon secondary fish of interest (USFI), namely pallid sturgeon, walleye, and sauger. All three of these species were selected mainly due to their potential predation on focal chub species. Walleye and sauger are also important sportfishes [36], whereas pallid sturgeon is a federally listed, endangered species in the United States [35] that preys on focal chub and other small fish to reach adulthood and survive as adults [6,34,35,52,53,54]. In our comparisons, juvenile pallid sturgeon were considered as a separate USFI from adults because they are less piscivorous and instead as potential competitors for sicklefin and sturgeon chub [33]. The cutoff we used for juvenile pallid sturgeon was total length < 500 mm; pallid sturgeon ≥ 500 mm are almost exclusively piscivorous [6,34,35,52,53,54].
These larger USFI are generally mobile in the riverine environment and are likely to violate the closure assumptions of occupancy models [35,54,55]. Additionally, the implementation of the PSPAP resulted in few synchronized deployments of gear types that effectively detected both focal chub species and USFI. Because these issues precluded the use of occupancy modeling, we could not account for the imperfect detection of co-occurrence of focal chubs and USFI. Alternatively, we used Monte Carlo methods, detailed below, to compare proportional rates of observed co-occurrence to predicted rates of observed co-occurrence based on random chance. The primary purpose of these comparisons was to inform hypotheses to test in the future using a different sampling and analytical design.
The subset of data used for comparison between focal chub species and USFI detections started with only PSPAP-FC data, due to the unique presence of bends in that data set with some concurrent or nearly concurrent sampling using multiple types of actively pulled gear. OT16 data in PSPAP-FC were supplemented with captures from trammel nets 38.1 m in length (TN). Due to its larger size compared to the OT16 [27], the TN was able to detect USFI missed by OT16. Passive and bait-based gears types were not considered due to a lack of comparability to the actively pulled OT16. The mobility and seasonal migration of adult pallid sturgeon [35,52,53,54,56], walleye [55], and sauger [55] created multiple issues that required further consolidation and filtering of the TN-supplemented PSPAP-FC data set. Due to the potential for movement of USFI across macrohabitats within a river bend, detection/non-detection of focal chub species and USFI were consolidated to bend level. To capture coarse spatial variation in patterns of observed co-occurrence, this bend-level data set was portioned into three regions: (1) PSPAP-FC bends in the Upper Missouri River (UMR), i.e., upstream of Lake Sakakawea; (2) PSPAP-FC bends in the Lower Missouri River (LMR), i.e., downstream of Gavin’s Point Dam; and (3) all bends in the filtered PSPAP-FC data set, i.e., in both the UMR and LMR.
To predict observed co-occurrence (OC) rates based on random chance, we calculated an expected probability of OC based on random chance as
C × U ( n b e n d ) 2
where C was the number of bends where a given focal chub species was detected, U was the number of bends where a given USFI was detected, and nbend was the region-specific (i.e., UMR, LMR, or combined UMR + LMR) total number of bends in the filtered PSPAP-FC data set. These expected probabilities of OC were calculated for each combination of focal chub species (2), USFI (4), and MR region (3) for 24 total test combinations. For each test combination, we conducted 100,000 Bernoulli-distribution-based Monte Carlo simulations using statistical software (“rbinom” function with size = 1 in the “stats” package of R version 4.2.2). For each simulation, the number of observations was the number of bends in a regional data set, and the probability of OC for each observation was the expected probability of OC based on random chance. The predicted OC rate for a simulation was calculated by dividing the number of bends with predicted OC by the number of bends in that simulation’s region.
To compare the actual versus predicted OC rate for each test combination, we conducted unidirectional tests that calculated the proportion of simulated predictions either greater than or less than the actual OC rate. Greater than tests (prediction < actual) were used if the actual OC rate was less than the expected probability of OC for a test combination; otherwise, a less than test (prediction > actual) was used. Following the language of [57], we note proportions of simulated predictions meeting test criteria (q) at thresholds of q ≤ 0.10, q ≤ 0.05, q ≤ 0.01, and q ≤ 0.001 as weak evidence, moderate evidence, strong evidence, and very strong evidence of non-random actual OC, respectively.

3. Results

3.1. Two-Species Occupancy Models

3.1.1. Occupancy and Co-Occurrence

In the fully parameterized two-species model, occupancy probabilities varied between years and species, reflecting both increasing and decreasing chub spatial distribution and, possibly, abundance (Figure 2). For sicklefin chub, 2003 and 2005 had higher occupancy coefficient estimates than at least two other years. In addition, 1996, 2008, and 2011 had estimates lower than at least two other years (Figure 2). For sturgeon chub, 1996, 2005, 2006, 2012, and 2013 had higher occupancy coefficient estimates than at least two other years; 2016 and 2018 had lower estimates than at least two other years (Figure 2).
For sicklefin chub HUC 8 occupancy coefficients, the UMR HUC 8 subbasins between the Redwater River confluence and Lake Sakakawea (2237 to 2705 km) were greater than the UMR HUC 8 just below Fort Peck Dam (river km 2705 to 2850), the reference condition (i.e., set to zero). The occupancy coefficient for the HUC 8 containing Gavins Point Dam was not different from that of the reference HUC 8; occupancy was similar for the four HUC 8 subbasins starting just upstream of Gavins Point Dam and ending 86 km downstream of the Platte River confluence (872 to 1416 km; Figure 1 and Figure 3). Occupancy for the five HUC 8 subbasins from river km 0 to 872 was higher than the reference and the HUC 8 containing Gavins Point Dam.
Sturgeon chub HUC 8 subbasin occupancy patterns had similar overall trends as sicklefin chub such as relative decreases below hydro-electric dams, but patterns were less clearly defined (Figure 3). Sturgeon chub occupancy coefficients were (i) greater than the reference HUC 8 just below Fort Peck Dam (2705 to 2850 km) in both UMR HUC 8 subbasins between the Redwater River confluence and Lake Sakakawea (2237 to 2705 km) but (ii) less than the reference for LMR HUC 8 subbasins containing and just below Gavins Point Dam (1183 to 1416 km; Figure 1 and Figure 3). The UMR reference HUC 8 subbasin immediately below Fort Peck Dam (2705 to 2850 km) was similar to several of the LMR HUC 8 subbasins downstream of those containing and just below Gavins Point Dam (Figure 3).
Sicklefin chub occupancy coefficients were significantly greater for inside bend macrohabitat compared to channel crossover, outside bend, and secondary connected channel macrohabitats, with the latter having the lowest mean occupancy coefficient (Figure 4). Sturgeon chub had a higher occupancy coefficient for inside bend and secondary connected channel compared to channel crossover macrohabitats (Figure 4).
Focal chub occupancy differed with environmental variables. Sicklefin chub occupancy was not significantly related to any water conditions included in the two-species model; coefficients were −0.066 (−0.260, 0.132) for depth, −0.055 (−0.856, 0.745) for water velocity, 0.001 (0.000, 0.002) for turbidity, and −0.039 (−0.112, 0.034) for water temperature. In contrast, sturgeon chub occupancy had a marginal negative relationship to depth −0.244 (−0.489, 0.001), was positively related to water velocity 0.883 (0.046, 1.720), was not significantly related to turbidity 0.000 (−0.002, 0.002), and was negatively related to water temperature −0.088, (−0.158, −0.018).
In the two-species model, the mean co-occurrence intercept was positive with a 95% confidence interval excluding 0. In the two-species model, there was no statistically significant relationship between environmental covariates assessed and the co-occurrence of sicklefin and sturgeon chub; mean coefficient estimates with 95% confidence intervals were 0.138 (−0.191, 0.467) for depth, −0.173 (−1.342, 0.997) for water velocity, −0.0008 (−0.003, 0.002) for turbidity, and −0.036 (−0.127, 0.054) for water temperature.

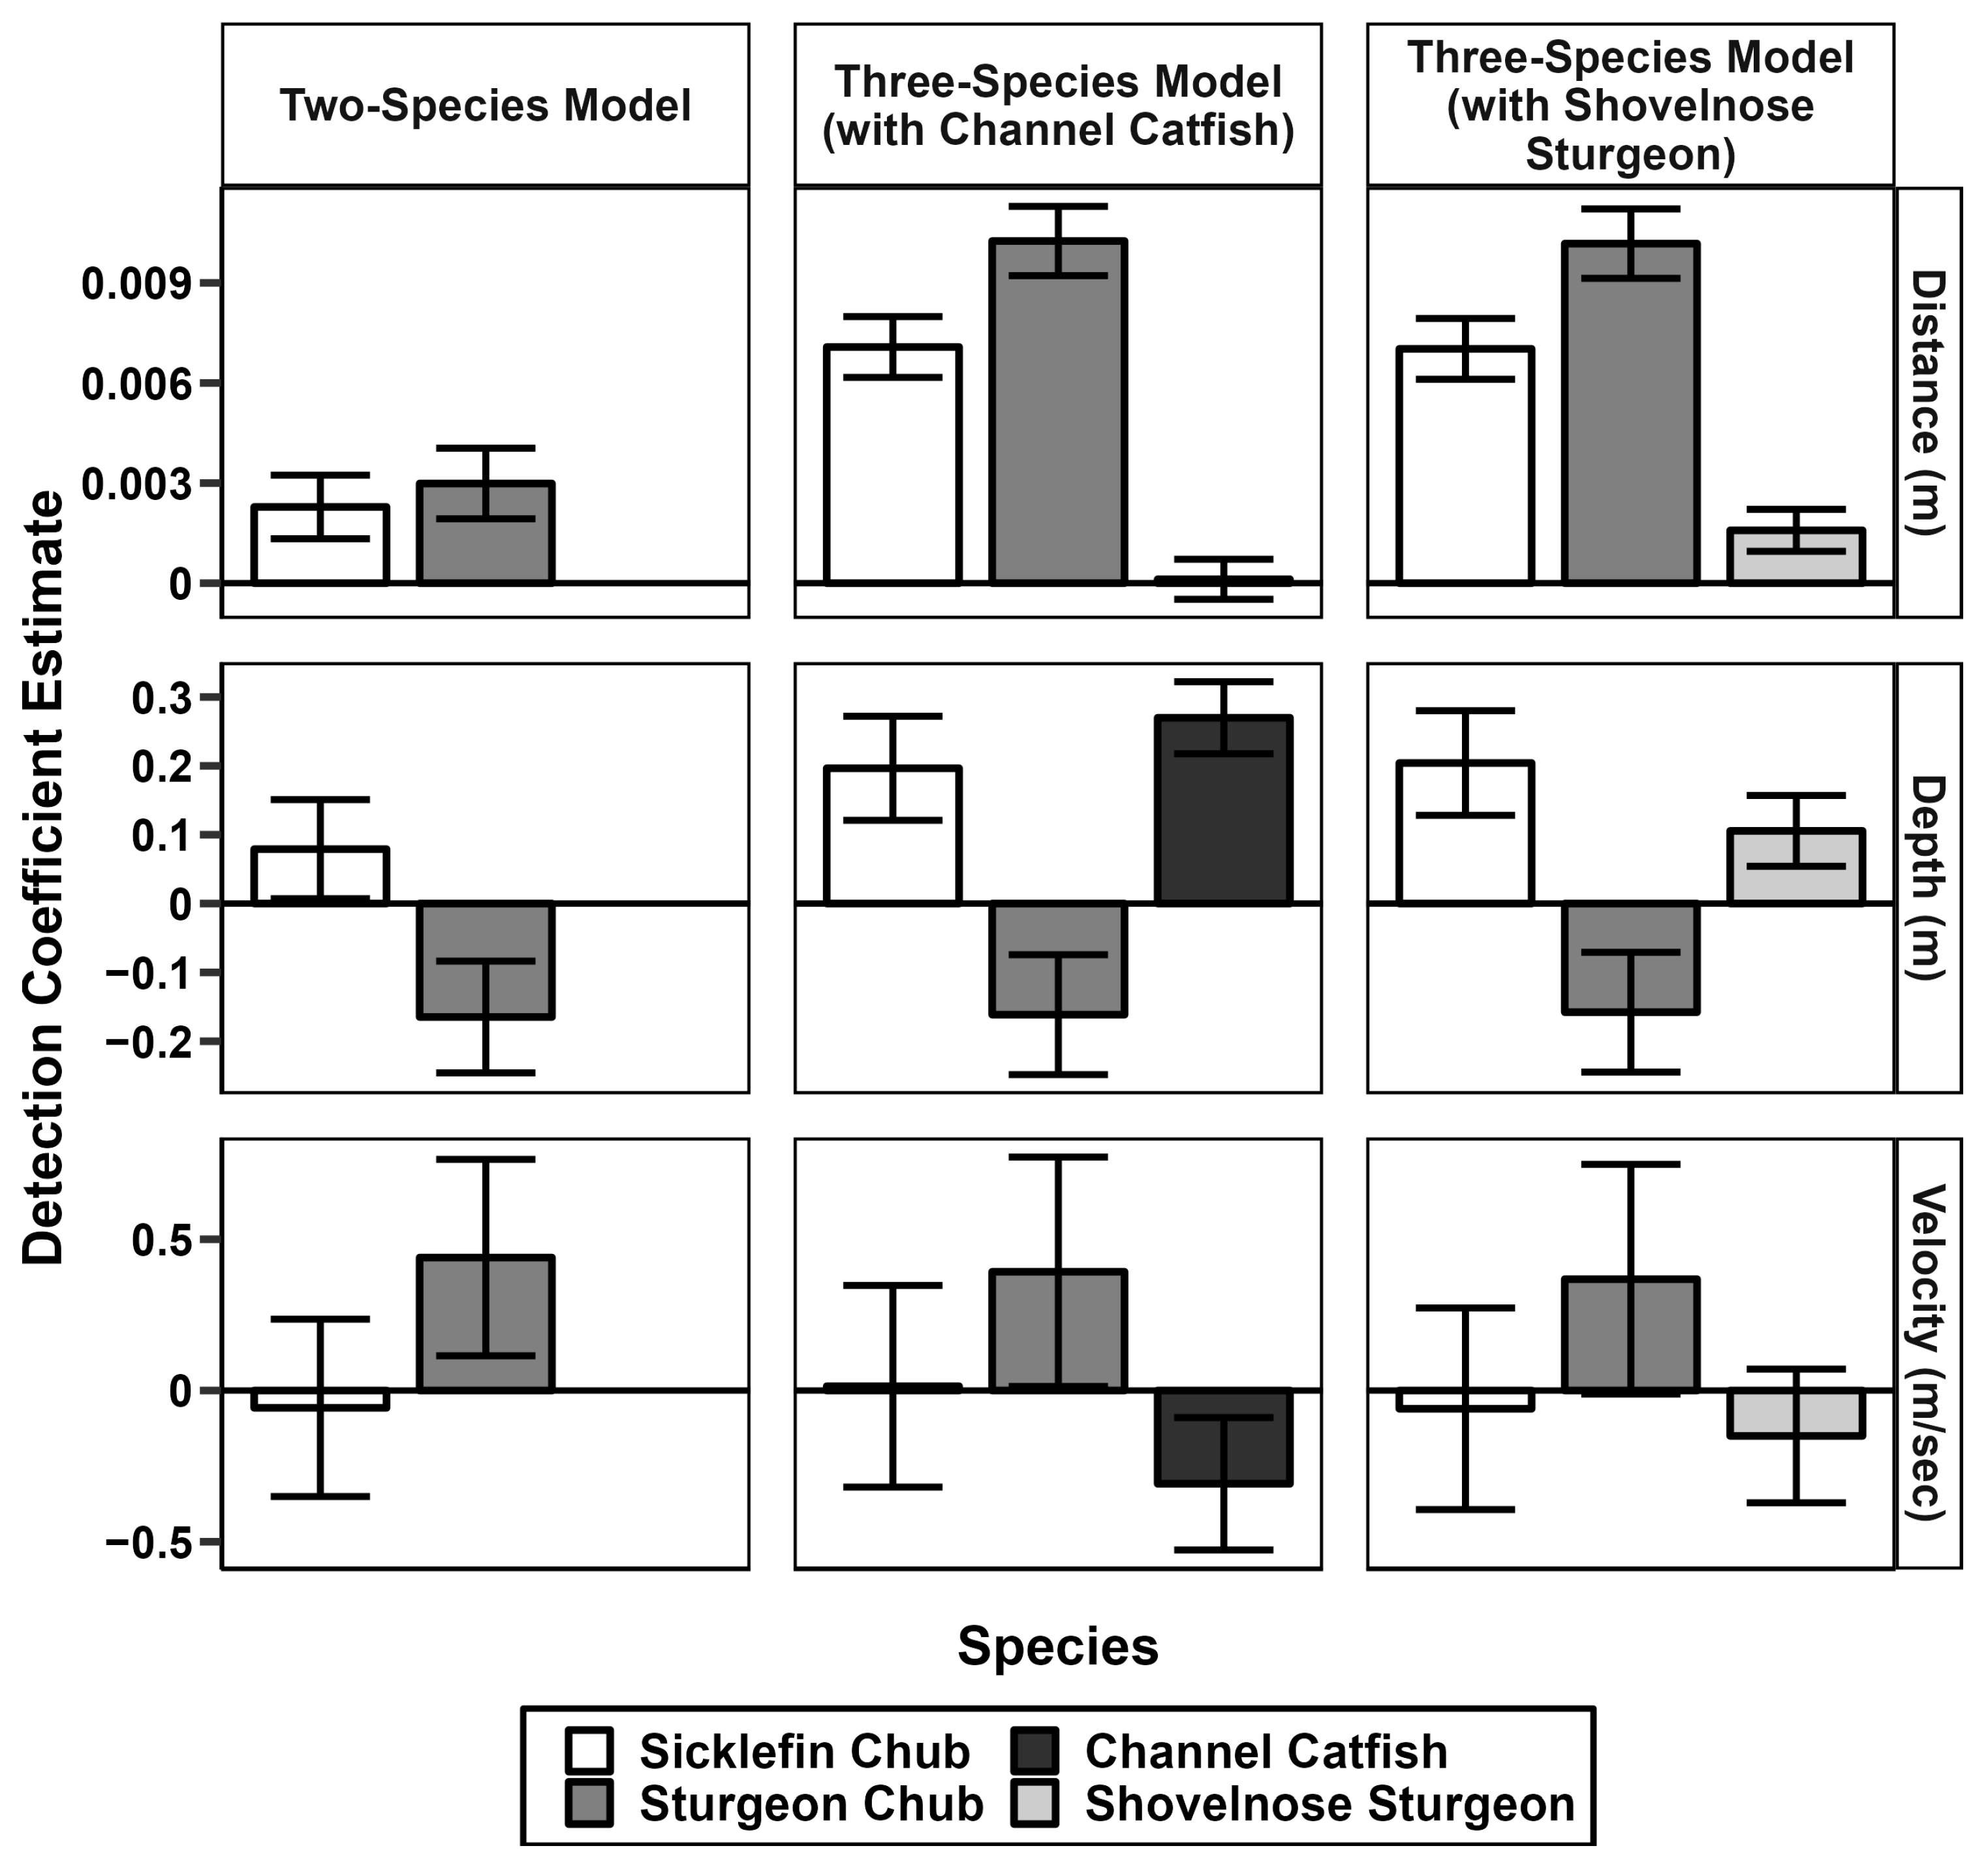
3.1.2. Model Performance and Detection

The AUC for the two-species model was 0.862, corresponding to what Hosmer et al. [48] calls “excellent discrimination.” In species-specific detection components of the two-species model, the detection probability of sicklefin chub increased with trawl distance and water depth (Figure 5). The detection probability of sturgeon chub increased with trawl distance, decreased with increasing depth, and increased with velocity (Figure 5). Our expected finding of increased detection probability with increased trawl distance (effort) for both focal chub species, is comparable to results for fish species of similar size and habitats in rivers of Iowa, USA [41]. For the categorical effect of project, detection coefficients, as mean (95% confidence interval), for the PSPAP project were −0.382 (−0.164, −0.600) for sicklefin chub and −0.592 (−0.372, −0.812) for sturgeon chub relative to the MRBFS observations. Median covariate values used to predict detection probability were 150 m trawl distance, 2.50 m water depth, and 0.646 m/s water velocity for MRBFS data; for PSPAP data, they were 161 m trawl distance, 2.05 m water depth, and 0.381 m/s water velocity. Using the two-species model and its coefficients, mean estimates of visit-level detection probabilities based on these median values were 0.38 (0.36, 0.41) for sicklefin chub in the PSPAP and 0.48 (0.43, 0.52) in the MRBFS, while 0.26 (0.23, 0.29) and 0.38 (0.33, 0.42) for sturgeon chub, respectively. Regarding environmental effects on detection probability, previous occupancy modeling of the focal chubs found large-scale spatial heterogeneity in detection probability for the Lower MR [20]; our results regarding water conditions complement those findings by informing the effects of local water conditions on detection probability. The positive relationship of depth with detection probability for sicklefin chub differs from previously observed detection/non-detection data for this species, where there was not a significant relationship between the number of zero catches and depth [3]. For sturgeon chub, the negative relationship of depth and positive relationship of velocity with detection may signal abundance effects, that is, more sturgeon chub at shallow and higher velocity sites. In the current study, sturgeon chub occupancy probability was marginally negatively related to depth and positively related to velocity. As occupancy can be correlated with abundance [21], this supports previous research showing non-zero catches and abundance of sturgeon chub being negatively correlated with depth [3]. Though less clear than the relationships between detection and trawl distance, these environmental effects on detection still provide new insight into water conditions related to the capture of these chub species.

3.2. Three-Species Occupancy Models

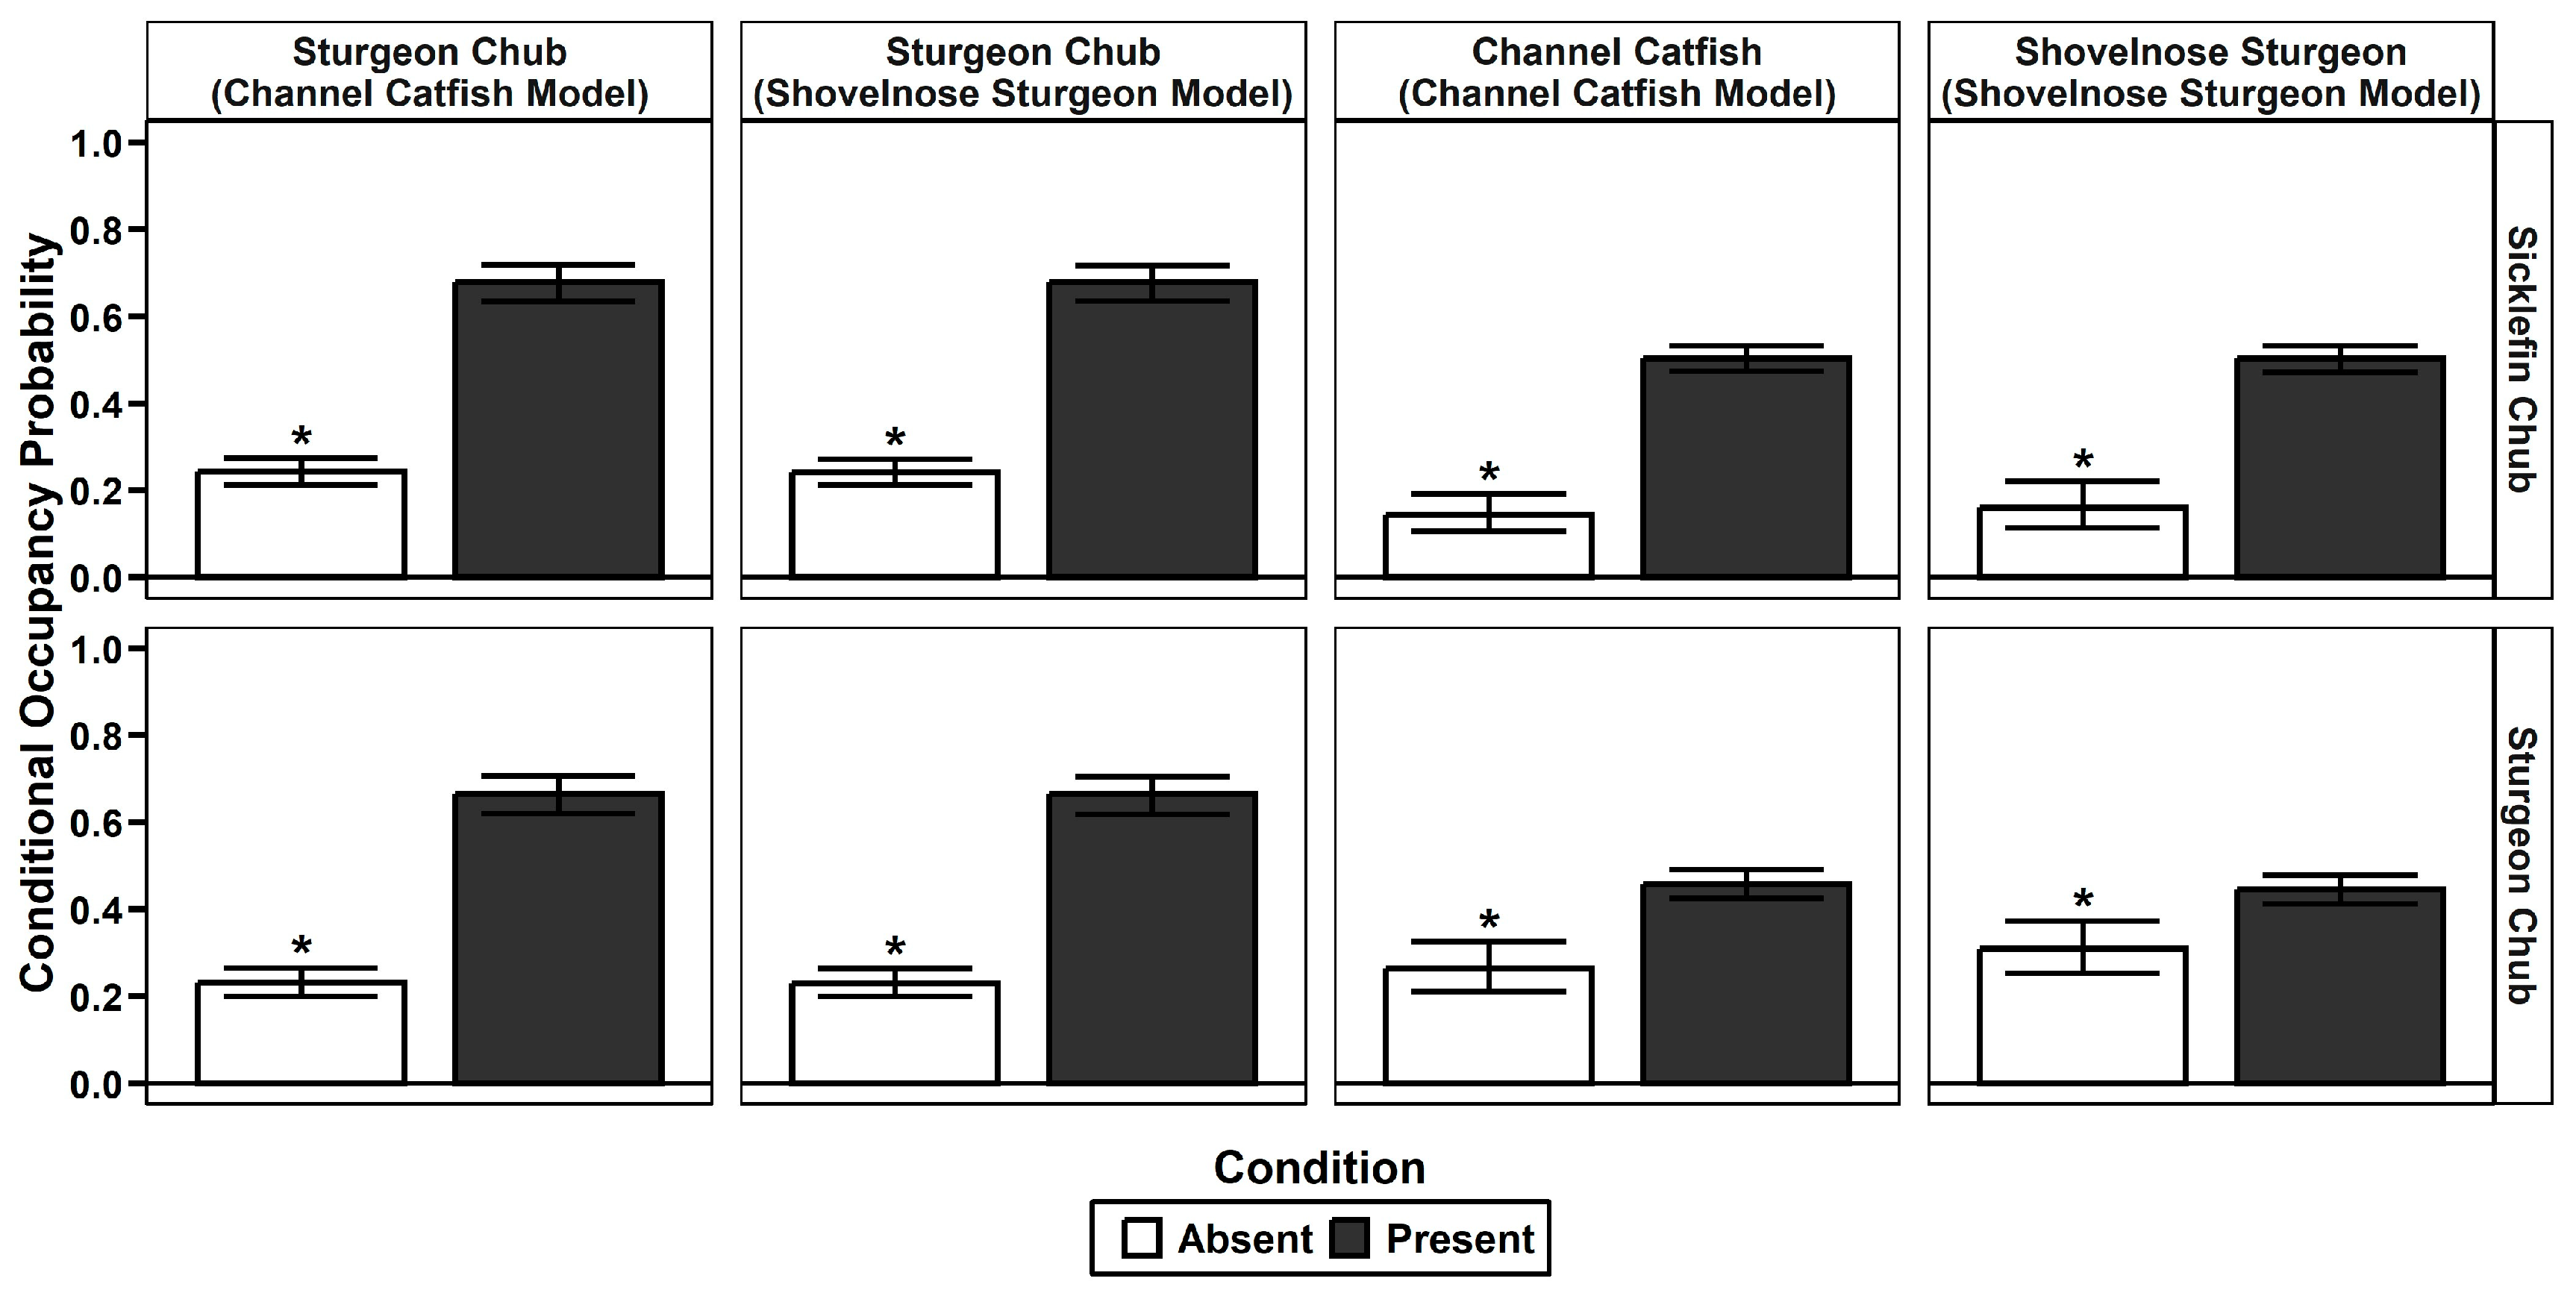
3.2.1. Occupancy and Co-Occurrence

In both channel catfish and shovelnose sturgeon models, mean predicted marginal occupancy probabilities (with 95% confidence intervals) for individual chub species at the macrohabitat scale—across the entire study area and time period—were 0.42 (0.40, 0.45) for sicklefin chub and 0.41 (0.39, 0.44) for sturgeon chub.
For the three-species models, co-occurrence intercepts for sicklefin chub × sturgeon chub were positive with 95% confidence intervals excluding zero [58]. Predicted marginal occupancy probabilities were significantly higher for sicklefin chub when sturgeon chub were present, and vice versa (Figure 6). Predicted occupancy probability was, on average, 2.8× higher for sicklefin chub in the presence of sturgeon chub, compared to occupancy probability in the absence of sturgeon chub; it was, on average, 2.9× higher for sturgeon chub in the presence of sicklefin chub.
Sicklefin chub and sturgeon chub had higher occupancy probabilities when channel catfish and shovelnose sturgeon were present (Figure 6). The sicklefin chub occupancy probability was, on average, 3.5× higher in the presence of channel catfish as compared to their absence; this rate was 1.7× higher for sturgeon chub. The sicklefin chub occupancy probability, was, on average, 3.1× higher in the presence of shovelnose sturgeon as compared to their absence; this rate was 1.4× higher for sturgeon chub.

3.2.2. AUC and Detection

The AUC was 0.757 for the three-species model with channel catfish and 0.769 with shovelnose sturgeon, a decrease of 0.10 to 0.105 in AUC from the two-species models; these values correspond to what Hosmer et al. [48] call “acceptable discrimination.” The detection probability of channel catfish increased with water depth and decreased with water velocity (Figure 6). The detection probability of shovelnose sturgeon increased with both trawl distance and water depth (Figure 6).
For the three-species models, median covariate values used to predict detection probability were 159 m for trawl distance, 2.06 m for water depth, and 0.372 m/s for water velocity. Mean estimates of visit-level detection probabilities (with 95% confidence intervals) using median detection covariate values were 0.36 (0.34, 0.39) for sicklefin chub and 0.21 (0.19, 0.23) for sturgeon chub in both the channel catfish and shovelnose sturgeon models. This pattern of detection is similar to that found by [20], including higher detection probabilities for sicklefin chub than sturgeon chub in the MR. Channel catfish model detection probability was 0.45 (0.41, 0.48) for channel catfish. Shovelnose sturgeon model detection probabilities were 0.37 (0.34, 0.41) for shovelnose sturgeon.

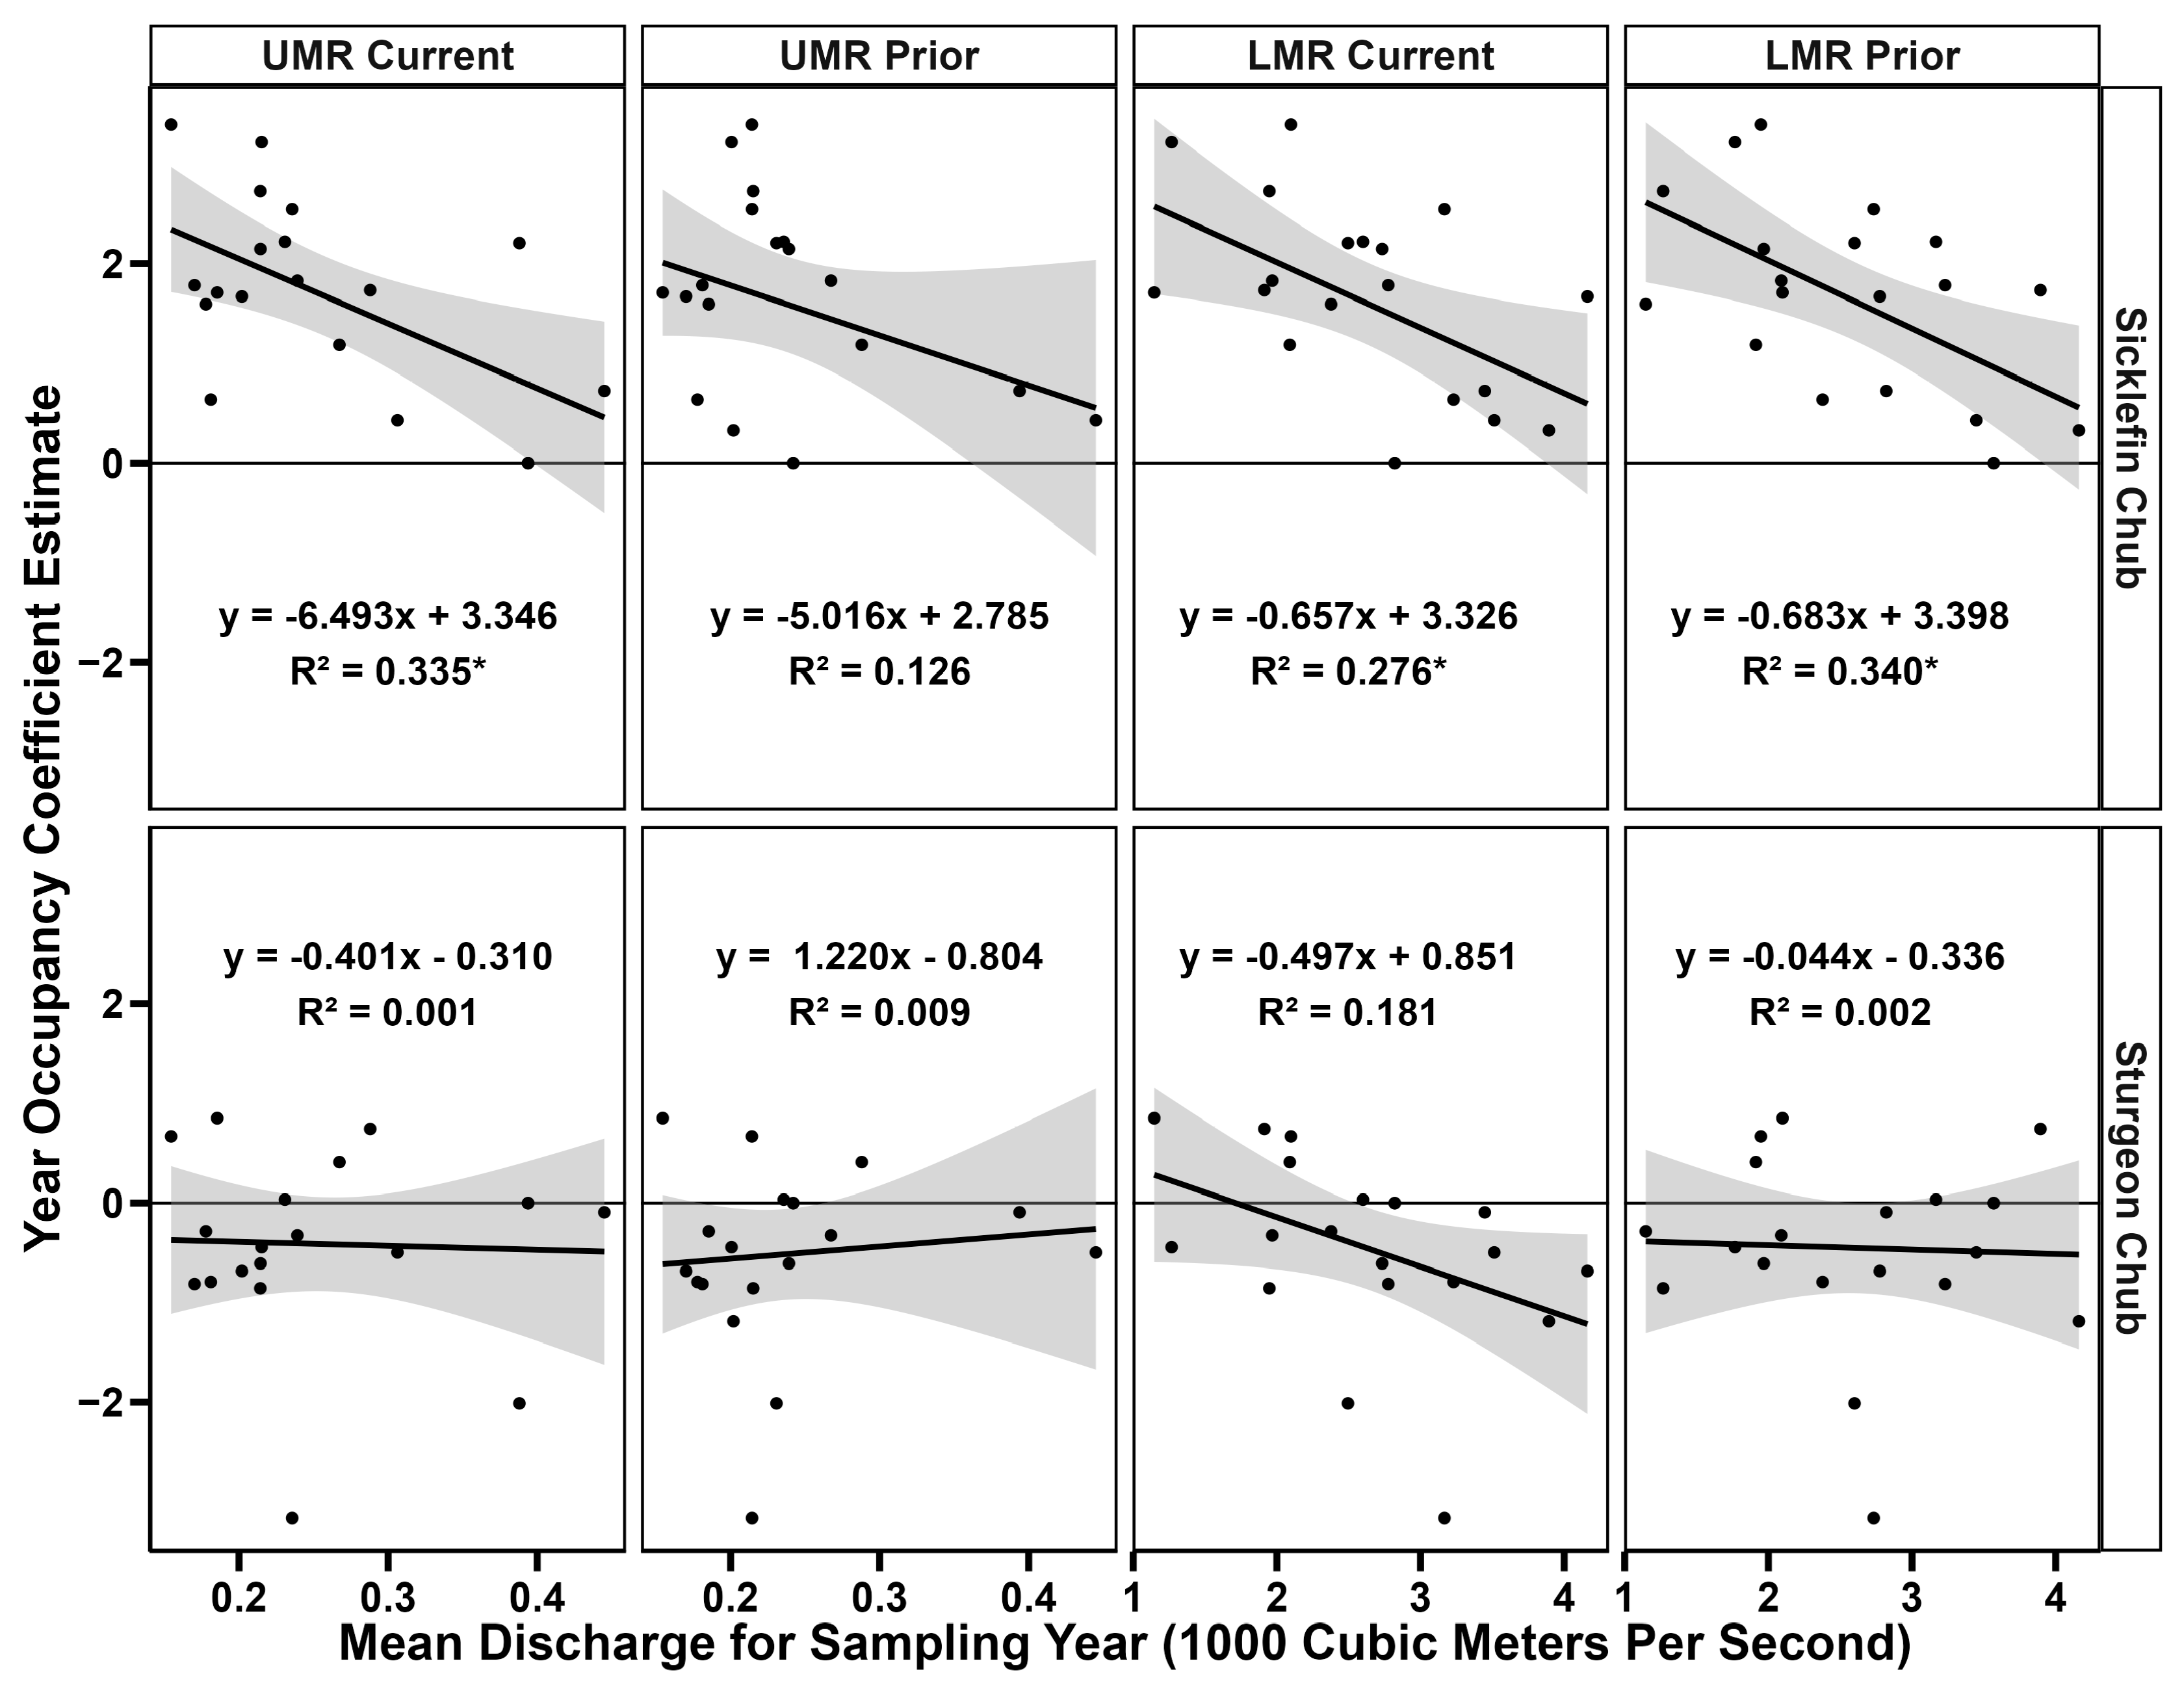
3.3. Missouri River Discharge Relationships

When comparing annual discharge to year coefficients for occupancy, we found negative relationships between current-year discharge and yearly occupancy coefficients for sicklefin chub in both the UMR and LMR; there was also a negative relationship between sicklefin chub occupancy coefficients and LMR’s previous-year discharge (Figure 7). There was no evidence of a relationship between the yearly occupancy coefficient and UMR discharge for the prior year for sicklefin chub (Figure 7). For sturgeon chub, there was marginal evidence for a negative relationship between current-year discharge in the LMR and yearly occupancy coefficients (Figure 7). There was no other evidence for relationships between mean annual discharge and sturgeon chub annual occupancy coefficients (Figure 7).

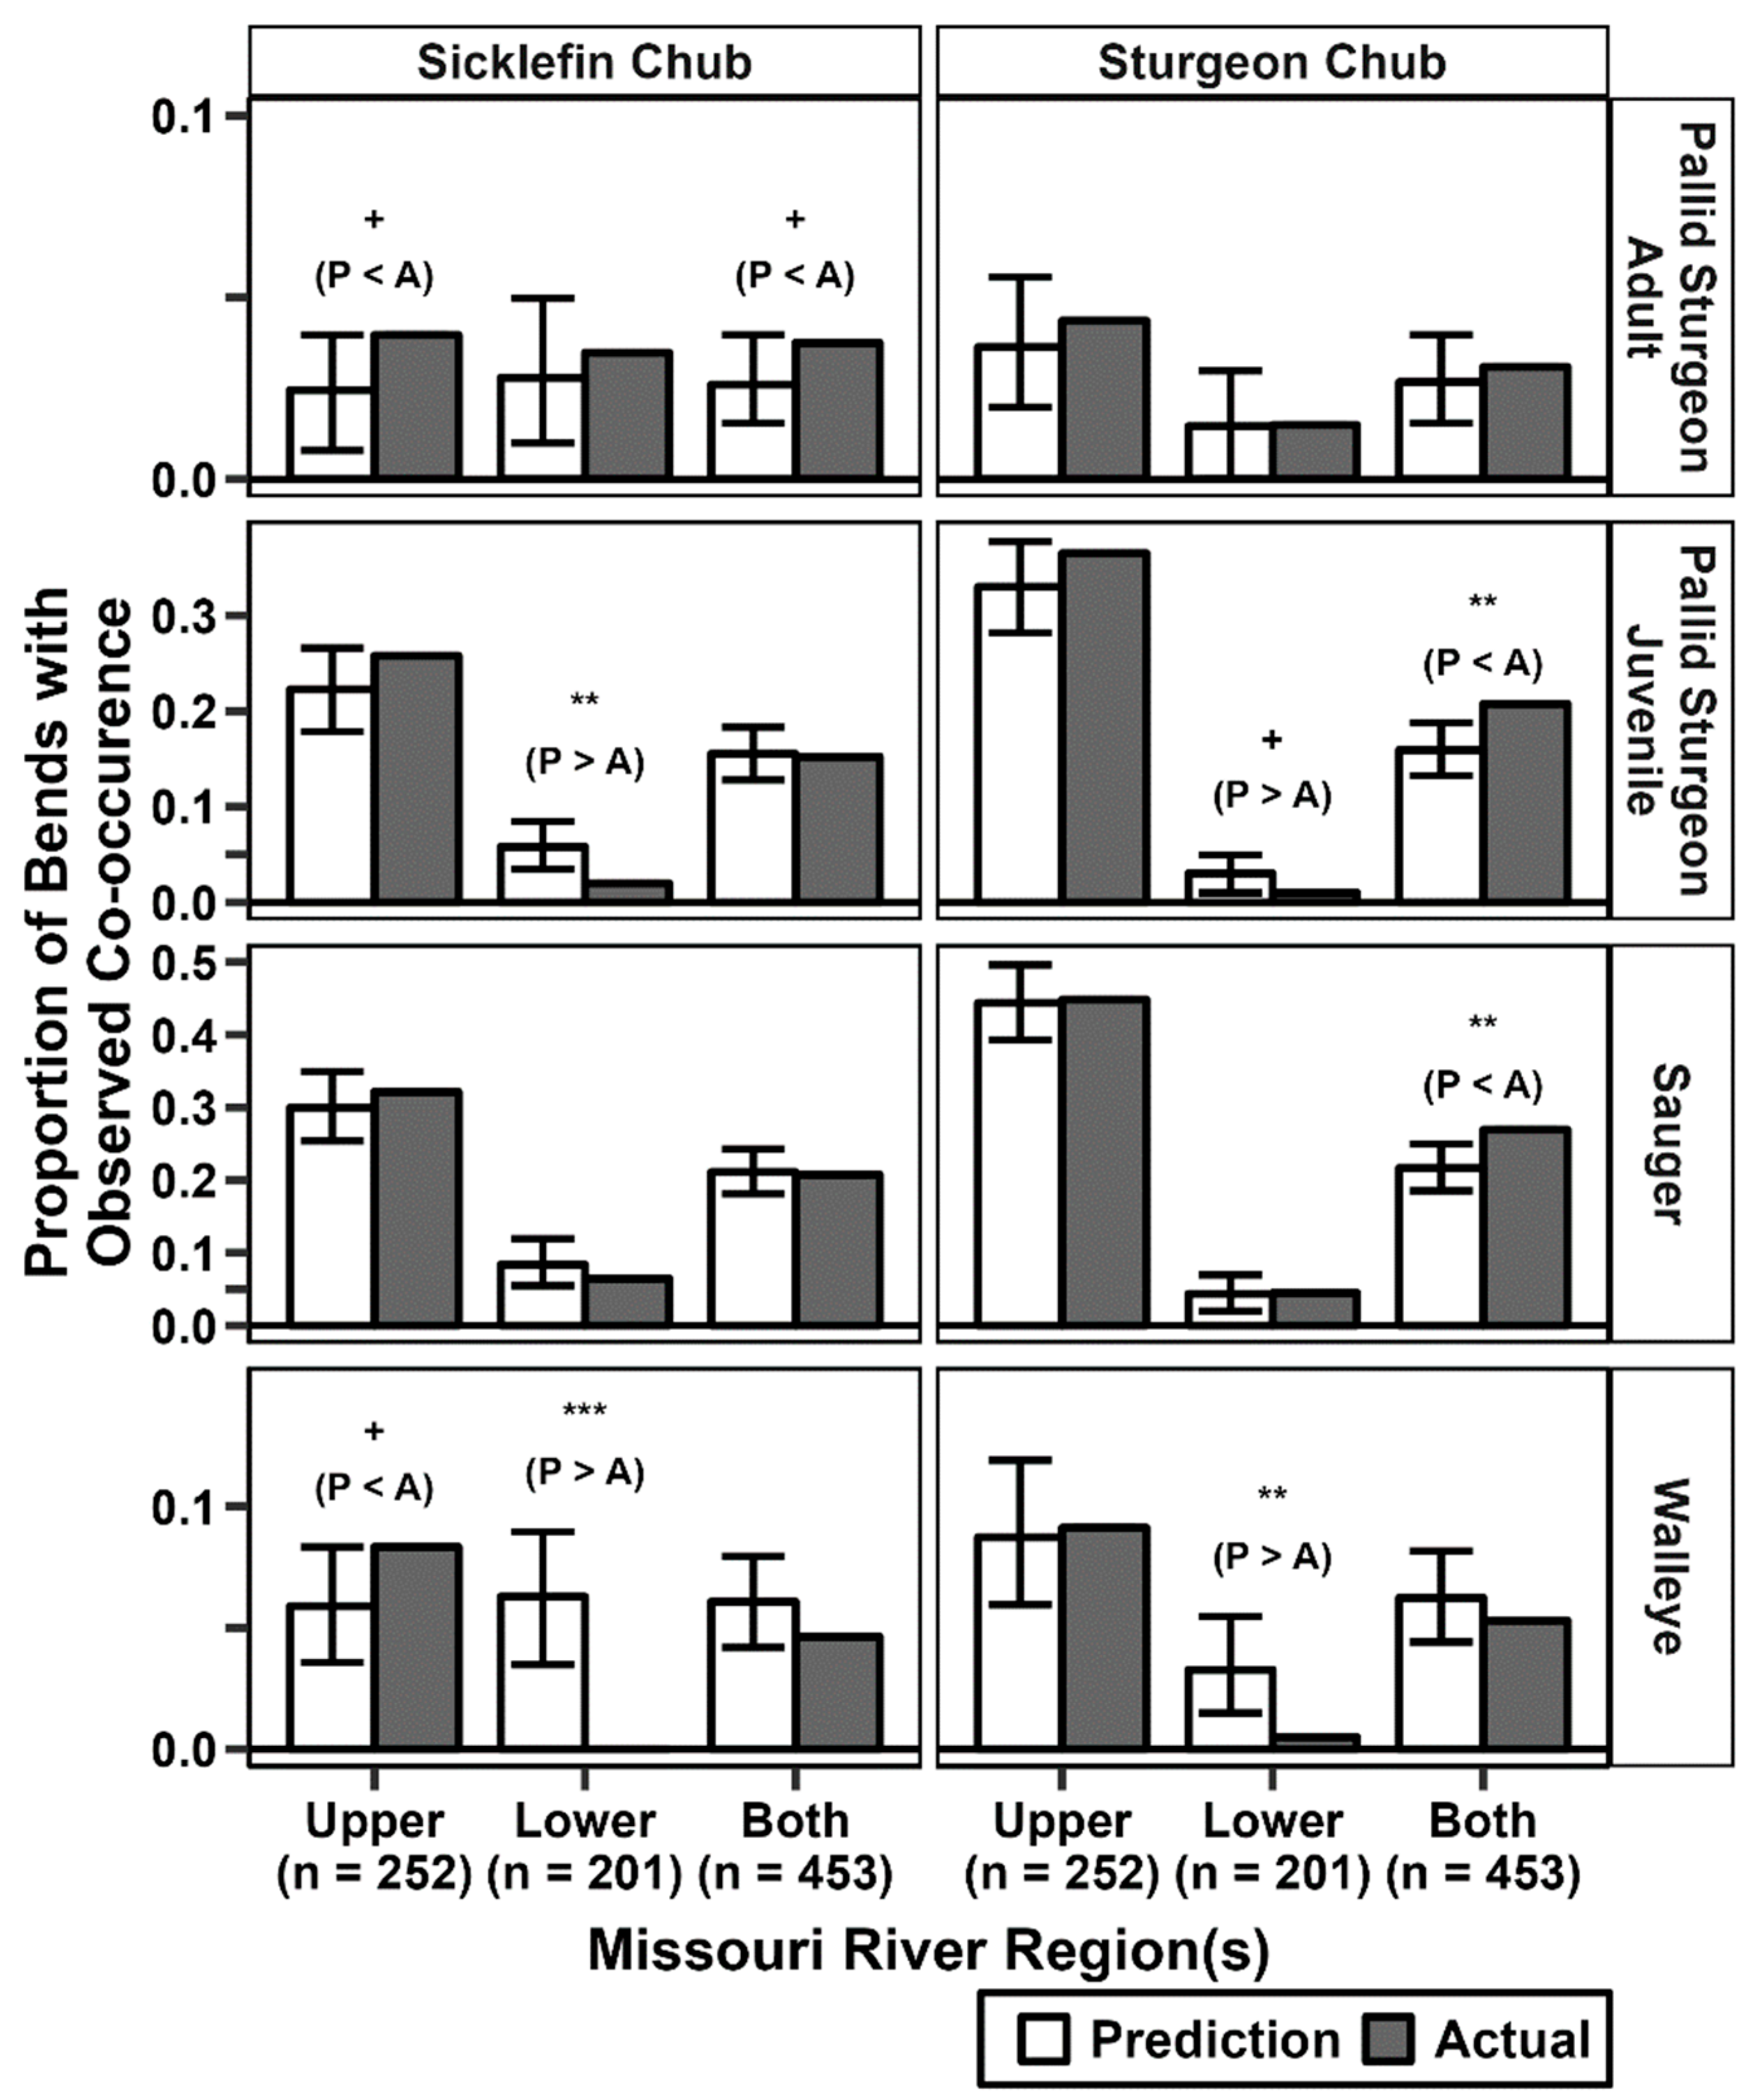
3.4. Observed Co-Occurrence and Simulations

Prior to additional filtering of the PSPAP-FC data set to account for the inclusion of trammel net (TN) captures, there were 474 PSPAP-FC river bends in the UMR, 1164 in the LMR, and 1638 bends in the entire MR. Filtering of PSPAP-FC bends to include only bends where TN sampling took place within the same week as OT16 sampling reduced the number of bends to 252 (53% of original bends) for the UMR, 201 (17%) for the LMR, and 453 (28%) for the entire MR.
Co-occurrence rates with piscivorous fishes differed between the chub species. The observed co-occurrence of sicklefin chub and adult pallid sturgeon was 44% higher than expected over the entire MR, 62% higher in the UMR, and 24% higher in the LMR (Figure 8). For sicklefin chub and juvenile pallid sturgeon, observed co-occurrence was 2% less than expected for the entire river and 66% less and 10% higher for the LMR and UMR, respectively. For sicklefin chub and sauger, observed co-occurrence was 2% lower than expected throughout the entire river, 23% lower for the LMR, and 7% higher for the UMR. For sicklefin chub and walleye, observed co-occurrence was 24% lower than expected for the entire river, and 41% higher than expected for the UMR. In the LMR, there was no observed co-occurrence between walleye and sicklefin chub (100% less than expected).
The observed co-occurrence of sturgeon chub and adult pallid sturgeon was 16% higher than expected for the entire river, 3% higher than expected for the LMR, and 20% higher than expected for the UMR (Figure 8). Observed co-occurrence between sturgeon chub and juvenile pallid sturgeon was 30% higher than expected for the entire river, 10% higher than expected for the UMR, and 68% lower than expected for the LMR. For sturgeon chub and sauger, observed co-occurrence was 24% higher than expected for the entire river, 1% higher than expected for the UMR, and 3% higher than expected for the LMR. Observed co-occurrence between sturgeon chub and walleye was 15% lower than expected for the entire river, 85% lower than expected for the LMR, and 4% higher than expected for the UMR.
For adult pallid sturgeon, there was weak evidence for higher-than-random observed co-occurrence (OC) with sicklefin chub in the UMR, and when the UMR and LMR were lumped (Figure 8). There was no evidence of different-from-random OC of adult pallid sturgeon and sturgeon chub for any MR region (Figure 8). Actual OC rates for adult pallid sturgeon and individual focal chub species were 0.04 and 0.01–0.03 across chub species in the UMR and LMR, respectively.
For juvenile pallid sturgeon, there was strong evidence for lower-than-random OC with sicklefin chub in the LMR only (Figure 8). For juvenile pallid sturgeon and sturgeon chub, there was weak evidence of lower-than-random OC in the LMR and strong evidence for higher-than-random OC when the UMR and LMR were lumped (Figure 8). Actual OC rates for juvenile pallid sturgeon and individual focal chub species were 0.22–0.33 and 0.01–0.02 across chub species in the UMR and LMR, respectively.
There was no evidence of different-from-random OC of sauger and sicklefin chub for any MR region (Figure 8). For sauger and sturgeon chub, there was strong evidence of higher-than-random OC only when the UMR and LMR were lumped (Figure 8). Actual OC rates for sauger and individual focal chub species were 0.32–0.45 and 0.04–0.06 across chub species in the UMR and LMR, respectively.
For walleye and sicklefin chub, there was weak evidence for higher-than-random OC in the UMR and very strong evidence of lower-than-random OC in the LMR (Figure 8). For walleye and sturgeon chub, there was strong evidence of lower-than-random OC in the LMR (Figure 8). Actual OC rates for walleye and individual focal chub species were 0.08–0.09 and <0.01 across chub species in the UMR and LMR, respectively.

4. Discussion

This study examined the occupancy of sicklefin and sturgeon chub within the Missouri River. Overall, they appear to differ somewhat in the habitats they occupy and have shown differing occupancy patterns over time. For example, sicklefin chub occupancy was related to annual discharge; unlike sturgeon chub, sicklefin chub occupancy was higher at the inside bend habitat and lower at the secondary connected channel habitat, whereas sturgeon chub occupancy was equally high in both habitats. Lastly, sturgeon chub occupancy stayed fairly constant over the 23-year study period, with a general downward trend at the end of that period. Sicklefin chub had many more fluctuations in occupancy that, though partially recovering, never returned to its highest occupancy levels in the early 2000s. Even though this study found some major differences between sicklefin and sturgeon chubs, there were also general commonalities. When averaged across all sampling years and sites within the study area, the mean occupancy probabilities of sicklefin and sturgeon chubs were almost identical. Both chub species had lower occupancy rates below dams. Co-occurrence was strong for the two chubs with each other, channel catfish, and shovelnose sturgeon. The observed co-occurrence of chubs and pallid sturgeon was potentially higher than expected for adult sturgeon; for juvenile pallid sturgeon, it was lower than expected in the Lower MR and likely higher than expected in the Upper MR. Co-occurrence with the two chub species was mostly less than expected with walleye and sauger. As with many phenotypically similar species, habitats occupied by sicklefin and sturgeon chubs share some features, but the two species show differing historical patterns and habitat associations, suggesting individual species management may be needed.

4.1. Occupancy Patterns

From a temporal perspective, sicklefin chub occupancy tended to be higher in the early to mid-2000s and mid-to-late 2010s. For sturgeon chub, there was much less variation, aside from a potential decline in the mid-to-late 2010s. Due to the sampling design of the PSPAP, where the same sites were not sampled every year, these changes in occupancy coefficients represent changes in the overall proportion of occupied sites per year rather than the extirpation or colonization of specific sites and, potentially, changes in population size [25]. This potential decline in occupancy matches with results reported by [15], based on sampling 60 km of the MR just above the confluence with the Yellowstone River (YR) downstream toward Lake Sakakawea, which found the catch rate of sturgeon chub in the UMR both from age 0 to 1 and over 1 year old was negatively correlated with passing years from 2004 to 2016. We found sicklefin chub annual occupancy coefficients were more variable and showed a pattern of higher occupancy rates around 2003–2005 and 2014–2016 for sicklefin chub, compared to other years. This result is also supported by [15], which found no significant correlation between catch rate and year for sicklefin chub in the UMR but noted lower catch rates in 2010 and 2012. Data from a longer time period, as well as information on potential population drivers such as food availability and patterns from other small fish species, would increase temporal predictive ability for the species. Previous research based on PSPAP data [3] documented a pattern of decline in UMR sicklefin chub relative abundance starting in 2003 through 2010, which coincided with increased pallid sturgeon stocking in the UMR [7]. This pattern of decreased sicklefin chub relative abundance with increased stocking of pallid sturgeon, along with one for sturgeon chub, in the UMR was also demonstrated by [15]. In our analysis, this pattern is seen in our annual occupancy coefficients for sicklefin chub, with lower occupancy in the late 2000s into the early 2010s followed by what appears to be a partial recovery in the mid-to-late 2010s despite continued stocking of pallid sturgeon.
If we consider occupancy patterns as a potential index of population size, the current study results suggest there was an increase in MR sicklefin chub populations from 2011 to 2014. This increased occupancy appears to be somewhat less than the levels observed in the early 2000s and was followed by lower occupancy levels from 2015 to 2018. Our results suggest that sturgeon chub populations have been at relatively constant levels, similar to those identified as a concern by USFWS in 2000, but declining more recently.
From a large-scale spatial perspective, aside from potential dam effects, occupancy between the UMR and LMR was often similar for sicklefin chub, supporting the results of [3,13]. Spatial occupancy patterns for sturgeon chub relative to dam locations were less consistent, but there was a general pattern of higher occupancy coefficients in the UMR compared to the reference HUC 8 just below Fort Peck Dam. Based on our analyses, sturgeon chub occupancy appears to have been stable in the LMR at least since the late 1990s until the late 2010s, when occupancy began to drop. These patterns follow [3,13], where many more sturgeon chub were collected in the UMR and YR compared to the LMR. One difference between areas upstream and downstream of Gavins Point Dam is the increased channelization of the river segments downstream of the dam [59], a potential driver of sturgeon chub occupancy rates that could be a subject for future research. Sturgeon chub were also never detected in the Kansas River, despite being reported as commonly caught there prior to 1953 [60].
Both focal chub species had relatively high occupancy coefficients in the MR away from major mainstem MR dams compared to HUC 8 subbasins immediately below Fort Peck and Gavins Point Dams, providing evidence for an apparent effect of dams on occupancy. Relatively low occupancy downstream of Gavins Point Dam continued for ≈438 river km after the dam for sicklefin chub and ≈311 river km for sturgeon chub. Relatively low occupancy downstream of Fort Peck Dam continued for ≈159 river km for both sicklefin and sturgeon chub. Dieterman and Galat [61] found that sturgeon chub populations were vulnerable to habitat fragmentation and needed ≈300 continuous river kilometers for the persistence of metapopulations, so low occupancy rates in the LMR could represent local extinction of populations cut off from a population source. Our results regarding dams are reflected by prior relative-abundance-based analyses of the MRBFS and PSPAP data sets. For the MRBFS, capture rates of both chubs in river segments immediately downstream of Fort Peck and Gavins Point Dams were too low to effectively model relative abundance when that data set was considered by itself [13]. Like the occupancy coefficients in current analyses, Wildhaber et al. [3] used PSPAP data from 2003 to 2010 to find a lower relative abundance of focal chubs immediately downstream of both dams. From 1996 to 1998 during the MRBFS, both chub species were collected, primarily, in river segments above Fort Peck Lake (MR segments above Fort Peck Lake were not sampled during PSPAP) and between Fort Peck Dam and Lake Sakakawea [13]; collection numbers were too low for both species just below Fort Peck Dam to model. Therefore, the MRBFS results presented by [13] are similar to our occupancy results in that sicklefin chub numbers tended to be higher in the LMR than for sturgeon chub whose numbers were much higher in the UMR, whereas both species had low numbers just below Fort Peck and Gavins Point dams. Again, one possible reason for the lower numbers of sturgeon chub in the LMR may be due to its channelization making it a much deeper, faster river than it was historically [59]. The pattern of lower occupancy or relative abundance below dams for these chub species has been described elsewhere [1,2,61] for sicklefin chub, with authors predicting the highest presence for sicklefin chub at distances exceeding 301 km below an impoundment. For the MRBFS, this same pattern of limited chub collections below LMR dams is supported by the fact that the only LMR segments where chub species were collected enough for occupancy modeling were the last two segments from below the Grand River to the Mississippi River confluence for sicklefin chub [12]. This observation is supported by the fact that previous research on the presence/absence of sicklefin in the MR and YR was possible only at the segment scale [61], similar in scale to the HUC 8 component of our model. Additionally, resampling by USFWS in 1994 of historic main channel and secondary connected channel sites sampled by [62] on the MR, limited to Missouri, collected only 93 sicklefin and 26 sturgeon chub above the Grand River based on 38 and 25 ft seine deployments covering a total of 14,120.6 m2 [63], with neither species collected in 1997 at two of the same sites [64].
This study, as with previous research [1,2,3,13,65], described sicklefin and sturgeon chub as being found in main-channel, moderate-to-high-flow macrohabitats. Sicklefin chub have, at least in the past several decades, been found primarily in the mainstem MR, whereas sturgeon chub have been found both in the MR main channel and its tributaries [1,2,3,13,65]. In this study, inside-bend, main-channel macrohabitat tended to have relatively high occupancy coefficients for both species. Interestingly, secondary connected channel and inside bend had similar occupancy coefficients for sturgeon chub, whereas secondary connected channel was less occupied by sicklefin chub compared to other macrohabitats. This divergent pattern of secondary connected channel habitat occupancy may provide niche partitioning between sicklefin and sturgeon chub. Current analyses show similar results as the MRBFS [13] in that main and secondary connected channels tended to have the highest occupancy for sturgeon chub. During the PSPAP sampling, macrohabitats were sampled within a bend, so original comparisons possible among macrohabitats were nested within a bend [3]. Macrohabitat usage patterns found previously [3] indicate that sturgeon chub tended to be found in bends with additional macrohabitat types beyond the main channel (i.e., inside bends, outside bends, and channel crossover). However, the relative abundance of sicklefin and sturgeon chub where found tended also to be higher in bends with secondary connected channels, without additional macrohabitats in the UMR, and lower for sicklefin chub in the LMR [3]. Within a bend type, which particular flowing macrohabitats present tended to have the highest relative abundance varied between species and between the UMR and LMR [3]. These differences in macrohabitat usage between species suggest that sicklefin chub are more frequently found in main-channel macrohabitats than sturgeon chub. In the laboratory [33], further potential evidence for niche partitioning among our study species comes from the fact that sicklefin chub selection of mud or sand habitat was unaffected by the presence of food, whereas juvenile pallid, shovelnose, and pallid/shovelnose hybrid sturgeon selected habitat with food. The selection for mud over sand was also greater for juvenile pallid sturgeon compared to sicklefin and shoal chub (Macrhybopsis hyostoma) and pallid/shovelnose hybrid sturgeon [33].
Water conditions can be related to the occupancy coefficients of sturgeon chub but not sicklefin chub. In this study, sturgeon chub were found more often in cooler, faster water. Previous research using various subcomponents of data that we also used provides a mixed picture for these two chub species, with studies differing in what water conditions are considered best for their presence or abundance. Because the focus of our study is general patterns across much of the range of these species, we only report patterns from other literature as opposed to specific values, as these values may not be applicable to the scale of our study. Sicklefin chub have been found more often in cooler water (MRBFS and PSPAP, [3,13]), but work MR 8 km upstream and 48.3 km downstream of the confluence with YR and 24 km of the lower YR [66] found them in warmer waters. Wildhaber et al. [3] found that sturgeon chub occurred most often in cooler water in the UMR. Sampling the same area as [59], with the addition of an inter-reservoir segment below Lake Sakakawea, sicklefin chub were reported to occur more often in slower water [44] where [66] reported faster water use; similar patterns have been reported for sturgeon chub [44,66]. The MR inter-reservoir segments lack water conditions conducive to chub survival, as we and [44] found neither chub in the inter-reservoir segments below Lake Sakakawea. Sicklefin and sturgeon chub were found to occur more often in deeper water in the UMR [3], but sturgeon chub were found to occur more often in shallower water in the LMR [3]. When analyzing the presence/absence of sicklefin chub with river segment (i.e., 48.3 to 191.6 km; similar in size to an HUC 8) as the site, sicklefin chub were found to occur more often in turbid waters [44]. Flow constancy and the percentage of annual flow occurring in August [61] also seem to affect sturgeon chub, which occur more often in faster water in the UMR and LMR [3]. Sturgeon chub occur more often in either clearer [3,66] or turbid waters [44,61].
Further research is needed to help clarify the relationship of sicklefin and sturgeon chub occupancy to water conditions. Whereas previous researchers came to some different conclusions compared to ours and others, the spatial scale model of their studies [61] and their spatial extents [15,44,66] differ greatly from ours and cover shorter time spans. Our model included both large and small spatial scale components examined across the previous studies. For example, Dieterman and Galat [61] may have included some additional MR segments above Fort Peck Dam and segments above the Grand River that were not included in our study, but their analyses were done at the scale of segment, similar to our HUC 8 subbasins, which account for the geographic differences along the MR. In our case, by including the HUC 8 subbasins in our model to account for geographic differences, any additional significance of temperature, depth, velocity, and turbidity in the model is after accounting for the geographical differences and represent range-wide, general patterns, so our analyses provide a wider-spanning picture as to temporal and spatial, long-term patterns of occupancy for sicklefin and sturgeon chub in the MR than previously available. Given the strong predictive ability of the occupancy component of the two-species occupancy model, as demonstrated by a high AUC value of 0.862, our broad-scale patterns related to water conditions could provide valuable information needed to make management decisions related to sicklefin and sturgeon chub, even at the local scale of macrohabitat.

4.2. Possible Discharge Patterns

Occupancy coefficient patterns relative to annual discharge suggest that discharge could be a contributing factor to changes seen in sicklefin chub over time. The annual pattern of occupancy coefficients for sicklefin chub appears to be negatively related to prior- and current-year discharge in the LMR and current-year discharge in the UMR. These results suggest higher annual discharges may be detrimental to sicklefin chub populations in the LMR. It is possible that this negative relationship is due to either the reduction in already reduced shallow spawning habitats or the loss of sicklefin chubs from the system by being swept into the Mississippi River by higher discharge in the more channelized LMR [1,33]. Relationships to river discharge have been shown for spawning in other cypriniform fishes such as grass carp (Ctenopharyngodon idella; [67] and references therein) and blue suckers (Cycleptus elongatus, [68]) and recruitment for other small, benthic fish species such as the Neosho madtom (Noturus placidus, [50]). Our results provide some additional factors that may result in niche partitioning between these two chub species, but determining this requires further investigation. Notably, our results suggest that sicklefin chub recruitment is related to discharge rate, with the greatest site occupancy rate increases in years with lower discharge; this follows the previously mentioned hypothesis that sicklefin chubs may be included with other fish species where recruitment benefits from low water discharge years [61]. Further research into the relationship between discharge and sicklefin and sturgeon chub population changes could help to determine if regulating discharge could be a possible management tool for maintaining and potentially increasing their populations and potentially improving prey resources for pallid sturgeon.

4.3. Co-Occurrence across Analyses

The co-occurrence of sicklefin and sturgeon chub with shovelnose sturgeon and channel catfish provides potential insight for species relationships. Sicklefin and sturgeon chub had a high rate of co-occurrence, as demonstrated from predictions derived from three-species occupancy models. However, when examining these patterns more closely in the two-species model, co-occurrence was not correlated with any of the water condition variables we tested. These results suggest that sicklefin and sturgeon chub co-occurrence is more a result of similar habitat selection at macrohabitat and HUC 8 scales, as opposed to a finer scale of selection not measured in these monitoring studies, where habitat partitioning may be occurring between these species. Sicklefin and sturgeon chub occupancy was higher in the presence of each other and channel catfish and shovelnose sturgeon. The association between the two chub species and shovelnose sturgeon indicates their selection for the same habitat and ability to co-exist therein. This could lead to potential competitive interactions for habitat and food resources if shared resources become limiting [33]; this may also be the case for channel catfish that are considered habitat generalists. However, our strong co-occurrence patterns among these four species suggest that management for the improvement of sicklefin and sturgeon chub populations may benefit shovelnose sturgeon and channel catfish populations.
Regarding bend-level observed co-occurrence, we found significantly higher-than-random co-occurrence of sturgeon chub with juvenile pallid sturgeon and sauger only when both MR regions were combined. This lack of within-region deviations from randomness is likely due to the fact that the occurrence of all three species is greater in the UMR compared to the LMR. Though there was weak or no statistical evidence of differences, sicklefin and sturgeon chub actual observed co-occurrence with adult pallid sturgeon was always at least slightly higher than predicted observed co-occurrence. Weak evidence for the higher-than-random co-occurrence of adult pallid sturgeon and walleye with sicklefin chub in the UMR suggests that an occupancy-model-based study specifically designed for rare species (e.g., [19]) could further explore co-occurrence relationships between adult pallid sturgeon and walleye with sicklefin chub and other potential prey species. Overall, these results will be important to resource managers if the potential for competition between these two chub species and juvenile pallid sturgeon, as well as shovelnose sturgeon, observed in laboratory studies [19] occurs in the natural environment. There is also the potential that adult pallid sturgeon, as chub predators, may have at least part of their demonstrated population declines [3,15] attributable to the loss of prey resources, e.g., chubs. The stocking of predatory fish, a common fisheries management tool, can cause declines in prey fish populations ([67] and references therein). Again, these combined results support the hypothesis that improving conditions for sicklefin and sturgeon chub conservation and recovery would be expected to improve conditions for shovelnose sturgeon, pallid sturgeon, and channel catfish in the MR indirectly through increased habitat availability and associated food resources and directly for adult pallid sturgeon via increased prey resources.
Regarding observed co-occurrence levels, there are some other potential directions for further study for adult and juvenile pallid sturgeon, sauger, and walleye. Sicklefin and sturgeon chub appear to co-occur with adult pallid sturgeon at higher-than-predicted levels, with a similar pattern for juvenile pallid sturgeon in the UMR. Support for these patterns based on these simulations was low to marginal, possibly due to low sample size, warranting future research. In the channelized LMR, there was evidence suggesting lower-than-expected co-occurrence of juvenile pallid sturgeon and chubs, but sample sizes were low. This result is nevertheless supported by mesocosm habitat selection studies [33], where selection for mud over sand was greater for juvenile pallid sturgeon compared to sicklefin and shoal chub and juvenile pallid/shovelnose hybrid sturgeon. As with shovelnose sturgeon and channel catfish, the association between the two chub species and juvenile pallid sturgeon does not refute previous observations that they may be potential competitors for habitat and food resources [33]. For adult pallid sturgeon, the association with two chub species may reflect its almost exclusive consumption of fish, including sicklefin and sturgeon chub, to attain historically observed adult sizes [6,34,35,53,54]. Data for examining the co-occurrence of sicklefin and sturgeon chub with pallid sturgeon were limited. However, if the patterns we observed could be validated through a more directed study, consistent association patterns observed among these species groups would also support the idea that management for the improvement of sicklefin and sturgeon chub populations could affect both juvenile and adult pallid sturgeon populations. For walleye and sauger, there was no consistent association with sicklefin and sturgeon chub based on limited data available for the MR. Therefore, we were unable to provide evidence supporting the hypothesis that walleye and sauger are important predators of sicklefin and sturgeon chub in the MR; this is also true for previous work by Dieterman [69].
Co-occurrence patterns observed in this study also illustrate the potential for further study to assess if some areas of the MR could support a greater number of benthic fish species such that sturgeon and sicklefin chub, shovelnose and pallid sturgeon, channel catfish, sauger, and walleye would be more likely to be found there. A primary area of study could be in the UMR where, on top of strong co-occurrence between both chub species, shovelnose sturgeon, and channel catfish, the proportion of bends with the observed co-occurrence of each chub species and adult and juvenile pallid sturgeon, sauger, and walleye was often higher than predicted given random distributions. If there are areas that support more benthic fish species than others, it would make sense for these predator species to concentrate in these areas. Interestingly, this pattern of increased association was reversed for both chub species and pallid sturgeon juveniles in the LMR. One potential focus for future research could be to assess potential factors that may drive these differences between the UMR and the LMR. If resources are more limited in general below Gavins Point Dam, then competition for food, appropriate spawning and egg-laying sites, or another resource could limit the potential of juvenile pallid sturgeon co-occurrence with these two chub species within a bend. Adult pallid sturgeon and sicklefin chub had a higher-than-predicted rate of co-occurrence in both the UMR and the river as a whole. This indicates that further study into the relationships between these species could be beneficial. Pallid sturgeon, as a large mobile species, can move freely between bends, so they may be selecting them based on the availability of prey or another environmental variable.

4.4. Other Potential Future Research

Overall, our research hints at several avenues for future research to further increase our understanding of sicklefin chub, sturgeon chub, and the Missouri River benthic fish assemblage as a whole. Studies designed specifically targeting chub species could select spatial and temporal sampling methods that are designed around species’ life histories. This could allow the construction of multi-season occupancy models that include local extinction and colonization rates, providing a more complete picture of chub populations [38]. Along with this, developing multispecies occupancy models for rare species to further explore the relationship between pallid sturgeon and chub occurrence would enhance our understanding of the ecological requirements of both species. Additional models that include other small benthic species that are potential competitors as potential co-occurrent species would also help to elucidate factors influencing where the species occur in the MR. Studies including environmental variables (e.g., aquatic invertebrate abundance, discharge, distance to impoundment, and physical features of the river bed) other than those currently available would also allow researchers to better determine how environmental factors influence occupancy, co-occurrence, differences between upper and lower river segments, and sites potential for fish biodiversity. We hope that our research might provide a starting point for future research, could enhance our understanding of the MR, and benefit the conservation of its biotic community.

5. Conclusions

Using a variety of analytical approaches from occupancy modeling to simple correlation analyses, we elucidate relationships among time, space, environmental factors, and habitat and the occurrence and co-occurrence of key benthic fishes found in the MR. This work provides important information on how sampling conditions of the MR may affect detection probabilities and thus insight into additional considerations for future sampling gear and efforts. We also provide hypotheses to be considered in future research related to management associated with MR fish populations based on the most extensive data currently available. Such information is critical to informing continued efforts to modify the habitat of the LMR to improve conditions for chubs and potentially endangered pallid sturgeon. Given the long history of habitat loss and population declines, sicklefin and sturgeon chub should continue to be of interest for the foreseeable future. Future studies focusing solely on chubs could select sample sites of appropriate size and resample each site frequently enough to construct multi-season occupancy models with extinction and colonization rates for each site. This would help monitor changes in chub populations and any loss or gain in the range of sicklefin and sturgeon chubs.

Author Contributions

M.L.W. conceptualized this study. M.L.W. and B.M.W. developed the methodology. M.L.W., B.M.W. and J.H.M. conducted formal data analysis. M.L.W., B.M.W., K.R.B., J.H.M., J.L.A. and N.S.G. assisted in investigation. M.L.W. provided resources. M.L.W. and K.R.B. provided data curation. M.L.W., B.M.W., K.R.B. and J.H.M. wrote the original manuscript draft; all authors contributed to producing the final manuscript draft. M.L.W., B.M.W., K.R.B. and J.H.M. visualized the data. M.L.W. acquired funding. M.L.W. provided study administration and supervision. All authors have read and agreed to the published version of the manuscript.

Funding

The research was funded by the U.S. Fish and Wildlife Service (IA 4500146736) and with in-kind support from U.S. Geological Survey Columbia Environmental Science Center.

Institutional Review Board Statement

All data used in this study were from extant monitoring programs; this study did not involve the capture, observation, or use of additional animals.

Informed Consent Statement

Not applicable.

Data Availability Statement

Raw monitoring data for Missouri River Benthic Fishes are available as a U.S. Geological Survey (USGS) Data Release [29]. Occupancy model coefficients and observed co-occurrence simulation initial values and results are also available as a USGS Data Release [58]. The U.S. Army Corps of Engineers manages the Pallid Sturgeon Population Assessment Project and its associated raw data; inquiries can be directed to Tim Welker at tim.l.welker@usace.army.mil.

Acknowledgments

We would like to thank the U.S. Geological Survey Columbia Environmental Research Center staff who helped with manuscript analytical aspects, review, and editing: K.K. Ditter, Z.D. Beaman, and A.P. Moore, as well as U.S Army Core of Engineers, U.S. Bureau of Reclamation, U.S. Environmental Protection Agency, U.S. Fish and Wildlife Service, Kansas Department of Wildlife and Parks, Iowa Department of Natural Resources, Missouri Department of Conservation, Montana Department of Fish, Wildlife and Parks, Nebraska Game and Parks Commission, North Dakota Game and Fish Department, South Dakota Department of Game, Fish and Parks, The Wildlife Management Institute, The University of Missouri, Kansas State, University, Iowa State University, South Dakota State, University, Montana State University, and The University of Idaho. Any use of trade, firm, or product names is for descriptive purposes only and does not imply endorsement by the U.S. Government.

Conflicts of Interest

The authors declare no conflicts of interest.

Appendix A. Data Sources

Starting in 1996, the Missouri River (MR) Benthic Fishes Study (MRBFS) documented annual patterns, habitat, and water quality associations of 21 benthic fish species based on relative abundance, including sicklefin and sturgeon chub [13]. Sampling occurred in the unimpounded mainstem of the MR from above Fort Peck Reservoir, Montana, to its confluence with the Mississippi River and the last 48 km of the Yellowstone River (i.e., Lower Yellowstone River; Figure 1; [13]). For three years, 1996 to 1998, segments of these rivers were sampled annually between July and September using a stratified random design [13]. Sampling was stratified over six different macrohabitats: main-channel crossovers, outside bends, inside bends, tributary mouths, and connected and secondary non-connected channels. These divisions led here and in the PSPAP data set to a hierarchical nested sampling design of (a) river segments/HUC 8 sections; (b) river bends (primary sampling unit); (c) macrohabitat types; (d) specific sampling sites/trawling locations within macrohabitat within river bends. This design required the use of five types of gear for collecting fishes: drifting trammel net, electrofishing, stationary gill nets, bag seine, and bottom trawl. Fish species were identified by boat crews, and 461 voucher specimens were sent to an expert ichthyologist for verification [26]. Along with fish samples, information about the riverine environment was collected: water temperature, velocity, depth, conductivity, turbidity, and the proportions of sand, silt, and gravel within the riverbed were measured.
Starting in the fall of 2003, the Pallid Sturgeon Population Assessment Program (PSPAP) was initiated based on the MRBFS design [3,27]. The PSPAP encompassed the MR from Fort Peck Dam, Montana, at river km 2851 downstream to the confluence of the MR and Mississippi River near St. Louis, Missouri, at river km 0 and the lower 32.2 km of the KR ([3]; Figure 1). Sampling years ran from 1 November of the prior year through 31 October of the named year (e.g., sampling year 2004 was from 1 November 2003 to 31 October 2004). The PSPAP used 14 different types of gear (i.e., gill nets, modified gill nets, trammel nets, otter trawls, mini-fyke nets, trot lines, push trawls, beam trawls, larval fish drift nets, hoop nets, bag seines, set lines/bank lines, and fishing/angling) to sample fish species in the river. For example, sampling year 2004 was from 1 November 2003 to 31 October 2004. To minimize risk to pallid sturgeon, each PSPAP sampling year was divided into two seasons. The sturgeon sampling season (ST) occurred from autumn, when water temperature was less than 12.8 °C (usually October or November), to June 30 of the sampling year. These lower water temperatures allowed for the use of gill nets to safely catch pallid sturgeon; most non-gill net gear types, e.g., otter trawls, were deployed during the March through June portion of sturgeon season [27]. Fish community sampling season (FC) occurred from July 1 to October 31 of a sampling year; this season did not use gill nets and instead utilized a variety of other gear types to sample young-of-the-year pallid sturgeon and other species that make up the benthic fish community. Throughout our analyses, we only used FC data from the PSPAP because the sampling protocols for that season were consistent and used types of gear directed at capturing non-pallid sturgeon species. For the PSPAP, sampling sites consisted of bends of the river randomly selected from within each of 13 defined segments. These segments were defined based on a variety of hydrologic variables and differed slightly from the segments of the MRBFS. Fish were identified to species by the boat crews, or if field identification was not possible, specimens were preserved for laboratory identification [28]. Along with these samples, the environmental variables of water temperature, velocity, depth, turbidity, and substrate composition were measured. Lastly, although substrate characteristics were collected, inconsistencies in data collection prevented substrate from being included in any analyses [3].

Appendix B. Data Filtering and Processing

The PSPAP and MRBFS data were filtered and partitioned to reduce the risk of biased samples, ensuring only data that followed standard sampling protocols were used, which allowed for the creation of a data set that included both MRBFS and PSPAP data. Because neither the MRBFS nor PSPAP was designed to inform occupancy modeling (though see [20]), multiple steps were required to make the data appropriate for this type of model. Occupancy modeling and its data requirements were discussed further in Section 2.4.1. “Occupancy Models” of the main manuscript, but the general data structure required for these models are binary detection/non-detection data collected across sites, where each site is visited multiple times [38]. Two key occupancy model assumptions that affect data processing included (1) the closed occupancy state of a site—that is, the species does not immigrate to or emigrate from the site within a single season—and (2) occupancy and detection between sites and visits are independent [38]. For all data sets, we defined a site as a unique combination of river bend, macrohabitat, and year. An individual visit to a site was defined as one benthic trawl deployment there; we assumed that trawl deployments were spatially independent. This definition of visits allowed us to use spatial replicates as visits for occupancy models, as was done by Kelly et al. [37]. Details of these processed data sets and the steps used to arrive at them are explained below.
For all extant PSPAP data, we used random gear deployments from randomly sampled river bends, as this was the standard study protocol [3,27]; this filter contributed to ensuring independence between samples. We only used PSPAP samples collected using the standard gear that accounted for the majority of sicklefin and sturgeon chub captures, the 4.8 m-wide otter trawl (OT16).
We limited our data to trawls with lengths between 75 m and 300 m, the standard OT16 distance range for PSPAP samples. Changes in the PSPAP protocol implemented in 2019 drastically reduced the spatial and temporal extent of OT16 sampling and eliminated the fish community season [10]. These changes made data collected after 2018 incomparable to those collected during or before that. Therefore, we only used PSPAP data collected prior to sampling year 2019.
This PSPAP-FC data set included data collected from 1 July to 31 October of the sampling year [3,27]. We defined visits to a site using spatial separation within a bend. The design of the PSPAP sampling protocol included revisiting some of the same bends during the two different sampling seasons within a sampling year. We used data from only one sampling to ensure independence between sites.
The support for using OT16 data for our study is provided by the fact that the great majority of sicklefin and sturgeon chub, channel catfish, and shovelnose sturgeon collections came from OT16 deployments. Across all pre-filtered PSPAP data, samples collected using OT16 accounted for >91% and >98% of standard gear captures of sicklefin and sturgeon chub, respectively. Of all PSPAP sites sampled with OT16 where sicklefin chub were detected in any gear, 98.5% of these sites had sicklefin chub detected in OT16; this was 99.1% for sturgeon chub. For our secondary species of all PSPAP sites sampled with OT16 where channel catfish were detected in any gear, 90.7% of these sites had channel catfish detected in OT16. Among all OT16-sampled PSPAP sites where shovelnose sturgeon were detected, this percentage was 87.2% for shovelnose sturgeon.
The MRBFS data set was initially filtered in two stages: a first to make the data conform to standard protocols for a single sampling gear, and a second to create a combined data set with the PSPAP-FC data, named the “MRBFS+PSPAP-FC” data set. This combination was used due to the comparatively small size of the MRBFS data set by itself, 759 sites after the first filtering stage compared to the >3300 sites of each PSPAP data set. Prior to combining, we filtered the MRBFS to include only samples collected with standard gear that accounted for the majority of sicklefin and sturgeon chub captures, the 2 m bottom trawl (BT). The OT16 was not deployed during the MRBFS, and the BT was not used during the PSPAP. To make the data comparable to the PSPAP data, we limited our data to trawling distances of 75–300 m; the standard BT distance range for MRBFS samples was 150–300 m [26]. Prior to combination, the MRBFS and PSPAP-FC data sets were filtered so that they contained only river segments sampled by both projects; MR sites above Fort Peck Dam and Yellowstone River sites were eliminated from the MRBFS data, and, for the combined data set only, KR sites were removed from the PSPAP-FC data. The combined MRBFS+PSPAP-FC data set had 14.7% MRBFS sites (n = 580) and 85.3% PSPAP-FC sites (n = 3346) after all filtering.
As with the PSPAP data, the support for using MRBFS BT data for our study is provided by the fact that the great majority of sicklefin and sturgeon chub collections came from BT deployments. Across all pre-filtered MRBFS data, the BT accounted for >96% and >87% of samples containing sicklefin and sturgeon chub, respectively. Of all MRBFS sites sampled with BT where sicklefin chub were detected in any gear, 97.8% of these sites had sicklefin chub detected in BT; this was 95.5% for sturgeon chub.
After initial filtering, the potential list of macrohabitats was consolidated to the following five common to all data sets: inside bend, outside bend, channel crossover, tributary mouth, and secondary connected channel. These were the only macrohabitats randomly sampled using BT in the MRBFS data. To match macrohabitats in the MRBFS data and consolidate similar macrohabitats with limited sample size in the PSPAP data, we lumped small and large secondary connected channel habitats as “secondary connected channel”, and we lumped large and small tributary mouth habitats as “tributary mouth.” After such lumping, we excluded macrohabitats represented by fewer than 10 sites—i.e., a unique segment, bend, macrohabitat, and year site combination—in the PSPAP-FC data set. This condition excluded four macrohabitats: dam tailwater, dendritic channel, deranged channel, i.e., channels with no discernable branching pattern, and secondary non-connected channel. Additionally, we included only macrohabitats where at least 10 sites had detections of at least one of the focal chub species (i.e., two additional macrohabitats were excluded: braided channel and confluence). All five selected macrohabitats met these sample size and capture rate requirements in the MRBFS data.
Only sites located in the mainstem MR or in tributaries that were consistently sampled within a data set were included, i.e., MR tributaries or HUC 8 subbasins that were part of standard sampling protocols [26,27]. Among the data used, the only consistently sampled tributary was the KR for the PSPAP data; other tributaries were excluded. Reservoirs were also excluded, as they were not consistently sampled and did not represent standard river habitat. All sites between Garrison Dam (near Riverdale, North Dakota, USA) and Lake Oahe (North and South Dakota, USA) were excluded as well, as neither focal chub species was observed in this stretch of river by either the MRBFS or the PSPAP. Additionally, this stretch was only sampled by the PSPAP for two sampling years, 2012 and 2013. Each site was assigned to a subbasin designated by a U.S. Geological Survey-standardized 8-digit Hydrologic Unit Code ([30]; HUC 8, Figure 1). The HUC 8 subbasins were chosen as a universal spatial designation similar in size to the different segment systems used by the MRBFS [13,26] and PSPAP [3,27].
We used additional processing steps to make the environmental variables meet the independence assumption. First, within each data set at each site (i.e., macrohabitat), we calculated the mean value across visits for environmental variables of water temperature, depth, velocity, and turbidity. Second, prior to calculating these means, the data were graphically inspected for impossible values. Sites with impossibly high recorded water temperatures (>60 °C) were excluded, resulting in the exclusion of one to two sites from each data set.

References

  1. Albers, J.L. Sicklefin chub: Macrhybopsis meeki (Jordan and Evermann 1896). In Kansas Fishes; University Press of Kansas: Lawrence, KS, USA, 2014; pp. 184–186. ISBN 978-0-7006-1961-0. [Google Scholar]
  2. Albers, J.L. Sturgeon chub: Macrhybopsis gelida (Girard 1856). In Kansas Fishes; University Press of Kansas: Lawerence, KS, USA, 2014; pp. 178–180. ISBN 978-0-7006-1961-0. [Google Scholar]
  3. Wildhaber, M.L.; Yang, W.H.; Arab, A. Population trends, bend use relative to available habitat and within-river-bend habitat use of eight indicator species of Missouri and Lower Kansas River benthic fishes: 15 years after baseline assessment. River Res. Appl. 2016, 32, 36–65. [Google Scholar] [CrossRef]
  4. William, B. Endangered and Threatened Wildlife and Plants; 12-Month Finding for a Petition to List the Sicklefin Chub (Macrhybopsis meeki) and the Sturgeon Chub (Macrhybopsis gelida) as Endangered; 01-9443; U.S. Fish and Wildlife Service: Washington, DC, USA, 2001; pp. 19910–19914. Available online: https://www.govinfo.gov/content/pkg/FR-2001-04-18/html/01-9443.htm (accessed on 2 November 2023).
  5. U.S. Fish and Wildlife Service. Species Status Assessment for the Sturgeon Chub (Macrhybopsis gelida) and Sicklefin Chub (Macrhybopsis meeki); U.S. Fish and Wildlife Service, Region 6: Lakewood, CO, USA, 2023. Available online: https://ecos.fws.gov/ServCat/DownloadFile/238509 (accessed on 29 September 2023).
  6. Gerrity, P.C.; Guy, C.S.; Gardner, W.M. Juvenile pallid sturgeon are piscivorous: A call for conserving native cyprinids. Trans. Am. Fish. Soc. 2006, 135, 604–609. [Google Scholar] [CrossRef]
  7. Huenemann, T. Central Lowlands and Interior Highlands Pallid Sturgeon Spawning and Stocking Summary 1992–2017; Middle Basin Pallid Sturgeon Workgroup: Lincoln, NE, USA, 2010; Available online: http://meridian.allenpress.com/jfwm/article-supplement/433030/pdf/10_3996022018-jfwm-013_s4 (accessed on 2 November 2023).
  8. Quist, M.C.; Boelter, A.M.; Lovato, J.M.; Korfanta, N.M.; Bergman, H.L.; Korschgen, C.E.; Galat, D.L.; Latka, D.C.; Krentz, S.; Oetker, M.; et al. Research and Assessment Needs for Pallid Sturgeon Recovery in the Missouri River: Final Report to the U.S. Geological Survey, U.S. Army Corps of Engineers, U.S. Fish and Wildlife Service, and U.S. Environmental Protection Agency; William D. Ruckelshaus Institute of Environment and Natural Resources, University of Wyoming: Laramie, WY, USA, 2004; p. 82. Available online: https://pallidsturgeon.org/wp-content/uploads/2018/01/28-Quist-et-al-2004.pdf (accessed on 19 December 2023).
  9. Rahel, F.J.; Thel, L.A. Sturgeon Chub (Macrhybopsis gelida): A Technical Conservation Assessment; USDA Forest Service, Rocky Mountain Region: Laramie, WY, USA, 2004; pp. 1–49. Available online: https://www.fs.usda.gov/Internet/FSE_DOCUMENTS/stelprdb5206786.pdf (accessed on 16 November 2023).
  10. Welker, T.L.; Drobish, M.R.; Williams, G.A. Pallid Sturgeon Population Assessment Project, Guiding Document, Volume 2.0; U.S. Army Corps of Engineers, Omaha District: Yankton, SD, USA, 2020. [Google Scholar]
  11. Ridenour, C.J.; Starostka, A.B.; Doyle, W.J.; Hill, T.D. Habitat used by chubs associated with channel modifying structures in a large regulated river: Implications for river modification. River Res. Appl. 2009, 25, 472–485. [Google Scholar] [CrossRef]
  12. Ridenour, C.J.; Wrasse, C.J.; Meyer, H.A.; Doyle, W.J.; Hill, T.D. Variation in Fish Assemblages among Four Habitat Complexes during a Summer Flood: Implications for Flow Refuge; U.S. Fish and Wildlife Service, Columbia Fish and Wildlife Conservation Office: Columbia, MO, USA, 2012. [Google Scholar]
  13. Wildhaber, M.L.; Gladish, D.W.; Arab, A. Distribution and habitat use of the Missouri River and Lower Yellowstone River benthic fishes from 1996 to 1998: A baseline for fish community recovery. River Res. Appl. 2012, 28, 1780–1803. [Google Scholar] [CrossRef]
  14. Steffensen, K.D.; Shuman, D.A.; Stukel, S. The status of fishes in the Missouri River, Nebraska: Shoal chub (Macrhybopsis hyostoma), sturgeon chub (M. gelida), sicklefin chub (M. meeki), silver chub (M. storeriana), Flathead chub (Platygobio gracilis), plains minnow (Hybognathus placitus), western silvery minnow (H. argyritis), and brassy minnow (H. hankinsoni). Trans. Neb. Acad. Sci. 2014, 34, 49–67. Available online: https://digitalcommons.unl.edu/tnas/470/ (accessed on 16 January 2024).
  15. Braaten, P.J.; Fuller, D.B.; Haddix, T.M.; Hunziker, J.R.; Colvin, M.E.; Holmquist, L.M.; Wilson, R.H. Catch rates for sturgeon chubs and sicklefin chubs in the Upper Missouri River 2004–2016 and correlations with biotic and abiotic variables. J. Fish Wildl. Manag. 2021, 12, 322–337. [Google Scholar] [CrossRef]
  16. MacKenzie, D.I.; Nichols, J.D.; Hines, J.E.; Knutson, M.G.; Franklin, A.B. Estimating site occupancy, colonization, and local extinction when a species is detected imperfectly. Ecology 2003, 84, 2200–2207. [Google Scholar] [CrossRef]
  17. Gu, W.; Swihart, R.K. Absent or undetected? Effects of non-detection of species occurrence on wildlife–habitat models. Biol. Conserv. 2004, 116, 195–203. [Google Scholar] [CrossRef]
  18. Royle, J.A.; Nichols, J.D.; Kéry, M. Modelling occurrence and abundance of species when detection is imperfect. Oikos 2005, 110, 353–359. [Google Scholar] [CrossRef]
  19. Specht, H.M.; Reich, H.T.; Iannarilli, F.; Edwards, M.R.; Stapleton, S.P.; Weegman, M.D.; Johnson, M.K.; Yohannes, B.J.; Arnold, T.W. Occupancy surveys with conditional replicates: An alternative sampling design for rare species. Methods Ecol. Evol. 2017, 8, 1725–1734. [Google Scholar] [CrossRef]
  20. Schloesser, J.T.; Paukert, C.P.; Doyle, W.J.; Hill, T.D.; Steffensen, K.D.; Travnichek, V.H. Heterogeneous detection probabilities for imperiled Missouri River Fishes: Implications for large-river monitoring programs. Endanger. Species Res. 2012, 16, 211–224. [Google Scholar] [CrossRef]
  21. Budy, P.; Conner, M.M.; Salant, N.L.; Macfarlane, W.W. An occupancy-based quantification of the highly imperiled status of desert fishes of the Southwestern United States. Conserv. Biol. 2015, 29, 1142–1152. [Google Scholar] [CrossRef] [PubMed]
  22. MacKenzie, D.I.; Bailey, L.L.; Nichols, J.D. Investigating species co-occurrence patterns when species are detected imperfectly. J. Anim. Ecol. 2004, 73, 546–555. [Google Scholar] [CrossRef]
  23. Rota, C.T.; Ferreira, M.A.R.; Kays, R.W.; Forrester, T.D.; Kalies, E.L.; McShea, W.J.; Parsons, A.W.; Millspaugh, J.J. A multispecies occupancy model for two or more interacting species. Methods Ecol. Evol. 2016, 7, 1164–1173. [Google Scholar] [CrossRef]
  24. Lamothe, K.A.; Dextrase, A.J.; Drake, D.A.R. Characterizing species co-occurrence patterns of imperfectly detected stream fishes to inform species reintroduction efforts. Conserv. Biol. 2019, 33, 1392–1403. [Google Scholar] [CrossRef]
  25. Holt, A.R.; Gaston, K.J.; He, F.L. Occupancy-abundance relationships and spatial distribution: A review. Basic Appl. Ecol. 2002, 3, 1–13. [Google Scholar] [CrossRef]
  26. Berry, C.R.; Young, B.A. Introduction to the benthic fishes studies: Population structure and habitat. In Use of Benthic Fishes along the Missouri and Lower Yellowstone Rivers; United States Army Corps of Engineers, CENWO-PM-AE: Omaha, NE, USA, 2001; pp. 1–52. [Google Scholar]
  27. Welker, T.L.; Drobish, M.R.; Williams, G.A. Pallid Sturgeon Population Assessment Project, Guiding Document, Volume 1.8; U.S. Army Corps of Engineers, Omaha District: Yankton, SD, USA, 2017; Available online: https://meridian.allenpress.com/jfwm/article-supplement/433030/pdf/10_3996022018-jfwm-013_s14/ (accessed on 8 November 2023).
  28. Welker, T.L.; Drobish, M.R.; Williams, G.A. Pallid Sturgeon Population Assessment Project, Guiding Document, Volume 1.1; U.S. Army Corps of Engineers, Omaha District: Yankton, SD, USA, 2006. [Google Scholar]
  29. Wildhaber, M.L.; West, B.M.; Bennett, K.B.; Beaman, Z.D. Captures and Habitat Classification of Benthic Fishes along the Missouri and Lower Yellowstone Rivers, 1996–1998; U.S. Geological Survey Data Release: Columbia, MO, USA, 2023. [Google Scholar] [CrossRef]
  30. Jones, K.A.; Niknami, L.S.; Buto, S.G.; Decker, D. Federal standards and procedures for the national watershed boundary dataset (WBD). In Section A, Federal Standards, Book 11, Collection and Delineation of Spatial Data; U.S. Geological Survey: Reston, VA, USA, 2022; ISBN 2328-7055. [Google Scholar]
  31. Michaletz, P.H.; Dillard, J.G. Fisheries management—A survey of catfish management in the United States and Canada. Fisheries 1999, 24, 6–11. [Google Scholar] [CrossRef]
  32. Braun, A.P.; Phelps, Q.E. Channel catfish habitat use and diet in the Middle Mississippi River. Am. Midl. Nat. 2016, 175, 47–54. [Google Scholar] [CrossRef]
  33. Wildhaber, M.L.; Albers, J.L. Laboratory studies of potential competition for food and substrate among early juvenile Missouri River sturgeon and sympatric chub species. N. Am. J. Fish. Manag. 2023. [Google Scholar] [CrossRef]
  34. Grohs, K.L.; Klumb, R.A.; Chipps, S.R.; Wanner, G.A. Ontogenetic patterns in prey use by pallid sturgeon in the Missouri River, South Dakota and Nebraska. J. Appl. Ichthyol. 2009, 25, 48–53. [Google Scholar] [CrossRef]
  35. Wildhaber, M.L. Pallid Sturgeon: Scaphirhynchus albus (Forbes and Richardson 1905). In Kansas Fishes; University Press of Kansas: Lawrence, KS, USA, 2014; pp. 99–101. ISBN 978-0-7006-1961-0. [Google Scholar]
  36. Bellgraph, B.J. Competition Potential between Sauger and Walleye in Non-Native Sympatry: Historical Trends and Resource Overlap in the Middle Missouri River, Montana. Master’s Thesis, Montana State University, Bozeman, MT, USA, 2006. Available online: https://scholarworks.montana.edu/xmlui/handle/1/901 (accessed on 20 December 2023).
  37. Kelly, B.; Siepker, M.J.; Weber, M.J. Factors associated with detection and distribution of native Brook Trout and introduced Brown Trout in the driftless area of Iowa. Trans. Am. Fish. Soc. 2021, 150, 388–406. [Google Scholar] [CrossRef]
  38. MacKenzie, D.I.; Nichols, J.D.; Royle, J.A.; Pollock, K.H.; Bailey, L.L.; Hines, J.E. Occupancy Estimation and Modeling: Inferring Patterns and Dynamics of Species Occurrence—Softcover, 2nd ed.; Academic Press: Cambridge, MA, USA, 2018; ISBN 9780128146910. [Google Scholar]
  39. R Core Team. Available online: https://www.R-project.org/ (accessed on 17 January 2023).
  40. Fiske, I.J.; Chandler, R.B. Unmarked: An R Package for fitting hierarchical models of wildlife occurrence and abundance. J. Stat. Softw. 2011, 43, 1–23. [Google Scholar] [CrossRef]
  41. Neebling, T.E.; Quist, M.C. Comparison of boat electrofishing, trawling, and seining for sampling fish assemblages in Iowa’s Nonwadeable Rivers. N. Am. J. Fish. Manag. 2011, 31, 390–402. [Google Scholar] [CrossRef]
  42. Steffensen, K.D.; Wilhelm, J.J.; Haas, J.D.; Adams, J.D. Conditional capture probability of pallid sturgeon in benthic trawls. N. Am. J. Fish. Manag. 2015, 35, 626–631. [Google Scholar] [CrossRef]
  43. Smith, C.D.; Quist, M.C.; Hardy, R.S. Detection probabilities of electrofishing, hoop nets, and benthic trawls for fishes in two Western North American Rivers. J. Fish Wildl. Manag. 2015, 6, 371–391. [Google Scholar] [CrossRef]
  44. Everett, S.R.; Scarnecchia, D.L.; Ryckman, L.F. Distribution and habitat use of sturgeon chubs (Macrhybopsis gelida) and sicklefin chubs (M. meeki) in the Missouri and Yellowstone Rivers, North Dakota. Hydrobiologia 2004, 527, 183–193. [Google Scholar] [CrossRef]
  45. Livernois, M.C.; Powers, S.P.; Albins, M.A.; Mareska, J.F. Habitat associations and co-occurrence patterns of two estuarine-dependent predatory fishes. Mar. Coast. Fish. 2020, 12, 64–77. [Google Scholar] [CrossRef]
  46. Fawcett, T. An introduction to roc analysis. Pattern Recognit. Lett. 2006, 27, 861–874. [Google Scholar] [CrossRef]
  47. Robin, X.; Turck, N.; Hainard, A.; Tiberti, N.; Lisacek, F.; Sanchez, J.C.; Müller, M. pROC: An open-source package for r and s plus to analyze and compare ROC curves. BMC Bioinform. 2011, 12, 77. [Google Scholar] [CrossRef]
  48. Hosmer, D.W.; Lemeshow, S.; Sturdivant, R.X. Applied Logistic Regression, 3rd ed.; John Wiley & Sons: Hoboken, NJ, USA, 2013; ISBN 9780470582473. [Google Scholar]
  49. U.S. Geological Survey. USGS Water Data for the Nation: U.S. Geological Survey National Water Information System Database; U.S. Geological Survey: Reston, VA, USA, 2023. [Google Scholar] [CrossRef]
  50. Wildhaber, M.L.; Tabor, V.M.; Whitaker, J.E.; Allert, A.L.; Mulhern, D.W.; Lamberson, P.J.; Powell, K.L. Ictalurid populations in relation to the presence of a main-stem reservoir in a Midwestern warmwater stream with emphasis on the threatened Neosho madtom. Trans. Am. Fish. Soc. 2000, 129, 1264–1280. [Google Scholar] [CrossRef]
  51. Herman, P.; Plauck, A.; Utrup, N.; Hill, T. Three Year Summary Age and Growth Report for Sicklefin Chub (Macrhybopsis meeki); U.S. Fish and Wildlife Service: Columbia, MO, USA, 2008; pp. 1–73. Available online: https://meridian.allenpress.com/jfwm/article-supplement/465707/pdf/jfwm-20-086.s5/ (accessed on 16 November 2023).
  52. Wildhaber, M.L.; DeLonay, A.J.; Papoulias, D.M.; Galat, D.L.; Jacobson, R.B.; Simpkins, D.G.; Braaten, P.J.; Korschgen, C.E.; Mac, M.J. A Conceptual Life-History Model for Pallid and Shovelnose Sturgeon; U.S. Geological Survey: Reston, VA, USA, 2007; p. iv. 18p, ISBN 9781411319059. [Google Scholar]
  53. Wildhaber, M.L.; DeLonay, A.J.; Papoulias, D.M.; Galat, D.L.; Jacobson, R.B.; Simpkins, D.G.; Braaten, P.J.; Korschgen, C.E.; Mac, M.J. Identifying structural elements needed for development of a predictive life-history model for pallid and shovelnose sturgeons. J. Appl. Ichthyol. 2011, 27, 462–469. [Google Scholar] [CrossRef]
  54. Wildhaber, M.L.; Dey, R.; Wilke, C.K.; Moran, E.H.; Anderson, C.J.; Franz, K.J. A stochastic bioenergetics model-based approach to translating large river flow and temperature into fish population responses: The pallid sturgeon example. Geol. Soc. Publ. Lond. 2017, 408, 101–118. [Google Scholar] [CrossRef]
  55. Bellgraph, B.J.; Guy, C.S.; Gardner, W.M.; Leathe, S.A. Competition potential between saugers and walleyes in nonnative sympatry. Trans. Am. Fish. Soc. 2008, 137, 790–800. [Google Scholar] [CrossRef]
  56. Wildhaber, M.L.; Albers, J.L.; Green, N.S.; Moran, E.H. A fully-stochasticized, age-structured population model for population viability analysis of fish: Lower Missouri River endangered pallid sturgeon example. Ecol. Model. 2017, 359, 434–448. [Google Scholar] [CrossRef]
  57. Muff, S.; Nilsen, E.B.; O’Hara, R.B.; Nater, C.R. Rewriting results sections in the language of evidence. Trends Ecol. Evol. 2022, 37, 203–210. [Google Scholar] [CrossRef] [PubMed]
  58. Wildhaber, M.L.; West, B.M.; Green, N.S.; Albers, J.L.; Bennett, K.R.; May, J.H. Occupancy Model Coefficients and Observed Co-Occurrence Simulations for Sicklefin Chub, Sturgeon Chub, and Associated Fishes in the Missouri River; U.S. Geological Survey Data Release: Columbia, MO, USA, 2023. [Google Scholar] [CrossRef]
  59. Galat, D.L.; Berry, C.R.; Peter, E.J.W.; White, R.G. Missouri River Basin. In Rivers of North America, 2nd ed.; Delong, M.D.B., Benke, A.C., Jardine, T.D., Cushing, C.E., Eds.; Elsevier: Oxford, UK, 2005; pp. 410–461. ISBN 978-0-12-818847-7. [Google Scholar]
  60. Cross, F.B. Occurrence of the sturgeon chub Hybopsis gelida (Girard) in Kansas. Trans. Kans. Acad. Sci. 1953, 56, 90–91. [Google Scholar] [CrossRef]
  61. Dieterman, D.J.; Galat, D.L. Large-scale factors associated with sicklefin chub distribution in the Missouri and Lower Yellowstone Rivers. Trans. Am. Fish. Soc. 2004, 133, 577–587. [Google Scholar] [CrossRef]
  62. Pflieger, W.L.; Grace, T.B. Changes in the fish fauna of the Lower Missouri River, 1940–1983. In Community and Evolutionary Ecology of North Ameircan Stream Fishes; Matthews, W.J., Heins, D.C., Eds.; University of Oklahoma Press: Norman, OK, USA, 1987; pp. 166–177. ISBN 978-0806122359. [Google Scholar]
  63. Gelwicks, G.; Graham, K.; Galat, D. Status Survey for Sicklefin Chub, Sturgeon Chub, and Flathead Chub in the Missouri River, Missouri: Final Report; Missouri Department of Conservation, Fish and Wildlife Research Center: Columbia, MO, USA, 1996. [Google Scholar]
  64. Grady, J.M.; Milligan, J. Status of Selected Cyprinid Species and Gear Selectivity at Historic Lower Missouri River Sampling Sites; U.S. Fish and Wildlife Service, Columbia Fisheries Resources Office: Columbia, MO, USA, 1998; p. 52. [Google Scholar]
  65. Pflieger, W.L.; Smith, P.A. The Fishes of Missouri; Missouri Department of Conservation: Jefferson City, MO, USA, 1997; p. 343. ISBN 1887247114. [Google Scholar]
  66. Welker, T.L.; Scarnecchia, D.L. Habitat use and population structure of four native minnows (family Cyprinidae) in the Upper Missouri and Lower Yellowstone Rivers, North Dakota (USA). Ecol. Freshw. Fish 2004, 13, 8–22. [Google Scholar] [CrossRef]
  67. Wildhaber, M.L.; West, B.M.; Ditter, K.K.; Adrian, A.M.; Peterson, A.S. A review of grass carp and related species literature on diet, behavior, toxicology, and physiology focused on informing development of controls for invasive grass carp populations in North America. Fishes 2023, 8, 547. [Google Scholar] [CrossRef]
  68. Tornabene, B.J.; Smith, T.W.; Tews, A.E.; Beattie, R.P.; Gardner, W.M.; Eby, L.A. Trends in river discharge and water temperature cue spawning movements of blue sucker, Cycleptus elongatus, in an impounded Great Plains river. Copeia 2020, 108, 151–162. [Google Scholar] [CrossRef]
  69. Dieterman, D.J. Spatial Patterns in Phenotypes and Habitat Use of Sicklefin Chub, Macrhybopsis meeki, in the Missouri and Lower Yellowstone Rivers. Ph.D. Dissertation, University of Missouri, Columbia, MO, USA, 2000. [Google Scholar]
Figure 1. Study area map showing HUC 8 subbasins along the Upper Missouri River (UMR), Lower Missouri River (LMR), and Lower Kansas River, the locations of Gavins Point and Fort Peck Dams (filled black triangles), and the Missouri River Basin (thick, medium gray outline in large map). The small map on the lower left shows the entire Missouri River Basin, in gray. Geospatial data for HUC 8 subbasins and the Missouri River Basin are from the U.S. Geological Survey (USGS) National Hydrography Dataset, and base map is from USGS.
Fishes 09 00043 g001
Figure 2. Mean occupancy coefficient estimates with 95% confidence intervals of year from multispecies occupancy model for sicklefin (Macrhybopsis meeki) (top) and sturgeon (M. gelida) (bottom) chub. Significant differences between means are indicated by compact letter display groups above each bar. All data were collected with benthic trawls. Year 1996 was used as the reference year (i.e., set to zero); however, note that each species has a separate occupancy intercept, so plots of different species cannot be directly compared.
Fishes 09 00043 g002
Figure 3. Mean occupancy coefficient estimates from multispecies occupancy model by National Hydrologic Database 8-digit Hydrologic Unit Code (HUC 8) subbassins for sicklefin (Macrhybopsis meeki) (top) and sturgeon (M. gelida) (bottom) chub, defined here by lowest HUC 8 Missouri River kilometer (MR km). All data were collected with benthic trawls. Significant differences between means are indicated by compact letter display groups above each bar. Vertical dashed lines represent locations of major dams. Fort Peck Dam (FP) is located at MR km 2850; Gavins Point Dam (GP) is located at MR km 1305 as indicated by vertical dashed lines. The HUC 8 corresponding to MR km 2705 was used as the reference condition (i.e., set to zero); however, note that each species has a separate occupancy intercept, so plots of different species cannot be directly compared.
Fishes 09 00043 g003
Figure 4. Mean occupancy coefficient estimate from multispecies occupancy model by macrohabitat type (channel crossover (CHXO), inside bend (ISB), outside bend (OSB), secondary connected channel (SCC), and tributary mouth (TRM)) for sicklefin (Macrhybopsis meeki) (top) and sturgeon (M. gelida) (bottom) chub. Significant differences between means are indicated by compact letter display groups above each bar. All data were collected with benthic trawls. CHXO was used as the reference condition (i.e., set to zero); however, note that each species has a separate occupancy intercept, so plots of different species cannot be directly compared.
Fishes 09 00043 g004
Figure 5. Mean detection coefficients with 95% confidence intervals of three continuous covariates for four Missouri River Basin benthic fish species across three multispecies occupancy models. Coefficients are on a logistic scale. For column headings, all models include sicklefin chub (Macrhybopsis meeki) and sturgeon chub (M. gelida); three-species models also include species in parentheses. All data were collected with benthic trawls.
Fishes 09 00043 g005
Figure 6. Conditional occupancy probability for sicklefin (Macrhybopsis meeki) (top) and sturgeon (M. gelida) (bottom) chub in three species models. All data were collected with benthic trawls. Significant differences between means are indicated by an asterisk (*) above the absent condition bar.
Fishes 09 00043 g006
Figure 7. Linear regressions of annual mean discharge in Upper (UMR) and Lower Missouri River (LMR) and mean yearly occupancy coefficient estimates for sicklefin (Macrhybopsis meeki) and sturgeon (M. gelida) chub. “Current” represents discharge data from the same year as the occupancy coefficient. “Prior” represents discharge data from the year prior to the occupancy coefficient. Shaded area represents a 95% confidence interval.
Fishes 09 00043 g007
Figure 8. Comparisons of proportions of bends with known and predicted observed co-occurrence of sicklefin (Macrhybopsis meeki) and sturgeon (M. gelida) chub with pallid sturgeon (Scaphirhynchus albus) adults, pallid sturgeon juveniles, sauger (Sander canadensis), and walleye (Sander vitreus) as detected by otter trawl and trammel net. Labels on x-axes indicate if sampling occurred in the Upper Missouri River (“Upper”), Lower Missouri River (“Lower”), or a combination of the two (“Both”). Numbers in parentheses are bends sampled by trammel nets within a week of an otter trawl sample. Predictions were calculated based on the assumption of random chance of observed co-occurrence using 100,000 Bernoulli-distribution-based Monte Carlo simulations; error bars are 0.05 and 0.95 quantiles. Actual observed co-occurrences are directly from field sampling data. Proportion of simulations where prediction > actual (P > A) or proportion of simulations where prediction < actual (P < A). Symbols above equations indicate proportion of simulations meeting test criteria; no symbol or equation is >0.10, + is ≤0.10 but >0.05, ** is ≤0.01, and *** is ≤0.001.
Fishes 09 00043 g008
Table 1. Variables included in detection, occupancy, and co-occurrence components of the two- and three-species occupancy models of benthic fishes sampled using benthic trawls in the Missouri River basin. Subheadings, in italics, are variable types, either “Catergorical” or “Continuous.” * = single species occupancy component of model; ** = parameters were averaged across an entire site and not necessarily recorded for every trawl deployment. The number of categories for each categorical variable is listed in parentheses.
Model TypeDetectionOccupancy *Co-Occurrence
Two-speciesCategoricalCategoricalCategorical
Project (2)Sampling year (19)(none)
HUC 8 subbasin (12)
Macrohabitat (5)
ContinuousContinuousContinuous
Trawl distanceWater temp. **Water temp. **
Water depth **Water depth **Water depth **
Water velocity **Water velocity **Water velocity **
TurbidityTurbidity
Three-speciesContinuousContinuousContinuous
Trawl distance(none)(none)
Water depth **
Water velocity **
Disclaimer/Publisher’s Note: The statements, opinions and data contained in all publications are solely those of the individual author(s) and contributor(s) and not of MDPI and/or the editor(s). MDPI and/or the editor(s) disclaim responsibility for any injury to people or property resulting from any ideas, methods, instructions or products referred to in the content.

