Article

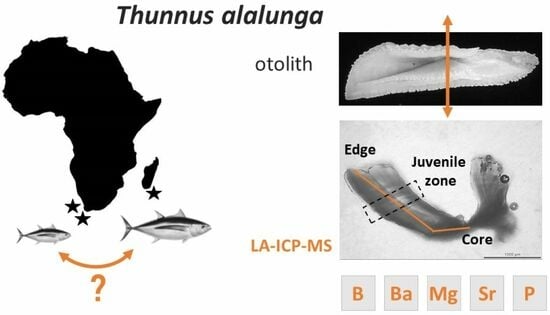
New Insights in Lifetime Migrations of Albacore Tuna (Thunnus alalunga, Bonnaterre, 1788) between the Southwest Indian and the Southeast Atlantic Oceans Using Otolith Microchemistry

1
Marbec, Université de Montpellier, IRD, CNRS, Ifremer, 34000 Montpellier, France
2
Marbec, Université de Montpellier, IRD, CNRS, Ifremer, Victoria P.O. Box 449, Seychelles
3
INRAE, ECOBIOP, 64310 Saint-Pée-sur-Nivelle, France
4
CSIRO Environment, Brisbane 4067, Australia
5
CapMarine, Cape Town 8000, South Africa
6
CSIRO Environment, Hobart 7004, Australia
7
AZTI, Marine Research, Basque Research and Technology Alliance (BRTA), 48395 Sukarrieta, Spain
*
Author to whom correspondence should be addressed.
Current address: International Seafood Sustainability Foundation (ISSF), Pittsburgh, PA 15201, USA.
Fishes 2024, 9(1), 38; https://doi.org/10.3390/fishes9010038
Submission received: 4 December 2023 / Revised: 9 January 2024 / Accepted: 10 January 2024 / Published: 17 January 2024
(This article belongs to the Section Environment and Climate Change)

Abstract

:
To clarify potential trans-oceanic connectivity and variation in the natal origin of albacore tuna (Thunnus alalunga) from the southwest Indian Ocean (SWI) and the southeast Atlantic (SA), lifetime otolith elemental signatures were assessed from 46 adults sampled from Reunion Island, and 26 juveniles(group 2+) sampled from two locations along the Atlantic coast of South Africa. LA-ICP-MS analysis was used to assess the multi-elemental composition in B, Ba, Mg, P, Sr, and Zn along the otolith edge (chemical signatures of the capture area), but also near the otolith primordium (spawning origin) and in an area located at 1400–1600 µm from it (nursery origin). Two groups of distinct near-primordium multi-elemental signatures, denoting potentially discrete spawning origins (SpO), were identified using hierarchical clustering. Each of the two SpO was found to contribute to the albacore stocks from all the areas sampled, suggesting a common spawning origin in some fish from the SWI and from the SA, and complex migrations between the two oceans. Three potentially discrete primary nursery sites were identified, each contributing to SA juvenile and SWI adult capture sites differently. The timing for the trans-oceanic movements observed for each albacore capture zone and its implications for local stock management are discussed.
Key Contribution: Otolith multi-elemental compositions indicate connections between albacore tuna stocks from the Indian and Atlantic Oceans at the larval and juvenile stages.

Graphical Abstract

1. Introduction

Understanding the population structure and connectivity between stocks in exploited fish species is essential for marine conservation and sustainable fishery management [1]. This is particularly true for large pelagic fish like tunas, which are often caught worldwide and are likely to travel to various parts of the world’s ocean during their life cycle, with individuals regularly crossing maritime national management boundaries and connecting distant regions of the globe [2,3]. Thus, the albacore tuna (Thunnus alalunga, Bonnaterre, 1788) is a ubiquitous, highly migratory species found throughout tropical, subtropical, and temperate regions of the world’s oceans. Commercial catches of the species represented around 5% in weight of the global tuna catches in 2019 [4]. They are currently assessed and managed as six stocks: two in the Pacific Ocean (north and south Pacific), three in the Atlantic Ocean (north and south Atlantic, and the Mediterranean Sea), and one in the Indian Ocean. Since the 1990s, however, larval, genetic and morphometric studies on albacore tuna in the Indian Ocean have suggested the existence of at least two distinct local populations: the west Indian Ocean population and the east Indian Ocean one, separated by the 90° E longitude meridian [5,6,7].
The west Indian Ocean population of albacore tuna is essentially fished between 20° and 90° E and from ~5° N to 40° S. Spawning in this population is thought to predominantly occur between 15° S and 25° S [8,9,10] from October to January [11], in areas with temperatures above 24 °C, identified based on the examination of adult females with ripe ovaries. Little is known concerning spatial distribution during the larval and juvenile phase up to 40 cm, as the fish only appear in fishing nets at this size. However, a separation of mature, spawning, and immature albacore tuna life stages has been found, roughly coinciding with the boundaries of the two oceanic current systems in the south Indian Ocean: the subtropical gyre between 10° S and 30° S, and the Circumpolar Current south of 30° S [12,13]. Adults are predominantly fished between 10° S and 25° S, where they perform seasonal north–south movements, while immature fish are predominantly caught in areas south of 30° S [11,13,14,15]. Since the 1970s, various authors have stressed that fishing statistics argue for a link between the populations of the west Indian Ocean and that of the south Atlantic [6,16], off the South African coast. Thus, the possibility that the albacore tuna present in South African waters in the Atlantic Ocean originate from the south-west Indian Ocean (SWI), and are therefore part of the west Indian Ocean stock, and vice-versa, is increasingly considered by the Regional Fisheries Management Organisation (RFMO) [17,18]. Determining the potential links between SWI albacore tuna (sub-)populations and the Atlantic Ocean stocks is key for improving management measures across fishing zones.
Genetic studies are generally used to assess the structuring of fish stocks, by studying genetic diversity within populations to deduce the level of connectivity between them [19]. In the case of T. alalunga tuna stocks fished in the south Atlantic and in the SWI, results vary according to the genetic approach used, with some studies indicating a global genetic homogeneity [20,21] while others point out a certain level of heterogeneity and structuring between them (e.g., [15,22]). The latest published genetic study suggests an exchange of individuals between the southern Atlantic Ocean and the SWI [23], in line with previous results from a blood group analysis of the species [24] and a multidisciplinary approach including morphometry, genetics, and larval drift modelling [15]. However, many unknowns remain regarding the importance of these potential exchanges and when they occur during the species’ life cycle. Otolith microchemistry can be used to fill in these knowledge gaps and advance our understanding of the spatial dynamics of albacore tuna, including during early life stages, which are particularly challenging to capture and track at sea.
Over the last few decades, otolith microchemistry has proved to be a very powerful tool for assessing the life-cycle migrations and population structure of marine fish [25,26,27]. The method is based on the observation that changes in the environment encountered by the fish during their lifetime are recorded in the successive layers deposited daily in their otoliths, mostly as changes in multi-element chemical signatures [28,29,30,31]. Variations in chemical signatures within fish otolith can, therefore, provide a unique perspective on the lifetime migration history of individual fish, as well as valuable insight into the timing of stock mixing, based on the selective analysis, for all fish, of otolith parts corresponding to each life stage. Since the use of otolith microchemistry for fish geolocation assumes that the chemical characteristics of environments remain relatively stable over time [31], which is rather difficult to validate across oceans, most studies using otolith microchemistry at this wide spatial scale are based on comparison/differentiation between the multi-element signatures of different fish groups and the inference of the associated environments [32]. Despite this limitation, the approach has allowed the successful identification of the natal origins, population structure, and movements of a wide variety of large pelagic fish, including tunas [33,34,35,36].
Here, we analysed the multi-elemental composition of varied parts of the otoliths of albacore tunas from both the southwest Indian Ocean (SWI, Reunion Island) and the southeast Atlantic (SA, two sites off South Africa) to improve our current understanding of the connectivity between these oceanic regions. More specifically, our aims were to (1) test whether otolith chemical signatures for each capture site could be used as a baseline for differential fish geolocation, (2) compare the chemical signatures of both larval and juvenile otolith parts for all fish to investigate the number of spawning and nursery areas in the global fish sample and their respective contribution to T. alalunga captures in each ocean, and (3) identify the life stage(s) where transoceanic exchanges occur. This detailed information on the connectivity between T. alalunga SA and SWI stocks is urgently needed for effective and sustainable management of the fisheries for this species in both oceans.

2. Material and Methods

2.1. Sampling

Among the 72 albacore tuna otoliths included in this study (Figure 1 and Table 1), 46 were collected around the French Reunion Island in the SWI during three sampling periods: February 2018 (n = 13), May 2018 (n = 13), and December 2018 (n = 20). The remaining 26 samples were collected in the southeast Atlantic Ocean in March–April 2018, at two sites along the shores of South Africa (SA): off Saldanha Bay on the West Coast (SA-N, n = 13), where water masses are mainly under the influence of the Benguela current (which flows northwest along the west coast of South Africa), and south of Hout Bay (SA-S, n = 13), which is a Cape Town fishing harbour located farther south in proximity to the Cape peninsula. Throughout the paper we will refer to these five combinations of sampling sites and periods as “sampling events” (Table 1).
Fish were collected from longline (SWI) and baitboat (SA) fleets and ranged from 63 to 116 cm in size (fork length, FL, Table 1). They spanned multiple age-classes and life stages. Given the length at 50% maturity for females has been estimated at 85 cm FL [11] and at 90 cm [38,39], the South African specimens (63–85 cm FL) were mainly immature individuals of 2–5 years of age (referred to as juvenile in the paper), while the SWI specimens were all adults (96–116 cm FL) above 7 years old [37] (Table 1).

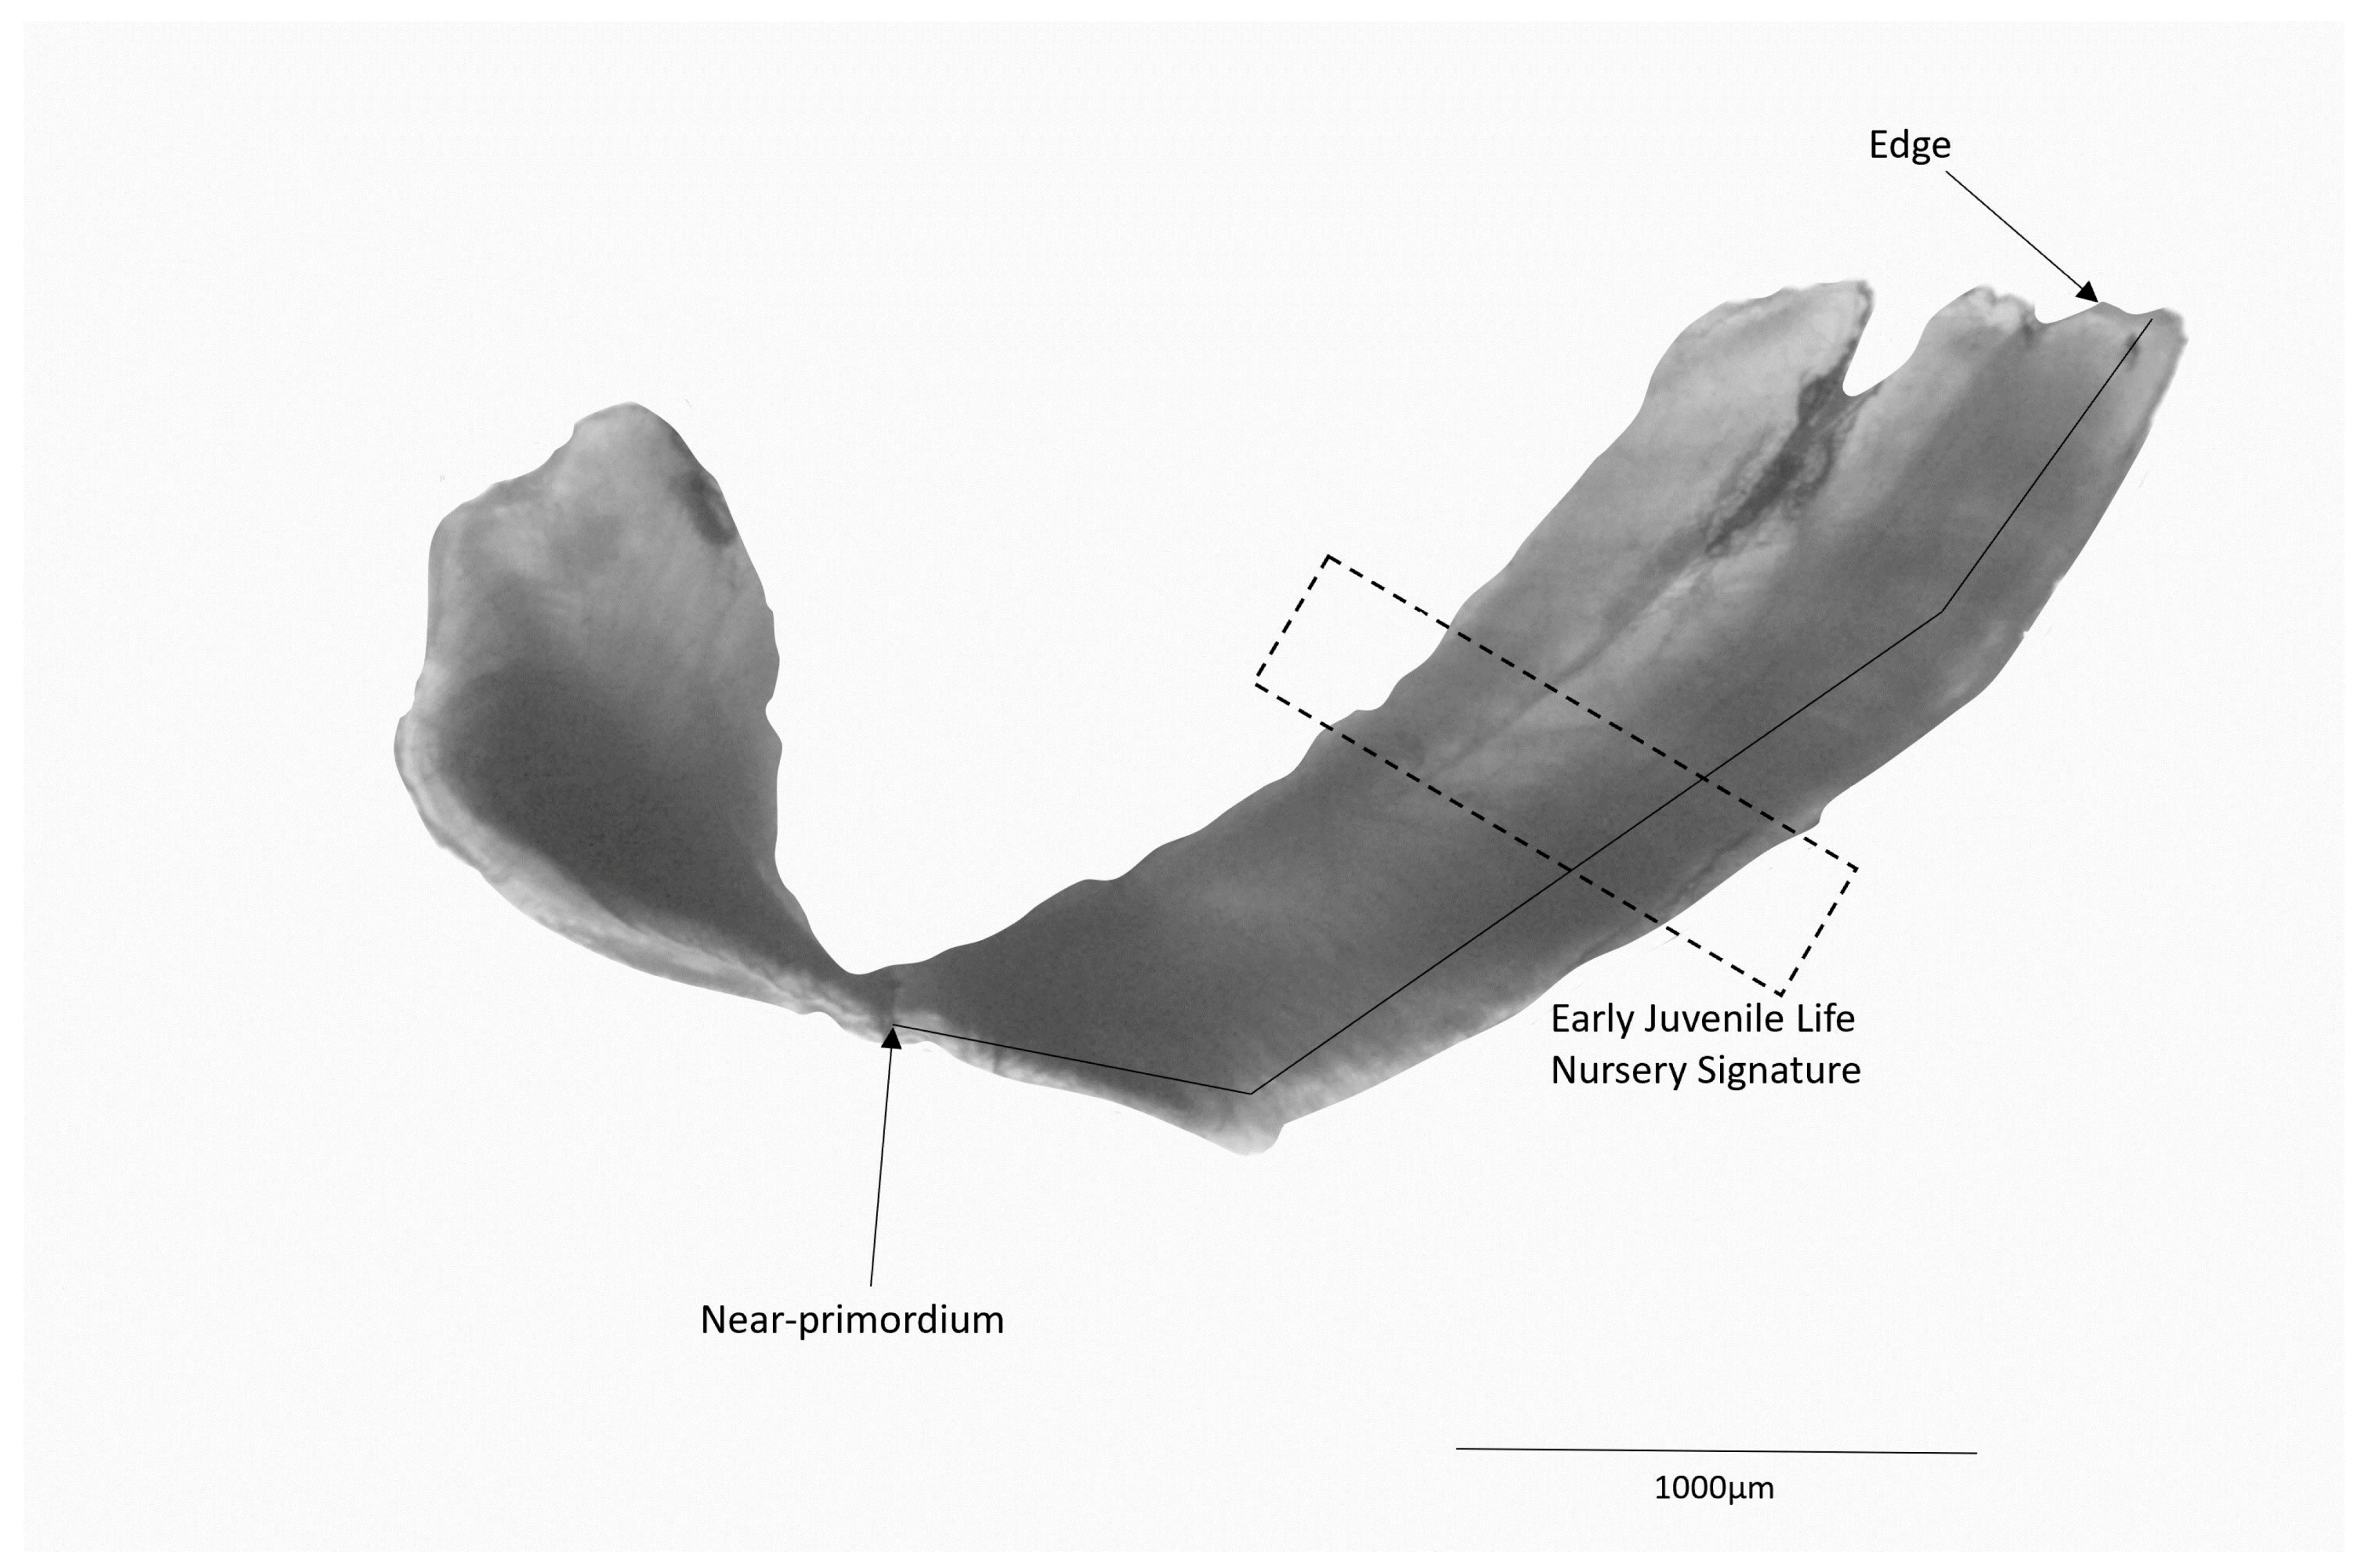
2.2. Otolith Preparation

All materials for otolith handling, preparation, and analysis were decontaminated in 4% ultrapure nitric acid baths, rinsed with ultrapure (18.2 MΩ·cm) water, and dried under a Class 100 laminar flow hood. For each individual fish, the left sagittal otolith was cleaned from adherent tissues, rinsed with distilled water, then sonicated for 5 min in ultrapure water and dried under a laminar flow hood. It was then embedded in epoxy resin (Araldite® 2020), polymerised in an oven at 35 °C for 24 h, and transversal sections (1 mm thick on average), including the nucleus, were made using a precision saw (Bluehler®,Leinfelden-Echterdingen, Germany, Isomet 1000). The posterior face of each otolith section was polished using 1200, 2400, and 4000 grit dry abrasive papers until the nucleus was exposed. The sections were then sonicated for 5 min in ultrapure water, dried under a class 100 laminar flow hood, and attached to a clean microscope slide for further processing.

2.3. Trace Element Analyses

Element concentrations in the otoliths were measured using Laser Ablation ICP-MS (LA-ICPMS, Thermo Fisher, Dreieich, Germany—Element2 XR coupled to a Lambda-Physiks Miami, Miami, FL, USA, CompEx 102, 193 nm long pulse laser) at the AETE-OSU OREME laboratory of the Montpellier University (France). For each otolith, the concentrations were measured along a transect (line scan) from the nucleus to the edge. A pre-ablation (pulse rate 4 Hz, energy 15 J cm−2, speed 20 µm s−1, and spot diameter 80 µm) was used to clean the otolith surface along the transect analysed before each measurement (pulse rate 7 Hz, energy 15 J cm−2, speed 15 µm s−1, and spot diameter 50 µm). The samples were randomised in the analytical order. The signal-to-noise ratios were maximised for the isotopic mass range from Mg to Ba, while the oxide production rate was tuned to ≤0.5% UO2 (254UO2/238U). For external calibration and machine drift correction, a glass reference material (NIST 612—National Institute of Standard and Technology, Gaithersburg, MD, USA) was analysed at the beginning and at the end of each session (two replicates), and after every 5 samples. Another reference material (MACS 3, United States Geological Survey, Lakewood, CO, USA) was analysed at the beginning and end of each session to assess machine accuracy and quality control. The concentrations used are those given by NIST-612 and MACS-3 certified values. For Phosphorus, the reference values used are those published by Jochum et al. [40], available on the Max Planck Institute for Chemistry website: http://georem.mpch-mainz.gwdg.de, accessed on 3 December 2023. To remove residual sample gas that could interfere with the analysis, the laser chamber was purged for 1 min before each transect analysis. For each analysis, we applied 30 s of blank measurement with the laser turned off, a maximum ablation time of 3 min depending on the size of the otolith, and 30 s of washout. Sixteen chemical elements were measured: 7Li, 11B, 24Mg, 31P, 43Ca, 52Cr, 55Mn, 65Cu,66 Zn, 86Sr, 89Y, 138Ba, 139La, 140Ce, 141Pr, and 208Pb. Calcium 43Ca was used as the internal otolith standard, and results were given as ratios to Ca, assuming 38.3 wt % Ca in all otoliths. All raw data were processed using the elementR package for R [41], allowing simultaneous calculations of concentration (ppm) for all chemical elements, correction for potential machine drift, and realignment. Out of the 16 elements measured, only seven (11B, 24Mg, 43Ca, 31P, 86Sr, 66Zn, and 138Ba) were above the detection limits and retained for further analyses. Relative standard deviations (RSD in %) based on replicate measurements of the MACS 3 standard reflect the level of precision achieved for each of these seven elements, which ranged from 3% (Sr) to 10% (P). The selected elements are commonly used in otolith microchemistry studies [42,43].
Elemental ratios in the otolith core can be affected by egg yolk composition [44,45,46]. Consequently, the value centred on the otolith primordium was removed from our analyses to avoid any maternal influence on otolith composition (first 10 µm of the transect). Continuous transect analysis provided overlapping analysis points as a function of laser speed. Each data item corresponded to an acquisition time, which was transformed into a distance as a function of the laser’s speed of advance over the otolith. We used the average of tree adjacent non-overlapping points after the first 10 µm. Thus, the area between 10 and 160 microns after the primordium (or ‘near-primordium’ signature) was chosen to reflect fish spawning origin(s), i.e., the characteristics of the water mass(es) encountered during the first weeks of larval drift at sea (Figure 2). This represents the approximate deposition of material corresponding to 15 days of the individual’s life [36,47,48,49]. The last point of the transect was chosen to reflect the signature of the fish final capture area (‘edge’ signature). It is identified by the point before an abrupt drop in the calcium signal and represents a 50 µm zone corresponding to a lifespan of between 1 and a few months. Given the different sizes and ages of adults and juveniles, the time periods sampled by a laser point are different, but correspond to durations of the order of months. As the sizes are comparable, the otolith edges sampled at the 2 South African sites are similar in terms of lifespan. A third location was investigated, the average of the non-overlapping points over the 1400–1600 µm zone (on the transect line) from the nucleus was intended to reflect the juvenile nursery grounds of each fish (or ‘nursery’ signature). This area on the otolith was chosen based on the maximum transect length analysed with the LA-ICPMS on the otoliths of 20 albacore tuna yearlings collected in 2019 around Tasmania (FL = 45–50 cm, M. Labonne unpub. data).

2.4. Statistical Analyses

Differences in otolith signatures between fish natal and primary nursery origins, and between their final capture areas were investigated separately, using the multi-element signatures from the ‘near-primordium’, ‘nursery’, and ‘edge’ areas of the otoliths, respectively. The three SWI sampling events were processed together to maximise variation in capture zone signatures.
For all datasets, the data were scaled and centred, and a Principal Component Analysis (PCA) using the R package FactoMineR was performed to identify the main chemical elements responsible for data separation (elements contributing to more than 20% for any of the dimensions retained). The “near-primordium” and “nursery” signatures in these key elements were then used separately to identify the most likely number of spawning origins and nursery locations in our samples. In both cases, agglomerative hierarchal clustering (Ward’s method) was performed to identify the number k of separate fish groups with distinct otolith signatures (clusters) in the data. To evaluate the stability of the clusters, the clusterboot function (R package fpc) was used. It allows to resample the data (500 times replacement), perform Ward’s hierarchical clustering on the resampled datasets, and calculate the Jaccard similarities of the original clusters to the most similar clusters in the resampled datasets. The mean of the Jaccard similarities was used as an index of the cluster stability in each case, with values > 0.85 indicating highly stable clusters, values between 0.6 and 0.75 indicating patterns in the data, but with large uncertainty in individual assignments of samples to clusters, and values < 0.5 indicating “dissolved” (indistinguishable) clusters. Lastly, a combination of univariate and multivariate statistical tests was used to investigate the differences in single and multi-element signatures among capture locations and potential spawning or nursery origins. For each element, the data were checked for normality and homoscedasticity using Shapiro–Wilk and Box M tests, respectively. As the assumptions for normality and homoscedasticity were not met for all elements, a PERMANOVA test was first performed, followed, when relevant, by separate Kruskal–Wallis tests or Wilcoxon tests for each element. All statistical analyses were performed using the R software version 3.6.0 (R development Core Team, 2019) using p < 0.05 as the threshold for statistical significance.
To investigate connectivity among fishing areas and oceans, individual lifetime migration profiles and their diversity were investigated for each sampling site, by compiling the successive habitats identified by the multi-elemental signatures recorded in the larval and early juvenile sections of each otolith. This allowed us to assess the respective contribution of each spawning origin and primary nursery site to each final capture area or event.

3. Results

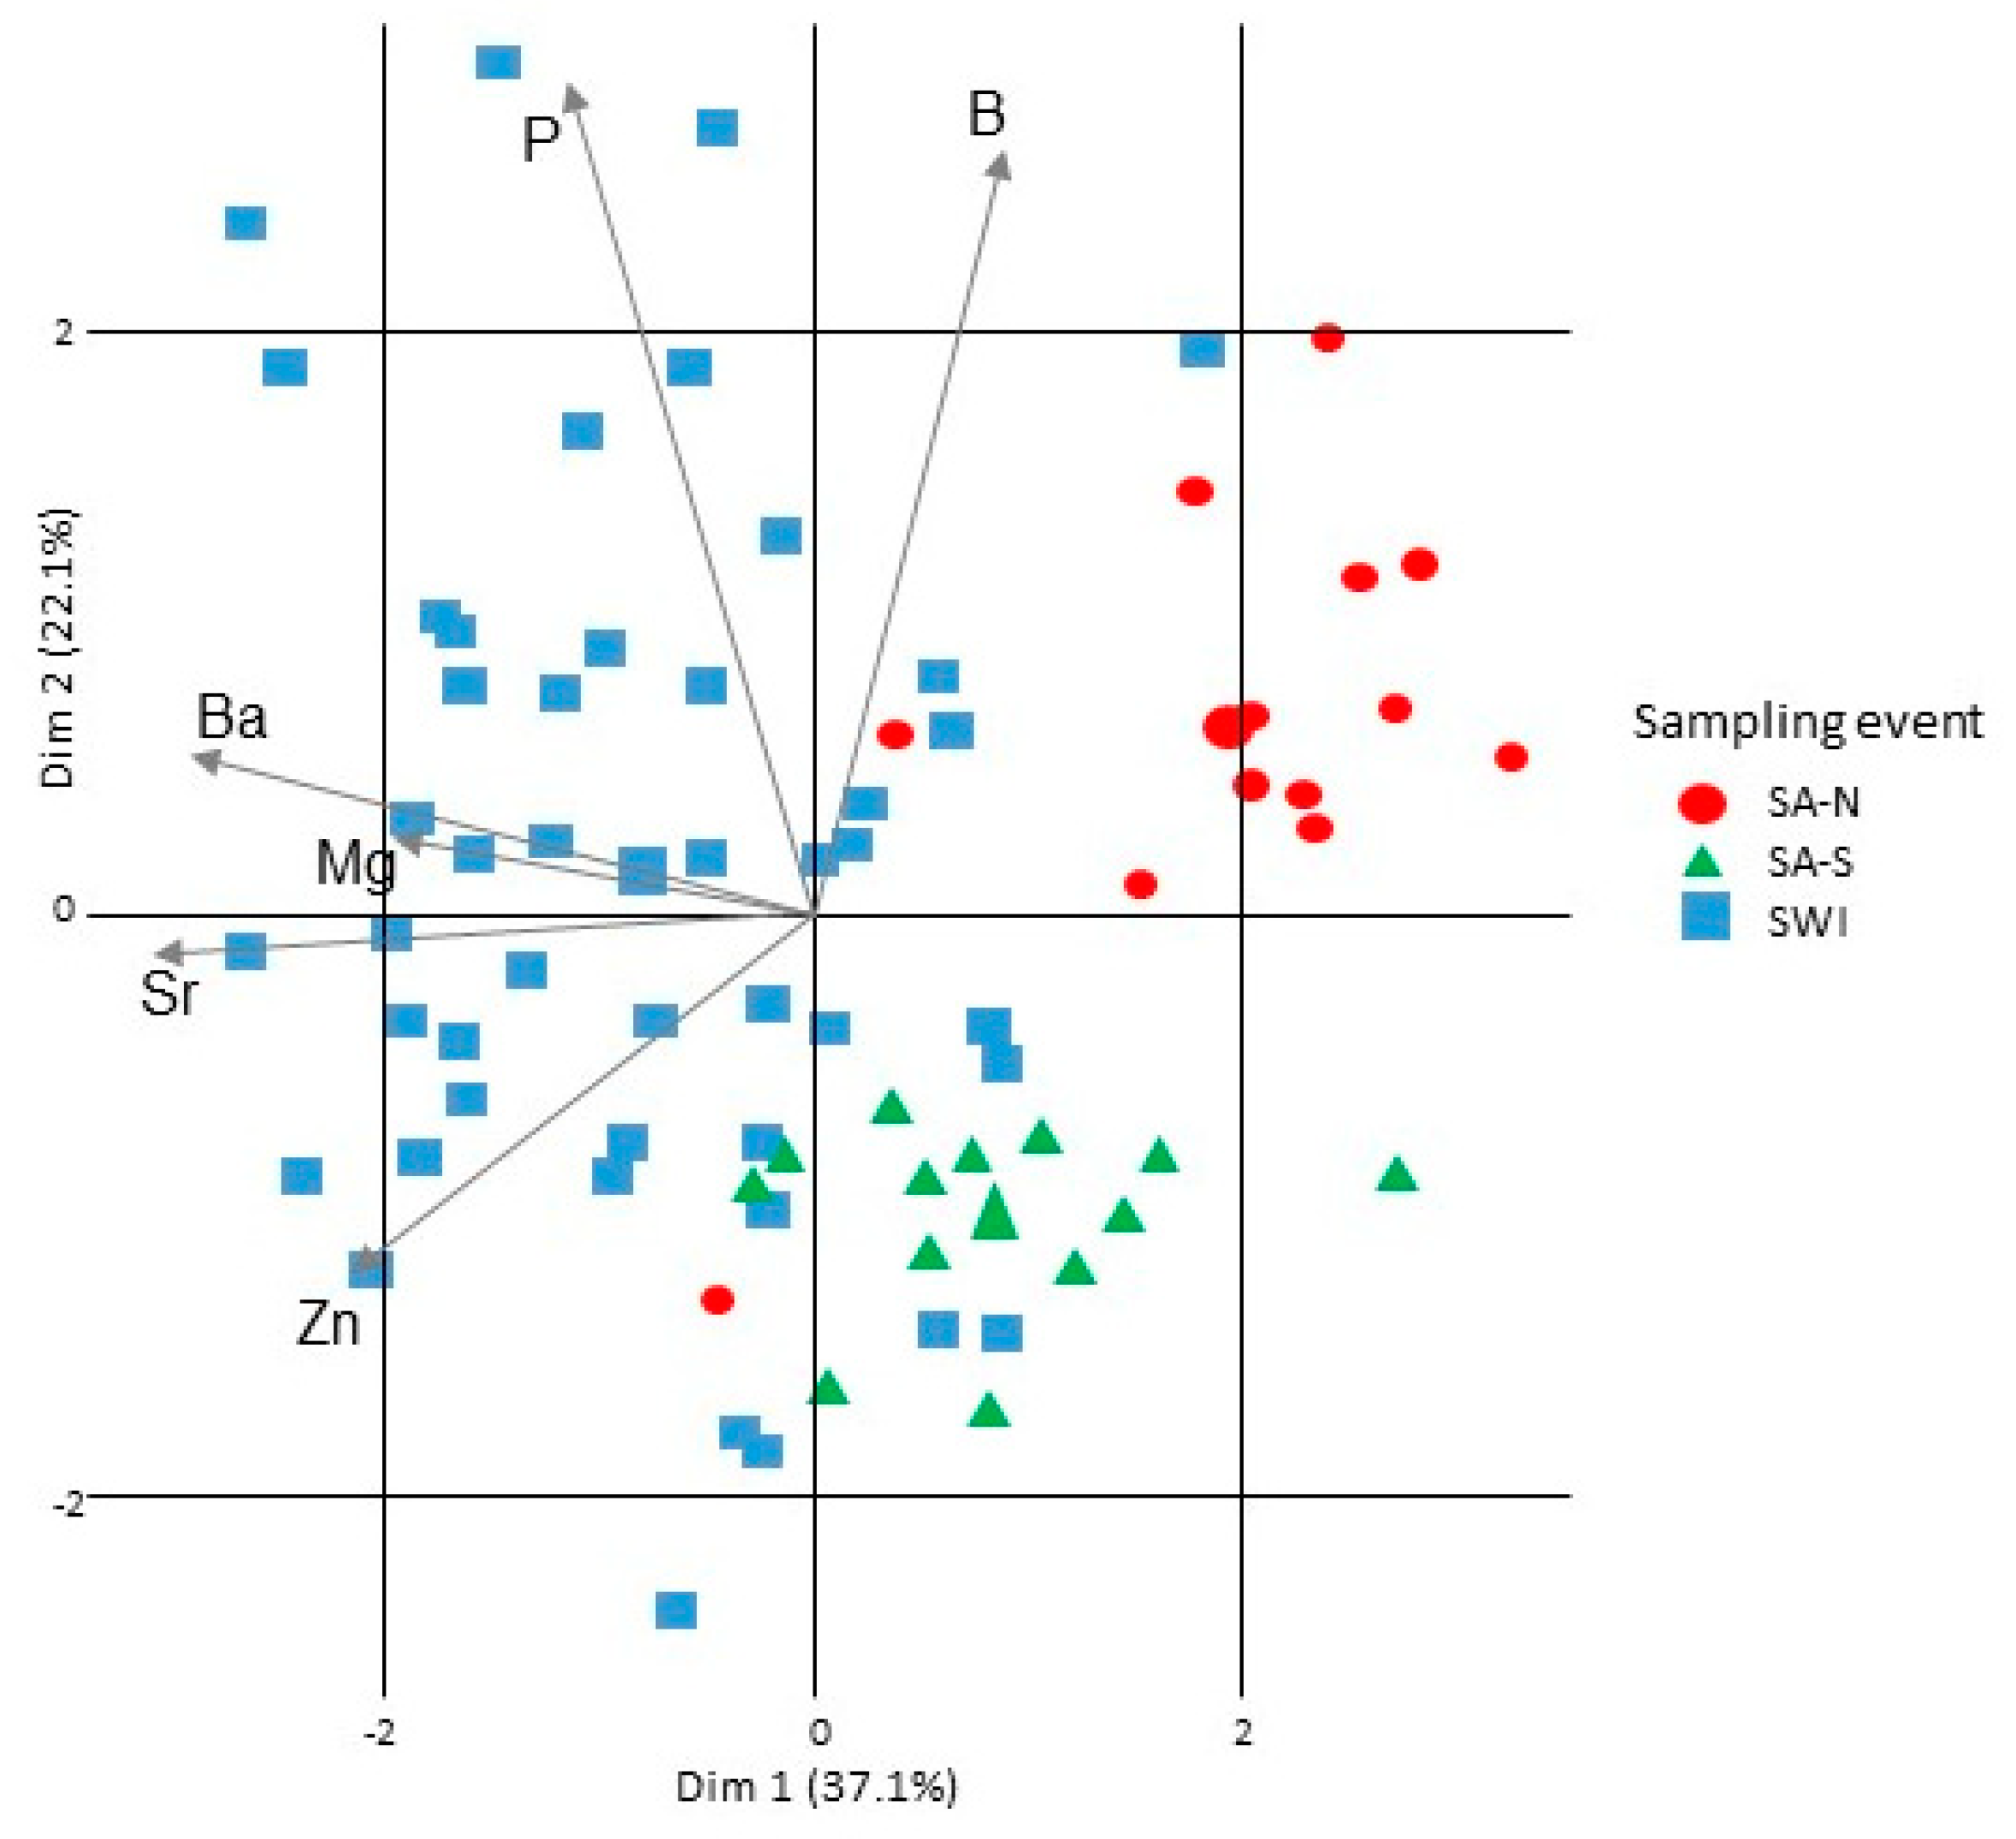
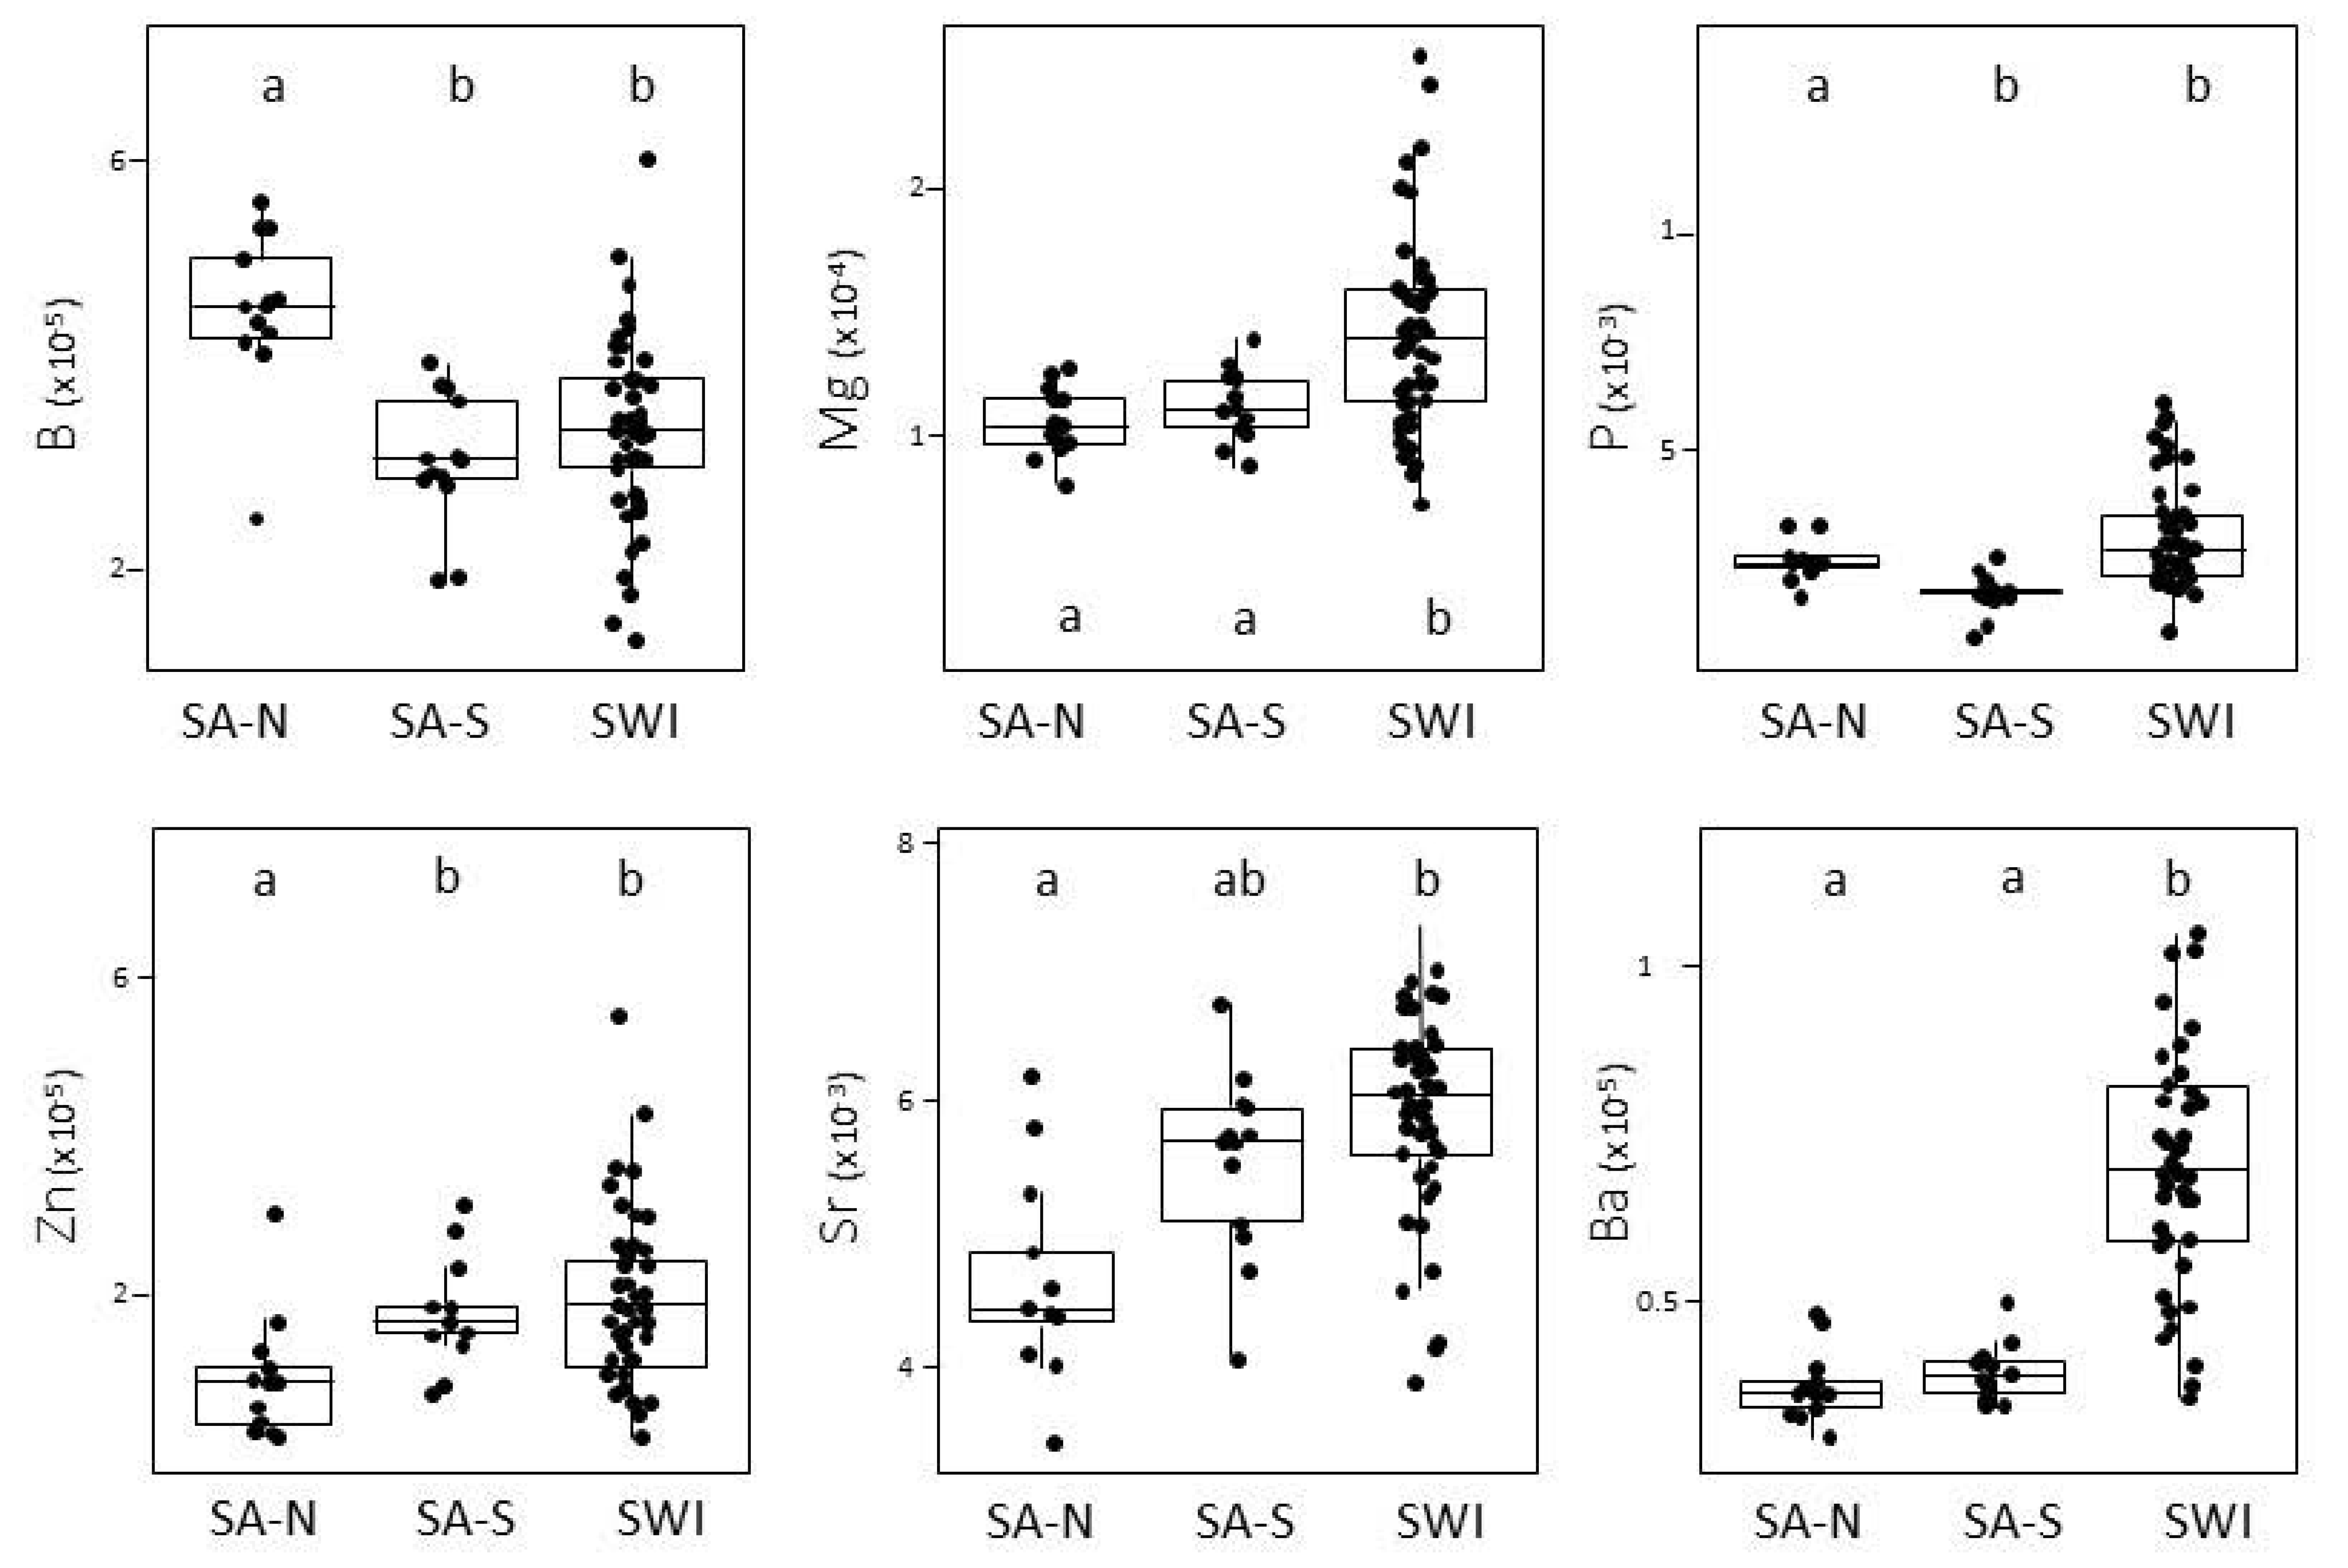
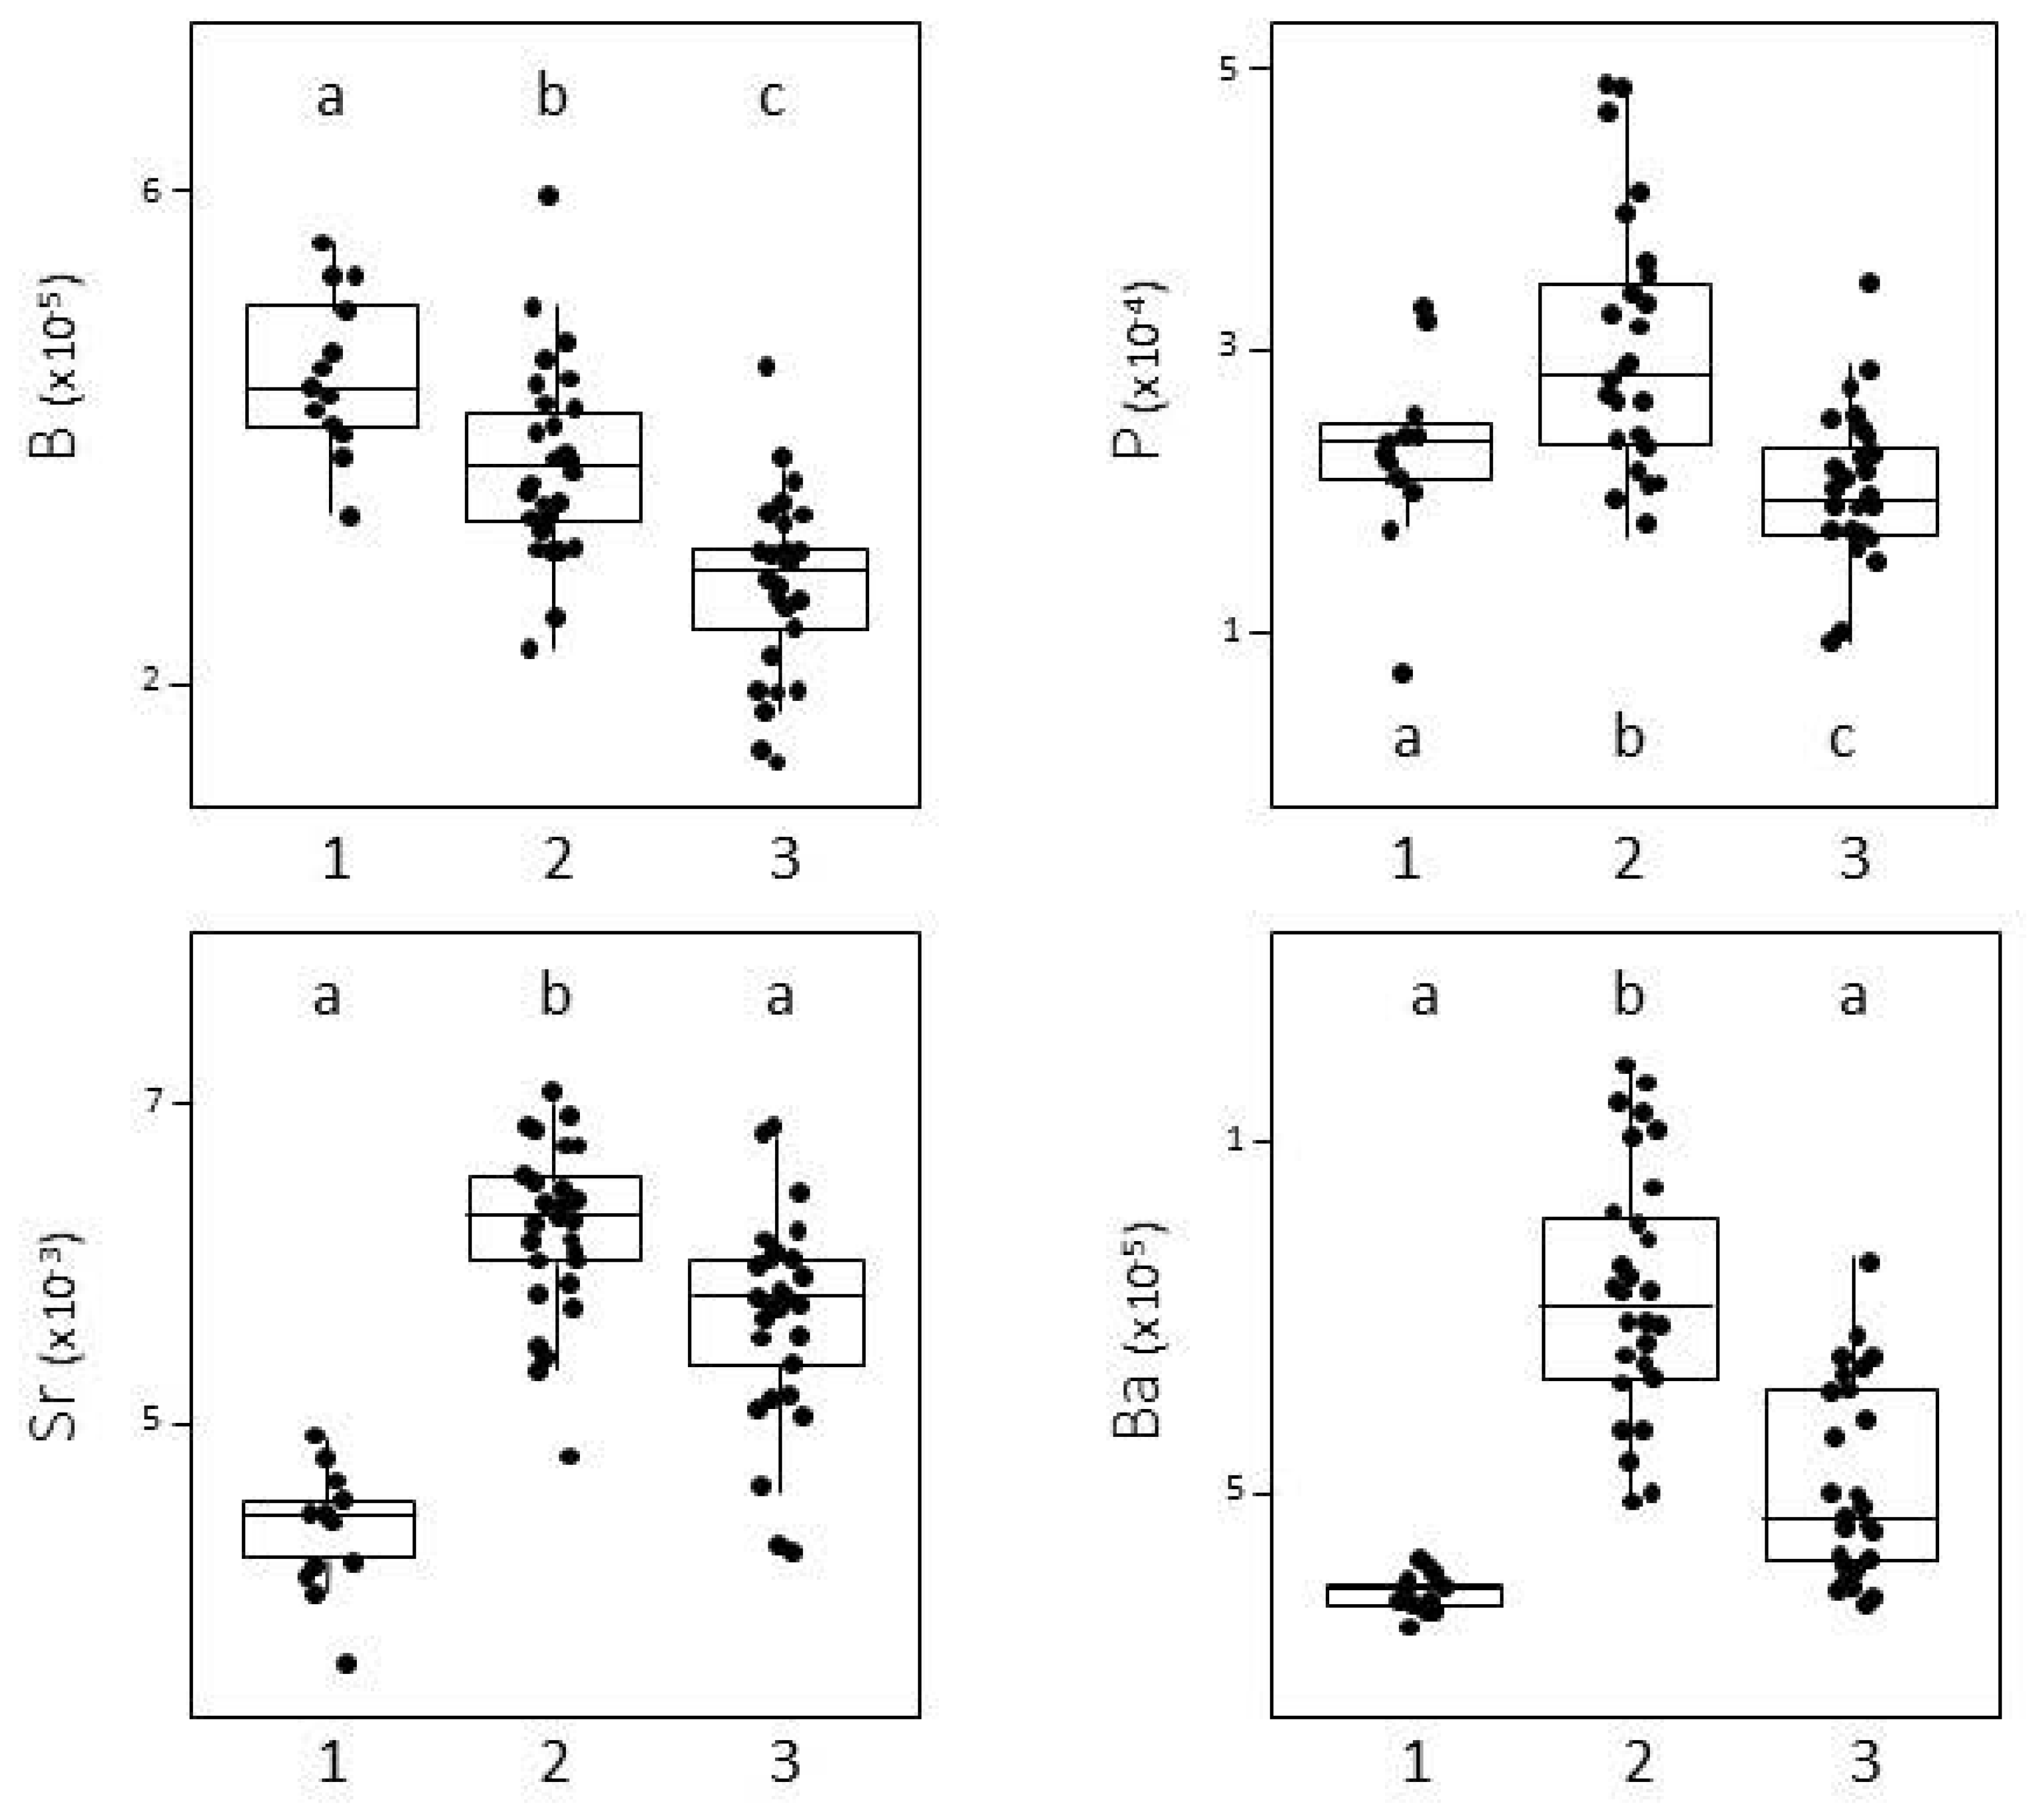
3.1. Capture Location Signatures

The first two dimensions of the PCA explained 60% of the total variation in otolith edge signatures (Figure 3), which were driven by differences in all the elements analysed (B, Mg, P, Sr, Zn, and Ba). However, B and P were the main drivers of the discrimination in dimension 1 and Ba and Sr in dimension 2. The chemical signatures recorded just before capture in the otolith were different (PERMANOVA, p < 0.05) for all three capture locations, although some overlap was observed between locations.
Edge signatures differed significantly (p < 0.05) between the adult fish sampled in SWI and all the fish sampled in South Africa (irrespective of the site), with SWI samples being significantly enriched in Ba, Sr, and Mg (Figure 4). For the fish captured in South Africa, the edge signatures differed (p < 0.05) according to the capture site, with significantly higher values of B and P in the fish from SA-N (Figure 4).

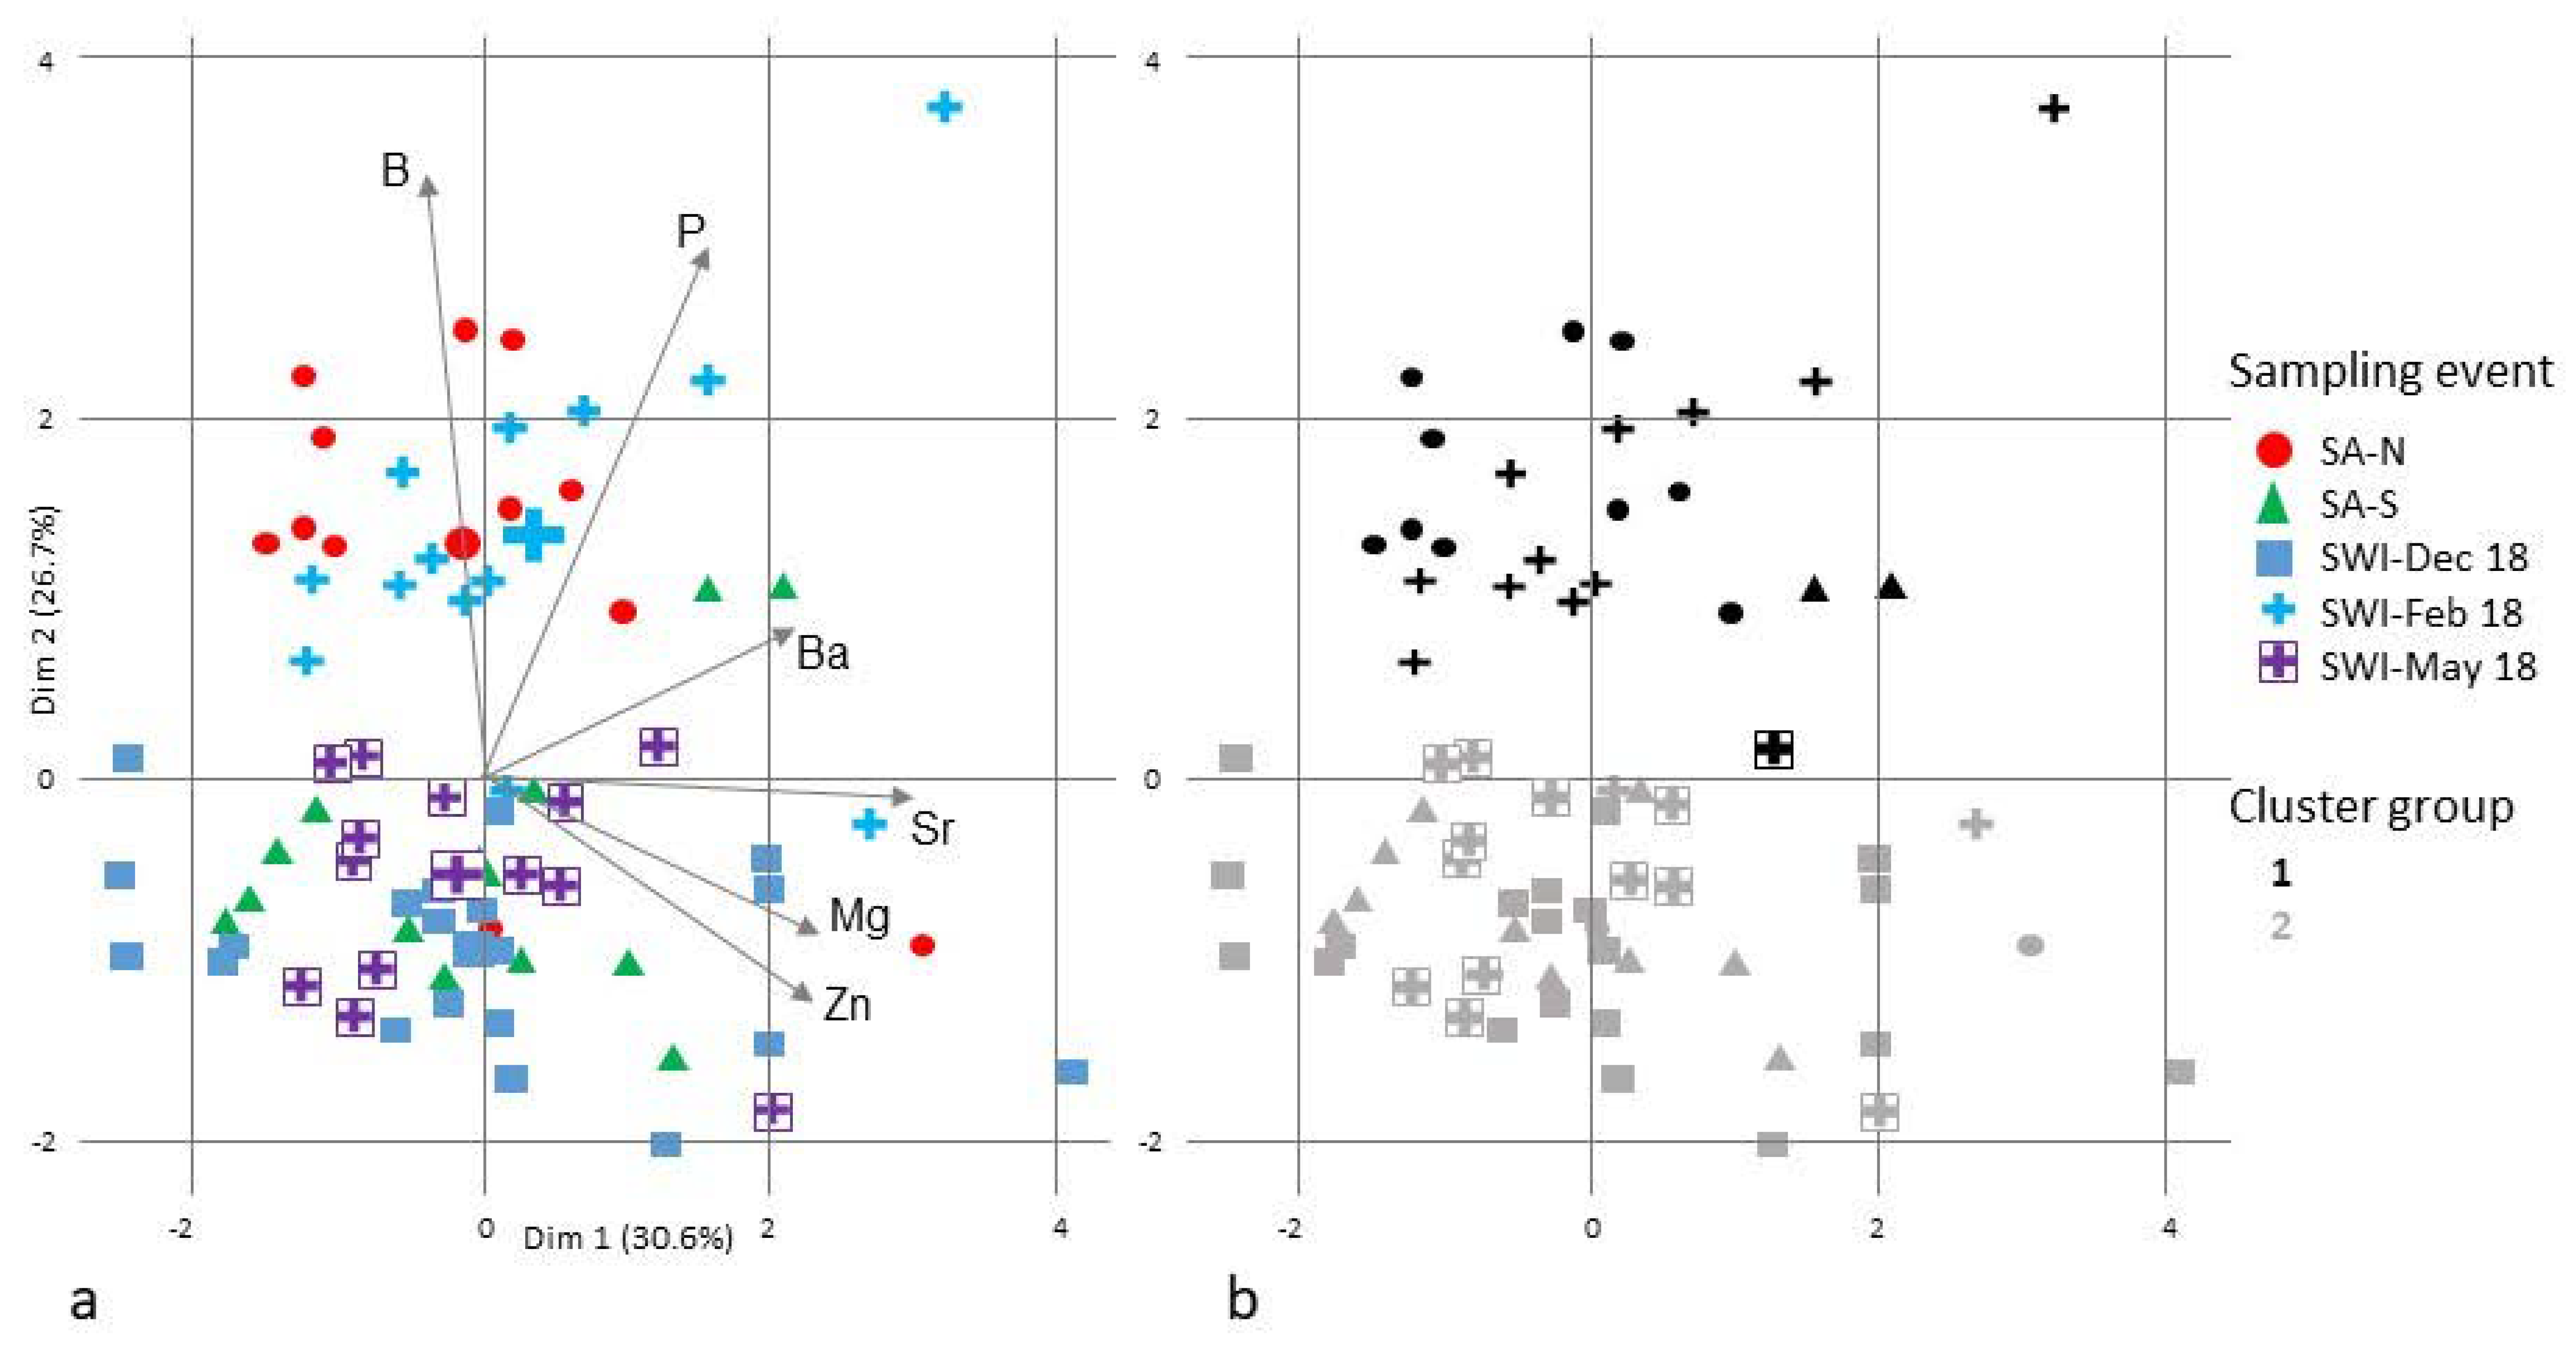
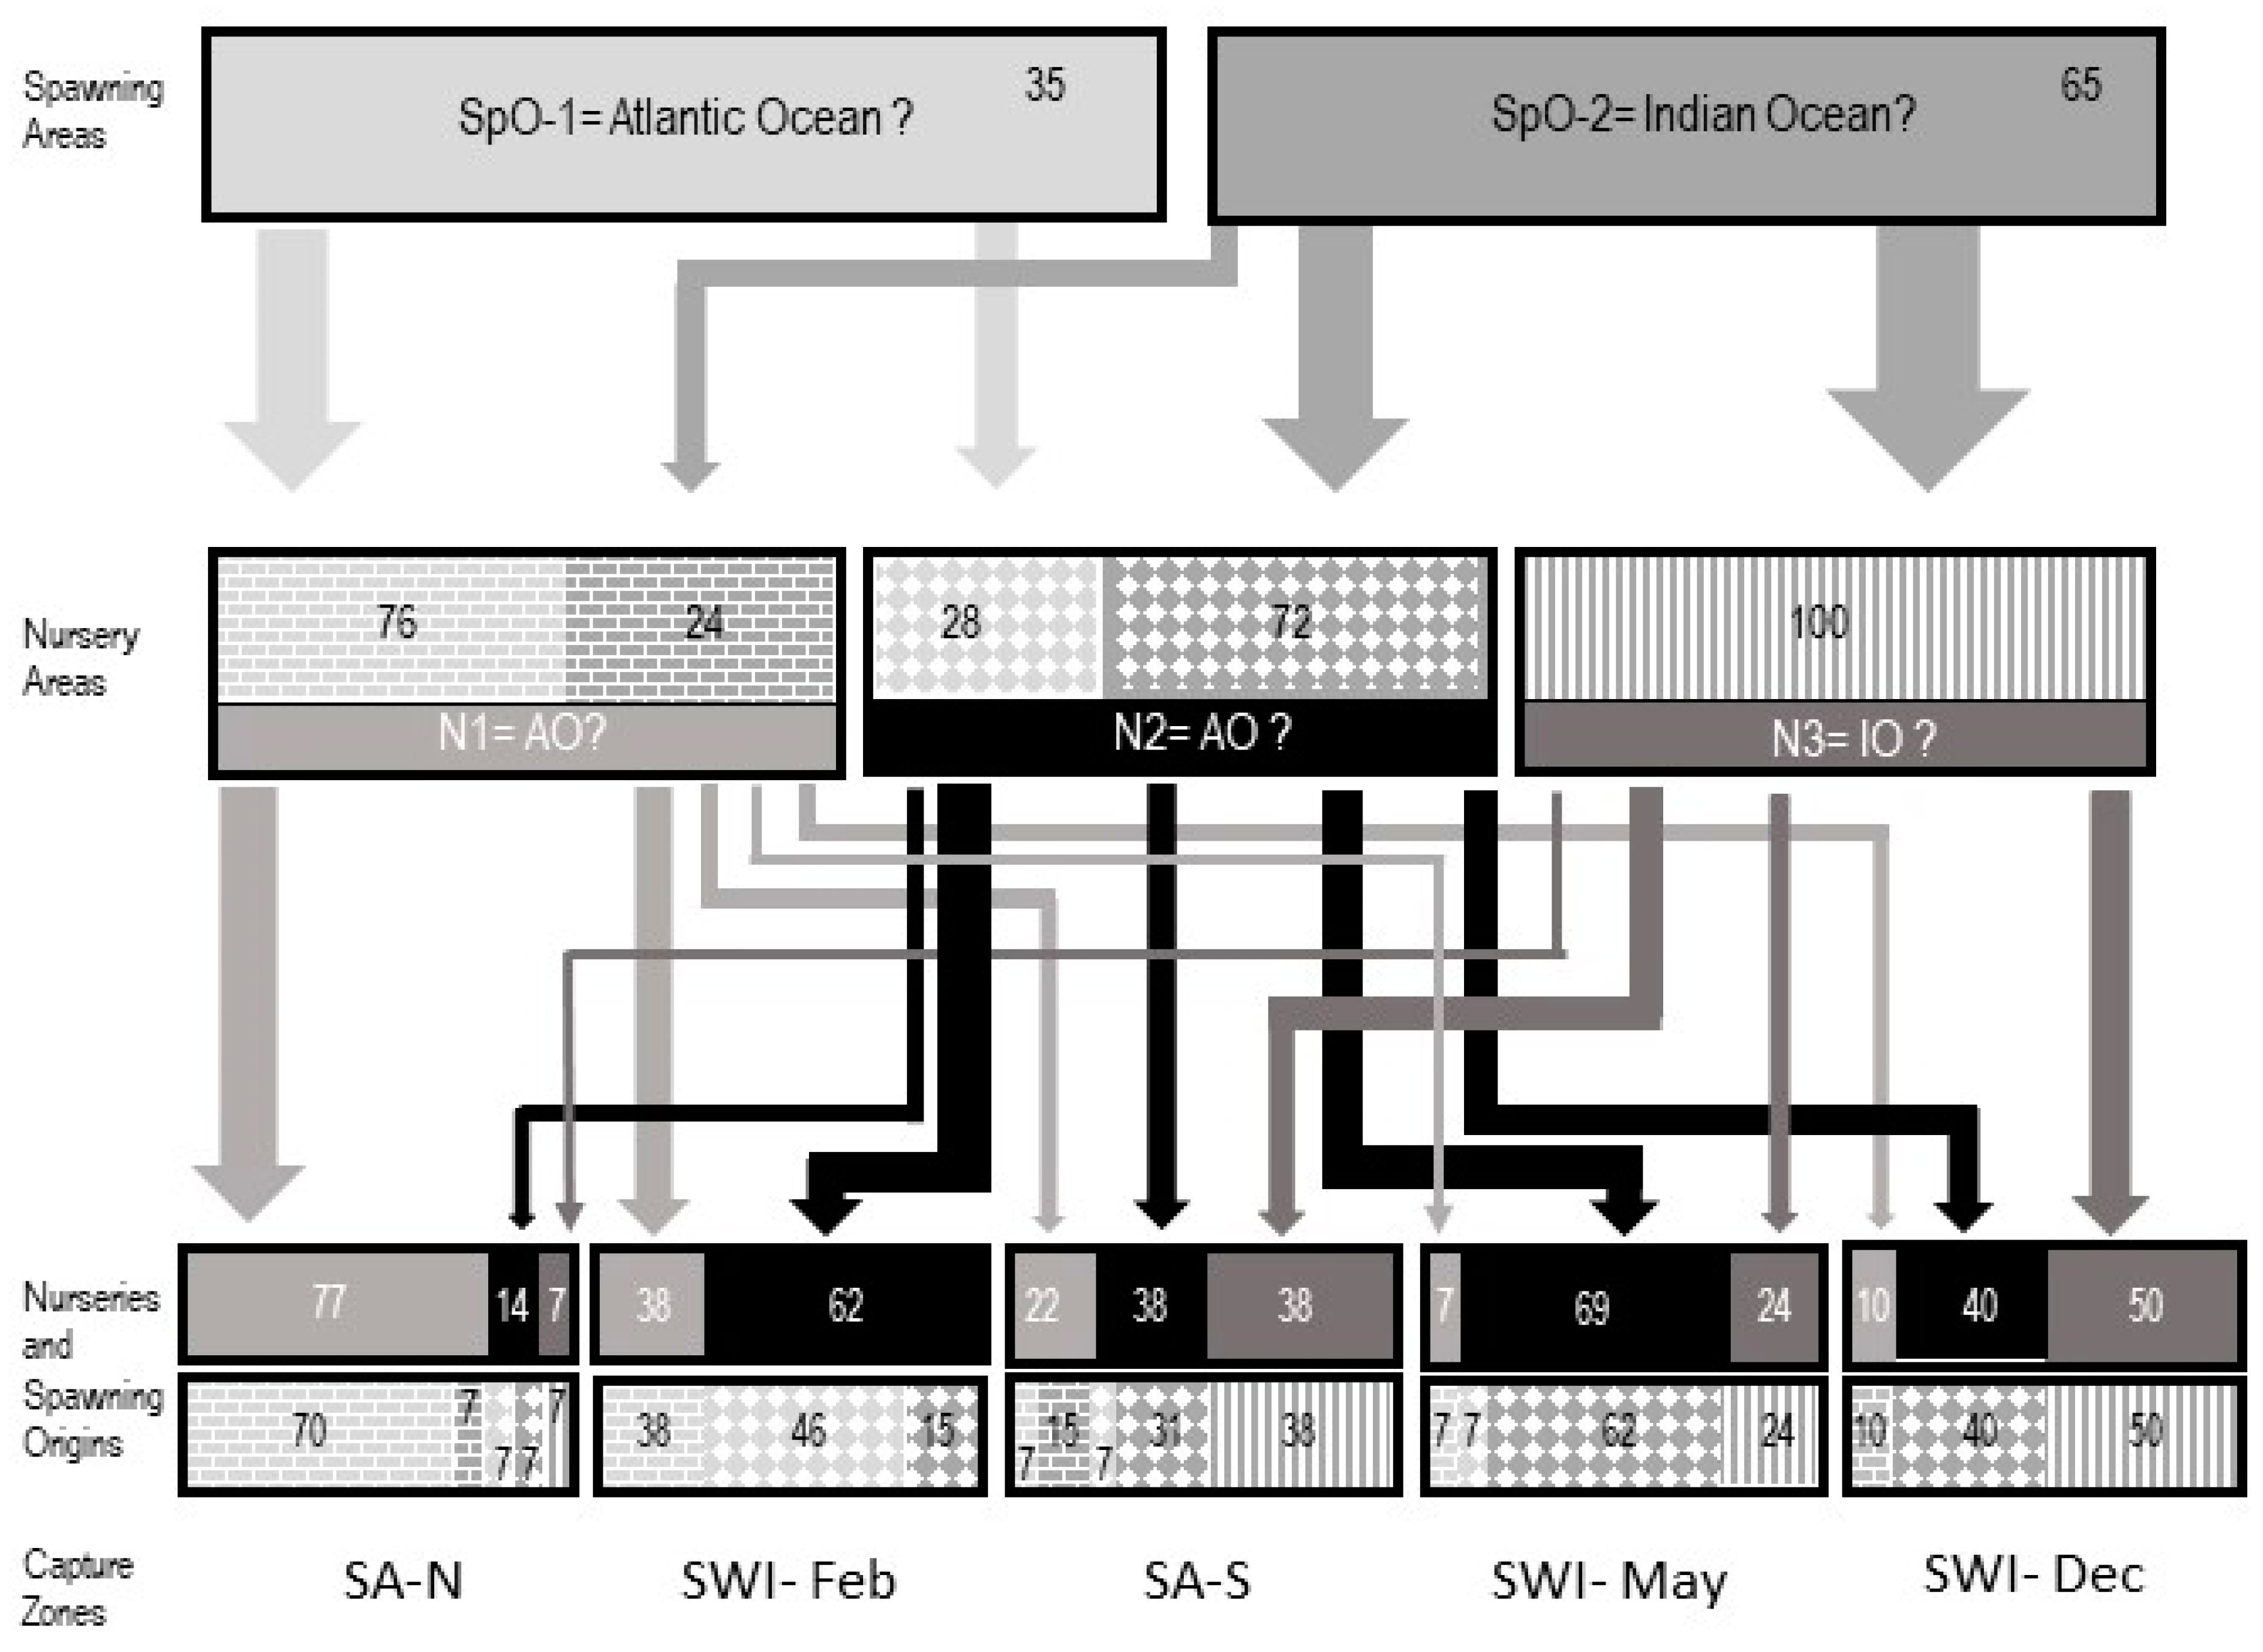
3.2. Fish Spawning Origin

The first two dimensions of the PCA explained 57.2% of the total variation in otolith near-primordium signatures (Figure 5a). Among the elements successfully measured in otolith near-primordium, only Sr, Zn, B, and P significantly contributed to inter-individual variation in near-primordium signatures and were retained for the further investigation of fish spawning origins.
The hierarchical clustering based on the signatures of these four elements (Sr, Zn, B, and P) identified two clusters of fish with potentially distinct spawning origins (SpO) (Figure 5b). The mean Jaccard similarity values of these two SpO were >0.85, with 2% as a maximum of variance, indicating they were highly stable.
Larval multi-elemental signatures significantly varied between the two clusters (PERMANOVA, p = 0.05). In particular, the fish from SpO-1 had higher near-primordium values in B and P than those of SpO-2 (Figure 6).
Overall, SpO-2 was the main spawning source (65%) for all the individuals sampled (Table 2). However, the proportion of fish belonging to the two SpO differed by site, but also by sampling date, representing 15% and 100% of the fish analysed, depending on the sampling event (Table 2). More specifically, most fish sampled from SA-N (83%) and from SWI in February (85%) originated from SpO-1, whereas the majority of fish sampled from SA-S (85%) and from SWI in May (92%) and December (100%) originated from SpO-2 (Table 2). As a result, SpO-1 was mainly composed of juveniles from SA-N and adults captured in February in SWI, and SpO-2 mostly comprised juvenile fish from SA-S and adults captured in May and December in SWI (Figure 5b).

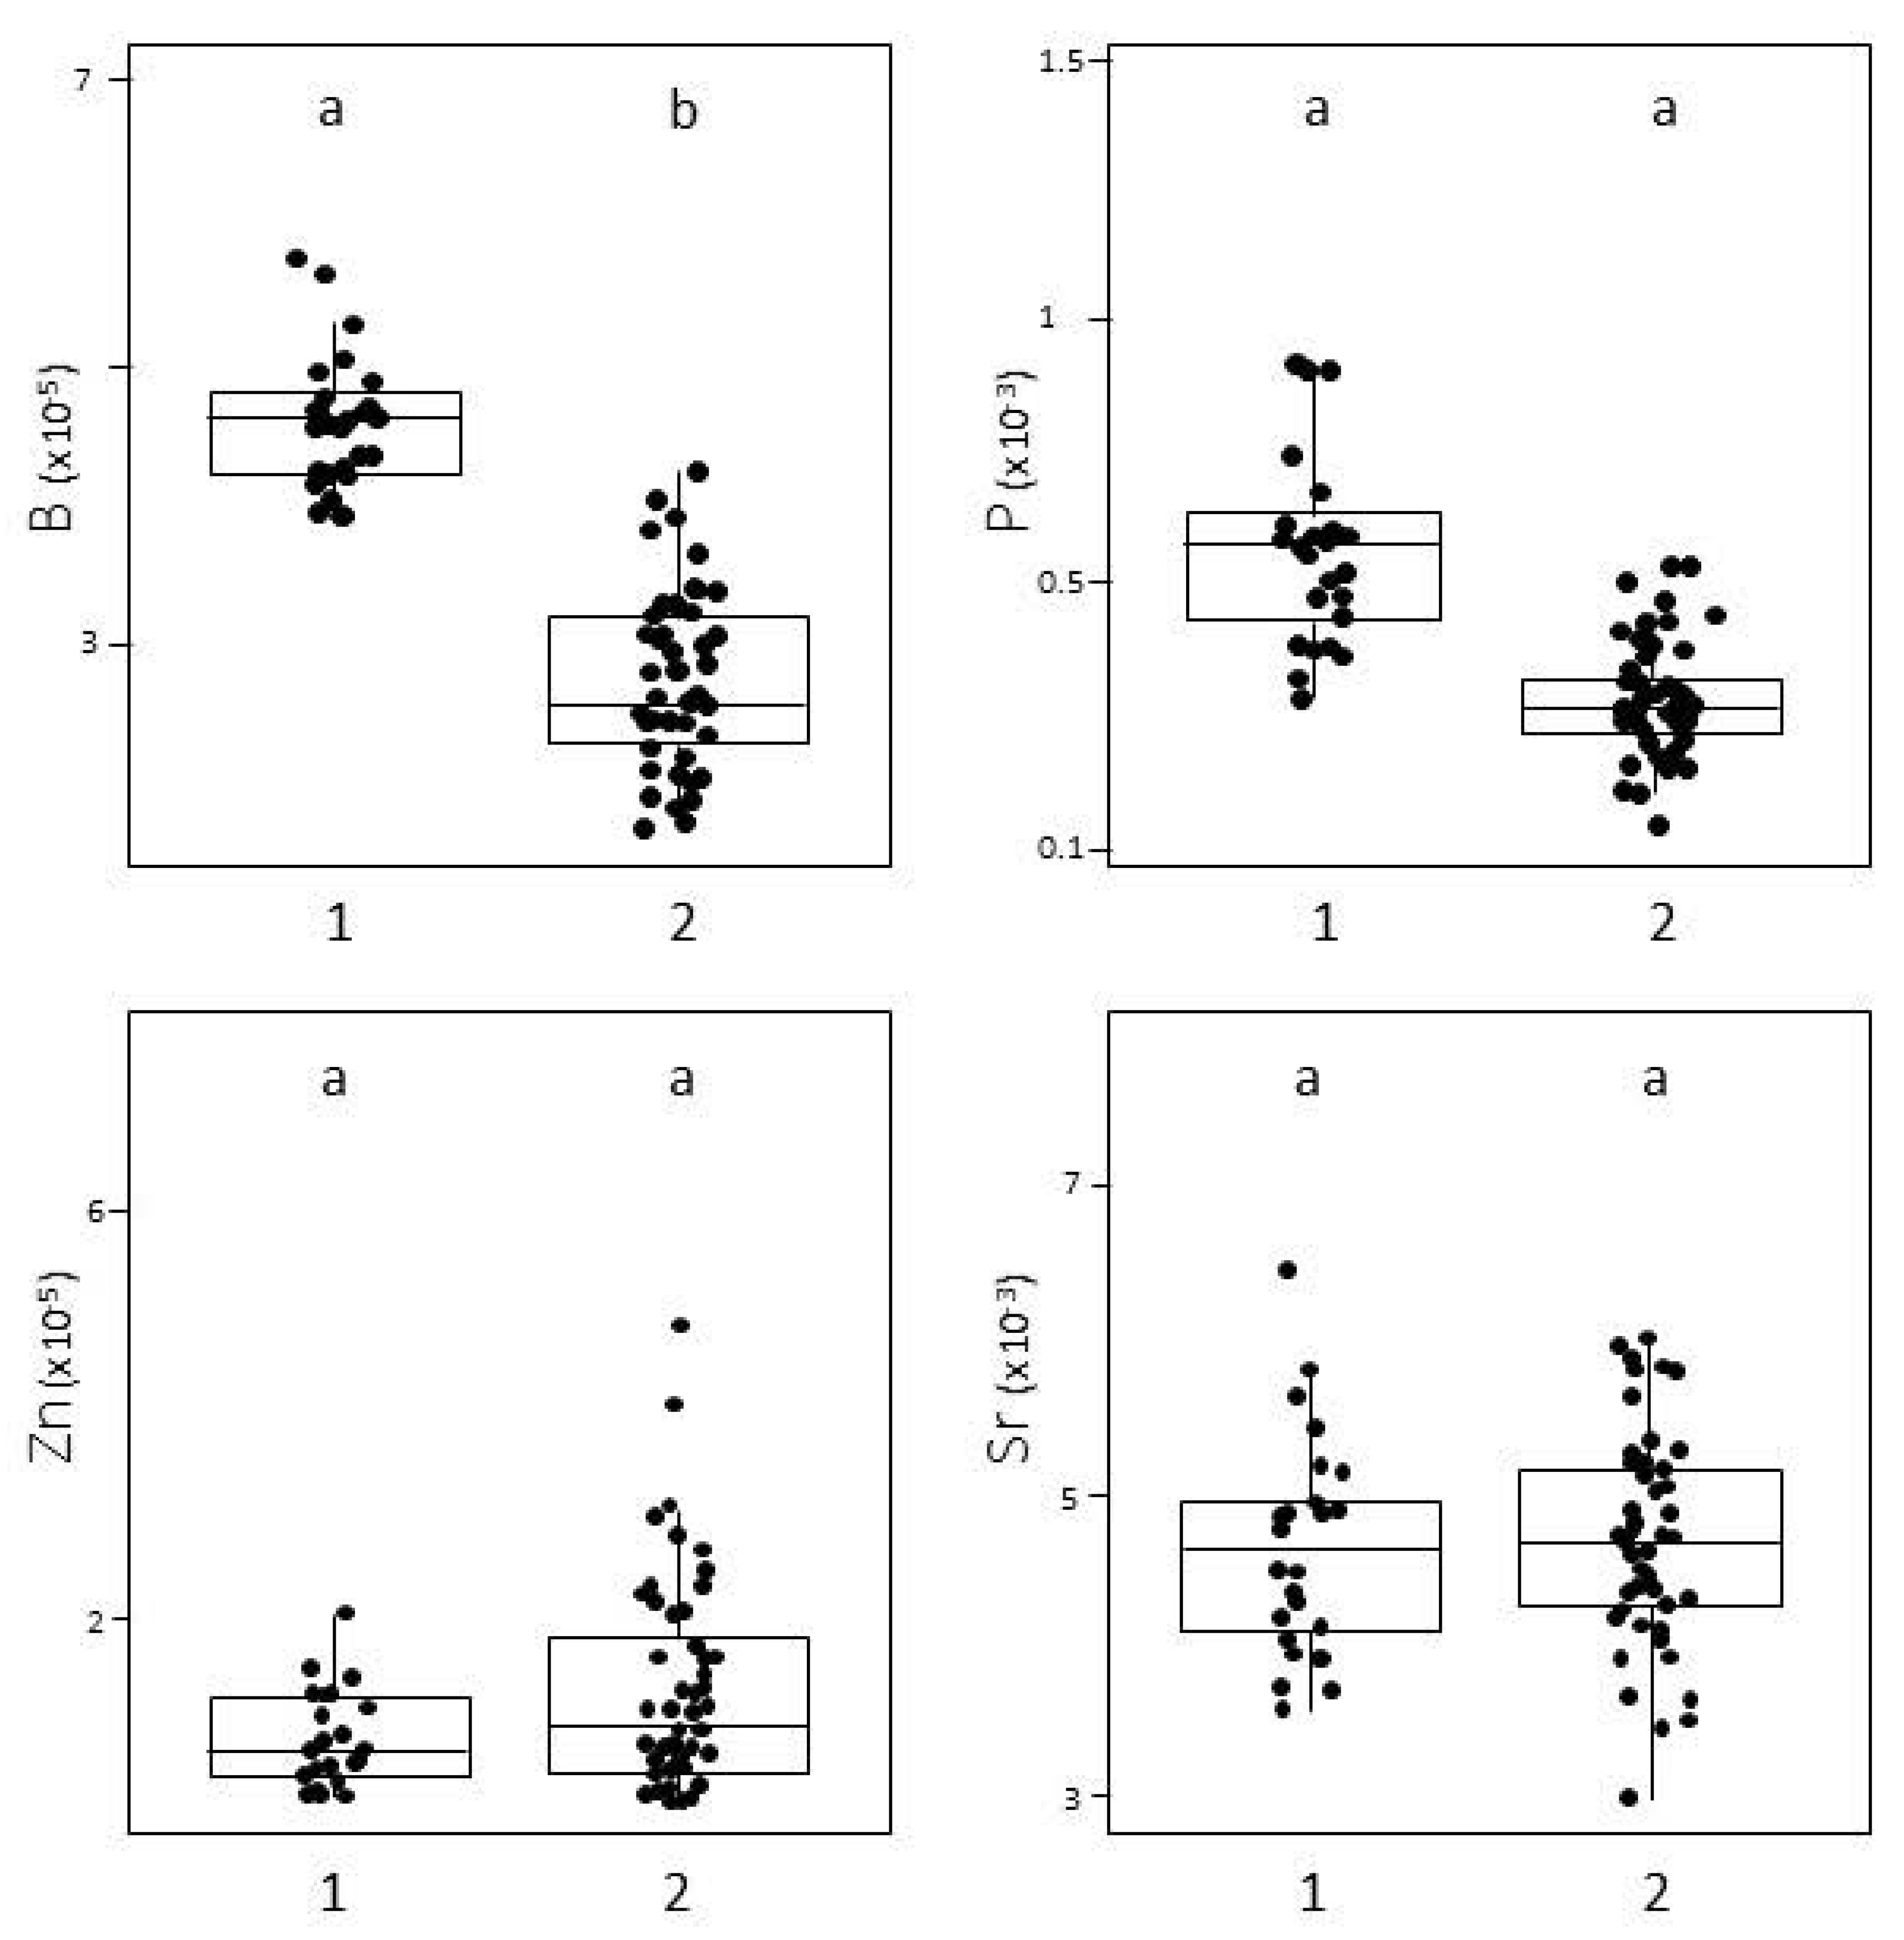
3.3. Fish Nursery Origin

Otolith multi-elemental signatures for past nursery ground signature overlapped in our fish (Figure 7a). The two first dimensions of the PCA explained 57.1% of the total variation in chemical signatures at this stage of life, the first one being mainly driven by B and P, and the second one by Sr and Ba.
Hierarchical clustering on the signatures in these four elements identified three distinct clusters of individuals, with potentially distinct “Nursery site” (N) signatures, among the fish analysed (Figure 7b). The mean Jaccard similarity values for these three clusters ranged from 0.73 to 0.80 with 14% as a maximum of variance, indicating relatively stable clusters despite the large area sampled on the otoliths.
N1 had significantly higher signatures in B and P (p < 0.05) than the two other potential Nursery sites (Figure 8), and multi-elemental signatures most resembling those of SpO-1 (Figure 6) and the SA-N capture site (Figure 4). It was identified as the nursery site for most of the fish captured in SA-N (77%), but only for 23% of those captured in SA-S (Table 3). Moreover, 38% of the adult fish captured in the SWI in February (and 10% in December) apparently had spent their first year of life in waters with this signature. The N2 signature was significantly enriched in Ba and Sr (p < 0.05) compared to others, and was identified as the nursery site for most of the fish sampled in this study (44% in total and between 15–70%, depending on the sampling event) (Table 3). N3 was characterised by the lowest concentrations in all chemical elements and was identified as the nursery site in only 26% of the total number of fish investigated, with percentages ranging between 0 and 50%, depending on the sampling event.

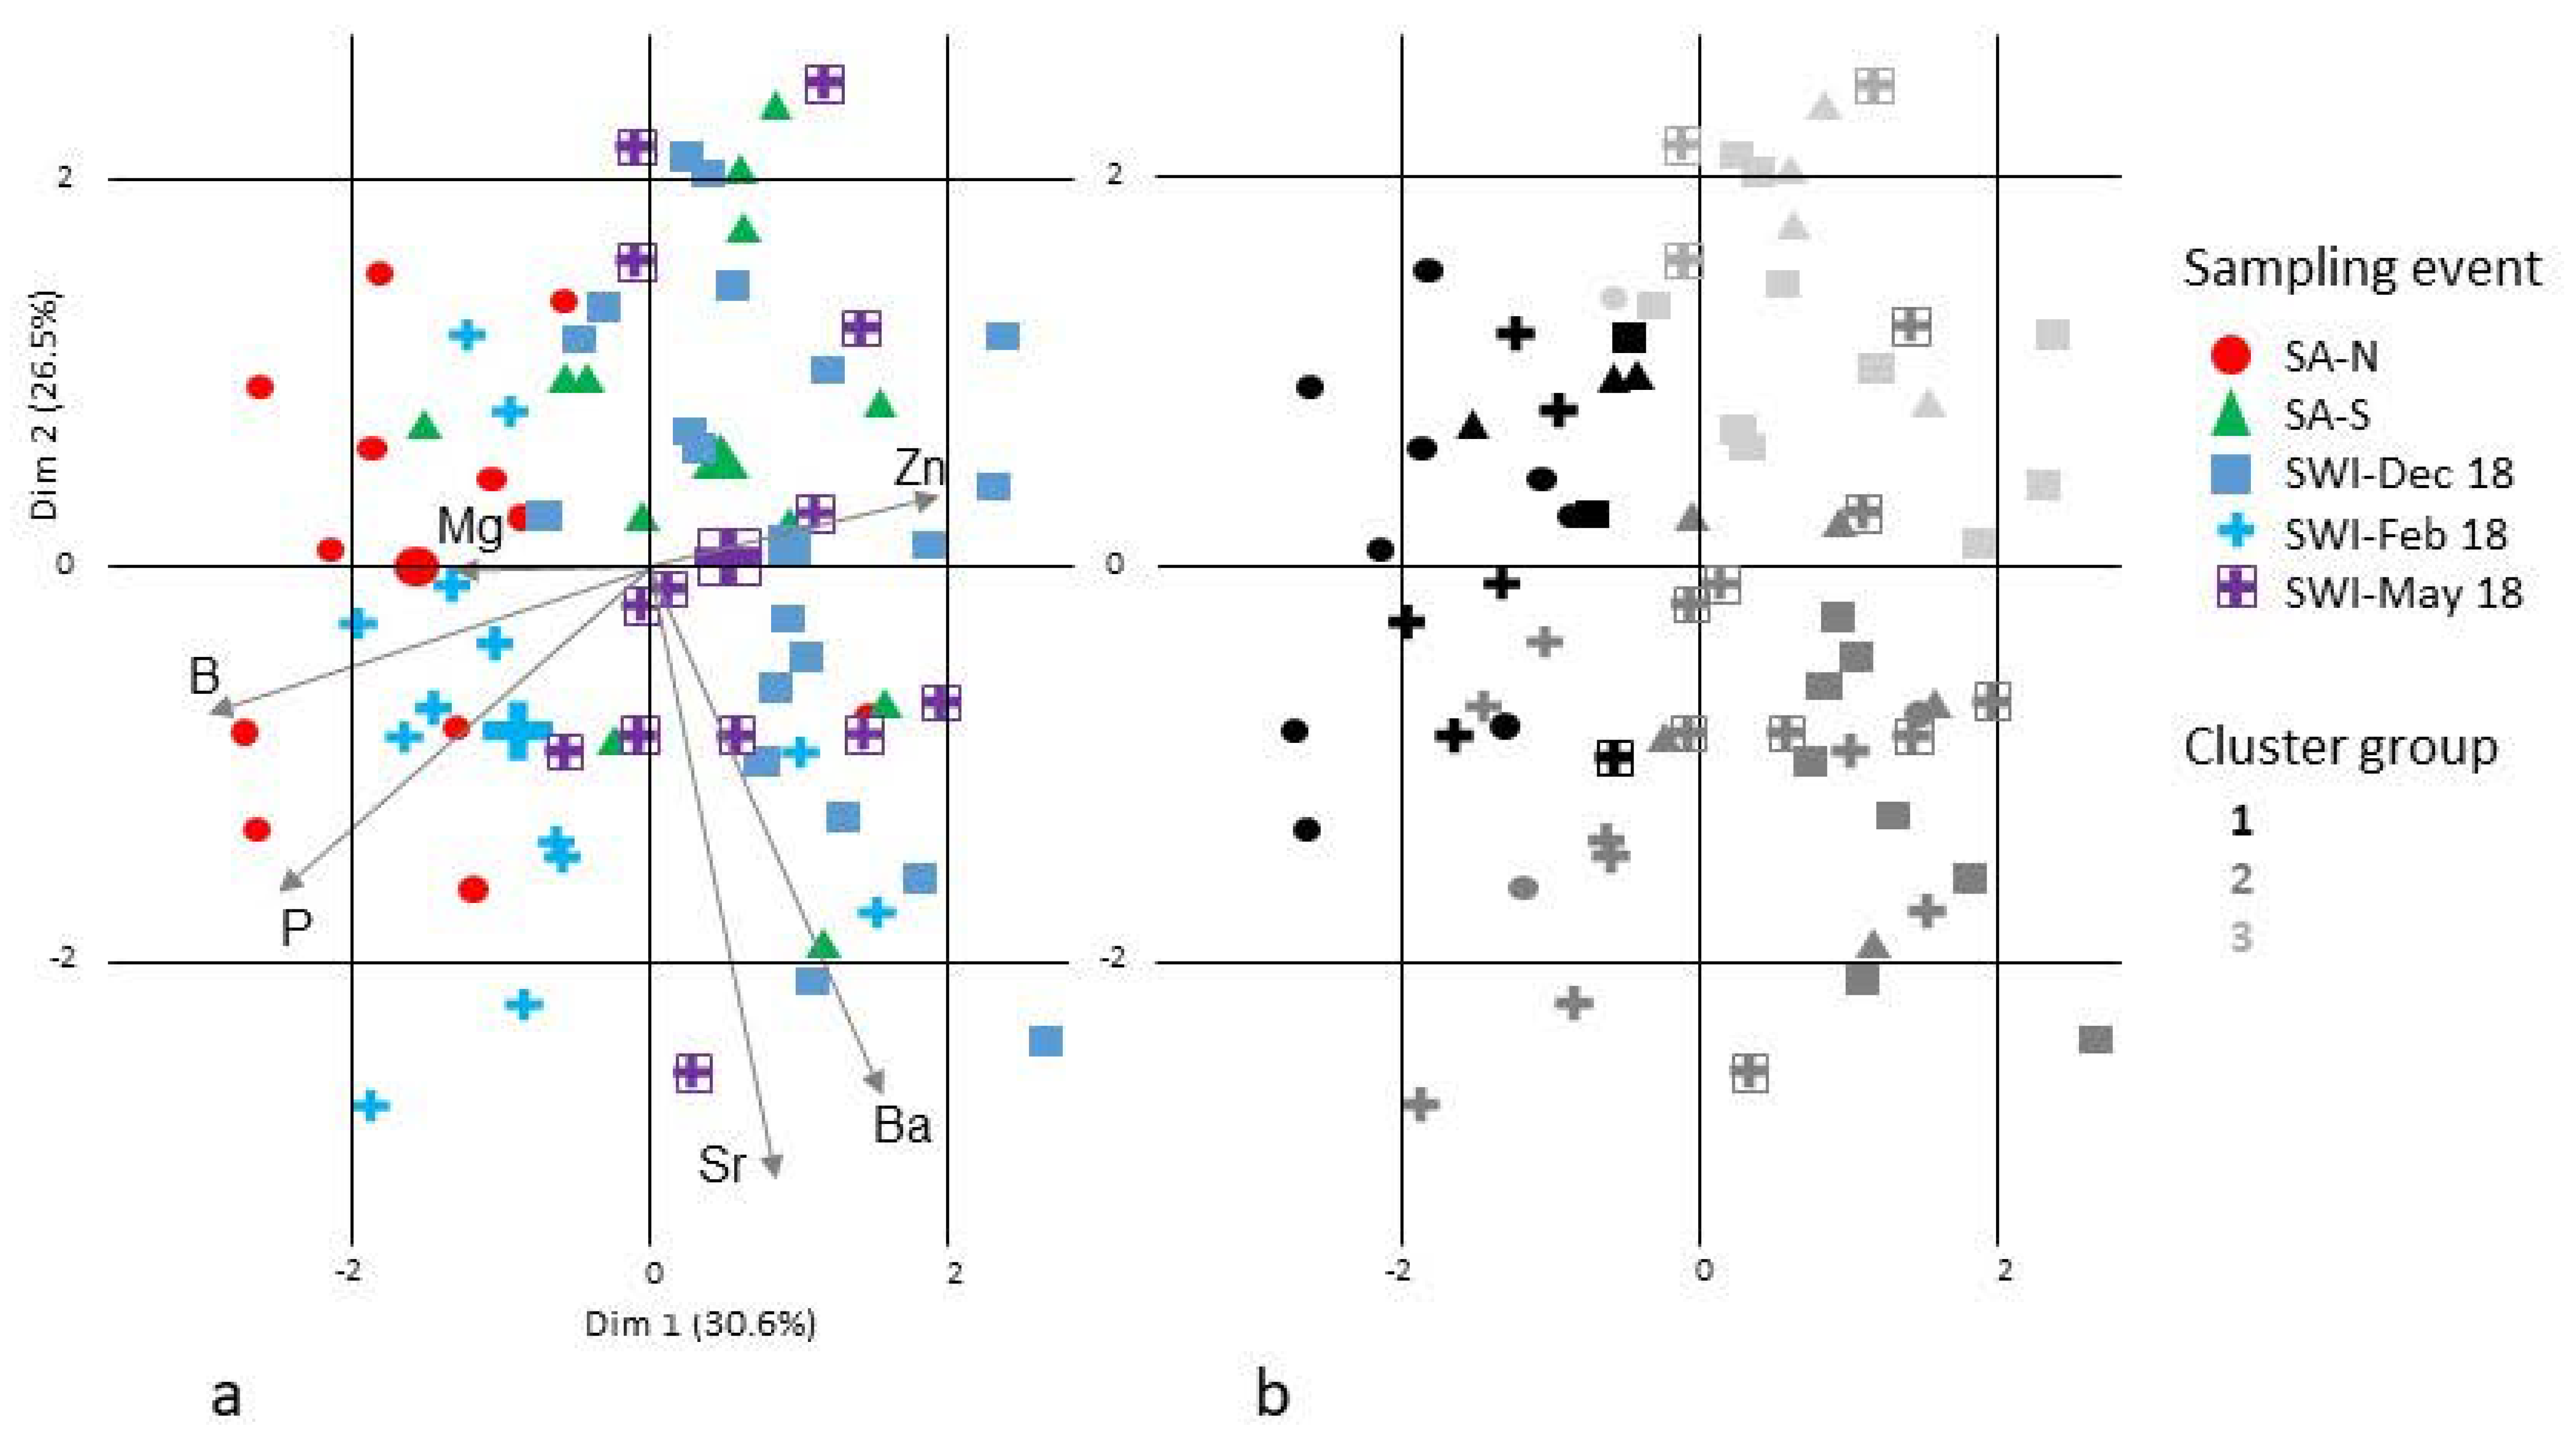
3.4. Lifetime Migrations

Otolith signatures indicated a wide variety of lifetime migration strategies in the albacore tuna investigated. In terms of larval connectivity, N1 was mainly found to be supplied by SpO-1 (76%), while N2 (72%) and N3 (100%) were mainly fed by SpO-2 (Table 4).
However, migration patterns between the albacore stocks in the SWI and SA regions were far more complex when including juvenile and sub-adult movements. Surprisingly, out of the six possible migration patterns identified in our analyses, only five were observed (Table 5). Indeed, Strategy 3 was not followed by any of the 72 individuals analysed, suggesting that there is no or very limited connectivity between SpO-1 and N3.
The least common migration pattern was Strategy 4 (7% of the fish), involving a successive use of SpO-2 and N1. Conversely, the most common pattern observed (32% of the fish) was Strategy 5, involving the successive use of SpO-2 and N2, followed by Strategy 6 (26% of the fish), involving the successive use of SpO-2 and N3. Strategies 5 and 6 were the most common for fish caught in SA-S and those caught in SWI in May and December. In contrast, Strategy 1, involving the successive use of SpO-1 and N1, was most common for fish caught in SA-N; it was also fairly common for fish caught in SWI in February, but Strategy 2 (from SpO-1 to N2 instead of N1) dominated.

4. Discussion

4.1. Reliability of the Elemental f Signatures of the Capture Zones

Despite the uncertainties stemming from the current lack of detailed spatial and temporal baseline information on the chemical makeup of the Atlantic and Indian Oceans, important spatial differences in otolith microchemistry can be expected for all three sampling sites, based on the drastically different characteristics of their water masses. Indeed, in the SWI, immature albacore tuna are mainly distributed in areas south of the 30° S meridian and under the influence of the Circumpolar Current, while mature individuals are concentrated at latitudes between 10° S and 25° S, under the influence of the subtropical gyre [12,13,15]. These two wide areas belong to different biogeochemical regions in the Global Ocean, with different bathymetries, planktonic productivities, surface temperatures, and water compositions, as illustrated by their contrasting salinities [50,51]. The same applies to the two SA sites, as the SA-N site belongs to a third separate province in the southeast Atlantic under the specific influence of the Benguela Current [50,51]. These different environmental settings are reflected in the marked differences in the otolith chemical signatures observed between all three capture locations. As the edges of the otoliths in the SWI and SA samples were deposited at very different ages (2–5 years vs. 7–15 years), ontogeny and temporal variability in the water masses’ composition over time could also contribute to some of the differences in otolith signatures between these two areas [52,53]. However, this does not apply to the differences observed between the South African sites sampled, as the fish from these two locations were collected at the same period and at similar sizes and ages. This suggests that, like in other tuna species [36,54], variations in otolith microchemical signatures in albacore tuna largely reflect differences in environmental conditions, allowing to discriminate between the contrasting water masses inhabited each year in both oceans by its juvenile and mature individuals.

4.2. Potential Spawning Sites

Among all the fish sampled, two groups of distinct near-primordium multi-elemental signatures, denoting potentially two discrete spawning origins, were identified. The attribution of these signatures to actual, spatially distinct spawning sites remains hypothetical, especially as the fish analysed in this work were not spawned in the same year. However, a number of strong assumptions can be made on the basis of our knowledge of the species’ biology and the characteristics of the water masses around its known spawning sites.
For albacore tuna, the closest two reported spawning areas to our sampling areas are located off Brazil, in the central Atlantic Ocean, and along the eastern shore of Madagascar in the western Indian Ocean [15,55,56,57], where important catches of adult albacore tuna repeatedly occur in warm waters. Another spawning area for the species has been identified south of the Java Island but, given the oceanic circulation in the area, it is mainly thought to be used by the other (eastern) distinct albacore populations in the Indian Ocean [7]. The Brazilian and Madagascar spawning sites are equidistant from the South African coast, with similar geostrophic surface currents connecting them to this area. In the present work, otolith signatures for SpO-1 (which were predominant in SA-N fish) were significantly higher for B, while SpO-2 signatures (which were the main type found in SA-S and SWI fish) presented low values for all elements. As B values were also significantly higher on the edge of the otoliths of the SA-N fish (caught in Atlantic water masses), SpO-2 could correspond to the spawning site off Madagascar in the Indian Ocean, while SpO-1 would indicate spawning in the central Atlantic. Of course, as the near-primordium otolith samples analysed in the present work were deposited up to 13 years apart, the water masses inhabited during the first weeks of life may have been very different even in fish spawned at the same location. However, the fact that the spawning origin was found to differ drastically between the fish from SA-N (83% of SpO-1) and SA-S (85% of SpO-2), which had similar sizes and ages, suggests that the two groups of near-primordium otolith signatures reflect spatial differences in the water composition rather than inter-annual variation in oceanic characteristics. The high mean Jaccard similarities found for the two clusters further indicate that the differences in multi-elemental signatures between SpO-1 and SpO-2 are very stable. This is in line with the fact that spawning takes place during relatively well-defined and contrasting periods in the Atlantic and the Indian Oceans, in October–March and in October–January, respectively [11,58], which limits the temporal variability in otolith chemical signatures for both origins.
Thus, despite the caveats linked to our fish samples and the potential for temporal variability in the chemical signature of the water masses inhabited by the larvae each year, our results strongly point to the existence of at least two discrete spawning sites for the areas sampled, probably off Madagascar and in the central Atlantic. This will have to be confirmed by comprehensive larval drift modelling and further microchemical analyses at a larger population scale.

4.3. Potential Nursery Sites

Our study identified three groups of distinct juvenile multi-elemental signatures, potentially denoting discrete early nursery areas, for the albacore tuna captured off South Africa and around the Reunion Island in the SWI. Despite the inherent uncertainties associated with attributing chemical signatures from different years to specific nursery areas, some hypotheses can be formulated based on the previous knowledge of the distribution of T. alalunga and differences in water masses’ characteristics between the two oceans.
As otolith signatures in the N1 group were significantly higher for B and P and resembled the SpO-1 ones, N1 is likely to reflect life on nursery sites with a similar water mass composition in the Atlantic Ocean. These could be located either off South Africa in the southeastern Atlantic or along the Brazilian coast in the southwestern Atlantic, where catches of immature albacore tuna are frequent [15,18]. Since the chemical signature of the N2 group was enriched in Sr and Ba, which is frequently correlated to residency in marine environments with strong upwellings [59,60,61], N2-group nurseries could correspond to the African coast in the eastern Atlantic just north of South Africa. Indeed, immature albacore tuna are also frequently captured in this area, where upwellings are common [15,18]. Finally, with its low concentrations in all elements, the chemical signature of the N3 group could potentially reflect life in the southwest Indian Ocean (30–40° S). Indeed, immature albacore tuna are commonly caught there [14,62,63] and a dynamic view of seasonal and interannual nutrient variability in the world ocean [64] showed that this area has particularly low concentrations of chemical elements, which was confirmed by the more recent study of Barret et al. 2018 [65].
Obviously, these results will need to be confirmed by further otolith sampling and microchemical analyses in all potential nursery sites, but the existence of at least two distinct nursery areas for T. alalunga in the Atlantic is in line with previous findings on the species [18,58,66,67,68]. Furthermore, our results support the currently accepted migratory patterns of albacore tuna in the south Atlantic Ocean, which suggested that spawning occurs off Brazil, and juveniles migrate along the southern American coasts before crossing the Atlantic Ocean to arrive along the western coast of South Africa [67,68].

4.4. Connectivity

Our findings bring new insights on the interdependency among albacore stocks currently managed separately. Out of the six possible migration patterns observed in our sample (Figure 9), the most common was Strategy 5, involving the successive use of the SpO-2 spawning ground and the N2 nursery site. As otolith composition suggests that SpO-2 is located in the Indian Ocean and N2 along the eastern coast of Africa, this would imply a widespread transoceanic migration from the Indian Ocean toward the Atlantic in albacore tuna below 50 cm in size. This had already been suggested by Lebeau 1971 [69]. However, our results interestingly point out that the reverse migration (i.e., from the Atlantic toward the Indian Ocean) is rare at this life stage, since SpO-1 was not found to contribute to the N3 nursery site located in the Indian Ocean.
One possible explanation is that the Agulhas current (which flows in a south-west direction along the western coast of southern Africa and around its southerly tip) acts as a barrier to migration for albacore tunas of this size, which remain nearshore of the south African coastline because they have not yet reached their full physiological adaptive capacity [6]. Indeed, the heat exchangers work less efficiently in young albacores and the swim bladder in this species reaches its full development at sizes between 80 and 90 cm, so albacores below this size cannot adjust their depth at will and seem to be bound to remain close to the surface while adults can live in deeper and colder waters [70].
Our results also suggest transoceanic migrations after the first year of life, especially between the N1 and N2 nursery areas, both putatively located in the Atlantic Ocean, and the Reunion Island adult capture site, in the Indian Ocean. This again is consistent with the results of Lebeau, 1971 [69], which reported albacore tuna migrations from South Africa to the Indian Ocean, either for feeding (in 1–4-year-old individuals) or to reach spawning areas (in 4–5-year-old maturing sub-adults) [14]. Migrations from the N3 nursery area, potentially in the Indian Ocean towards our capture sites in the Atlantic Ocean, were also observed, particularly for SA-S individuals.
Further research is required to better quantify the fluxes of individuals between the two oceans at each life stage, and their respective consequences for local fishery production and population maintenance. We suggest collecting albacore tuna from other locations in the Indian (eastern and western parts) and Atlantic (west coast of Africa) Oceans where juveniles are caught, adults are known to spawn, or larvae have been reported. These samples could be used to validate whether the spawning and nursery clusters found in this study do correspond to the spatially distinct regions suspected here. Additionally, an investigation into the distribution of biogeochemical tracers of the Indian Ocean and Atlantic Ocean water masses would provide highly valuable information for the interpretation of the elemental composition of albacore otoliths. Finally, it is also important to stress the necessity for genetic approaches to confirm the contributions of the populations, complement the results of otolith microchemistry in this context, and thus refine the conclusions.

5. Conclusions

This research sheds complementary light on the intricate dynamics of albacore tuna stocks currently managed separately, urging the incorporation of transoceanic perspectives into current management practices. It confirms previous findings from varied approaches, ranging from genetics to larval drift modelling, which suggested non-negligible connections between the albacore tuna stocks fished in the Atlantic and in the Indian oceans. However, it goes beyond this knowledge by offering new valuable information on the potential direction, timing, and location of these transoceanic exchanges. Keeping in mind the uncertainties associated with otolith microchemistry, especially in the absence of baseline chemical information, our results suggest the existence of at least two distinct spawning origins and three discrete nursery areas in the albacore stocks from the three areas sampled, with a common spawning origin in some fish from the SWI and from the SA, and complex migrations between the two oceans. Importantly, the movements identified here are not symmetrical and occur at early life stages that are regularly overlooked by fishery scientists because young fish < 40 cm are particularly difficult to catch. Taking these movements into account is needed for effective and sustainable fishery management both in the Indian Ocean and in the Atlantic.

Author Contributions

Conceptualisation, M.L. and A.M.D.; Formal analysis, M.L., A.M.D., T.F., C.P., N.N., N.C., J.F., J.P.E. and I.A.-A.; Funding acquisition, H.M., C.D. and F.M.; Methodology, M.L. and A.M.D.; Project administration, F.M.; Resources, D.P., S.J.N. and N.C.; Supervision, A.M.D., H.M., C.D. and F.M.; Writing—original draft, M.L. and A.M.D.; Writing—review and editing, M.L., A.M.D., N.N., D.P., N.C., J.F., J.P.E., I.A.-A., H.M., C.D. and F.M. All authors have read and agreed to the published version of the manuscript.

Funding

This study is part of a collaborative project on the Population Stock Structure of Tuna, Billfish and Sharks of the Indian Ocean (PSTBS-IO). The project was supported by funding from CSIRO Oceans and Atmosphere, AZTI-BRTA, Institut de Recherche pour le Développement (IRD), and Indonesia’s Centre for Fisheries Research (CFR), and financial assistance of the European Union (Grant number S12.697993) and the FAO/ITC within a framework of a collaborative project (GCP/INT/233/EC—Population structure of IOTC species in the Indian Ocean). The views expressed herein can in no way be taken to reflect the official opinion of the European Union or the FAO.

Institutional Review Board Statement

The samples were all taken from fish that had been captured and killed as part of normal operation of a regulated commercial fishery, so ethics approval was not required.

Informed Consent Statement

Not applicable.

Data Availability Statement

SEA scieNtific Open data Edition.

Acknowledgments

We are grateful to the skippers of the domestic longline fleet in Reunion Island (M. Le Guernic, R. Levian, M. Hoarau, S. Kazambo, S. Laffont, L. Corbrejaud) for their continued support of the “PSTBS-IO” project. We also thank Reunimer and Enez (particularly H. Chenede and F. Payet) for facilitating access to work plans for sampling in good condition. We would like to thank O. Bruguier (Montpellier University) for its help with LA-ICPMS analyses.

Conflicts of Interest

The authors declare no conflicts of interest. The funders had no role in the design of the study; in the collection, analyses, or interpretation of data; in the writing of the manuscript; or in the decision to publish the results.

References

  1. Kerr, L.A.; Hintzen, N.T.; Cadrin, S.; Clausen, L.W.; Dickey-Collas, M.; Goethel, D.R.; Hatfield, E.M.; Kritzer, J.P.; Nash, R.D. Lessons learned from practical approaches to reconcile mismatches between biological population structure and stock units of marine fish. ICES J. Mar. Sci. 2017, 74, 1708–1722. [Google Scholar] [CrossRef]
  2. Rooker, J.R.; Arrizabalaga, H.; Fraile, I.; Secor, D.H.; Dettman, D.L.; Abid, N.; Addis, P.; Deguara, S.; Karakulak, F.; Kimoto, A.; et al. Crossing the line: Migratory and homing behaviors of Atlantic bluefin tuna. Mar. Ecol. Prog. Ser. 2014, 504, 265–276. [Google Scholar] [CrossRef]
  3. Rooker, J.R.; Dance, M.A.; Wells, R.J.; Ajemian, M.J.; Block, B.A.; Castleton, M.R.; Drymon, J.M.; Falterman, B.J.; Franks, J.S.; Hammerschlag, N.; et al. Population connectivity of pelagic megafauna in the Cuba-Mexico-United States triangle. Sci. Rep. 2019, 9, 1663. [Google Scholar] [CrossRef] [PubMed]
  4. ISSF. Status of the world fisheries for tuna: 22. In ISSF Technical Report 2022-13; International Seafood Sustainability Foundation: Washington, DC, USA, 20 July 2022. [Google Scholar]
  5. Stequert, B.; Marsac, F. Tropical Tuna Surface Fisheries in the Indian Ocean; FAO fisheries technical paper; FAO: Rome, Italy, 1989; Volume 282, 238p. [Google Scholar]
  6. Penney, A.; Yeh, S.; Kuo, C.; Leslie, R. Relationships between albacore (Thunnus alalunga) stocks in the southern Atlantic and Indian Oceans. Col. Vol. Sci. Pap. ICCAT 1998, 50, 261–271. [Google Scholar]
  7. Yeh, S.Y.; Hui, C.F.; Treng, T.D.; Kuo, C.L. Indian Ocean albacore stock structure studies by morphometric and DNA sequence methods. In Proceedings of the 6th Expert Consultation on Indian Ocean Tunas, Colombo, Sri Lanka, 25–29 September 1995; pp. 258–263. [Google Scholar]
  8. Nishikawa, Y.; Honma, M.; Ueyanagi, S.; Kikawa, S. Average distribution of larvae of oceanic species of scombroid fishes, 1956–1981. Bull. Far Seas Fish. Res. Lab. 1985, 12, 1–99. [Google Scholar]
  9. Nishida, T.; Tanaka, M. General reviews of Indian Ocean Albacore (Thunnus alalunga). IOTC-2008-WPTe-INF03. Available online: https://iotc.org/documents/general-reviews-indian-ocean-albacore-thunnus-alalunga-0 (accessed on 3 December 2023).
  10. Nikolic, N.; Montes, I.; Lalire, M.; Puech, A.; Bodin, N.; Arnaud-Haond, S.; Kerwath, S.; Corse, E.; Gaspar, P.; Hollanda, S.; et al. Connectivity and population structure of albacore tuna across southeast Atlantic and southwest Indian Oceans inferred from multidisciplinary methodology. Sci. Rep. 2020, 10, 15657. [Google Scholar] [CrossRef]
  11. IOTC. Improving Biological Knowledge of Albacore Tuna, Thunnus alalunga, in the Indian Ocean: A Scoping Study. IOTC-2022-WPTmT08(DP)-INF01. Available online: https://iotc.org/documents/WPTmT/801/INF01 (accessed on 3 December 2023).
  12. Dhurmeea, Z.; Zudaire, I.; Chassot, E.; Cedras, M.; Nikolic, N.; Bourjea, J.; West, W.; Appadoo, C.; Bodin, N. Reproductive Biology of Albacore Tuna (Thunnus alalunga) in the Western Indian Ocean. PLoS ONE 2016, 11, e0168605. [Google Scholar] [CrossRef]
  13. Chen, I.C.; Lee, P.F.; Tzeng, W. Distribution of albacore (Thunnus alalunga) in the Indian Ocean and its relation to environmental factors. Fish. Oceanogr. 2005, 14, 71–80. [Google Scholar] [CrossRef]
  14. Nikolic, N.; Fonteneau, A.; Hoarau, L.; Morandeau, G.; Puech, A.; Bourjea, J. Short Review on Biology, Structure, and Migration of Thunnus alalunga in the Indian Ocean. IOTC–2014–WPTmT05–13 Rev_2. Available online: http://www.iotc.org/fr/documents/short-review-biology-structure-and-migration-thunnus-alalunga-indian-ocean (accessed on 3 December 2023).
  15. Nikolic, N.; Morandeau, G.; Hoarau, L.; West, W.; Arrizabalaga, H.; Hoyle, S.; Nicol, S.J.; Bourjea, J.; Puech, A.; Farley, J.H.; et al. Review of albacore tuna, Thunnus alalunga, biology, fisheries and management. Rev. Fish. Sci. 2017, 27, 775–810. [Google Scholar] [CrossRef]
  16. Morita, S. On the relationship between the albacore stocks of the South Atlantic and Indian Oceans. Collect. Vol. Sci. Pap. ICCAT 1977, 7, 232–237. [Google Scholar]
  17. ICCAT. Report of the 2013 ICCAT north and south atlantic albacore stock assessment meeting. Collect. Vol. Sci. Pap. ICCAT 2014, 70, 830–995. [Google Scholar]
  18. ICCAT. Report for Biennial Period, 2020-21, Part II. ICCAT-SRS 2020; International Commission for the Conservation of Atlantic Tunas: Madrid, Spain, 2020; 956p. [Google Scholar]
  19. Ward, R.D. Genetics in fisheries management. Hydrobiologia 2000, 420, 191–201. [Google Scholar] [CrossRef]
  20. Montes, I.; Iriondo, M.; Manzano, C.; Arrizabalaga, H.; Jimenez, E.; Pardo, M.; Goñi, N.; Davies, C.; Estonba, A. Worldwide genetic structure of albacore Thunnus alalunga revealed by microsatellite DNA markers. Mar. Ecol. Prog. Ser. 2012, 471, 183–191. [Google Scholar] [CrossRef]
  21. Laconcha, U.; Iriondo, M.; Arrizabalaga, H.; Manzano, C.; Markaide, P.; Montes, I.; Zarraonaindia, I.; Velado, I.; Bilbao, E.; Goñi, N.; et al. New Nuclear SNP Markers Unravel the Genetic Structure and Effective Population Size of Albacore Tuna (Thunnus alalunga). PLoS ONE 2015, 10, e0128247. [Google Scholar] [CrossRef]
  22. Albaina, A.; Iriondo, M.; Velado, I.; Laconcha, U.; Zarraonaindia, I.; Arrizabalaga, H.; Pardo, M.A.; Lutcavage, M.; Grant, W.S.; Estonba, A. Single nucleotide polymorphism discovery in albacore and Atlantic bluefin tuna provides insights into worldwide population structure. Anim. Genet. 2013, 44, 678–692. [Google Scholar] [CrossRef]
  23. Clément, C.; Guiraud, H.; Incabi, L.; Loze, L.; Simonet, L. Inference about genetic demographic and population management of albacore. Master Aquatic Ecosystem Dynamics; University of Pau and the Adour Region: Pau, France, 2022; 60p. [Google Scholar]
  24. Arrizabalaga, H.; Costas, E.; Juste, J.; González-Garcés, A.; Nieto, B.; López-Rodas, V. Population structure of albacore Thunnus alalunga inferred from blood groups and tag-recapture analyses. Mar. Ecol. Prog. Ser. 2004, 282, 245–252. [Google Scholar] [CrossRef]
  25. Sturrock, A.M.; Trueman, C.N.; Darnaude, A.M.; Hunter, E. Can otolith elemental chemistry retrospectively track migrations in fully marine fishes? J. Fish Biol. 2012, 81, 766–795. [Google Scholar] [CrossRef]
  26. Avigliano, E. Optimizing the methodological design in fish stock delineation from otolith chemistry: Review of spatio-temporal analysis scales. Rev. Fish. Sci. Aquac. 2022, 30, 330–345. [Google Scholar] [CrossRef]
  27. Hazen, E.L.; Maxwell, S.M.; Bailey, H.; Bograd, S.J.; Hamann, M.; Gaspar, P.; Godley, B.; Shillinger, G.L. Ontogeny in marine tagging and tracking science: Technologies and data gaps. Mar. Ecol. Prog. Ser. 2012, 457, 221–240. [Google Scholar] [CrossRef]
  28. Kalish, J.M. Otolith microchemistry: Validation of the effects of physiology, age and environment on otolith composition. J. Exp. Mar. Biol. Ecol. 1989, 132, 151–178. [Google Scholar] [CrossRef]
  29. Campana, S. Chemistry and composition of fish otoliths: Pathways, mechanisms and applications. Mar. Ecol. Prog. Ser. 1999, 188, 263–297. [Google Scholar] [CrossRef]
  30. Walther, B.D.; Limburg, K.E.; Jones, C.M.; Schaffler, J.J. Frontiers in otolith chemistry: Insights, advances and applications. J. Fish Biol. 2017, 90, 473–479. [Google Scholar] [CrossRef]
  31. Reis-Santos, P.; Gillanders, B.M.; Sturrock, A.M.; Izzo, C.; Oxman, D.S.; Lueders-Dumont, J.A.; Hüssy, K.; Tanner, S.E.; Rogers, T.; Doubleday, Z.A.; et al. Reading the biomineralized book of life: Expanding otolith biogeochemical research and applications for fisheries and ecosystem-based management. Rev. Fish Biol. Fish. 2022, 33, 411–449. [Google Scholar] [CrossRef]
  32. Elsdon, T.; Wells, B.K.; Campana, S.E.; Gillanders, B.M.; Jones, C.M.; Limburg, K.E.; Secor, D.H.; Thorrold, S.R.; Walther, B.D. Otolith chemistry to describe movements and life-history parameters of fishes: Hypotheses, assumptions, limitations and inferences. Oceanogr. Mar. Biol. Annu. Rev. 2008, 46, 297–330. [Google Scholar]
  33. Baumann, H.; Wells, R.J.D.; Rooker, J.R.; Zhang, S.; Baumann, Z.; Madigan, D.J.; Fisher, N.S. Combining otolith microstructure and trace elemental analyses to infer the arrival of juvenile Pacific bluefin tuna in the California current ecosystem. ICES J. Mar. Sci. 2015, 72, 2128–2138. [Google Scholar] [CrossRef]
  34. Fraile, I.; Arrizabalaga, H.; Santiago, J.; Goñi, N.; Arregi, I.; Madinabeitia, S.; Wells, R.J.D.; Rooker, J.R. Otolith chemistry as an indicator of movements of albacore (Thunnus alalunga) in the North Atlantic Ocean. Mar. Freshw. Res. 2016, 67, 1002–1013. [Google Scholar] [CrossRef]
  35. Rooker, J.R.; Wells, D.; Itano, D.G.; Thorrold, S.R.; Lee, J.M. Natal origin and population connectivity of bigeye and yellowfin tuna in the Pacific Ocean. Fish. Oceanogr. 2016, 25, 277–291. [Google Scholar] [CrossRef]
  36. Artetxe-Arrate, I.; Fraile, I.; Crook, D.A.; Zudaire, I.; Arrizabalaga, H.; Greig, A.; Murua, H. Otolith microchemistry: A useful tool for investigating stock structure of yellowfin tuna (Thunnus albacares) in the Indian Ocean. Mar. Freshw. Res. 2019, 70, 1708–1721. [Google Scholar] [CrossRef]
  37. Xu, Y.; Sippel, T.; Teo, S.L.; Piner, K.; Chen, K.S.; Wells, R.J. A comparison study of North Pacific albacore (Thunnus alalunga) age and growth among various sources. In Proceedings of the Chinese Taipei: ISC Albacore Working Group Meeting, La Jolla, CA, USA, 14–28 April 2014. [Google Scholar]
  38. Ueyanagi, S. Observations on the distribution of tuna larva in the Indo-Pacific Ocean with emphasis on the delineation of spawning areas of albacore, Thunnus alalunga. Bull. Far Seas Fish. Res. Lab. 1969, 2, 177–219. [Google Scholar]
  39. Wu, C.L.; Kuo, C.L. Maturity and fecundity of albacore, Thunnus alalunga (Bonnaterre), from the Indian Ocean. J. Fish. Soc. Taiwan 1993, 20, 135–151. [Google Scholar]
  40. Jochum, K.P.; Weis, U.; Stoll, B.; Kuzmin, D.; Yang, Q.; Raczek, I.; Jacob, D.E.; Stracke, A.; Birbaum, K.; Frick, D.A.; et al. Determination of Reference Values for NIST SRM 610–617 Glasses Following ISO Guidelines. Geostand. Anal. Res. 2011, 35, 397–429. [Google Scholar] [CrossRef]
  41. Sirot, C.; Ferraton, F.; Panfil, I.J.; Childs, A.R.; Guilhaumon, F.; Darnaude, A.M. ElementR: An R package for reducing elemental data from LA-ICPMS analysis of biological calcified structures. Methods Ecol. Evol. 2017, 8, 1659–1667. [Google Scholar] [CrossRef]
  42. Fink-Jensen, P.; Jansen, T.; Thomsen, T.B.; Serre, S.H.; Hüssy, K. Marine chemistry variation along Greenland’s coastline indicated by chemical fingerprints in capelin (Mallotus villosus) otoliths. Fish. Res. 2021, 236, 105839. [Google Scholar] [CrossRef]
  43. Ramírez-Álvarez, R.; Contreras, S.; Vivancos, A.; Reid, M.; López-Rodríguez, R.; Górski, K. Unpacking the complexity of longitudinal movement and recruitment patterns of facultative amphidromous fish. Sci. Rep. 2022, 12, 3164. [Google Scholar] [CrossRef]
  44. Brophy, D.; Jeffries, T.E.; Danilowicz, B.S. Elevated manganese concentrations at the cores of clupeid otoliths: Possible environmental, physiological, or structural origins. Mar. Biol. 2004, 144, 779–786. [Google Scholar] [CrossRef]
  45. Ruttenberg, B.I.; Hamilton, S.L.; Hickford, M.J.; Paradis, G.L.; Sheehy, M.S.; Standish, J.D.; Ben-Tzvi, O.; Warner, R.R. Elevated levels of trace elements in cores of otoliths and their potential for use as natural tags. Mar. Ecol. Prog. Ser. 2005, 297, 273–281. [Google Scholar] [CrossRef]
  46. Macdonald, J.I.; Shelley, J.M.G.; Crook, D.A. A method for improving the estimation of natal chemical signatures in otoliths. Trans. Am. Fish. Soc. 2008, 137, 1674–1682. [Google Scholar] [CrossRef]
  47. Kaji, T.; Tanaka, M.; Oka, M.; Takeuchi, H.; Ohsumi, S.; Teruya, K.; Hirokawa, H. Growth and Morphological Development of Laboratory-Reared Yellowfin Tuna Thunnus albacares Larvae and Early Juveniles, with Special Emphasis on the Digestive System. Fish. Sci. 1999, 65, 700–707. [Google Scholar] [CrossRef]
  48. Itoh, T.; Shiina, Y.; Tsuji, S.; Endo, F.; Tezuka, N. Otolith daily increment formation in laboratory reared larval and juvenile bluefin tuna Thunnus thynnus. Fish. Sci. 2000, 66, 834–839. [Google Scholar] [CrossRef]
  49. García, A.; Cortés, D.; Ramírez, T.; Fehri-Bedoui, R.; Alemany, F.; Rodríguez, J.M.; Carpena, Á.; Álvarez, J.P. First data on growth and nucleic acid and protein content of field-captured Mediterranean bluefin (Thunnus thynnus) and albacore (Thunnus alalunga) tuna larvae: A comparative study. Sci. Mar. 2006, 70, 67–78. [Google Scholar] [CrossRef]
  50. Longhurst, A. Ecological Geography of the Sea; Academic Press: London, UK, 2007. [Google Scholar]
  51. Reygondeau, G.; Longhurst, A.; Martinez, E.; Beaugrand, G.; Antoine, D.; Maury, O. Dynamic biogeochemical provinces in the global ocean. Glob. Biogeochem. Cycles 2013, 17, 1046–1058. [Google Scholar] [CrossRef]
  52. Sturrock, A.M.; Hunter, E.; Milton, J.A.; Johnson, R.; Waring, C.P.; Trueman, C.N. Quantifying physiological influences on otolith microchemistry. Methods Ecol. Evol. 2015, 6, 806–816. [Google Scholar] [CrossRef]
  53. Reis-Santos, P.; Vasconcelos, R.P.; Tanner, S.E.; Fonseca, V.F.; Cabral, H.N.; Gillanders, B.M. Extrinsic and intrinsic factors shape the ability of using otolith chemistry to characterize estuarine environmental histories. Mar. Environ. Res. 2018, 140, 332–341. [Google Scholar] [CrossRef] [PubMed]
  54. Rooker, J.R.; Secor, D.H. Otolith Microchemistry. In The Future of Bluefin Tunas: Ecology, Fisheries Management, and Conservation; Block, B.A., Ed.; JHU Press: Baltimore, MD, USA, 2019; Volume 45. [Google Scholar]
  55. Beardsley, J.G.L. Proposed migrations of albacore, Thunnus alalunga, in the Atlantic Ocean. Trans. Am. Fish. Soc. 1969, 98, 589–598. [Google Scholar] [CrossRef]
  56. Bard, F.X. L’habitat du germon (Thunnus alalunga) en Océan Atlantique. Col. Vol. Sci. Pap. ICCAT 1982, 17, 487–490. [Google Scholar]
  57. Reglero, P.; Tittensor, D.P.; Álvarez-Berastegui, D.; Aparicio-González, A.; Worm, B. Worldwide distributions of tuna larvae: Revisiting hypotheses on environmental requirements for spawning habitats. Mar. Ecol. Prog. Ser. 2014, 501, 207–224. [Google Scholar] [CrossRef]
  58. Bard, F.X.; Stretta, J.M. Résumé des connaissances actuelles sur la biologie et la pêche des thons tropicaux en Atlantique. Arch. Sci. Cent. Rech. Océanographiques Abidj. 1981, 7, 1–37. [Google Scholar]
  59. Woodson, L.E.; Wells, B.K.; Grimes, C.B.; Franks, R.P.; Santora, J.A.; Carr, M.H. Water and otolith chemistry identify exposure of juvenile rockfish to upwelled waters in an open coastal system. Mar. Ecol. Prog. Ser. 2013, 473, 261–273. [Google Scholar] [CrossRef]
  60. Wheeler, S.; Russell, A.D.; Fehrenbacher, J.S.; Morgan, S.G. Evaluating chemical signatures in a coastal upwelling region to reconstruct water mass associations of settlement-stage rockfishes. Mar. Ecol. Prog. Ser. 2016, 550, 191–206. [Google Scholar] [CrossRef]
  61. Labonne, M.; Masski, H.; Talba, S.; Tai, I.; Manchih, K.; Chfiri, R.; Lae, R. Major population’s separation area for sardine (Sardina pilchardus) and hake (Merluccius merluccius) revealed using otolith geochemistry on the Atlantic coast of Morocco. Fish. Res. 2022, 254, 10641. [Google Scholar] [CrossRef]
  62. IOTC. Indian Ocean albacore stock: Review of its fishery, biological data and results of its 2014 stock assessment. In Proceedings of the Indian Ocean Tuna Conservation, Shanghai, China, 18–21 July 2016. IOTC–2016–WPTmT06–09. [Google Scholar]
  63. IOTC. Spatiotemporal Distribution of Albacore in Relation to Oceanographic Variables in the Indian Ocean. IOTC-2019-WPTmT07-INF03. Available online: https://iotc.org/meetings/7th-working-party-temperate-tuna-wptmt-data-preparatory-meeting (accessed on 3 December 2023).
  64. Kamykowski, D.; Zentara, S.J.; Morrison, J.M.; Switzer, A.C. Dynamic global patterns of nitrate, phosphate, silicate, and iron availability and phytoplankton community composition from remote sensing data. Glob. Biogeochem. Cycles 2002, 16, 1077. [Google Scholar] [CrossRef]
  65. Barrett, P.M.; Resing, J.A.; Grand, M.M.; Measures, C.I.; Landing, W.M. Trace element composition of suspended particulate matter along three meridional CLIVAR sections in the Indian and Southern Oceans: Impact of scavenging on Al distributions. Chem. Geol. 2018, 502, 15–28. [Google Scholar] [CrossRef]
  66. Le Gall, J.Y. Expose Synoptique des Données Biologiques sur le Germon Thunnus alalunga (Bonaterre, 1788) de l’Ocean Atlantique (No. 109); Organisation des Nations Unies pour l’Alimentation et l’Agriculture, FAO: Rome, Italy, 1974; Volume 109, 70p. [Google Scholar]
  67. Coimbra, M.R.M. Proposed mouvements of albacore, Thunnus alalunga in south atlantic Ocean. SCRS/1998/040 Col. Vol. Sci. Pap. ICCAT 1999, 49, 97–136. [Google Scholar]
  68. Travassos, P. Anomalies thermiques et peche du germon (Thunnus alalunga) dans l’Atlantique tropical sud est. SCRS/1998/107 Col. Vol. Sci. Pap. ICCAT 1999, 49, 324–338. [Google Scholar]
  69. Lebeau, A. Etude de la biologie du germon de l’océan indien. Sci. Pêche 1971, 204, 1–10. [Google Scholar]
  70. Alonso, C.; Arrizabalaga, H.; Restrepo, V.R. Contribution of a chapter on Albacore Tuna for the revised ICCAT field manual. Col. Vol. Sci. Pap. ICCAT 2005, 58, 1646–1661. [Google Scholar]
Figure 1. Sampling locations, referred to as South Africa (SA-N—South Africa North: Saldanha Bay; SA-S—South Africa South: Hout Bay) and southwest Indian Ocean (SWI, La Réunion Island). Size of circles is proportional to the number of samples collected in each location.
Fishes 09 00038 g001
Figure 2. Otolith of a 3-year-old juvenile of albacore tuna (Thunnus alalunga) after sectioning and polishing for chemical analysis using LA-ICP-MS (along the transect indicated in black). The ‘nursery’ signature corresponding to early juvenile life is defined by the part of the transect located at 1400–1600 µm from the primordium.
Fishes 09 00038 g002
Figure 3. PCA plots of individual (fish) and variable (chemical elements) projection on the first plane of the PCA (60%) made with the otolith edge signatures. Individuals are coded by their sampling region (SA-N South Africa North; SA-S South Africa South; and SWI Southwest Indian Ocean—3 sampling events together). For the variables, the length of the arrow reflects the % of contribution to the total inertia.
Fishes 09 00038 g003
Figure 4. Elemental signatures from otolith edges by sampling site (black dots) for the 72 albacore tuna analysed, and corresponding boxplots. For each element, the median value is represented in the boxplot and letters indicate groups with significantly distinct signatures (p < 0.05). Individuals are coded by their sampling region (SA-N South Africa North; SA-S South Africa South; and SWI Southwest Indian Ocean—3 sampling events together).
Fishes 09 00038 g004
Figure 5. Variation in the near-primordium otolith multi-elemental signatures representing the water masses inhabited by the 72 albacore tunas investigated during their first weeks of life. Projections on the first plane of the PCA for (a) all individuals (fish) and variables (chemical elements) and (b) all individuals (fish) coded according to the groups of distinct signatures identified by the hierarchical clustering. In (a), the length of the arrow for each chemical element reflects its % of contribution to the total inertia. In (b), the colours represent the groups of fish with distinct near-primordium signatures (in B, Zn, P, and Sr). Detailed information on fish sampling event (symbols) and natal origin based on clustering (colours) is indicated in the legend.
Fishes 09 00038 g005
Figure 6. Elemental signatures from otolith primordium by putative spawning site (1,2) (black dots) for the 72 albacore tunas analysed, and corresponding boxplots. The potential spawning sites are based on hierarchical clustering analyses on the signatures in these four elements. For each element, the median value is represented in the boxplot and letters indicate groups with significantly distinct signatures (p < 0.05). For P, significant distinct signatures at p < 0.1.
Fishes 09 00038 g006
Figure 7. Variation in the nurseries’ otolith multi-elemental signatures representing the water masses inhabited by the 72 albacore tunas investigated during early life stages. Projections on the first plan of the PCA for (a) all individuals (fish) and variables (chemical elements) and (b) all individuals (fish) coded according to the groups of distinct signatures identified by the hierarchical clustering. On (a), the length of the arrow for each chemical element reflects its % of contribution to the total inertia. On (b), the colours represent the groups of fish with distinct nursery signatures (in B, P, Sr, and Ba). Detailed information on fish sampling events (symbols) and nurseries based on clustering (colours) is indicated in the legend.
Fishes 09 00038 g007
Figure 8. Elemental signatures from the “nursery zone” (1,2,3) of the otoliths by nursery environments (black dots) for the 72 albacore tunas analysed, and corresponding boxplots. The nursery zones are based on hierarchical clustering analyses on the signatures in these four elements. For each element, the median value is represented in the boxplot and letters indicate groups with significantly distinct signatures (p < 0.05).
Fishes 09 00038 g008
Figure 9. Conceptual model for different lifetime migration patterns and connectivity between sampling zones, and different life stages and oceans for the 72 albacore tuna captured in this study based on their lifetime otolith multi-elemental signatures. All the numbers are in % and the total of each box totals 100%. In the lower part of the chart, the upper row represents the contribution of each nursery to the total number of fish captured in each sampling event, and the lower one represents the lifetime strategies, i.e., the spawning origins within each nursery contribution (brick pattern = N1, diamond = N2, lines = N3, light grey= SpO-1, dark grey = SpO-2; where N refers to nursery and SpO to spawning origin).
Fishes 09 00038 g009
Table 1. Number, sampling period, size range in fork length (FL), and estimated ages of fish for each of the five sampling events. * Age ranges are calculated using a sex-combined growth curve (Xu et al., 2014 [37]).
LocationNSampling DatesFL Range (cm)* Estimated Age Range (years)
southwest Indian Ocean (SWI-Feb 18)13February 201896–1047–10
southwest Indian Ocean (SWI-May 18)13May 201898–1137–15+
southwest Indian Ocean (SWI-Dec 18)20December 201896–1167–15+
South Africa—Hout Bay (SA-S)13March–April 201863–852–5
South Africa—Saldanha Bay (SA-N)13March–April 201863–852–5
Table 2. Relative contribution (%) of each spawning origin (SpO) to the total number of albacore tunas collected for each of the 5 sampling events in the Atlantic and Indian Oceans (total number of fish tested = 72, FL = 63–116 cm). “-” indicates the percentage is null.
SA-NSA-STotal SASWI-FebSWI
SWI-May
SWI-DecTotal SWITotal All Samples
SpO-183%15%46%85%8%-28%35%
SpO-217%85%54%15%92%100%72%65%
Total100%100%100%100%100%100%100%100%
Table 3. Relative contribution (%) of each nursery to the total number of albacore tunas collected for each of the 5 sampling events in the Atlantic and Indian Oceans (total number of fish tested = 72, FL = 63–116 cm). “-” indicates the percentage is null.
SA-NSA-STotal SASWI-FebSWI
SWI-May
SWI-DecTotal SWITotal All Samples
Nursery 177%23%50%38%8%10%17%30%
Nursery 215%38%27%62%70%40%54%44%
Nursery 38%39%23%-22%50%29%26%
Total100%100%100%100%100%100%100%100%
Table 4. Relative contribution (%) of each spawning origin to the total number of albacore tuna assigned in each nursery (total number of fish tested = 72, FL = 63–116 cm). “-” indicates the percentage is null.
Spawning Origin Nursery 1Nursery 2Nursery 3
SpO-176%28%-
SpO-224%72%100%
Total100%100%100%
Table 5. Relative contribution (%) of each of the 6 potential migration strategies to the total number of albacore tuna collected (total number of fish tested = 72, FL = 63–116 cm), for each of the 5 sampling events in the Atlantic and Indian Oceans.”-” indicates the percentage is null.
Spawning NurseryMigration Strategy Total SWI TotalTotal
Origin SA-NSA-SSASWI-FebSWI-MaySWI-DecSWIAll Samples
N1 1-SpO1-N170%7%38%38%8%-13%22%
SpO-1N22-SpO1-N27%7%8%47%8%-13%12%
N33-SpO1-N3--------
N14-SpO2-N17%15%11%--10%3%7%
SpO-2N25-SpO2-N28%31%19%15%62%40%43%32%
N36-SpO2-N38%38%23%-22%50%28%26%
Total 100%100%100%100%100%100%100%100%
Disclaimer/Publisher’s Note: The statements, opinions and data contained in all publications are solely those of the individual author(s) and contributor(s) and not of MDPI and/or the editor(s). MDPI and/or the editor(s) disclaim responsibility for any injury to people or property resulting from any ideas, methods, instructions or products referred to in the content.

