1. Introduction
The interior and exterior surfaces of vertebrates host a complex and diverse array of microorganisms known as the microbiome. The microbial organisms that make up the microbiome can include bacteria, fungi, protozoans, viruses, and multi-cellular parasites. The vertebrate bacterial microbiome has been a flourishing area of research, as microbial communities are thought to have putative roles in host immunity [
1], nutrient cycling [
2], and host growth and development [
3]. Thus, characterization of site/tissue-specific microbial communities can not only lead to a better understanding of host health but also a better understanding of how an animal’s interaction with its environment can shape the stability or composition of the microbiome.
The symbiotic relationships between a host and its microbiome are complicated and are likely influenced by both host-specific characteristics and environment-driven characteristics. For example, in transcolonization studies of gut microbiomes between mice (CONV-R Swiss-Webster) and Zebrafish (
Danio rerio), the abundances of bacterial lineages after inoculation and establishment were not substantially different from individuals inoculated with intestinal samples from conspecifics (i.e., mouse to mouse, or zebrafish to zebrafish), suggesting that the host exerts some selective pressure in guiding introduced bacterial communities towards a host-specific microbial state [
4]. By contrast, microbial communities of certain host tissues can change seasonally or across development [
5,
6], suggesting that external environmental factors play a key role in shaping microbial communities. In Pacific Chub Mackerel (
Scomber japonicus), skin and gill microbiome diversity was influenced by changes in environmental factors such as chlorophyll a concentrations (i.e., a measure of primary productivity) and temperature when animals were sampled across an entire year at the same geographic location [
7]. Thus, specific environmental conditions could have downstream influences on bacterial lineages by favoring certain species/phyla over others for that specific temperature profile, which may then, in turn, influence the microbiome communities of animals that use those habitats.
Bacterial communities have been shown to be tissue/site-specific within the same host, although there is evidence that microbiomes may be associated or connected across tissue types within individuals [
8]. Tissue-specific microbiomes may be influenced by inherent differences to which epithelial tissues are exposed to environmental conditions. For example, in fishes, skin and gill mucus membranes are constantly exposed to the surrounding aquatic environment they inhabit; thus, the microbes that are able to colonize on these surfaces may be limited to those that freely exist in the water column or in sediment. For example, microbial diversity was lower in skin swabs taken from White Sharks (
Carcharodon carcharias) where corresponding water samples had lower diversity than from animals sampled at other locations where water diversity was higher [
9]. By contrast, microbial inputs experienced by the gut epithelium may be restricted to what is ingested or influenced by the composition of nutritional substrates [
7]. In Rainbow Trout (
Oncorhynchus mykiss), the gut microbiome of fry diverged after their first feed with either marine- or plant-based diets, suggesting that diet has an influence on microbiome composition [
10].
While a number of factors likely influence microbial communities, sympatric species may offer a platform to investigate whether differences in species ecology or physiology are more important drivers of a species’ microbiome, given environmental variables, such as temperature, productivity, and salinity, would be fairly uniform across or between species sampled from the same location. In ponds with several co-occurring species of frogs, the skin microbiomes of tadpoles were significantly different, with host species as the significant factor distinguishing them [
11], suggesting that species-specific traits, whether ecological, physiological, or anatomical, had an important influence on the development of microbial communities. In other studies of co-occurring fishes, diet category or trophic level were found to significantly separate the gill microbiome across fish assemblages sampled from similar environments [
8]. Thus, underlying ecological factors that enable species to co-exist (e.g., niche partitioning) may also enable or lead to species-specific microbiome assemblages.
The coastal estuaries of Georgia, USA, support a number of co-occurring elasmobranch species (i.e., sharks, skates, and rays). Several species are commonly caught together in the commercial shrimp fishery that employs bottom trawl nets [
12,
13]. Nevertheless, these species exhibit a gradient in their reliance on benthic habitats and/or have variable diets that could result in species-specific microbiomes. For example, the Bluntnose Stingray (
Hypanus say) and Atlantic Stingray (
Hypanus sabinus) are the most benthic-reliant as they bury in sediment and feed on benthic fauna (e.g., crustaceans, polychaetes, and invertebrates) [
14], while the Butterfly Ray (
Gymnura altavela) rests on sediment but is known to feed on teleosts in the water column [
15] and would be considered as more benthic-associated than reliant. The Atlantic Sharpnose Shark (
Rhizoprionodon terraenovae; herein “Sharpnose”) is a water column-associated species that is an obligate ram ventilator (i.e., swims continuously to respire) but feeds on benthic prey (e.g., invertebrates and teleosts), although shifts in diet are known to occur over ontogeny [
16]. In addition, the dermal anatomy between sharks and rays differs substantially, as rays have a larger mucus layer covering their skin as compared to sharks, which may support different assemblages of microbial communities [
17]. Thus, the goal of this study was to examine if bacterial microbiome structure differed across co-occurring species with varying degrees of benthic association and how that might change or be influenced by tissue type (i.e., skin, gill, gut, and cloaca) and diet, as inferred from stable isotope analysis (SIA). We had several predictions based on known aspects of these species’ ecology and behavior for how similar (or different) their microbiomes may align. First, we predicted that all ray species would have a similar skin and gill microbiome since these tissues are in relatively close contact with the sediment and that the shark would be distinct from the three ray species as an obligate ram ventilator (i.e., constant swimmer that does not rest on the benthos). Second, we predicted gut and cloacal microbiomes to be distinguishable by feeding ecology, such that Bluntnose Stingrays, Atlantic Stingrays, and Sharpnose would have similar microbiomes as they all feed benthically, and would be distinct from that of the Butterfly Ray, which feeds on water column-associated prey. With these contrasting characteristics, this study investigated the strength by which these ecologically-related factors may influence bacterial microbiome structure in an important group of sympatric mesopredators.
3. Results
3.1. Sample Collection
Microbiome samples were collected from skin, gill, and cloaca from thirty-eight specimens across the four target species (
Table 1). In most cases (
n = 25, 65%), an associated muscle sample accompanied specimens that were also swabbed for microbiome analysis. However, there were instances where only a spiral valve and muscle sample (
n = 12) or only a muscle sample with no associated microbiome swabs (
n = 3) was taken. For all species, both male and female specimens were sampled generally across age classes, except Sharpnose, where only young-of-year were obtained.
3.2. Stable Isotope Analysis
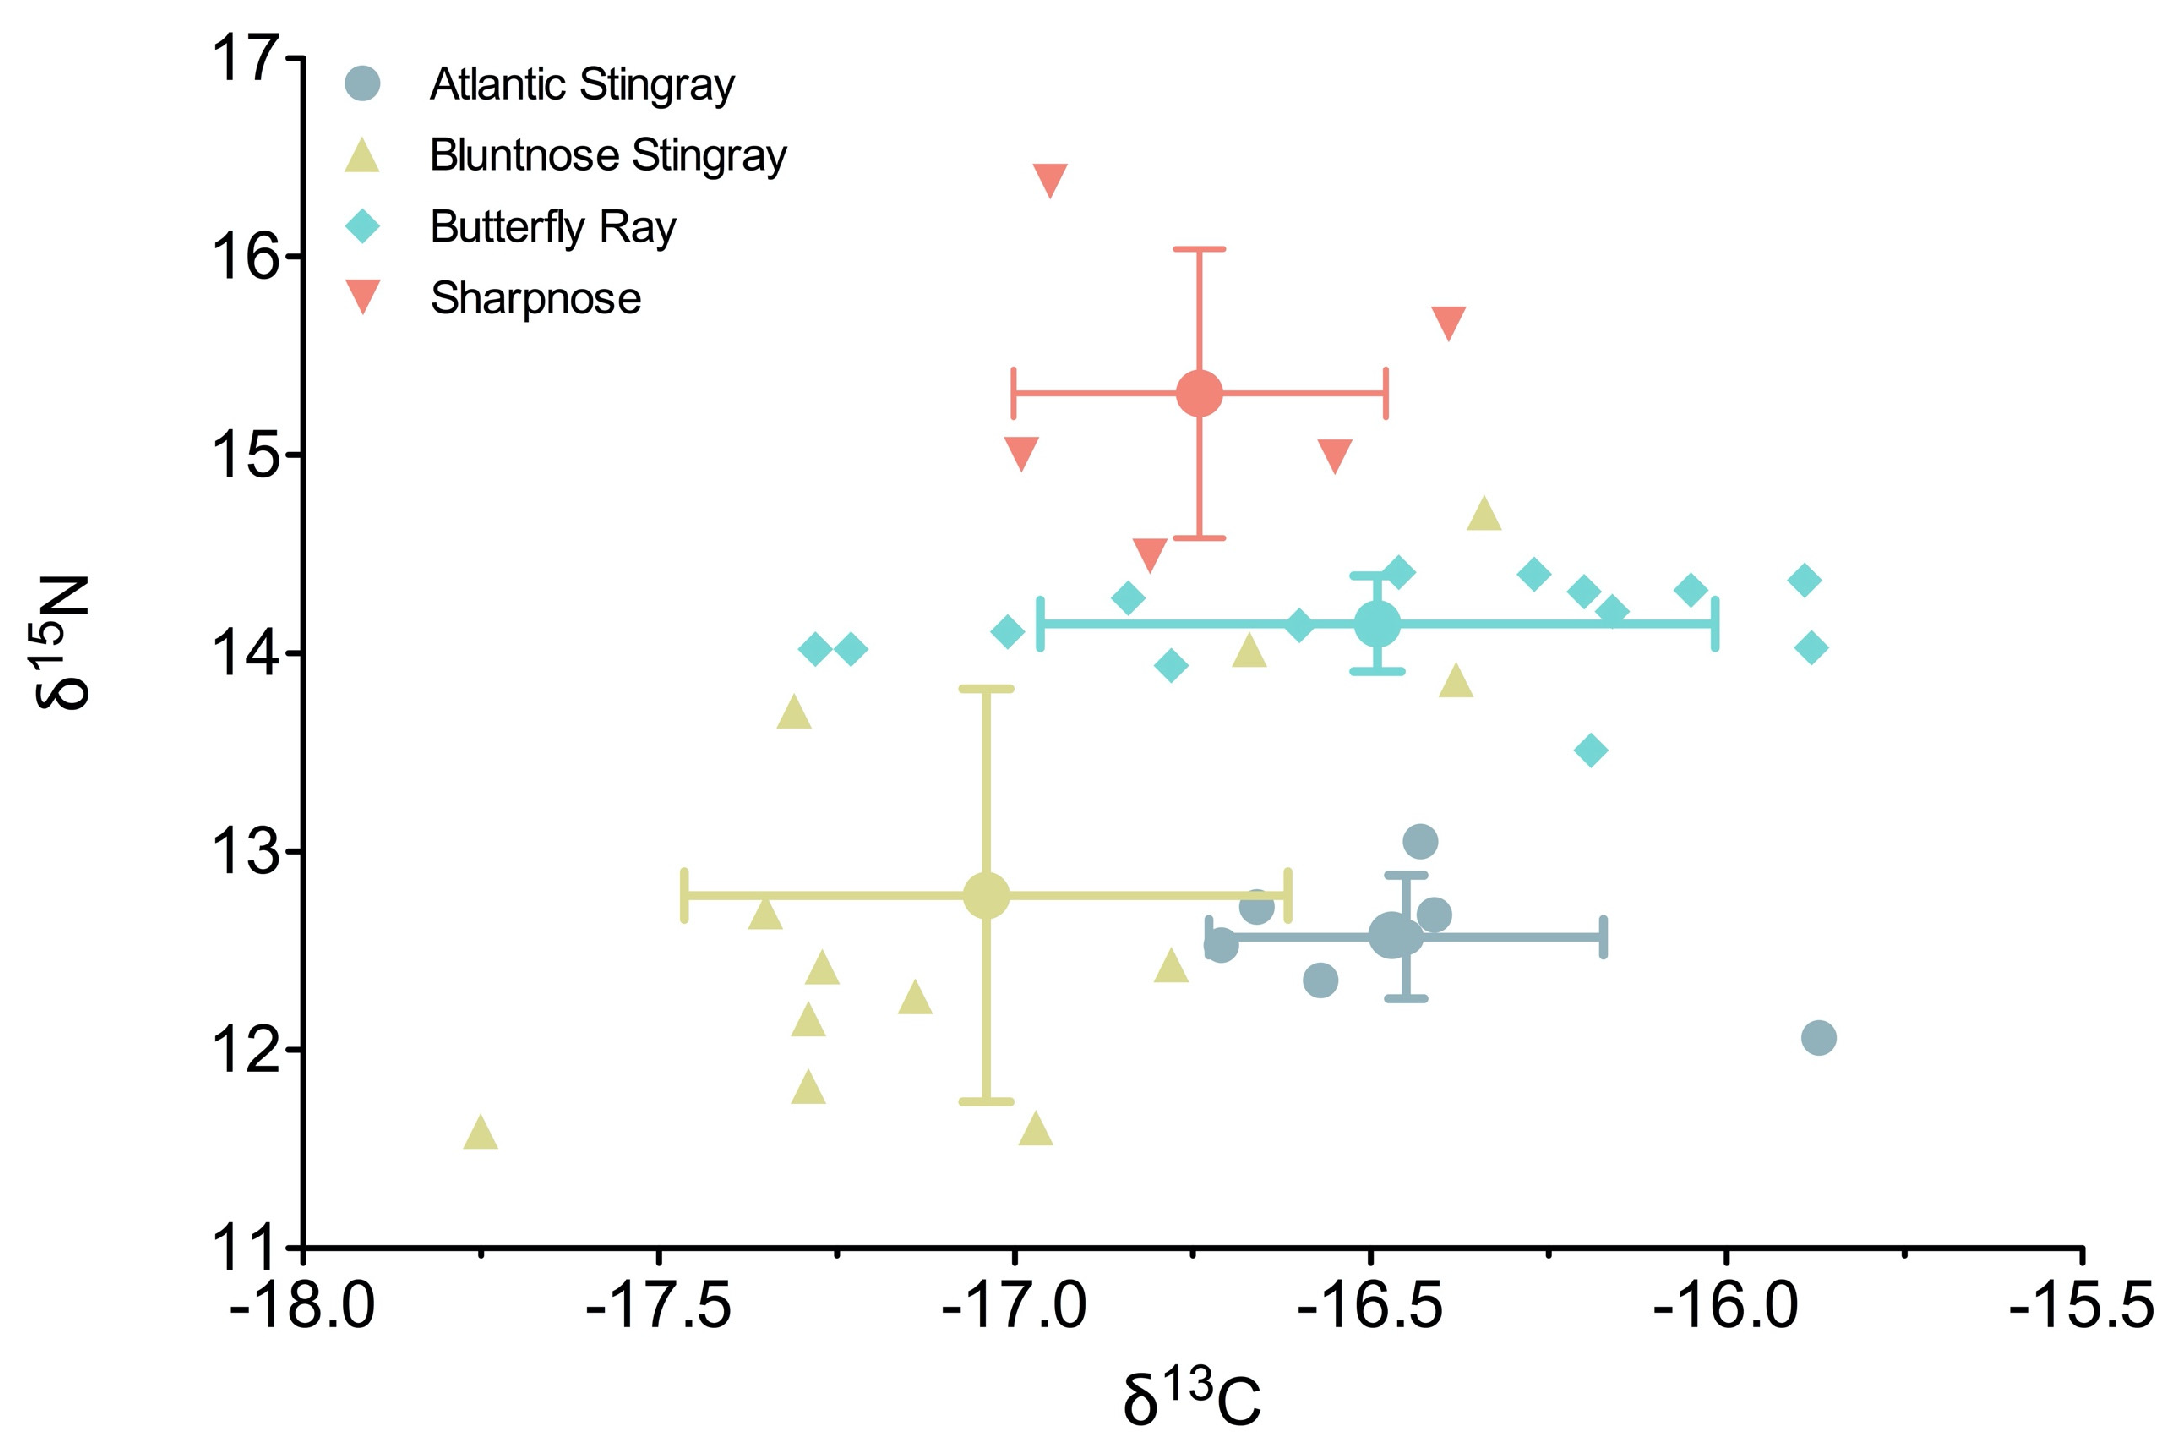
Stable isotope composition was more variable among elasmobranchs for nitrogen than carbon (
Figure 1). Δ
15N varied by 4.8 ‰, ranging from 11.6‰ (Bluntnose Stingray) to 16.4‰ (Sharpnose), whereas δ
13C varied by 1.87‰ from −17.75‰ (Bluntnose Stingray) to −15.87‰ (Atlantic Stingray) (
Supplemental Table S1). Fish species had a significant effect on δ
15N values (ANOVA, F
3,34 = 25.26,
p < 0.0001), where all species were significantly different from each other except Bluntnose and Atlantic Stingrays (Tukey HSD,
p = 0.9). Sharpnose had the highest δ
15N values of any of the species (mean ± SD: 15.3 ± 0.73‰), followed by the Butterfly Ray, which had the highest δ
15N among the rays and was least variable of any of the species (14.1 ± 0.24‰). Within-species variability was highest in the Bluntnose Stingray, with values ranging from 11.6‰ to 14.7‰.
Similar to nitrogen, species had a significant effect on δ 13C values (ANOVA, F3,34 = 5.04, p = 0.005). Unlike δ15N, Atlantic and Bluntnose stingrays were significantly different from each other (p = 0.02) at each end of the carbon value spectrum across species, with the former more enriched in carbon (−16.4 ± 0.28‰) and the latter least enriched (−17.0 ± 0.45‰). Butterfly rays and Sharpnose had intermediate δ 13C values, with Sharpnose not being different from any of the rays (p > 0.5), while Butterfly rays were significantly enriched in carbon compared to Bluntnose stingrays (p = 0.007) and were closer in value to Atlantic stingrays (p = 0.9).
3.3. Illumina Sequencing and ASV Identification
Over 14,300,248 reads passed DADA2 filtering and after the removal of contaminants through the decontam R package, a total of 12,238,620 reads were remaining. Filtered and decontaminant-free sequences fell within 27,171 ASVs; however, after the removal of rare taxa (<20 reads), 9553 ASVs remained.
3.4. Alpha Diversity
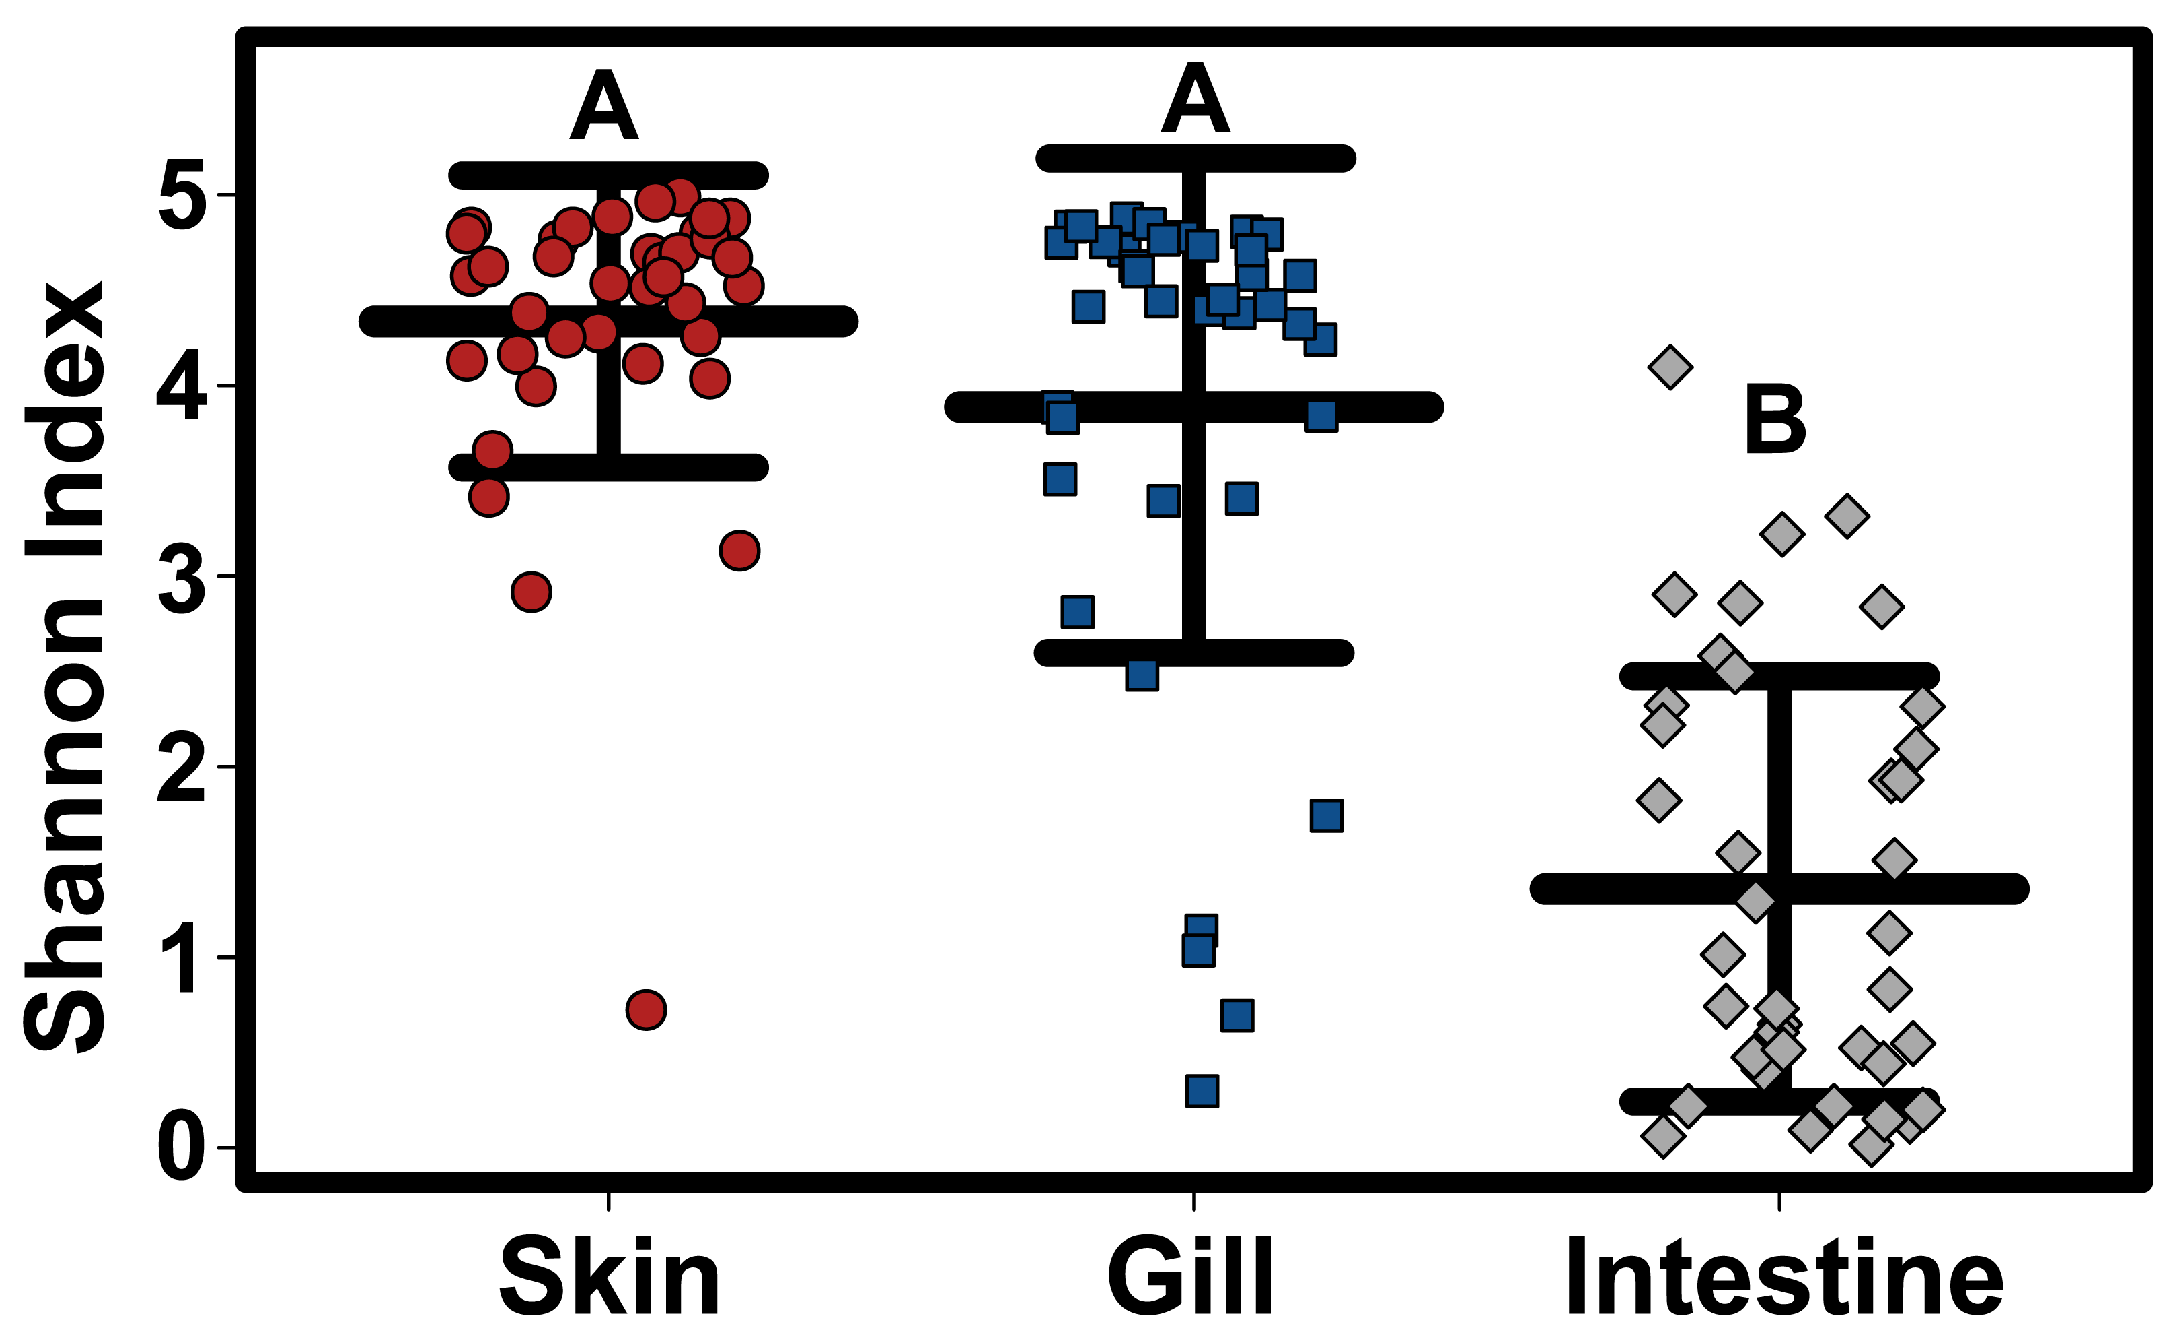
Alpha diversity (Simpson diversity index) varied significantly amongst tissue types, with intestinal samples having a significantly lower alpha diversity than both skin and gill samples (Kruskal–Wallis test
p < 0.0001) (
Figure 2). Although there was no significant difference in Alpha diversity among host species when considering all tissue types together, skin samples alone showed significant differences in alpha diversity, with lower alpha diversity in Sharpnose compared to both Atlantic and Bluntnose stingrays; and lower alpha diversity in Butterfly rays compared to Bluntnose stingrays.
3.5. Beta Diversity
Adonis multivariate analysis performed on Bray–Curtis distances showed that microbial community composition varied based on tissue type (r
2 = 0.314,
p < 0.001) but not by species (r
2 = 0.0307,
p = 0.093) when both factors were tested together. A test for the homogeneity of variance was significant for tissue type (PERMDISP2:
p = 0.006), indicating that differences in bacterial communities could be due to differences in within-group dispersions instead of variation in centroid position (
Supplemental Figure S1). It is possible that significant differences in bacterial community composition amongst tissue types are partially a result of high within-group variation. Hierarchical Clustering utilizing Bray–Curtis distances based on tissue type further iterates high within-group variation.
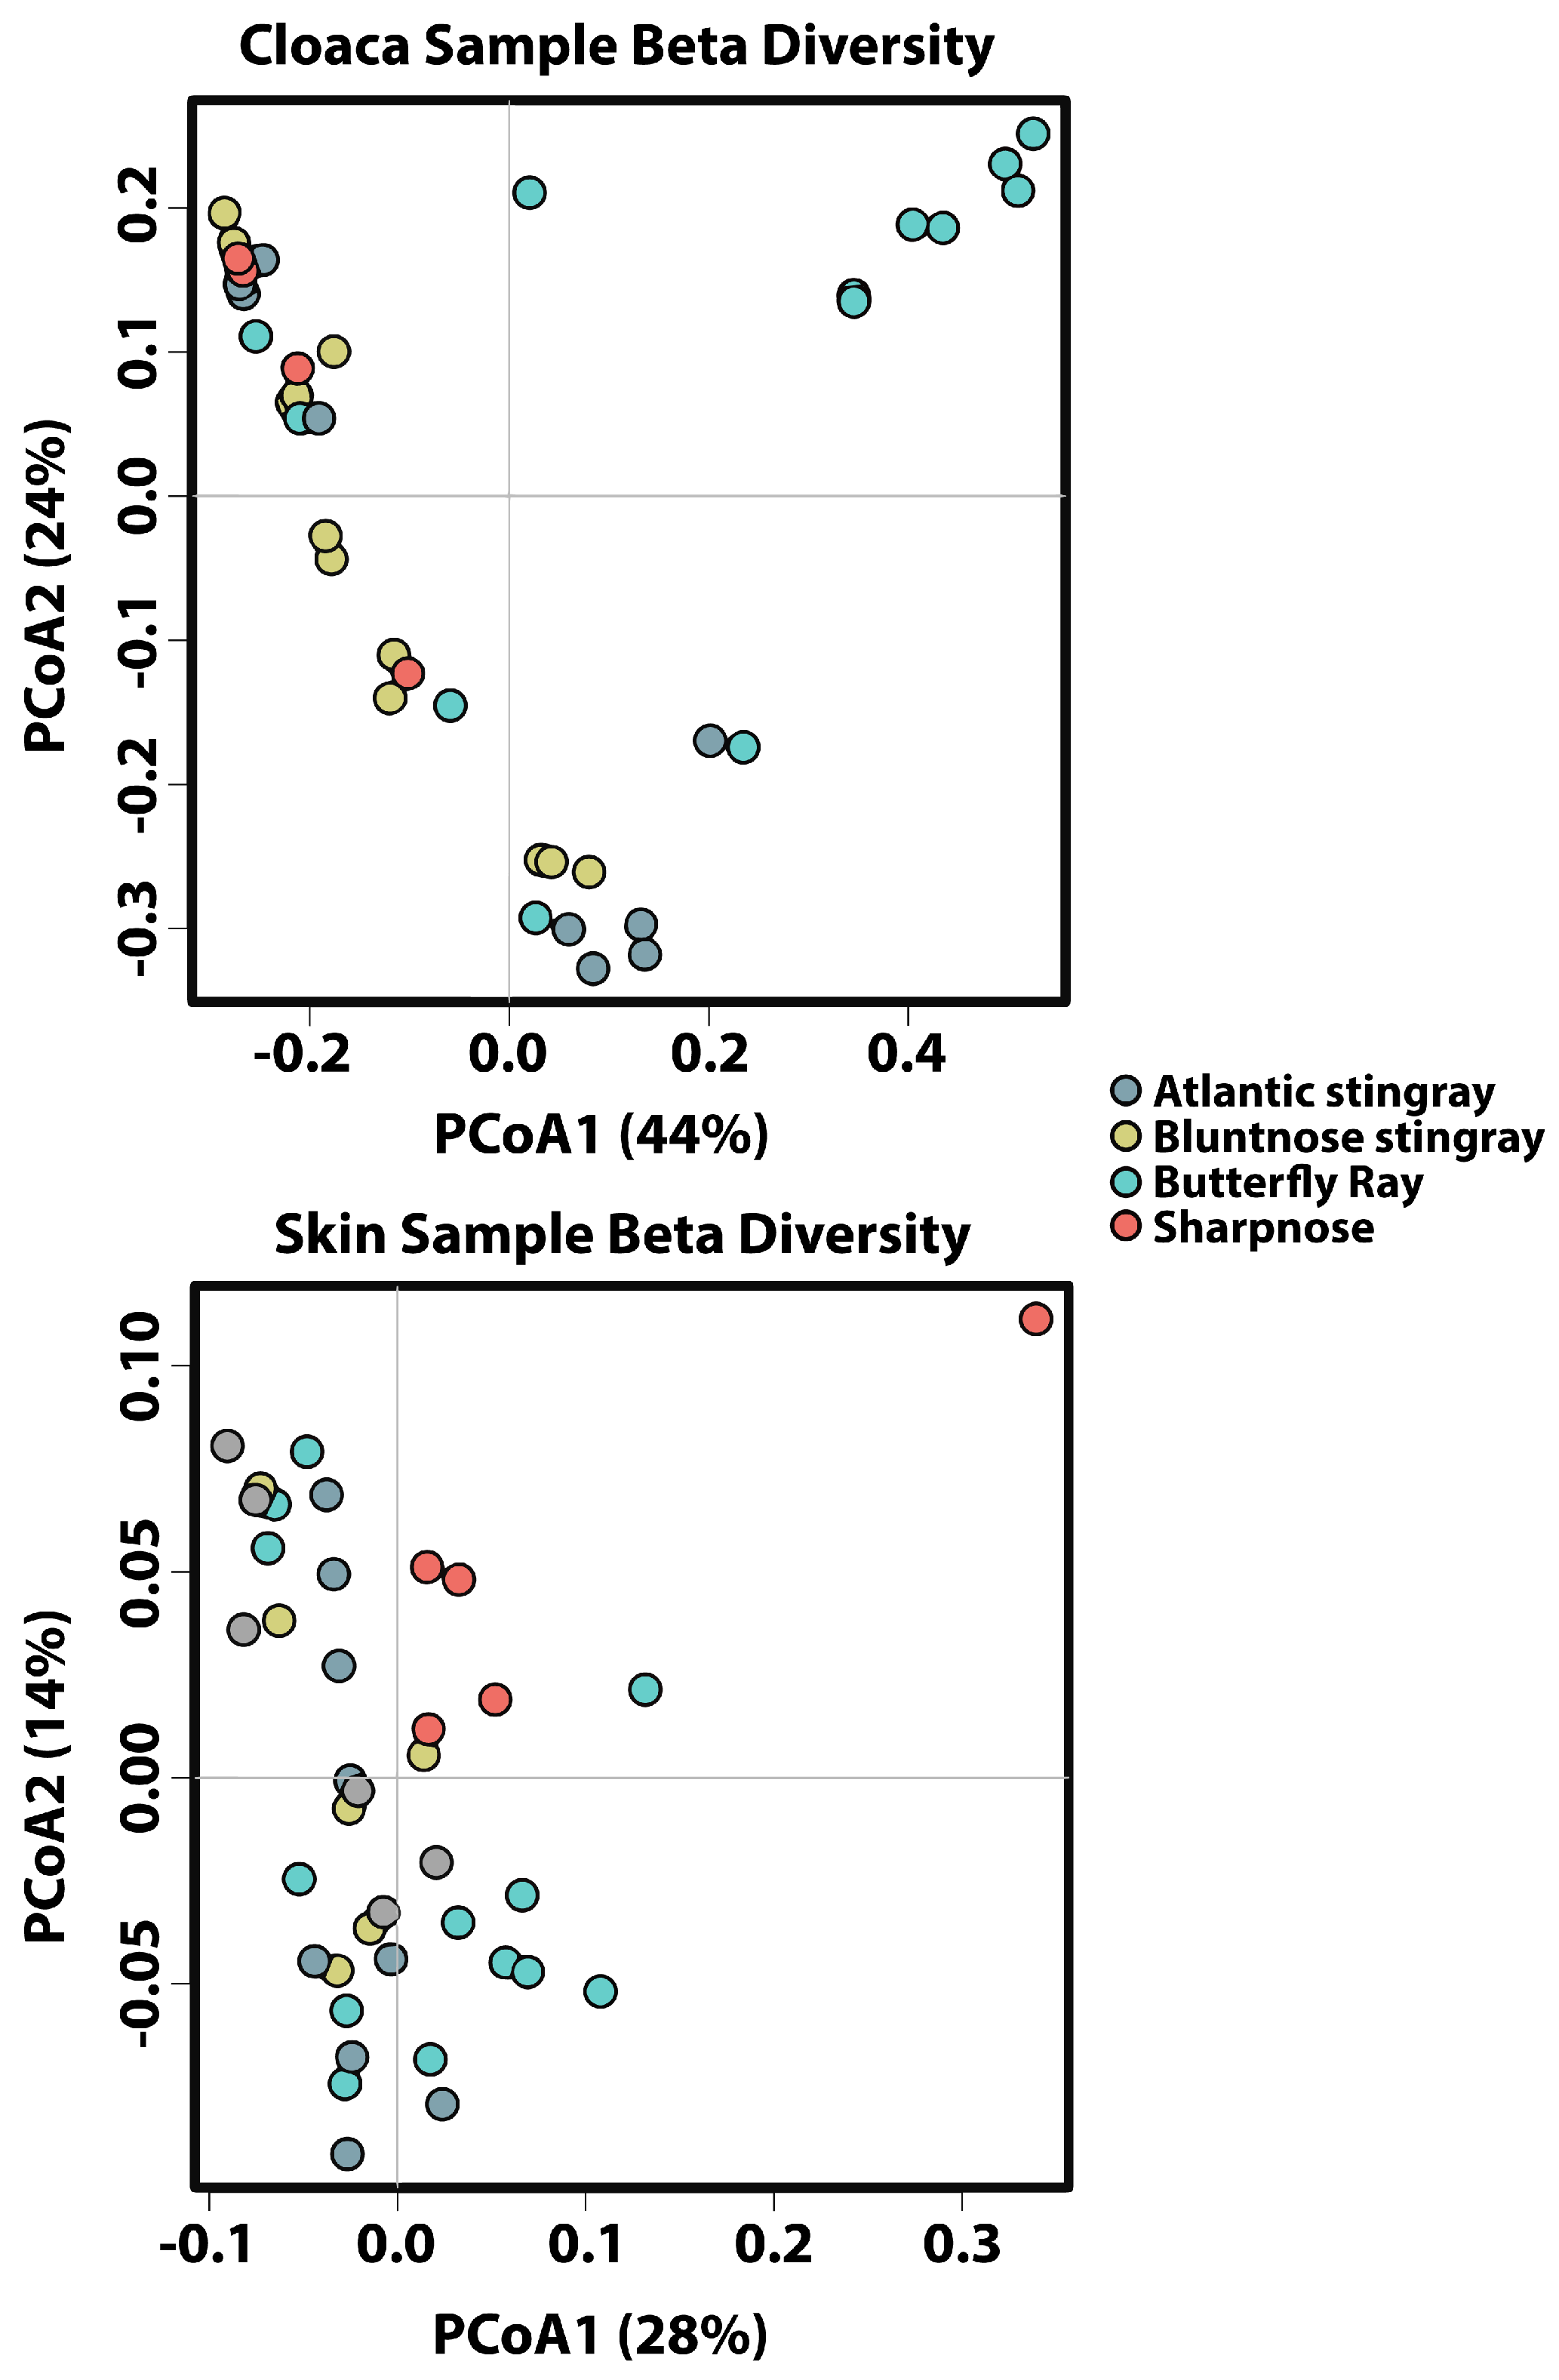
Due to high dispersion with both factors combined, the effect of species was re-examined within each tissue type individually using Adonis multivariate analysis performed on Bray–Curtis distances. For gill and gut, species identity had no effect on microbial community composition (r
2 = 0.125,
p = 0.071 and r
2 = 0.0823,
p = 0.385, respectively), while cloaca and skin were significantly different among species (r
2 = 0.242,
p < 0.001 and r
2 = 0.158,
p < 0.005) (
Figure 3). For cloaca, the Butterfly Ray microbial community was significantly different from all other species, with Proteobacteria being lower in abundance when compared to all other hosts, Tenericutes being higher in abundance compared to all other hosts, and Cyanobacteria being lower in abundance when compared to Bluntnose stingrays. For skin, the Sharpnose microbial community was significantly different from the other host species, with Proteobacteria being higher in abundance when compared to the Atlantic and Bluntnose Stingrays, and Lentisphaerae being lower in abundance when compared to all other host species.
3.6. Network Analysis
Within species, Adonis multivariate analysis showed no significant differences between skin and gills on both the phylum (r2 = 0.0247, p = 0.12) and ASV level (r2 = 0.0236, p = 0.0846), but a significant difference between gut and cloaca (Phylum: r2 = 0.0577, p =0.003; ASV: r2 = 0.0741, p = 0.0003). However, a PERMDISP2 test was highly significant (p = 0.000496) indicating that the difference in bacterial communities is likely due to differences in within-group dispersion instead of actual variation across the sample types. Combined with the low difference in explained variance based on grouping (i.e., 7%), we determined that gut and cloaca were likely not different and proceeded with two groupings for the network analysis: internal (gut and cloaca) and external (skin and gills).
3.7. Network Metrics
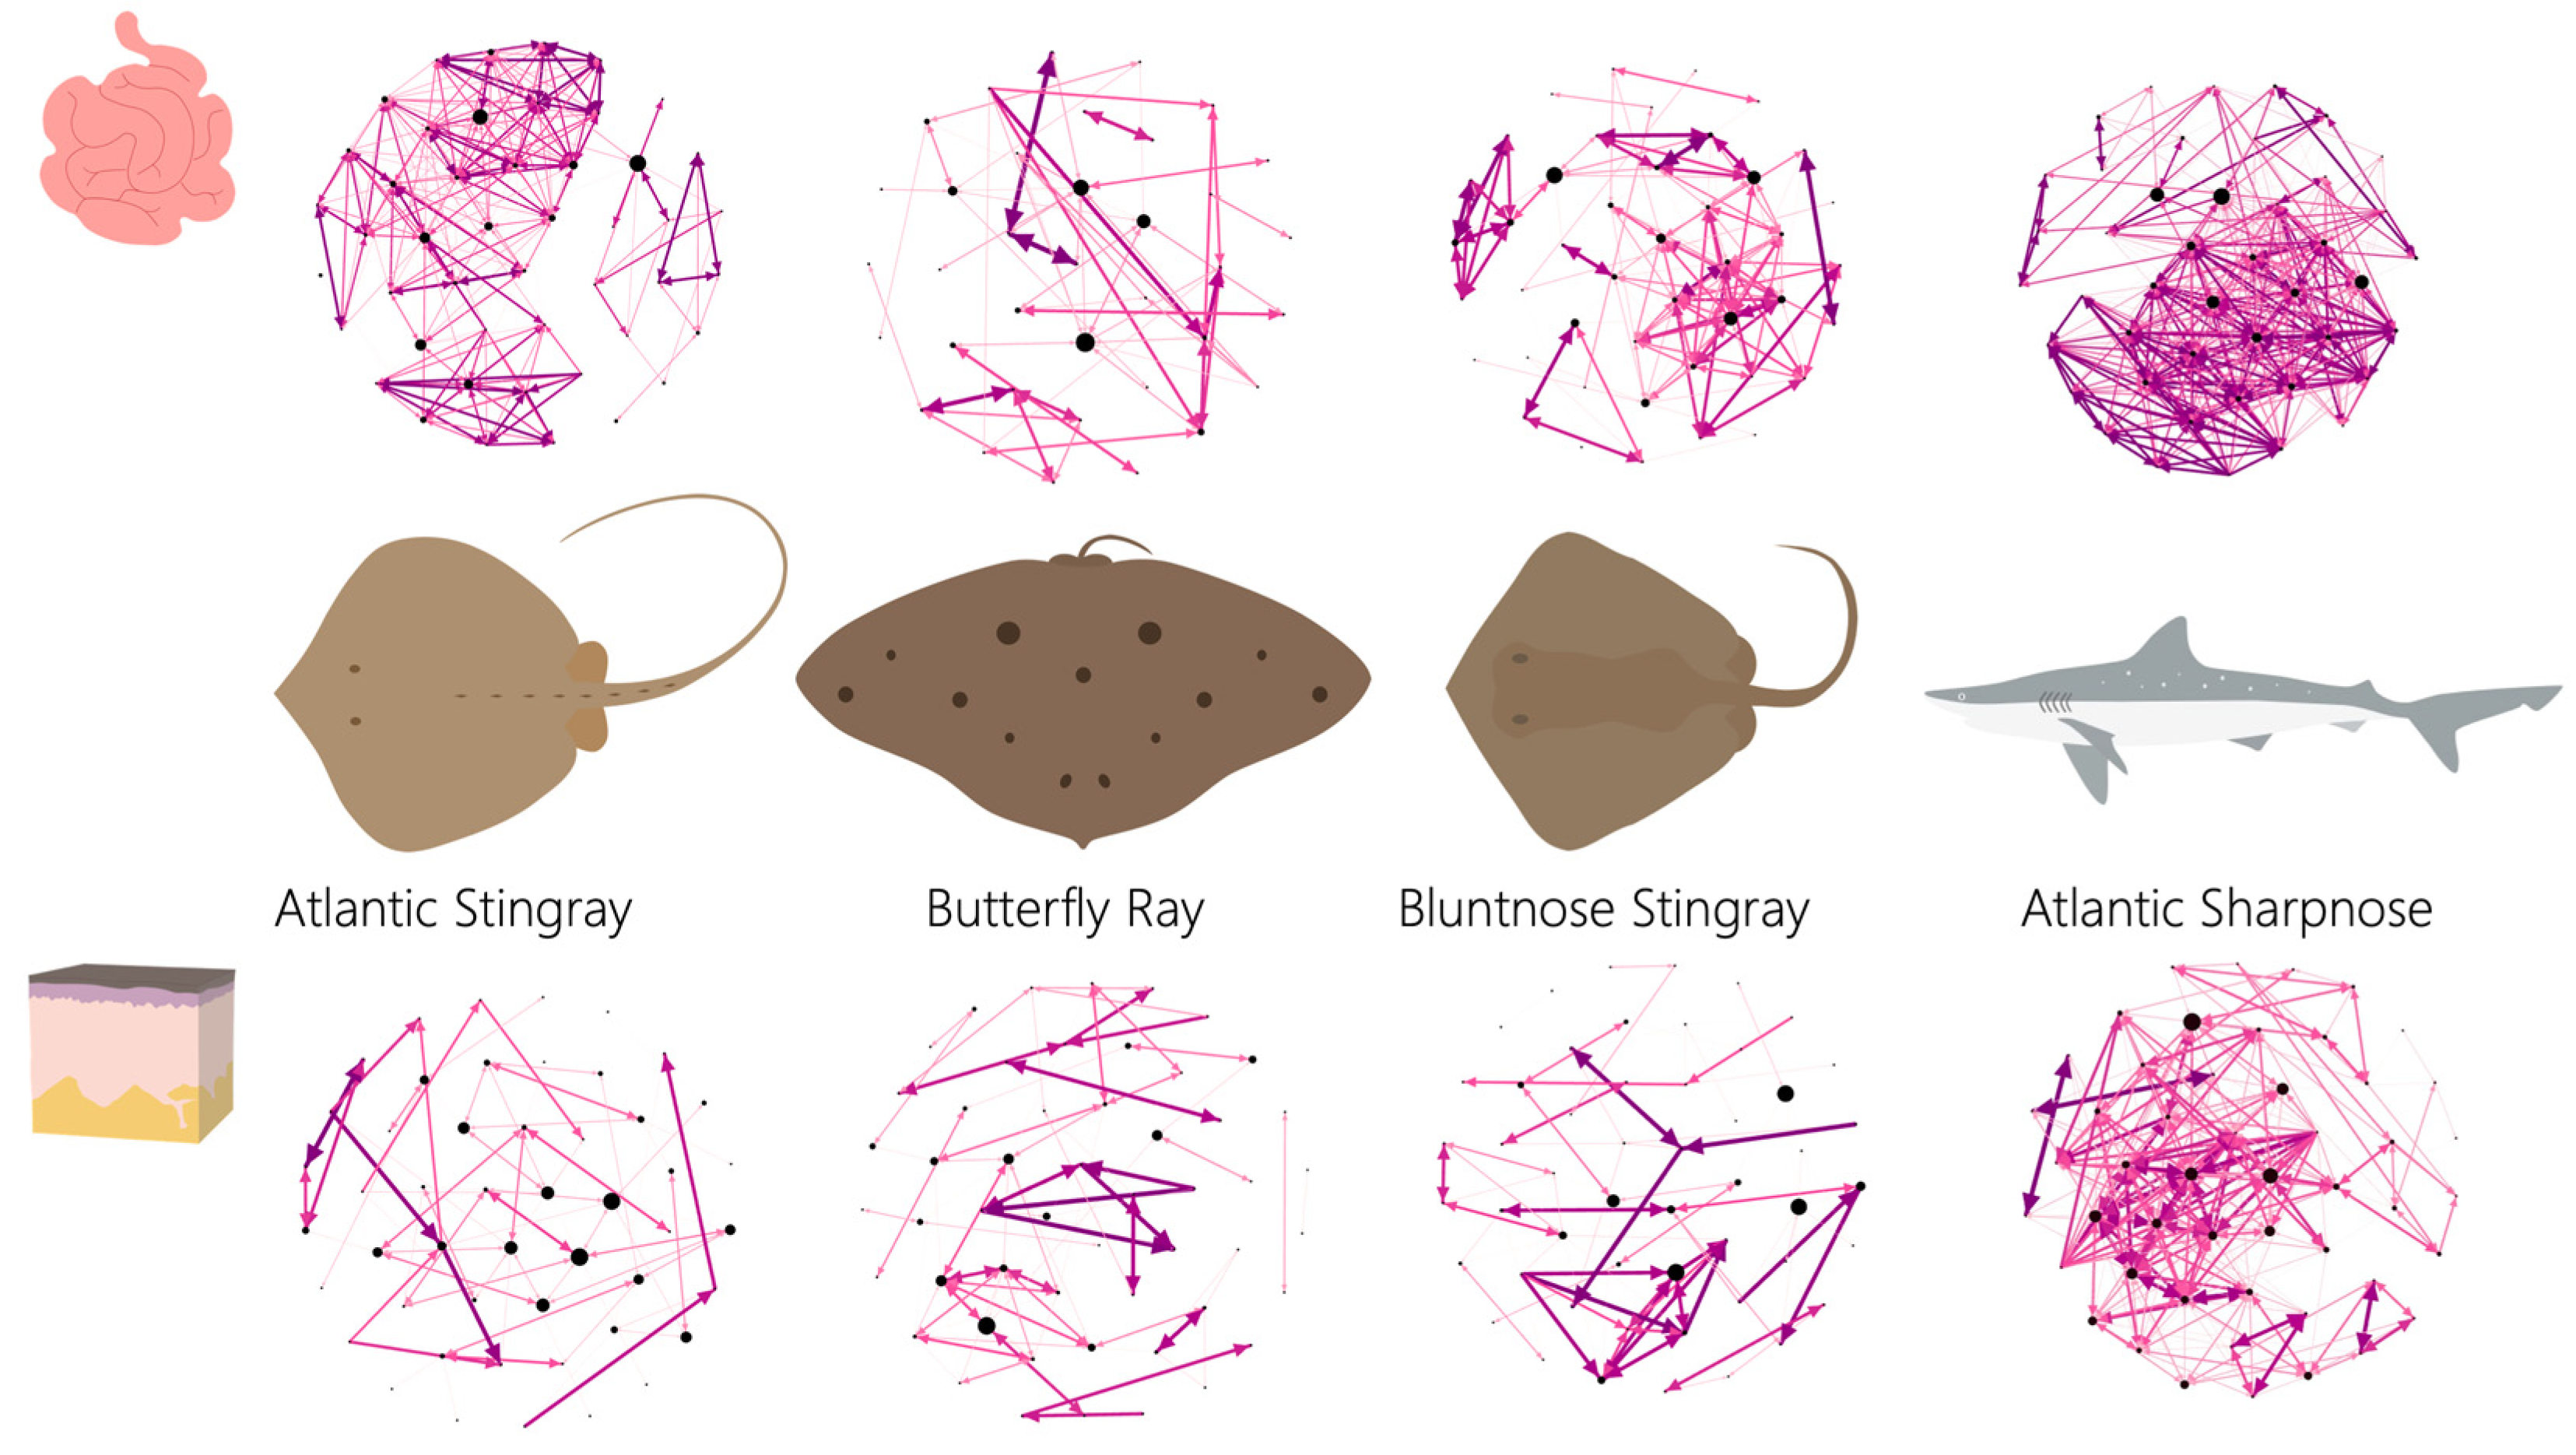
Network metrics were variable across host species and by tissue grouping, except that the ray species generally showed trends more similar to each other than to Sharpnose (
Figure 4). For instance, all ray species had looser networks (i.e., network diameter was larger) both externally and internally compared to the shark (
Supplemental Figure S2A), which resulted in both shark networks being substantially denser (i.e., tightness of the network) than any of the ray species regardless of tissue grouping (
Supplemental Figure S2B). Across species, network density generally was higher internally than externally across species. The average weighted degree (i.e., the number of connections per node) was also variable across species (
Supplemental Figure S2C), with internal networks having more connections per node than external networks, except for the Butterfly Ray which had the same average weighted degree score internally and externally. Both shark networks had substantially more connections per node than the rays. Of the ray internal networks, the Atlantic Stingray had the most connections per node, followed by the Bluntnose ray and the Butterfly Ray, which had the fewest connections per node of all species.
3.8. Keystone Phyla
For keystone phyla (i.e., those top-ranked ten for Betweenness Centrality), networks showed substantial differences both between tissue groupings within and among species (
Supplemental Table S2). Within species, three keystone phyla (30%) were shared between external and internal networks for the Bluntnose Ray as well as the Sharpnose, while five keystone phyla (50%) were shared between networks in the Butterfly Ray and the Atlantic Stingray. However, rarely did shared keystone phyla between internal and external networks have comparable ranks in their betweenness centrality. For example, Phylum Chlamydiae was ranked second most important in the Sharpnose external network but ninth in the internal network.
Among all species and within tissue grouping (i.e., external or internal), there was very little overlap of keystone phyla between the rays and the shark, such that no phyla (0%) were shared on the external networks of all species and only one phylum (Bacteroidetes) was shared on internal networks across all species. Interestingly, all species had comparable ranks for Phylum Bacteroidetes in their internal networks (rank 4–5). Among the rays, in addition to Bacteroidetes, Phyum Gemmatimonadetes was shared on internal networks, although it had a higher ranking for Butterfly Ray (3) compared to the other two rays (ranks 6 and 7). When the shark was excluded, the rays were found to share two phyla in their external networks (Acidobacteria and Latescibacteria). Phylum Acidobacteria was ranked highly for all rays (1–3), while Latescibacteria was ranked highly for Butterfly Ray (3) and lower for Atlantic Stingray (8) and Bluntnose Ray (9).
3.9. Centrality of Phyla
Closeness centrality is a measure of how central a node (i.e., phylum) is within the network by measuring the level of connections it takes to reach all other nodes and provides an alternative way to evaluate a phylum’s “role” in a network. Phyla with higher closeness centrality are regarded as more integral to the network. Internal and external networks differed both within and among species for phyla that were central to the network. Within species, there were few shared phyla ranked in the top ten between internal and external networks (
Supplemental Table S3). Atlantic Stingray and Sharpnose had three phyla shared between their individual internal and external networks, while only one phylum was shared in the Butterfly Ray’s external and internal networks and none in the Bluntnose Stingray’s networks. Additionally, no phyla were shared across species within either internal or external networks. When only the rays were examined, no phyla were shared internally and only one phylum was shared externally (
Phylum Elusimicrobia).
Phyla that were identified to be a keystone to a network (either internally or externally) were not always found to be central to the network, and this differed across species. For the Sharpnose, a majority of phyla (70%) that were keystone also had a high degree of centrality regardless of tissue grouping, possibly reflecting the tightness of the networks for this species compared to the rays. The Atlantic Stingray had more phyla that were both keystone and central to the network externally (70%) than internally (40%). By contrast, the Butterfly Ray and Bluntnose Stingray had very few phyla that were both keystone and central to their internal networks (20% and 40%, respectively) and none externally.
4. Discussion
From a bacterial diversity perspective, tissue type had a stronger effect than host identity on microbial composition. As all samples were collected from the same general geographic area it may not be surprising that there was not a strong species-specific effect on microbial beta diversity. However, when examined from a network perspective, a different story emerged, showing that the relationships among bacterial constituents at the phyla level are not similar both within and between species for external and internal microbial communities. Network analyses more closely aligned with the stable isotope analysis results indicating that there is some degree of ecological differentiation among the four mesopredators despite co-occurring in the same geographic region. Therefore, limiting analyses to only traditional measures of diversity (i.e., presence/absence or relative abundance) excluded the relationships among bacterial groups that are likely important for shaping microbial communities.
Despite their co-occurrence, stable isotope analyses of carbon and nitrogen suggest that there is a degree of niche differentiation between the four elasmobranchs examined in this study. Nitrogen values, which can be used as a proxy for trophic position, indicated that Butterfly Rays were feeding at a higher level than the other two species of batoids. Traditional gut content analysis studies indicate that Butterfly Rays are one of the few piscivorous batoids [
15], which would corroborate our conclusions from SIA as the other two species’ diets are primarily comprised of benthic invertebrates. Sharpnose had nitrogen values that were significantly higher than any of the ray species; however, all animals sampled were young-of-year and were likely carrying the isotopic signal of their mothers [
31]. Therefore, it is difficult to interpret their values in an ecological context relative to the rays that is appropriate to their life stage. Carbon isotopes also differentiated species and suggest that the source of primary production is not the same among species, despite their co-occurrence. In particular, the more enriched carbon values in the Atlantic compared to Bluntnose Stingrays suggest that animal diets are focused on different prey species that occur at a similar trophic position. There is a strong and consistent onshore-offshore gradient in the stable carbon isotope composition of primary producers, with coastal and benthic primary producers in shallower habitats having higher baseline δ
13C values than offshore, phytoplankton-based pelagic food webs [
32]. Animals with lower δ
13C values rely more upon pelagic, phytoplankton productivity, whereas those with elevated δ
13C likely feed more in shallow, highly productive coastal food webs that include benthic primary production (i.e., kelp, macroalgae, eelgrass, etc.). Atlantic Stingrays are coastally-associated to inshore waters, which may explain their enriched δ
13C values, while Bluntnose Stingrays may feed more offshore or more heavily on bivalves that carry the pelagic phytoplankton productivity signature. Although SIA tends to provide coarse information on trophic ecology, the lack of overlap in the stable isotope composition of the three ray species suggests some clear niche differentiation, which is likely driven by differences in diet, habitat, or both.
With established differences in feeding ecology among the rays, and the presumed trophic overlap of Sharpnose, the lack of strong species-specific microbial communities was somewhat surprising. However, there are several confounding factors that limit the power of this study. For example, it is possible that the collection method (trawling) could have had a “homogenizing effect” and may have obscured species-specific signals; however, this would be assumed to only influence skin microbiome (which was found to be different across species), and network analysis also supported an actual underlying difference in microbiome structure across species. More likely, the high variability among samples could have limited our ability to detect a species-specific effect from the perspective of diversity metrics, which do not take into account the relationships between bacterial constituents. The high within-species variability may be related to the range of sizes (i.e., age classes) included in this dataset, which we were unable to explore further due to low sample numbers. Particularly in early life, the gut microbiome experiences a number of changes as an organism grows and experiences diet shifts from larvae and/or juvenile stages to adulthood in fish [
33]. Age-related changes in gill and skin microbiomes have also been found [
34]. Therefore, future studies should work to increase the number of samples of their studies to counteract the “noise” in the dataset. Likewise, we cannot exclude the possible effect of maternal–offspring transmission as all species are viviparous [
35], especially for the Sharpnose that were all young-of-year individuals when sampled in this study. Age-related changes with ontogeny would be interesting to further explore in elasmobranchs, particularly with species that undergo distinct shifts in diet with length.
Despite these limitations, when tissues were examined individually, species-specific effects on bacterial diversity measures were discernable, although they were not consistent across all tissue types. With respect to “external tissues”, it was interesting that skin demonstrated a species-specific effect while gills did not, even though both tissues would be expected to encounter the same bacteria in the water column. We had predicted that the rays would be more similar to each other, and this prediction was weakly supported in that the Sharpnose significantly differed from the rays; however, the effect was not strong due to the large within-group dispersion. While both are “external”, the specific tissue functions between the gills and skin may related to why we saw species-specific differences for one tissue (skin) but not the other (gills). While the gills play a role in respiration, they also play a number of other functions, all the while maintaining a thin barrier between a fish’s internal environment and the external world [
36]. Regardless of species identity, these pressures may have resulted in convergence on a particular microbiome community that may be more rigorously controlled than that of the skin, for example. In late-juvenile European Seabass (
Dicentrarchus labrax), gill and skin microbiomes were found to be enriched in different KEGG pathways [
34], likely related to the functionally different roles of those two mucosal membranes. By contrast, skin microbial communities may be more plastic as different species have more variation in their anatomy with respect to skin structure, mucus coatings, etc., which can enable species-specific variation to develop.
Among “internally influenced tissues”, our prediction that Butterfly Rays would be distinct from Atlantic Stingrays, Bluntnose Stingrays, and Sharpnose was weakly supported. Cloaca diversity was uniquely distinct in Butterfly Rays compared to the other species. However, it was surprising that the gut microbiome did not reiterate these differences, despite the assumption that the cloacal community would be continually exposed to bacteria from the gut during fecal evacuation, which may lead to a correlation in patterns between these two anatomically-linked areas. Furthermore, the lack of species-specific differences in gut samples was unexpected considering that stable isotope analysis indicated that there was even further niche differentiation among the four species than we had initially predicted. In particular, Atlantic Stingrays and Bluntnose Stingrays had greater separation in carbon stable isotopes than expected, which is likely diet-based. As diet is known to influence intestinal microbial communities [
37,
38], particularly by predatory clade among fishes [
8,
39], the lack of difference among species could indicate issues with our methodology of sample collection. Cloacal samples were sampled fresh from the boat, whereas gut samples were collected after whole animals were stored on ice and underwent a freeze/thaw cycle before sampling. Therefore, it is possible that these differences in sample collection could have obscured any species-specific differences if certain bacterial DNA, which may be important for distinguishing species, is sensitive to longer processing times and freeze/thaw cycles [
40].
Despite the weak differences in diversity measures, network analyses added a layer of nuance to interpreting species-specific microbiome relationships for “internal” and “external” communities. While describing bacterial presence/absence and quantifying relative abundance are the first steps to understanding the role of host–microbiome relationships, bacteria also interact with each other in either positive, negative, or mutualistic ways that can push a community in one direction or another. Despite all four species having similar bacterial compositions (i.e., weak species-specific differences), network analyses revealed that the bacterial relationship perspective of bacterial communities were quite different from each other and were host-specific. It is important to note that we cannot interpret whether these relationships result in favorable or negative outcomes for the host, only that positive or negative correlations among bacterial phyla exist. Understanding the stability of these networks would be interesting to explore with future experiments presenting various perturbations (i.e., translocation experiments or diet alterations) and following how or if communities change.
Network density was clearly distinguishable among these elasmobranch species. While only one shark was included in this study, it was interesting that all three rays showed a similar pattern (loose networks) that was unlike the network of the shark. We had initially predicted that the degree of benthic association would have an effect on species’ microbiomes, and from a network density perspective this was supported. A tighter network could be indicative of fewer disturbances that have allowed the microbiome of the species to converge on a particular community composition. With regards to external networks, differences between batoid and shark ecophysiology could influence the tightness of the network. Sharpnose are obligate ram ventilators (i.e., swim continuously) and, therefore, do not associate as tightly with the benthos as rays, which are capable of buccal pumping, allowing them to rest or bury in sediment. Assuming differences in bacterial diversity between sediment and water [
8,
41], ray external microbiomes could be more “challenged” or disturbed more often than the shark, leading to looser networks in the rays. However, contrary to our prediction, the internal networks of the shark were equally dense and did not resemble the networks of Atlantic and Bluntnose Stingrays, despite all three being benthic feeders. Likewise, tighter internal networks did not result in the Butterfly Ray, which is presumed to feed pelagically. Further studies manipulating species environment and/or diet would be interesting to conduct to evaluate the stability of these microbial networks in the face of change that may elucidate their importance to host health.
Keystone phyla (i.e., those with high Betweenness Centrality) were shared more closely within species than among species for both external and internal networks. Across all four elasmobranchs, external networks were distinct while only one phylum was shared across internal networks. Thus, despite being sampled from a similar geographic region, where species would be exposed to the same bacterial environment, this did not result in phyla having the same role in the networks of each species. Interestingly, when the shark was excluded, there was an increase in overlapping keystone phyla (0 to 2) for rays, possibly reflecting their more shared benthic-associated ecology compared to the Sharpnose. However, the relative importance of these shared keystone phyla was not the same among the rays, suggesting that commonly shared phyla may have different positions in the microbial community that are species-specific. Further supporting a host-specific effect, keystone phyla within species external networks often occurred in their internal networks (30–50% of the time) and perhaps indicate that certain phyla are more important to the microbial organization of certain species compared to others. Alternatively, the co-occurrence of microbes important to internal and external networks in a species-specific manner could be a result of phylosymbiosis [
38,
42], where a particular community structure has resulted from the co-evolution between a host and its microbes.


