Article

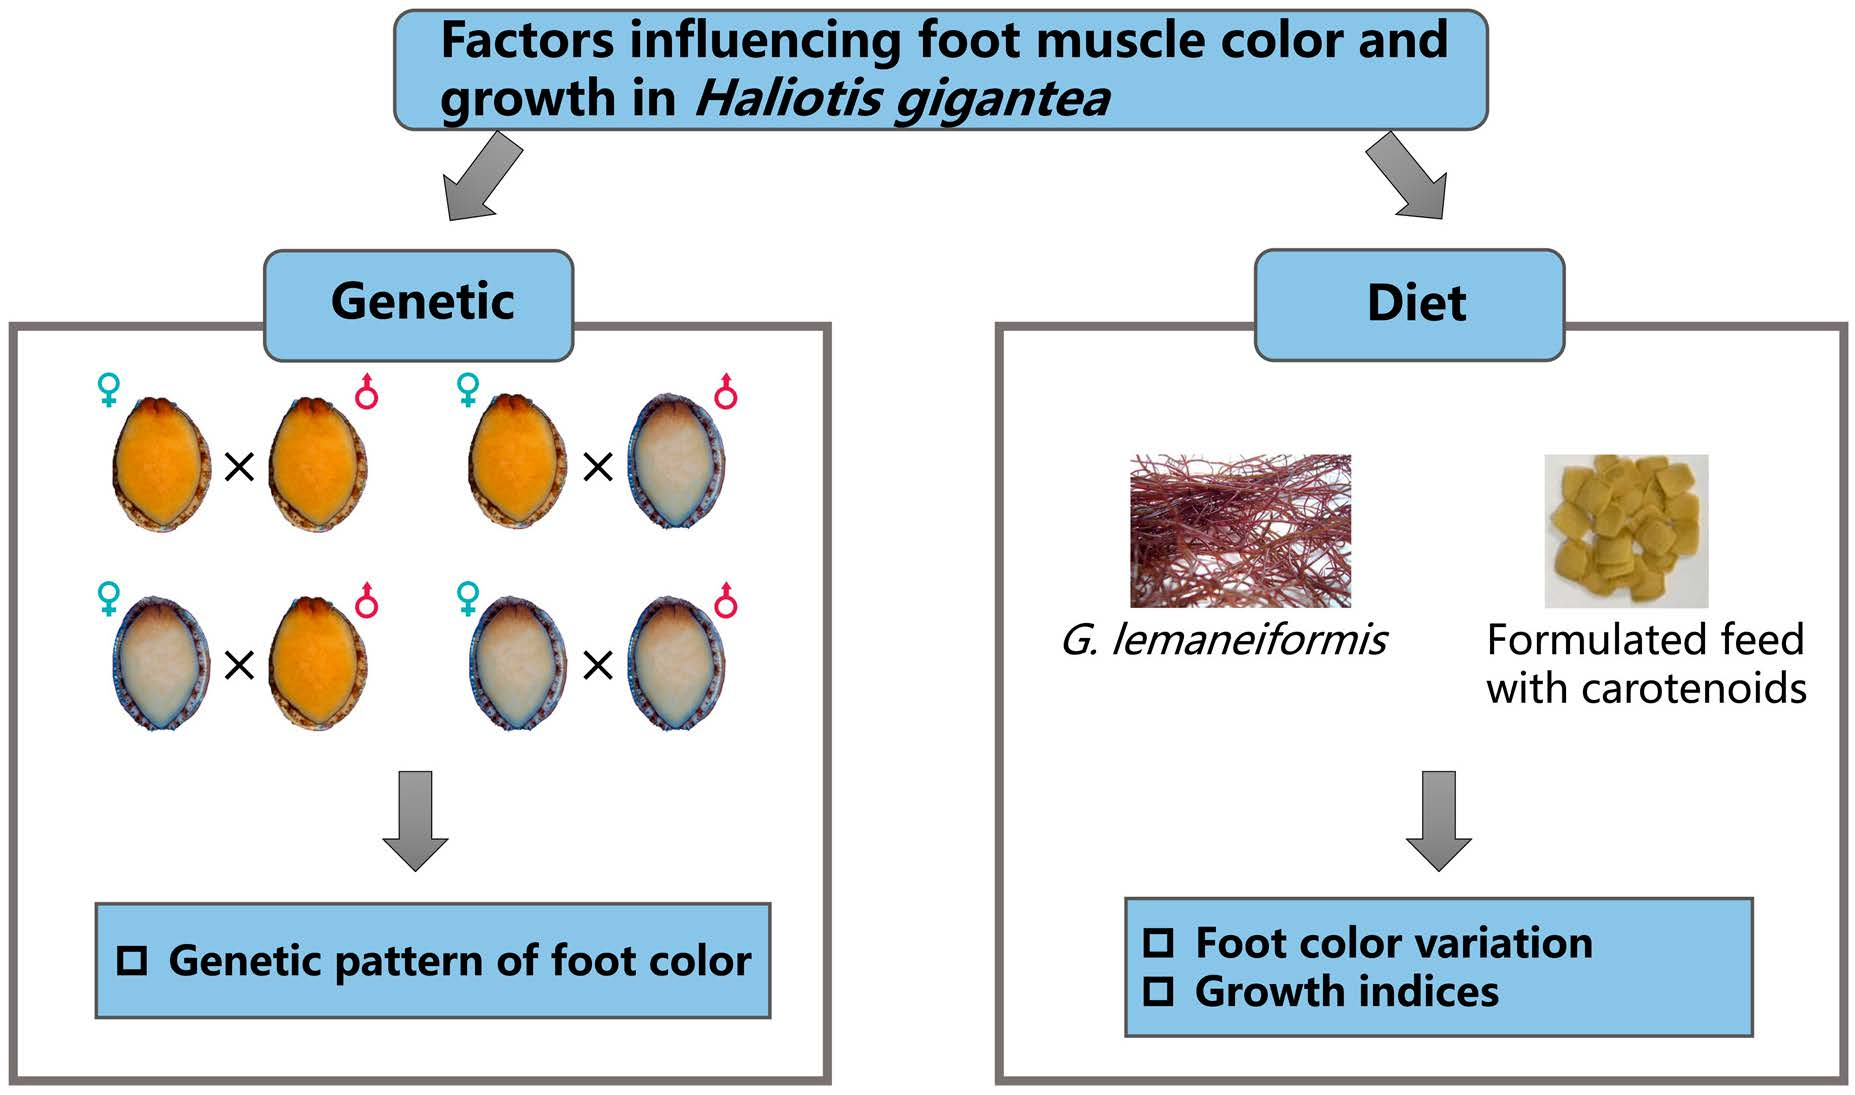
Investigating the Genetic and Dietary Factors Influencing Foot Muscle Color and Growth in Haliotis gigantea

1
College of Fisheries, Jimei University, Xiamen 361021, China
2
State Key Laboratory of Mariculture Breeding, College of Ocean and Earth Sciences, Xiamen University, Xiamen 361102, China
3
Fujian Key Laboratory of Genetics and Breeding of Marine Organisms, Xiamen University, Xiamen 361102, China
4
National Observation and Research Station for the Taiwan Strait Marine Ecosystem, Dongshan 363400, China
*
Authors to whom correspondence should be addressed.
Fishes 2023, 8(9), 443; https://doi.org/10.3390/fishes8090443
Submission received: 5 August 2023 / Revised: 24 August 2023 / Accepted: 25 August 2023 / Published: 31 August 2023
(This article belongs to the Special Issue Feed Additives in Aquaculture)

Abstract

:
Haliotis gigantea, a commercially cultivated abalone in China, predominantly displays the pale-yellow-footed trait. However, a limited occurrence of the orange-footed muscle trait makes it a valuable candidate for breeding programs. In our research, we examined the inheritance pattern of the orange-footed trait and conducted a 90-day feeding trial for H. gigantea to compare the influence of formulated feed and macroalgae on pigment enrichment and growth rates. Our results suggest that the orange-footed trait has a recessive nature relative to its common counterpart and demonstrates stable inheritance. We also identified a significant correlation between color-difference values (a*) and total carotenoid content (TCC) (R2 = 0.955, p < 0.05), suggesting the TCC in abalone foot muscle can be estimated using the a* value. Furthermore, introducing carotenoids to formulated feed imparts an orange hue to the foot muscle, but this effect is inferior compared to using Gracilariopsis lemaneiformis with a similar carotenoid content. This suggests that H. gigantea has a higher absorption efficiency for the carotenoids from the macroalgae G. lemaneiformis compared to formulated feed. Growth assessments indicate that the formulated feed, enriched with higher crude protein than G. lemaneiformis, optimally supports H. gigantea growth. Our findings furnish valuable insights that could steer breeding strategies and feeding practices towards achieving the orange-footed muscle trait in H. gigantea.
Key Contribution: The orange-footed trait in H. gigantea consistently inherits, potentially being recessive to the standard phenotype. While the introduction of carotenoids to formulated feed does not enhance color as effectively as G. lemaneiformis does, it does accelerate growth rates more rapidly than G. lemaneiformis.

Graphical Abstract

1. Introduction

The aquaculture of Haliotis gigantea, characterized by its pale-yellow foot muscles, holds commercial importance in both China and Japan. In Japan, the species commands an annual production of over 2000 tonnes, underlining its economic value. Concurrently, it is gaining prominence in China, serving both the domestic market and emerging as a key export commodity. However, in the cultured population, a small number of orange-footed mutants sharply contrast with the common-footed H. gigantea. This orange-footed variant is unique due to its appealing color and an abundance of carotenoids, making it a precious biological material for the breeding of abalone species. Previous studies have suggested that the color of the foot muscle in mollusks is predominantly due to the enrichment of carotenoids in tissues [1]. One intriguing finding is that the content of carotenoids in the foot muscle of orange-footed H. gigantea reaches up to 300–500 μg/dry g [2], reportedly the highest content among shellfish to date. This is about 16.5 times that of common-footed H. gigantea or over 100 times of most edible shellfish [3]. However, the genetic pattern of orange-footed H. gigantea remains to be elucidated.
Carotenoids are natural organic pigments, distinguished by their distinct chemical structures. Based on their specific chemical structures, carotenoids can be categorized into two primary classes. The first class, termed ‘carotene’, consists of compounds like β -carotene and lycopene that contain only carbon and hydrogen without any oxygen. The second class includes compounds like zeaxanthin and astaxanthin, which contain oxygen-bearing functional groups such as hydroxyl, carboxyl, and epoxy groups [4]. At the molecular level, the conjugated double bonds of carotenoids form a chromophore structure of varying lengths [5], bestowing a red tint to aquatic animal muscles. They play an essential role in the muscle pigmentation of fish and shellfish [6,7]. Beyond coloration, their notable antioxidant, anti-inflammatory, and antiviral properties [8,9,10] are often harnessed to promote the growth and health of fish and shellfish. Moreover, owing to their powerful antioxidant capabilities and their involvement in vitamin A biosynthesis, foods which contain carotenoids are vital for human nutrition and health [11,12].
Aside from genetic factors [1,13], the type and content of carotenoids in shellfish are mainly influenced by environmental factors, such as feed and water temperature [14,15], and physiological factors, including age, sex, and developmental stage [16,17]. It is worth noting that shellfish, among other aquatic animals, can hardly synthesize carotenoids independently. Instead, they acquire them through the ingestion of feeds or symbiotic microorganisms enriched with carotenoids, which are subsequently absorbed, transported, metabolized, and finally accumulated in the body [18]. Therefore, among various factors, the type of diet plays a pivotal role in the enrichment of carotenoids in shellfish. Moreover, both macroalgae and formulated feeds can be employed for abalone culture [19]. Since fresh macroalgae offer more health benefits than formulated feeds, abalones in several countries are known to be farm-fed with macroalgae [20,21]. Gracilariopsis lemaneiformis, rich in essential nutrients and carotenoids, is widely used as a food source for cultured abalone in China [2]. Formulated feeds are also essential in regions where abalones struggle to thrive on live brown macroalgae. The effects of carotenoid-supplemented formulated feeds versus macroalgae on the accumulation of carotenoids in the foot muscle of H. gigantea and its subsequent growth are not yet fully understood.
This study intends to unravel the impact of genetic factors and dietary components on the formation of orange foot muscle in H. gigantea. We conducted both self-crosses and crosses among the abalones exhibiting orange and common foot colors. The colors were then examined in the first generation resulting from these test crosses and the correlation between progeny foot-muscle color and parental foot-muscle total carotenoid content (TCC) was assessed. Additionally, we explored the effects of various feed types on the color and growth of H. gigantea’s foot muscle. Our study promises to provide theoretical and technical guidance for the cultivation of new abalone species that are both distinctive and high-quality.

2. Materials and Methods

2.1. Parental Abalone Breeding and Offspring Cultivation

The parental abalones used in this study were sourced from the two-year-old cultured stocks of H. gigantea at Fuda Abalone Farm in Jinjiang, Fujian Province. Careful selection was made to choose healthy and vibrant parents that exhibited fully developed gonads and displayed both orange and common foot-muscle phenotypes. In particular, RR refers to parents that exhibit the orange-footed trait, while SS represents those with the common-footed trait. To generate our F1 lines, we utilized these specific parental combinations: RR × RR, SS × SS, RR × SS, and SS × RR, with the females listed first. Notably, all spawning and fertilization processes were conducted in November.
Throughout the growth process, all F1-generation lines were cultured under identical conditions and received the same feeding regimen. During the period of culture, the temperature was maintained at a range of 15–27 °C, oxygen levels were kept at 5.5–6.8 mg/L, and the salinity was between 31–33 psu. The abalones were reared in 600-L buckets and provided with appropriate feeds. Diatoms were provided as food for abalones aged 0–1 month, while regular formulated feed was given to those aged 2–7 months. Abalones aged 8–10 months were fed with G. lemaneiformis, ensuring a suitable diet tailored to their developmental stage (Table S1).

2.2. Color Identification of Abalone Foot Muscle

The color of the abalone foot muscle was assessed using a 3nh-NR110 color difference meter from Shenzhen 3nh Technology Co., Ltd. Previous studies have demonstrated a significant correlation (p < 0.01) between the color parameters’ brightness value (L*), red-green value (a*), and blue-yellow value (b*) measured by this device and the color characteristics observed with the naked eye [22]. Notably, an increase in the value of each parameter indicates a deeper yellow color, ultimately transitioning to an orange-red hue. Among these parameters, the a* value is considered the most representative.
The distinct coloration of the foot muscle allows for easy visual classification of orange-footed H. gigantea compared to the common H. gigantea. However, for specimens that could not be classified by visual inspection, we performed color-difference measurements using a colorimeter and calculated the average value. Abalones with an a* value greater than or equal to 10.00 were classified as orange-footed H. gigantea, while those with an a* value less than 10.00 were categorized as common H. gigantea. For each abalone line, we identified 40 individuals of each foot-muscle phenotype (orange-footed/common).

2.3. Experimental Design of Acclimation and Feeding of the Experimental Abalone

The abalones used in the experiment consisted of two sets of H. gigantea aged 10 months, referred to as Group A and Group B. Both groups were the offspring of orange-footed H. gigantea and were bred in a self-bred manner (Figure S1). Throughout the culture process, the environmental conditions remained consistent, with the exception of the feed provided to abalones aged 8–10 months. Group A abalones were fed with G. lemaneiformis, while Group B abalones received conventional formulated feed, which lacked carotenoids.
To distinguish between the two groups, individual abalones were labeled on their shells prior to the experiment. They were then placed in test units, specifically 300 L buckets, with 16 abalones from either Group A or Group B in each bucket. The abalones were given two types of feeds throughout the experiment: G. lemaneiformis and a tailor-made formulated feed (refer to Table S2). This led to the formation of four subgroups: Group AL (Group A fed with G. lemaneiformis), Group BL (Group B fed with G. lemaneiformis), Group AS (Group A fed with the formulated feed), and Group BS (Group B fed with the formulated feed). Each subgroup consisted of three replicates. In the following 90-day experimental period, the observed temperature ranged between 17–25 °C, oxygen levels were between 6.2–6.5 mg/L, and the salinity remained around 32 psu. Feeds were provided at 5 pm daily, while residual feeds were cleaned and buckets were rinsed around 9 am the following morning. During the 90-day feeding trial, the abalones consumed approximately half of the daily feed provided. This was determined based on the amount of feed observed to be remaining each day.

2.4. Assessing the Growth Indices of Abalone

The shell length of the abalones was measured using a vernier caliper with an accuracy of 0.01 mm. Additionally, the body weight of the abalones was measured using a palm scale with an accuracy of 0.01 g. The growth indices used in this work were calculated as follows:
(1)
Fatness (g/mm) = total weight (g)/shell length (mm)
(2)
Shell length gain ratio (%) = (final shell length (g) − initial shell length (g))/initial shell length (mm)
(3)
Total mass gain ratio (%) = (final total weight (g) − initial total weight (g))/initial total weight (g)
(4)
Fatness gain ratio (%) = (final fatness (g/mm) − initial fatness (g/mm))/initial fatness (g/mm)

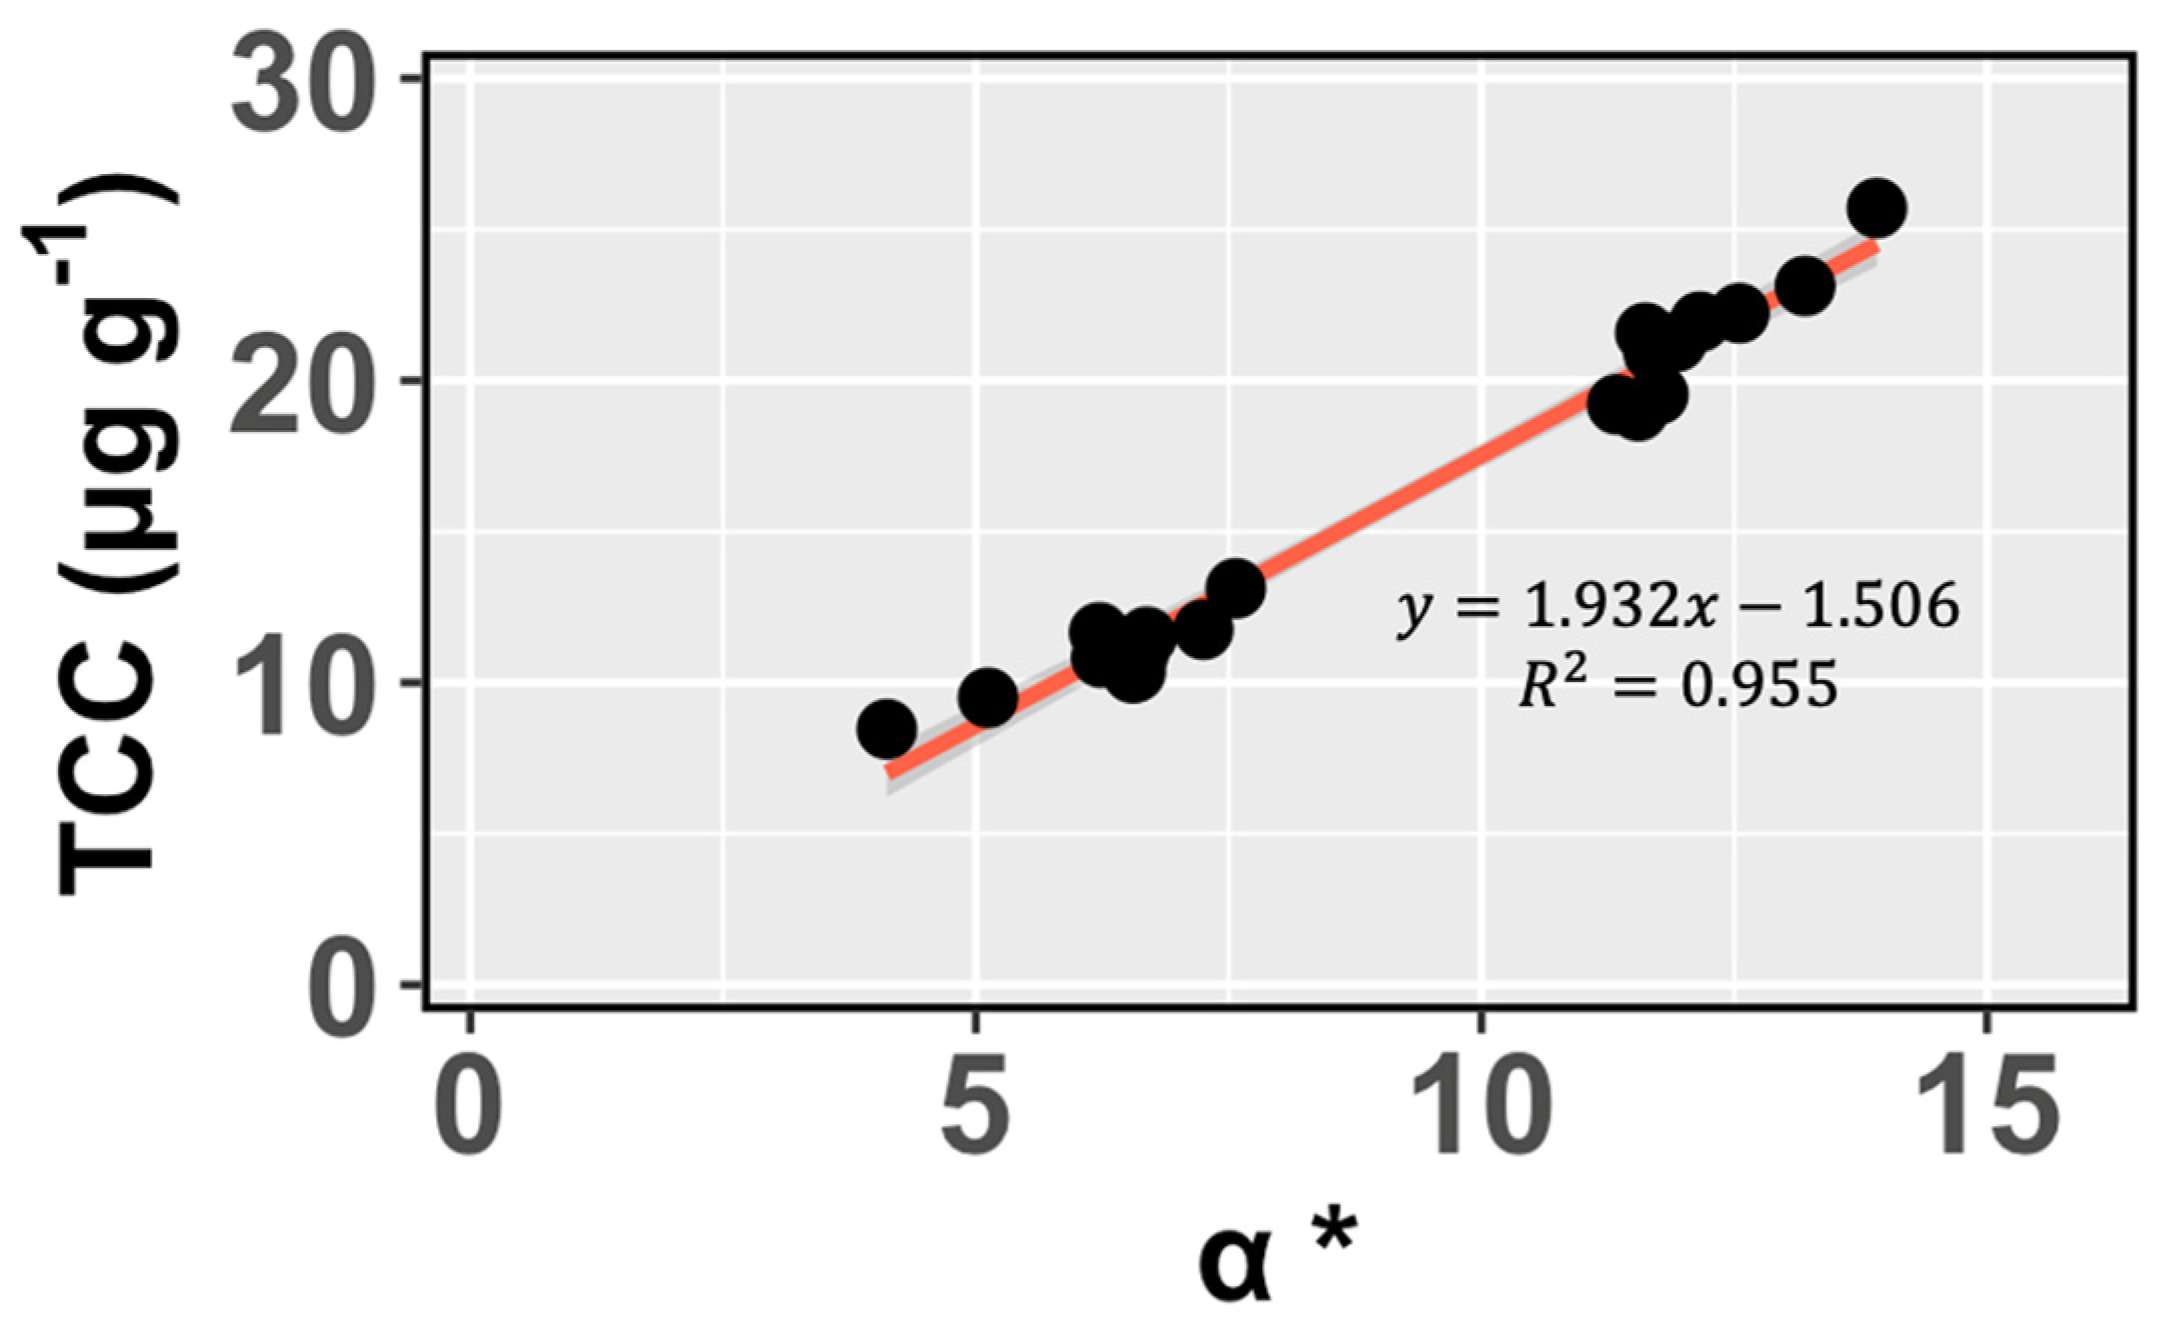
2.5. Determination of Carotenoid Content in Abalone Foot Muscle

2.5.1. Isolation of Pigments

The tissue specimens were subjected to processing in a vacuum freeze-drying unit for 48 h and subsequently ground into a powder using a tissue grinder. To extract the carotenoids, 1.00 g of the powdered specimens was accurately weighed and placed in a 50 mL centrifuge tube. Then, 20 mL of ethyl acetate and 0.02 g of BHT (2,6-di-tert-butyl-4-methylphenol) were added. The mixture was homogenized at 1000 rpm/min for 5 min, followed by centrifugation at 4000 r/min and a low temperature of 4 °C for 5 min to separate the supernatant from the specimen. This extraction procedure was repeated three times to ensure thorough extraction of the carotenoids.
All supernatants were collected in a brown pear-shaped flask and evaporated using a rotary evaporator at a water bath temperature of 32 °C and freezer temperature below 10 °C. A small amount of ethyl acetate was pipetted into a brown pear-shaped flask, and the carotenoids were transferred in small amounts and multiple times to a 4 mL brown feed vial. The extract was further concentrated using a solvent workstation (Maxtemp = 33 °C) and stored in a refrigerator at −20 °C under shaded conditions.
Before chromatographic detection, the extracts were dissolved in 2000 μL of ethyl acetate, thoroughly mixed by inverting, and subjected to ultrasonic treatment for 2–3 min to ensure complete dissolution of the pigments. A single-use syringe was used to draw 1 mL of the sample solution, which was then filtered through a 0.22 μm membrane and transferred to a 2 mL liquid-phase brown vial to obtain the sample solution for HPLC analysis.

2.5.2. HPLC Analysis

Chromatographic conditions included the use of a mobile phase consisting of n-hexane and ethyl acetate in a ratio of 40:60 (v/v). The flow rate of the mobile phase was set at 1.5 mL/min, and an injection volume of 20 μL was used. The analysis was performed using a YMC-PackSIL silica gel column (250 × 4.6 mm, particle size 5 μm) at a column temperature of 25 °C. The Chromeleon Console 7.2 (Thermo Fisher Scientific) was utilized for data analysis.
We weighed 1.00 mg of zeaxanthin and β -carotene standards separately and dissolved them in ethyl acetate of chromatographic purity. The solutions were transferred into 2 mL volumetric flasks, and the volume was adjusted accordingly. After thorough shaking, the standard solutions were diluted at equal ratios to obtain concentrations of 500, 250, 125, 62.5, 31.25, 15.625, 3.125, 1.5625, 0.78125, 0.15625, and 0.078125 μg/mL. The standard solutions were then analyzed using the chromatographic system, and the peak area values of the standard solutions at different concentrations were used to calculate the standard curves and conversion equations.
Using the same chromatographic conditions, the sample solution was analyzed and the chromatogram was recorded. By comparing the peak retention times with those of the standard solution, the types of carotenoids present in the specimens were identified. The contents of Zeaxanthin and β -carotene in the specimens were calculated based on the standard curve. Considering that the combined amount of Zeaxanthin and β -carotene accounts for over 85% of the total carotenoid content in the abalone foot muscle and plays a crucial role in determining the TCC levels, their sum was considered as the TCC in the abalone foot muscle.

2.6. Data Analysis

Data collection and data pre-processing were carried out using Microsoft Excel, version 2021. To examine the differences between the means of our groups, we employed one-way analysis of variance (ANOVA). In the case where the one-way ANOVA indicated a significant difference (p < 0.05), a post hoc Tukey test was performed to identify specifically where these differences occurred. Statistical analysis was performed using IBM SPSS Statistics 26, and graphs were generated using the ggplot2 package in R version 4.3.0.

3. Results

3.1. Genetic Foot-Muscle Color Patterns

A total of 4819 abalones from 16 F1-generation lines were included in this study. Specifically, four of these lines were derived from both parents being of the orange-footed H. gigantea variety (R × R). In contrast, three lines had both parents from the common H. gigantea variety (S × S). Additionally, six lines stemmed from a female parent of the orange-footed H. gigantea and a male parent from the common H. gigantea (R × S), while the remaining three lines were obtained from a female parent from the common H. gigantea and a male parent from the orange-footed H. gigantea (S × R).
Table 1 shows that when the crosses involved two orange-footed H. gigantea parents, the majority of F1-generation offspring manifested orange foot muscles. A small number of individuals fell below the standard for orange foot muscles, which could be attributed to individual variations. As for the crossbred lines of orange-footed H. gigantea with common-footed H. gigantea, only one line exhibited a balanced segregation of character at a ratio of 1:1 (common-footed: orange-footed). In contrast, the other lines consistently exhibited the regular pale-yellow character. Similarly, the F1-generation lines of common-footed H. gigantea demonstrated a clear segregation of character at ratios of 1:0 and 3:1. These observed segregation ratios of character (0:1, 1:0, 1:1, 3:1) are in line with Mendelian inheritance patterns.
Figure 1 shows the relationship between carotenoid content (TCC) and muscle color-difference value (a*). A strong positive correlation between the foot muscle a* and TCC (R2 = 0.977, p < 0.01) was found in our study involving 29 individuals H. gigantea, including both orange-footed and common-footed variants.

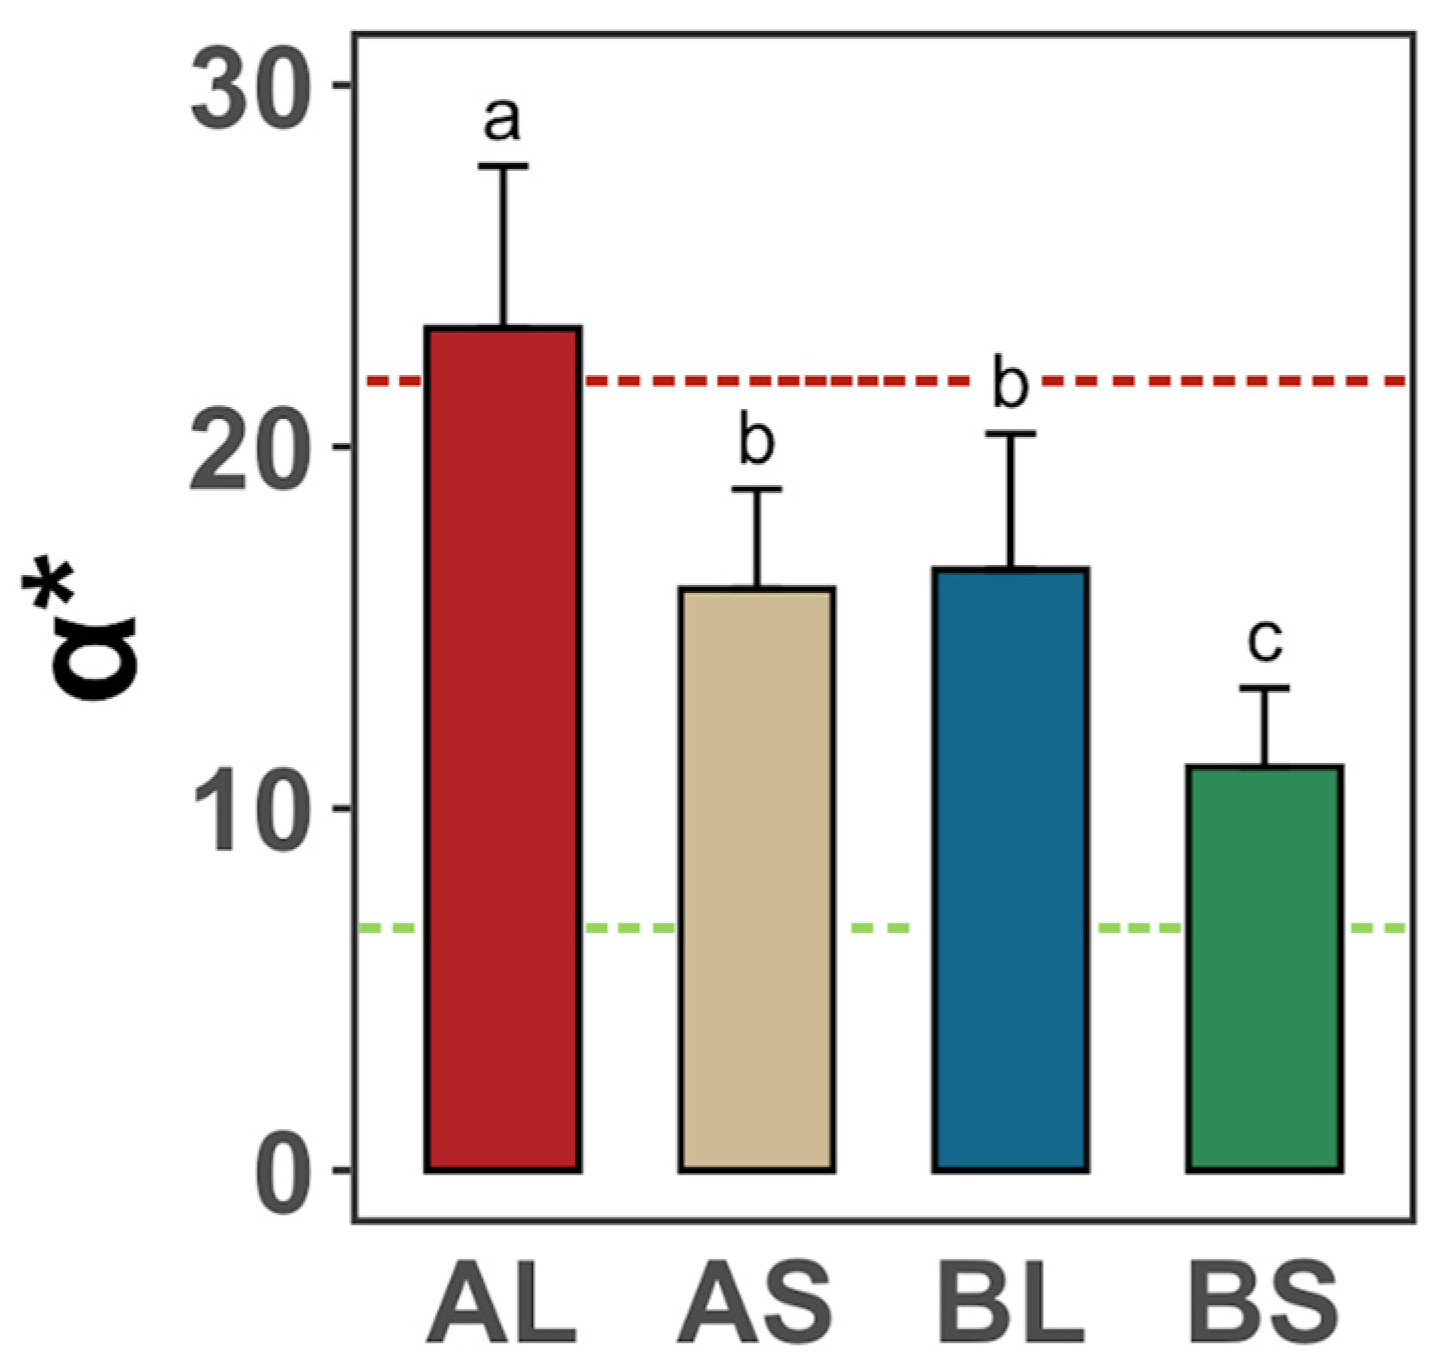
3.2. Effects of Feeds on the Foot Muscle Color

Figure 2 displays marked changes in the foot muscle a* value (indicating color) of abalones in all four groups and initial values (dash lines) of Group A and B. The initial a* values of Group A and B are 22.55 ± 4.31 and 6.47 ± 1.83, respectively. Considered from the perspective of identical initial TCC but different types of feed, compared to the initial a* value, Group AL’s foot-muscle color had no significant change (p > 0.05), whereas Group AS’s lightened (p < 0.05). Both Group BL and BS transitioned to an orange tint, with BL’s change more evident (p < 0.05). For the TCC values, Group AL showed a notably greater color difference than Group AS, while Group BL differed more from Group BS (p < 0.05). Table 2 indicates that the levels of zeaxanthin and β-carotene in the feeds for Group A and B are not significantly different (p > 0.05).

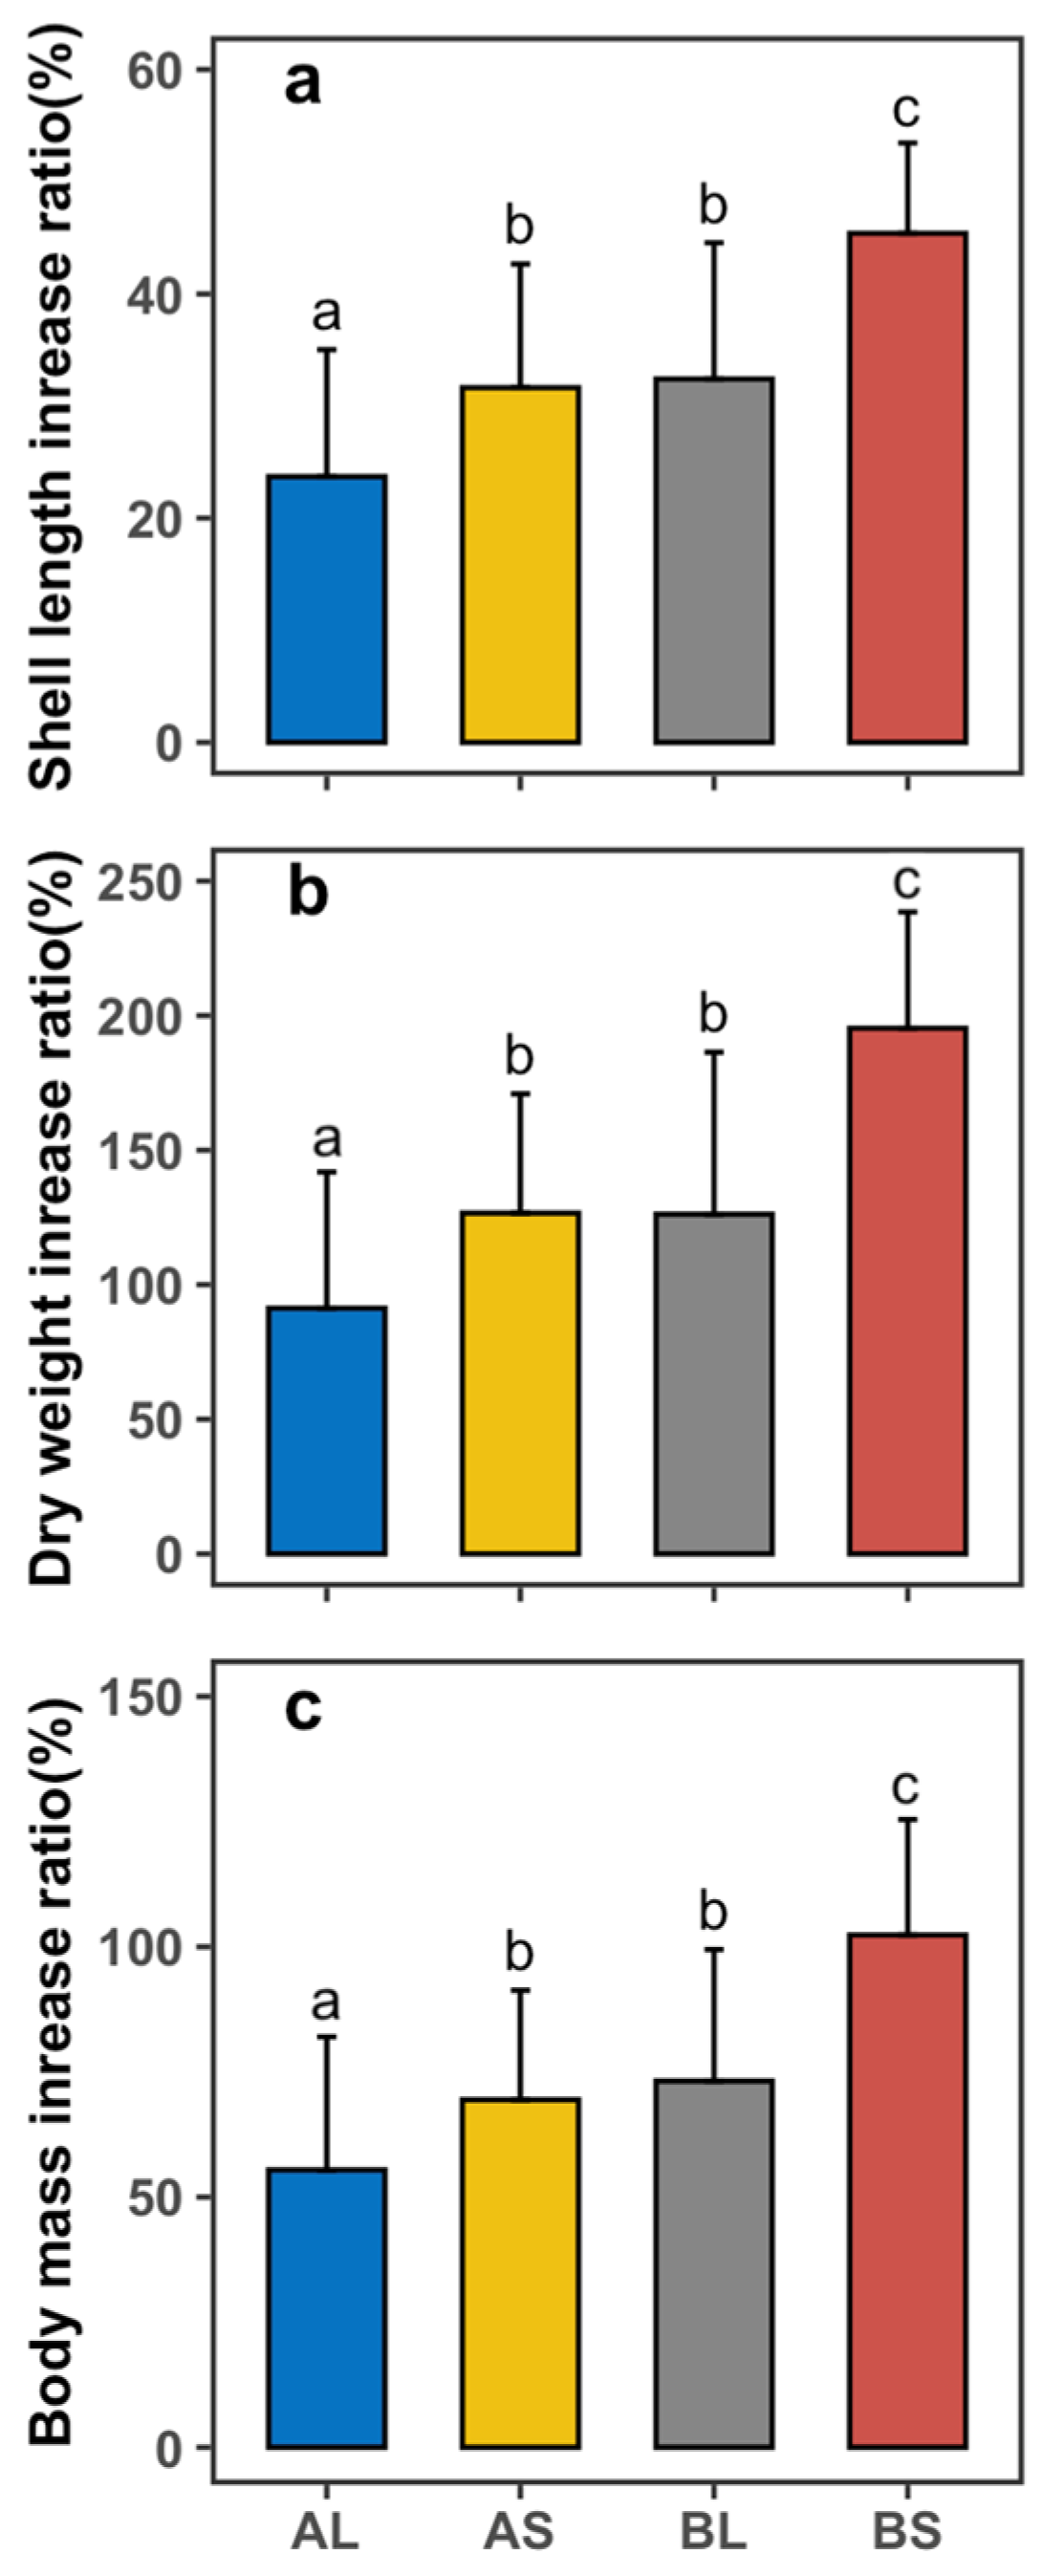
3.3. Effects of Feeds on the Growth Rate

To avoid the impact of initial specimen size differences on the results of the experiment (Table S3), the shell length gain ratio, mass gain ratio, and fatness gain ratio were considered as the indices measuring growth rate. Figure 3 shows that after the end of the feeding experiment, four groups of abalones were detected with significant changes in respect of shell length, total weight, and fatness. Considered from the perspective of identical initial TCC but different types of feed, among the three indicators, Group AS significantly outperformed Group AL (p < 0.05), and Group BS outperformed Group BL (p < 0.05). There was no significant difference between Group AS and Group BL (p > 0.05). From the perspective of different initial TCC values but identical feed types, in these three indicators, Group BL was significantly higher than Group AL (p < 0.05), and Group BS was significantly higher than Group AS (p < 0.05). In addition, our data show that both the crude protein and crude lipid contents in the formulated feed were notably higher than in G. lemaneiformis, registering at 40.00 ± 0.50% vs. 15.91 ± 5.39% and 3.58 ± 0.23% vs. 1.74 ± 0.11%, respectively (p < 0.05), as detailed in Table 3.

4. Discussion

The inheritance of body color in aquatic animals, especially mollusks, remains a debated topic. While much research on color genetics predominantly targets fish [23,24,25,26], mollusk studies focus mainly on scallop foot muscles [27,28,29]. For example, when orange-bodied Cyprinus carpio wuyuanensis was bred with blue-gray-bodied Cyprinus carpio rubrofuscus, the F1 offspring were blue-gray, showing blue-gray dominance. Subsequent F1 self-crossing and back-crossing revealed inheritance controlled by two gene pairs [25]. In contrast, studies on Japanese koi (Cyprinus carpio) present varied theories about the genetic control of their colors [24,26]. For Yesso scallops, Li et al. [28] demonstrated Mendelian inheritance for muscle color, linking it to the PyBCO-like 1 gene. In a separate study, Li et al. [29] identified through transcriptome analysis that the down-regulation of PyBCO-like 1 results in carotenoid accumulation in muscle. These studies highlight the different inheritance patterns between fish and mollusks. In H. gigantea, the orange-footed trait seems recessive, possibly governed by allelic genes, though further F2, F3, and back-crossing studies are essential.
Previous research has highlighted the relationship between carotenoid enrichment and muscle color in shellfish. Zhao et al. [30] introduced two scallop strains, ‘QN Orange’ and ‘Bohai Red’, both derived from a hybrid cohort of Bay scallop (Argopecten irradians irradians) and Peruvian scallop (Argopecten purpuratus). The orange-adductored ‘QN Orange’ strain had a carotenoid concentration of 82.68 µg/g, which was substantially higher than its ‘Bohai Red’ counterpart with white adductor muscles. Another instance is the ‘Nanao Jinbei’, originating from golden-yellow individuals of scallops in Nanao, Shantou, Guangdong; this strain exhibits golden-yellow hues across its shell, adductor muscle, and mantle. The carotenoid concentration in its golden-yellow adductor muscle lies between 10.0 and 15.6 µg/g, which is 4.7 to 13.7 times more than the typical white adductor muscle [13]. These studies emphasize the direct association between carotenoid concentrations and the visible muscle colors, aligning with our findings. In addition, measuring TCC directly can be cumbersome. According to our results, using the a* value as an indicator offers a quicker method to estimate TCC in shellfish muscle, presenting a potential tool for swiftly assessing muscle coloration.
Our study builds on the existing knowledge that abalones have the ability to derive β-carotene from both fresh macroalgae and formulated feeds [31]. Our results suggest that abalones starting with lower carotenoid levels might better accumulate carotenoids over time. One possible explanation is that there may be an upper saturation limit for carotenoid accumulation in abalones. Abalones that start with higher levels may be closer to this saturation point, making additional accumulation less efficient. Our findings also suggest that H. gigantea accumulates carotenoids from G. lemaneiformis more efficiently than from the formulated feed. The reason could be that fresh macroalgae might contain other nutrients or compounds that act synergistically with pigments to enhance their uptake or incorporation into tissues, an effect that might not be replicated in formulated feeds. It is worth noting that natural pigments, such as those found in fresh macroalgae, tend to have better deposition in abalone tissues compared to formulated feeds [32,33,34]. Thus, while genetics are influential, H. gigantea’s foot-muscle color also largely depends on its diet types.
Bansemer et al. [35] found that formulated feeds would be more beneficial to the growth of Haliotis laevigata compared to natural algae such as Ulva lactuca and G. lemaneiformis, which coincides with the results revealed in our study. This accelerated growth in abalones on the formulated feed is largely attributed to the limited protein and lipid content in fresh macroalgae [2,36]. Orange-muscle abalones, despite their elevated carotenoid content, displayed slower growth rates than their common counterparts under identical dietary conditions. This observation aligns with findings from a recent study [37]. One possible explanation is that carotenoid synthesis or storage might require more energy. When organisms prioritize certain physiological functions, such as coloration, they might redirect energy from other functions, like growth.

5. Conclusions

In conclusion, our study demonstrates that the orange-footed trait in H. gigantea is recessive and stably inherited, making it a valuable focus for future breeding programs. A strong correlation between the color-difference values (a*) and the total carotenoid content (TCC) was established, indicating that TCC can be reliably estimated using the a* value. While supplementing formulated feed with carotenoids resulted in an orange hue in the abalone’s foot muscle, the effect was less potent compared to the natural macroalgae G. lemaneiformis. This implies that H. gigantea absorbs carotenoids more efficiently from G. lemaneiformis. Finally, our growth assessments suggest that formulated feeds enriched with higher crude protein are more effective for the growth of H. gigantea than G. lemaneiformis. These findings provide valuable insights that could guide both breeding and feeding strategies for enhancing the desirable orange-footed muscle trait in H. gigantea.

Supplementary Materials

The following supporting information can be downloaded at: https://www.mdpi.com/article/10.3390/fishes8090443/s1, Figure S1: Schematic diagram of the feed experiment grouping; Table S1: Nutrient composition of regular formulated feed; Table S2: Feed formula for feeding experiment; Table S3: Initial specifications of abalone for experiment.

Author Contributions

Conceptualization, W.Z. and W.Y.; methodology, W.Z. and W.Y.; software, Y.K.; validation, Y.K. and M.C.; formal analysis, Y.K.; investigation, Y.K. and W.Z.; data curation, Y.K. and W.Z.; writing—original draft preparation, Y.K., W.Z. and X.G.; writing—review and editing, Y.K. and W.Y. All authors have read and agreed to the published version of the manuscript.

Funding

This research was funded by: Key R&D Program of Fujian Province, China, grant number 2020NZ08003. National Natural Science Foundation of China, grant number 32002379. Key project of the Natural Science Foundation of Fujian Province, China, grant number 2020J02040.

Institutional Review Board Statement

The sample collection and experimental protocols were approved by the Animal Care and Use Committee of the Fisheries College of Jimei University (Animal Ethics No. 2021-4). All animal handling and methods were performed according to the relevant guidelines.

Informed Consent Statement

Not applicable.

Data Availability Statement

Not applicable.

Conflicts of Interest

The authors declare that the research was conducted in the absence of any commercial or financial relationships that could be construed as a potential conflict of interest.

References

  1. Li, N.; Hu, J.; Wang, S.; Cheng, J.; Hu, X.; Lu, Z.; Lin, Z.; Zhu, W.; Bao, Z. Isolation and Identification of the Main Carotenoid Pigment from the Rare Orange Muscle of the Yesso Scallop. Food Chem. 2010, 118, 616–619. [Google Scholar] [CrossRef]
  2. Wei, X.; Zeng, W.; Tang, B.; He, J.; Chen, N.; Luo, X.; Feng, D.; You, W.; Ke, C. Comparative Analysis of the Predominant Carotenoids and Chemical Components in the Common and Orange-muscle Mutant of Haliotis gigantea. Aquac. Res. 2019, 50, 2938–2950. [Google Scholar] [CrossRef]
  3. Kantha, S.S. Carotenoids of Edible Molluscs: A review. J. Food Biochem. 1989, 13, 429–442. [Google Scholar] [CrossRef]
  4. Suzanne, T.W. Molluscan Shell Colour. Biol. Rev. 2017, 92, 1039–1058. [Google Scholar]
  5. Goodwin, T.W. The Biochemistry of the Carotenoids; Chapman and Hall: London, UK, 1984. [Google Scholar]
  6. Miki, W.; Yamaguchi, K.; Konosu, S.; Takane, T.; Satake, M.; Fujita, T.; Kuwabara, H.; Shimeno, S.; Takeda, M. Origin of Tunaxanthin in the Integument of Yellowtail (Seriola quinqueradiata). Comp. Biochem. Physiol. Part B Comp. Biochem. 1985, 80, 195–201. [Google Scholar] [CrossRef]
  7. Gouveia, L.; Rema, P. Effect of Microalgal Biomass Concentration and Temperature on Ornamental Goldfish (Carassius auratus) Skin Pigmentation. Aquac. Nutr. 2005, 11, 19–23. [Google Scholar] [CrossRef]
  8. Schubert, N.; Garcia-Mendoza, E.; Pacheco-Ruiz, I. Carotenoid Composition of Marine Red Algae. J. Phycol. 2006, 42, 1208–1216. [Google Scholar] [CrossRef]
  9. Sachindra, N.M.; Sato, E.; Maeda, H.; Hosokawa, M.; Niwano, Y.; Kohno, M.; Miyashita, K. Radical Scavenging and Singlet Oxygen Quenching Activity of Marine Carotenoid Fucoxanthin and Its Metabolites. J. Agric. Food Chem. 2007, 55, 8516–8522. [Google Scholar] [CrossRef]
  10. Chojnacka, K.; Saeid, A.; Witkowska, Z.; Tuhy, L. Biologically Active Compounds in Seaweed Extracts—The Prospects for the Application. Open. Conf. Proc. J. 2012, 3, 20–28. [Google Scholar] [CrossRef]
  11. Krinsky, N.I.; Landrum, J.T.; Bone, R.A. Biologic Mechanisms of the Protective Role of Lutein and Zeaxanthin in the Eye. Annu. Rev. Nutr. 2003, 23, 171–201. [Google Scholar] [CrossRef]
  12. Carvalho, C.C.C.R.; de Caramujo, M.J. Carotenoids in Aquatic Ecosystems and Aquaculture: A Colorful Business with Implications for Human Health. Front. Mar. Sci. 2017, 4, 93. [Google Scholar] [CrossRef]
  13. Zheng, H.; Liu, H.; Zhang, T.; Wang, S.; Sun, Z.; Liu, W.; Li, Y. Total Carotenoid Differences in Scallop Tissues of Chlamys nobilis (Bivalve: Pectinidae) with Regard to Gender and Shell Colour. Food Chem. 2010, 122, 1164–1167. [Google Scholar] [CrossRef]
  14. Yamada, S.; Tanaka, Y.; Sameshima, M.; Ito, Y. Pigmentation of Prawn (Penaeus japonicus) with Carotenoids. I. Effect of Dietary Astaxanthin, β-Carotene and Cantaxanthin on Pigmentation. Aquaculture 1990, 87, 323–330. [Google Scholar] [CrossRef]
  15. Yanar, Y.; Celik, M.; Yanar, M. Seasonal Changes in Total Carotenoid Contents of Wild Marine Shrimps (Penaeus semisulcatus and Metapenaeus monoceros) Inhabiting the Eastern Mediterranean. Food Chem. 2004, 88, 267–269. [Google Scholar] [CrossRef]
  16. Nègre-Sadargues, G.; Castillo, R.; Segonzac, M. Carotenoid Pigments and Trophic Behaviour of Deep-Sea Shrimps (Crustacean, Decapoda, Alvinocarididae) from a Hydrothermal Area of the Mid-Atlantic Ridge. Comp. Biochem. Physiol. Part A Mol. Integr. Physiol. 2000, 127A, 293–300. [Google Scholar] [CrossRef]
  17. Borisovets, E.E.; Zadorozhny, P.A.; Kalinina, M.V.; Lepskaya, N.V.; Yakush, E.V. Changes of Major Carotenoids in Gonads of Sea Urchins (Strongylocentrotus intermedius and S. nudus) at Maturation. Comp. Biochem. Physiol. Part B Biochem. Mol. Biol. 2002, 132, 779–790. [Google Scholar] [CrossRef] [PubMed]
  18. Hendry, G.A.F.; Houghton, J.D. Natural Food Colorants; Chapman and Hall: London, UK, 1996. [Google Scholar]
  19. Bansemer, M.S.; Qin, J.G.; Harris, J.O.; Duong, D.N.; Hoang, T.H.; Howarth, G.S.; Stone, D.A.J. Growth and Feed Utilisation of Greenlip Abalone (Haliotis laevigata) Fed Nutrient Enriched Macroalgae. Aquaculture 2016, 452, 62–68. [Google Scholar] [CrossRef]
  20. Daume, S. The Roles of Bacteria and Micro and Macro Algae in Abalone Aquaculture: A Review. J. Shellfish Res. 2006, 25, 151–157. [Google Scholar] [CrossRef]
  21. Park, C.-J.; Kim, S.Y. Abalone Aquaculture in Korea. J. Shellfish Res. 2013, 32, 17–19. [Google Scholar] [CrossRef]
  22. Cuesta-Gomez, D.M.; Sánchez-Saavedra, M.D.P. Effects of Dietary Protein and Carbohydrate Levels on Gonad Index, Composition, and Color in the Purple Sea Urchin Strongylocentrotus purpuratus. N. Am. J. Aquac. 2018, 80, 193–205. [Google Scholar] [CrossRef]
  23. Kause, A.; Ritola, O.; Paananen, T.; Eskelinen, U.; Mäntysaari, E. Big and Beautiful? Quantitative Genetic Parameters for Appearance of Large Rainbow Trout. J. Fish Biol. 2003, 62, 610–622. [Google Scholar] [CrossRef]
  24. Katassonov, V.J.; Dementyev, V.N.; Klimov, A.V. Genetics of Color in the Ornamental Carp: The Inheritance of Underlying Dark Coloration. Russ. J. Genet. 2001, 37, 1210–1211. [Google Scholar] [CrossRef]
  25. Zhang, J.; Pan, G. Body Form and Body Colour in Hybrids of Cyprinus Carpio. J. Fish. China 1983, 7, 301–312. [Google Scholar]
  26. Taniguchi, N.; Kijima, A.; Tamura, T.; Takegami, K.; Yamasaki, I. Color, Growth and Maturation in Ploidy-Manipulated Fancy Carp. Aquaculture 1986, 57, 321–328. [Google Scholar] [CrossRef]
  27. Chen, M.; Liu, B.; Ma, B.; Liu, G.; Cao, W.; Liu, X.; Yan, X.; Yang, B.; Wang, C. Selection of a Carotenoid-Rich Scallop Strain, QN Orange, from the Inter-Specific Hybrids between the Bay Scallop and the Peruvian Scallop. Aquaculture 2020, 528, 735513. [Google Scholar] [CrossRef]
  28. Li, X.; Wang, S.; Xun, X.; Zhang, M.; Wang, S.; Li, H.; Zhao, L.; Fu, Q.; Wang, H.; Li, T.; et al. A Carotenoid Oxygenase is Responsible for Muscle Coloration in Scallop. Biochim. Biophys. Acta BBA Mol. Cell Biol. Lipids 2019, 1864, 966–975. [Google Scholar] [CrossRef]
  29. Li, T.; Zhang, Y.; Liu, S.; Li, M.; Yao, R.; Niu, S.; Yuan, J.; Wang, H.; Hu, J.; Bao, Z.; et al. Transcriptome and Network Analyses Reveal Key Pathways and Genes Involved in Response to Carotenoid Deposition in Scallop Muscle. Front. Mar. Sci. 2023, 10, 1158325. [Google Scholar] [CrossRef]
  30. Zhao, Q.; Chen, J.; Zhu, S.; Liu, X.; Ma, B.; Wang, C.; Xu, J.; Yan, X. Pigment Profiling of ‘QN Orange’scallop and ‘Bohai Red’ Scallop Adductor Muscles by Liquid Chromatography Coupled with Triple Quadrupole Mass Spectrometry. Aquaculture 2019, 508, 178–185. [Google Scholar] [CrossRef]
  31. Hoang, T.H.; Qin, J.G.; Stone, D.A.J.; Harris, J.O.; Duong, D.N.; Bansemer, M.S. Colour Changes of Greenlip Abalone (Haliotis laevigata donovan) Fed Fresh Macroalgae and Dried Algal Supplement. Aquaculture 2016, 456, 16–23. [Google Scholar] [CrossRef]
  32. Dang, V.T.; Li, Y.; Speck, P.; Benkendorff, K. Effects of Micro and Macroalgal Diet Supplementations on Growth and Immunity of Greenlip Abalone, Haliotis laevigata. Aquaculture 2011, 320, 91–98. [Google Scholar] [CrossRef]
  33. Hoang, T.H.; Stone, D.A.J.; Duong, D.N.; Bansemer, M.S.; Harris, J.O.; Qin, J.G. Colour Change of Greenlip Abalone (Haliotis laevigata donovan) Fed Formulated Diets Containing Graded Levels of Dried Macroalgae Meal. Aquaculture 2017, 468, 278–285. [Google Scholar] [CrossRef]
  34. Hoang, T.H.; Stone, D.A.J.; Duong, D.N.; Harris, J.O.; Qin, J.G. Changes of Body Colour and Tissue Pigments in Greenlip Abalone (Haliotis laevigata donovan) Fed Macroalgal Diets at Different Temperatures. Aquac. Res. 2020, 51, 5175–5183. [Google Scholar] [CrossRef]
  35. Bansemer, M.S.; Qin, J.G.; Harris, J.O.; Howarth, G.S.; Stone, D.A.J. Nutritional Requirements and Use of Macroalgae as Ingredients in Abalone Feed. Rev. Aquac. 2016, 8, 121–135. [Google Scholar] [CrossRef]
  36. Garcia-Esquivel, Z.; Felbeck, H. Comparative Performance of Juvenile Red Abalone, Haliotis rufescens, Reared in Laboratory with Fresh Kelp and Balanced Diets. Aquac. Nutr. 2009, 15, 209–217. [Google Scholar] [CrossRef]
  37. Wei, X.; Yang, B.; Zeng, W.; Tang, B.; Huang, M.; Luo, X.; You, W.; Ke, C. Carotenoid Accumulation in Common and Orange-Muscle Mutant of Abalone, Haliotis gigantea, Fed with Different Macroalgae. Aquac. Nutr. 2022, 9287594. [Google Scholar] [CrossRef]
Figure 1. Correlation between different color values (a*) and total carotenoid content (TCC) in the abalone foot muscle. Each dot represents an individual abalone.
Fishes 08 00443 g001
Figure 2. Comparison of foot-muscle color-difference values (a*) for F1 offspring abalones in groups AL, AS, BL, and BS. The red dashed line indicates the initial a* value of Group A, and the green dashed line represents the initial a* value of Group B. Different letters signify significant differences between groups (p < 0.05).
Fishes 08 00443 g002
Figure 3. Comparison of shell length, weight and fatness gain ratio of abalone in 4 groups (mean ± SD, n = 20). (a) Shell length increase ratio; (b) Dry weight increase ratio; (c) Body mass increase ratio. Means with different letters are significantly different (p < 0.05).
Fishes 08 00443 g003
Table 1. Progeny separation of foot-muscle color in F1 lineage of H. gigantea.
Parental Combination (Female × Male)
RR × RRSS × SSRR × SSSS × RR
Progeny separation (SS:RR)RR-1: 0:94 (0:1)
RR-2: 9:852 (0:1)
RR-3: 0:230 (0:1)
RR-4: 0:450 (0:1)
SS-1: 130:0 (1:0)
SS-2: 43:15 (3:1)
SS-3: 312:97 (3:1)
RS-1: 163:0 (1:0)
RS-2: 540:0 (1:0)
RS-3: 850:0 (1:0)
RS-4: 551:0 (1:0)
RS-5: 137:0 (1:0)
RS-6: 106:0 (1:0)
SR-1: 140:0 (1:0)
SR-2: 39:47 (1:1)
RR represents orange-footed parents, SS represents common-footed parents.
Table 2. Analysis of carotenoid content of two type of feeds (mean ± SD).
DietCarotenoid (mg/kg)
Zeaxanthin β -Carotene
Formulated feed130.33 ± 3.68 a149.33 ± 4.11 a
G. lemaneiformis126.29 ± 15.96 a143.95 ± 8.73 a
Differences denoted by distinct letters within the same column are statistically significant (p < 0.05).
Table 3. Analysis of nutrient composition of two experimental feeds (mean ± SD).
DietAsh
(%)
Moisture
(%)
Crude Protein
(%)
Crude Lipid
(%)
Crude Carbohydrate
(%)
Formulated feed10.69 ± 0.57 a6.55 ± 0.04 a40.00 ± 0.50 a3.58 ± 0.23 a39.18 ± 0.97 a
G. lemaneiformis17.52 ± 0.01 b90.37 ± 0.41 b15.91 ± 5.39 b1.74 ± 0.11 b64.83 ± 1.89 b
Differences denoted by distinct letters within the same column are statistically significant (p < 0.05).
Disclaimer/Publisher’s Note: The statements, opinions and data contained in all publications are solely those of the individual author(s) and contributor(s) and not of MDPI and/or the editor(s). MDPI and/or the editor(s) disclaim responsibility for any injury to people or property resulting from any ideas, methods, instructions or products referred to in the content.

