Article

Estuarine-Specific Migration of Glass Eels in the Ems Estuary

by
Jeroen B. J. Huisman
1,2,*,
Henry J. Kuipers
2,
Leopold A. J. Nagelkerke
1,
Peter Paul Schollema
3 and
Inge van der Knaap
2
1
Aquaculture & Fisheries Group, Wageningen University & Research, 6700 AH Wageningen, The Netherlands
2
Coastal and Marine Systems Group, Van Hall Larenstein University of Applied Sciences, 8901 BV Leeuwarden, The Netherlands
3
Water Authority Hunze en Aa’s, 9640 AD Veendam, The Netherlands
*
Author to whom correspondence should be addressed.
Fishes 2023, 8(8), 392; https://doi.org/10.3390/fishes8080392
Submission received: 31 May 2023 / Revised: 5 July 2023 / Accepted: 18 July 2023 / Published: 27 July 2023
(This article belongs to the Special Issue Biology and Ecology of Eels)

Abstract

:
Understanding recruitment of glass eels in estuaries is crucial for the conservation of the European eel (Anguilla anguilla). However, basic knowledge on estuarine-specific glass eel migration, including in estuarine harbours, is mostly lacking. Therefore, we studied glass eel migration in the Dutch–German Ems estuary and the harbour at Delfzijl (The Netherlands) and tagged glass eels with Visual Implant Elastomer tags (VIE tags). We released 2000 tagged glass eels into the Ems estuary itself and 1000 tagged glass eels into the tidal harbour at Delfzijl. At three estuarine locations, i.e., Delfzijl–Duurswold, Termunterzijl, and Nieuwe Statenzijl, glass eel collectors were strategically placed, each location being progressively situated further upstream in the Ems estuary. Most glass eels (nuntagged = 97,089, ntagged = 74) were caught at Nieuwe Statenzijl, although this location is much further upstream. Lower numbers of glass eels (nuntagged = 1856, n tagged = 31) were caught at Delfzijl–Duurswold and Termunterzijl (nuntagged = 1192, ntagged = 7). Glass eels arrived approximately a week earlier at Nieuwe Statenzijl than at the other two locations, and the migration speed of tagged glass eels was highest at Nieuwe Statenzijl (>2 km/day) and lower (<1 km/day) at Delfzijl–Duurswold. Our study highlights that migration and the resulting potential recruitment of glass eels in estuaries and harbours may vary considerably both spatially and temporally. Further research on estuarine-specific factors that influence glass eel migration, such as the (anthropogenically altered) tidal action and flow, will provide valuable information on what influences glass eel migration in estuaries.
Key Contribution: Specific characteristics of estuaries may guide glass eel migration towards freshwater entry points. The resulting spatially and temporally variable migration of glass eels can have catchment-wide implications on recruitment. The assessment of factors influencing glass eel migration in estuaries, including anthropogenic impacts, is instrumental for effective prioritization of mitigating measures such as fish passes.

1. Introduction

Estuaries around the world are affected by a myriad of anthropogenic impacts [1]. In the Wadden Sea, located in the south-eastern part of the North Sea, this has led to reduced numbers and even the extinction of estuarine and diadromous species [2]. The once common European eel (Anguilla anguilla) now has an endangered status [3,4]. The eel is a catadromous species and depends on the inland migration of juveniles (glass eels). Estuarine migration is an important bottleneck for glass eel recruitment [5] and thus there is an urgent need to understand the mechanisms driving glass eel migration in estuaries and the resulting glass eel recruitment in tributaries [6]. Additionally, the recruitment indices of glass eels are of major importance in stock assessment [7].
Drouineau et al. [7] modelled glass eel recruitment and assumed that recruitment is a function of the surface area, also raising the question of how glass eels are distributed in estuaries. Some authors report that currents from freshwater entry points and tides are both important directional orientation cues in estuaries [8]. However, Able et al. [9] ascribes the variability in catches of American glass eel (A. rostrata) at several tributaries to the difference in the volume of water flowing through both inlets of Barnegat Bay estuary. Glass eel recruitment at freshwater entry points in an estuary could therefore simply be a function of distance, i.e., tributaries furthest from the entrance of the estuary receive fewer glass eels.
Glass eels are poor swimmers and the utilisation of tidal flows is recognized as an important factor guiding glass eel migration [10,11]. Glass eels move up in the water column during flood tides [8] but the precise timing is unknown. Other fish species, such as flounder larvae (Platichthys flesus), are present in higher densities just after slack tides and before the middle of flood tides [12], indicating partial use of a single flood tide, and this behaviour may apply to glass eels as well. The available flood tidal flow may therefore function as a conveyer belt for upstream migrating glass eels [6]. In utilising these tidal currents, glass eels are aided by rheotactic orientation and magnetic imprinting to ascertain an upstream direction of migration [13]. Beaulaton et al. [14] demonstrated that glass eels may partially use available flood tides to migrate upstream in the Gironde estuary. The partial use of available tidal flows by glass eels could lead to faster or slower progression depending on estuary-specific tidal flow characteristics. The tidal flow, tidal amplitude, and duration of the different stages of the tide in an estuary are determined by estuary-specific characteristics, such as size, shape, and depth. Indeed, even seemingly similar estuaries like the Elbe, Weser and Jade, and Ems highly differ with regard to flood tide, salinity, and sea level [15].
Like many estuaries around the world, the Ems estuary is regularly dredged. As a result, maximal flood tidal flow velocities in the Ems are now reached just 1 h after slack tides [16], and may exceed 2 m/s [17]. Anthropogenically altered tidal flows may affect glass eel migration (and tidal migrants in general) in estuaries, as they use tidal transport to move upstream in the estuary. Estuarine-specific (high) tidal flows may inhibit the migration of glass eels (or other tidal migrants) towards freshwater entry points that are located perpendicular to the main tidal flow and thus may favour glass eel migration towards more upstream locations. We therefore expected higher glass eel numbers at the end of the estuary. Activities within tidal harbours, such as dredging, may further exacerbate migratory problems for glass eels. Increased silt loads due to dredging could be one of the contributing factors in the mortality of glass eels [18] or provoke avoidance behaviour. However, Pavlov et al. [19] did not find any avoidance reaction to high turbidity in elvers of two eel species.
To understand the distribution and recruitment of glass eels in the Dutch Ems estuary, we performed a mark–recapture experiment in which we tagged glass eels with Visible Implant Elastomer tags (from here on VIE tags). We aimed to determine migration patterns and the timing of the arrival of glass eels at three freshwater entry points in the Dutch Ems estuary: Delfzijl, Termunterzijl, and Nieuwe Statenzijl. The industrial harbour of Delfzijl and recreational harbour of Termunterzijl are situated perpendicular to the main tidal flow and Nieuwe Statenzijl is located at the end of the Ems estuary. We also released VIE-marked glass eels within the Delfzijl harbour channel to determine the migration speed and arrival of glass eels in Delfzijl harbour.

2. Materials and Methods
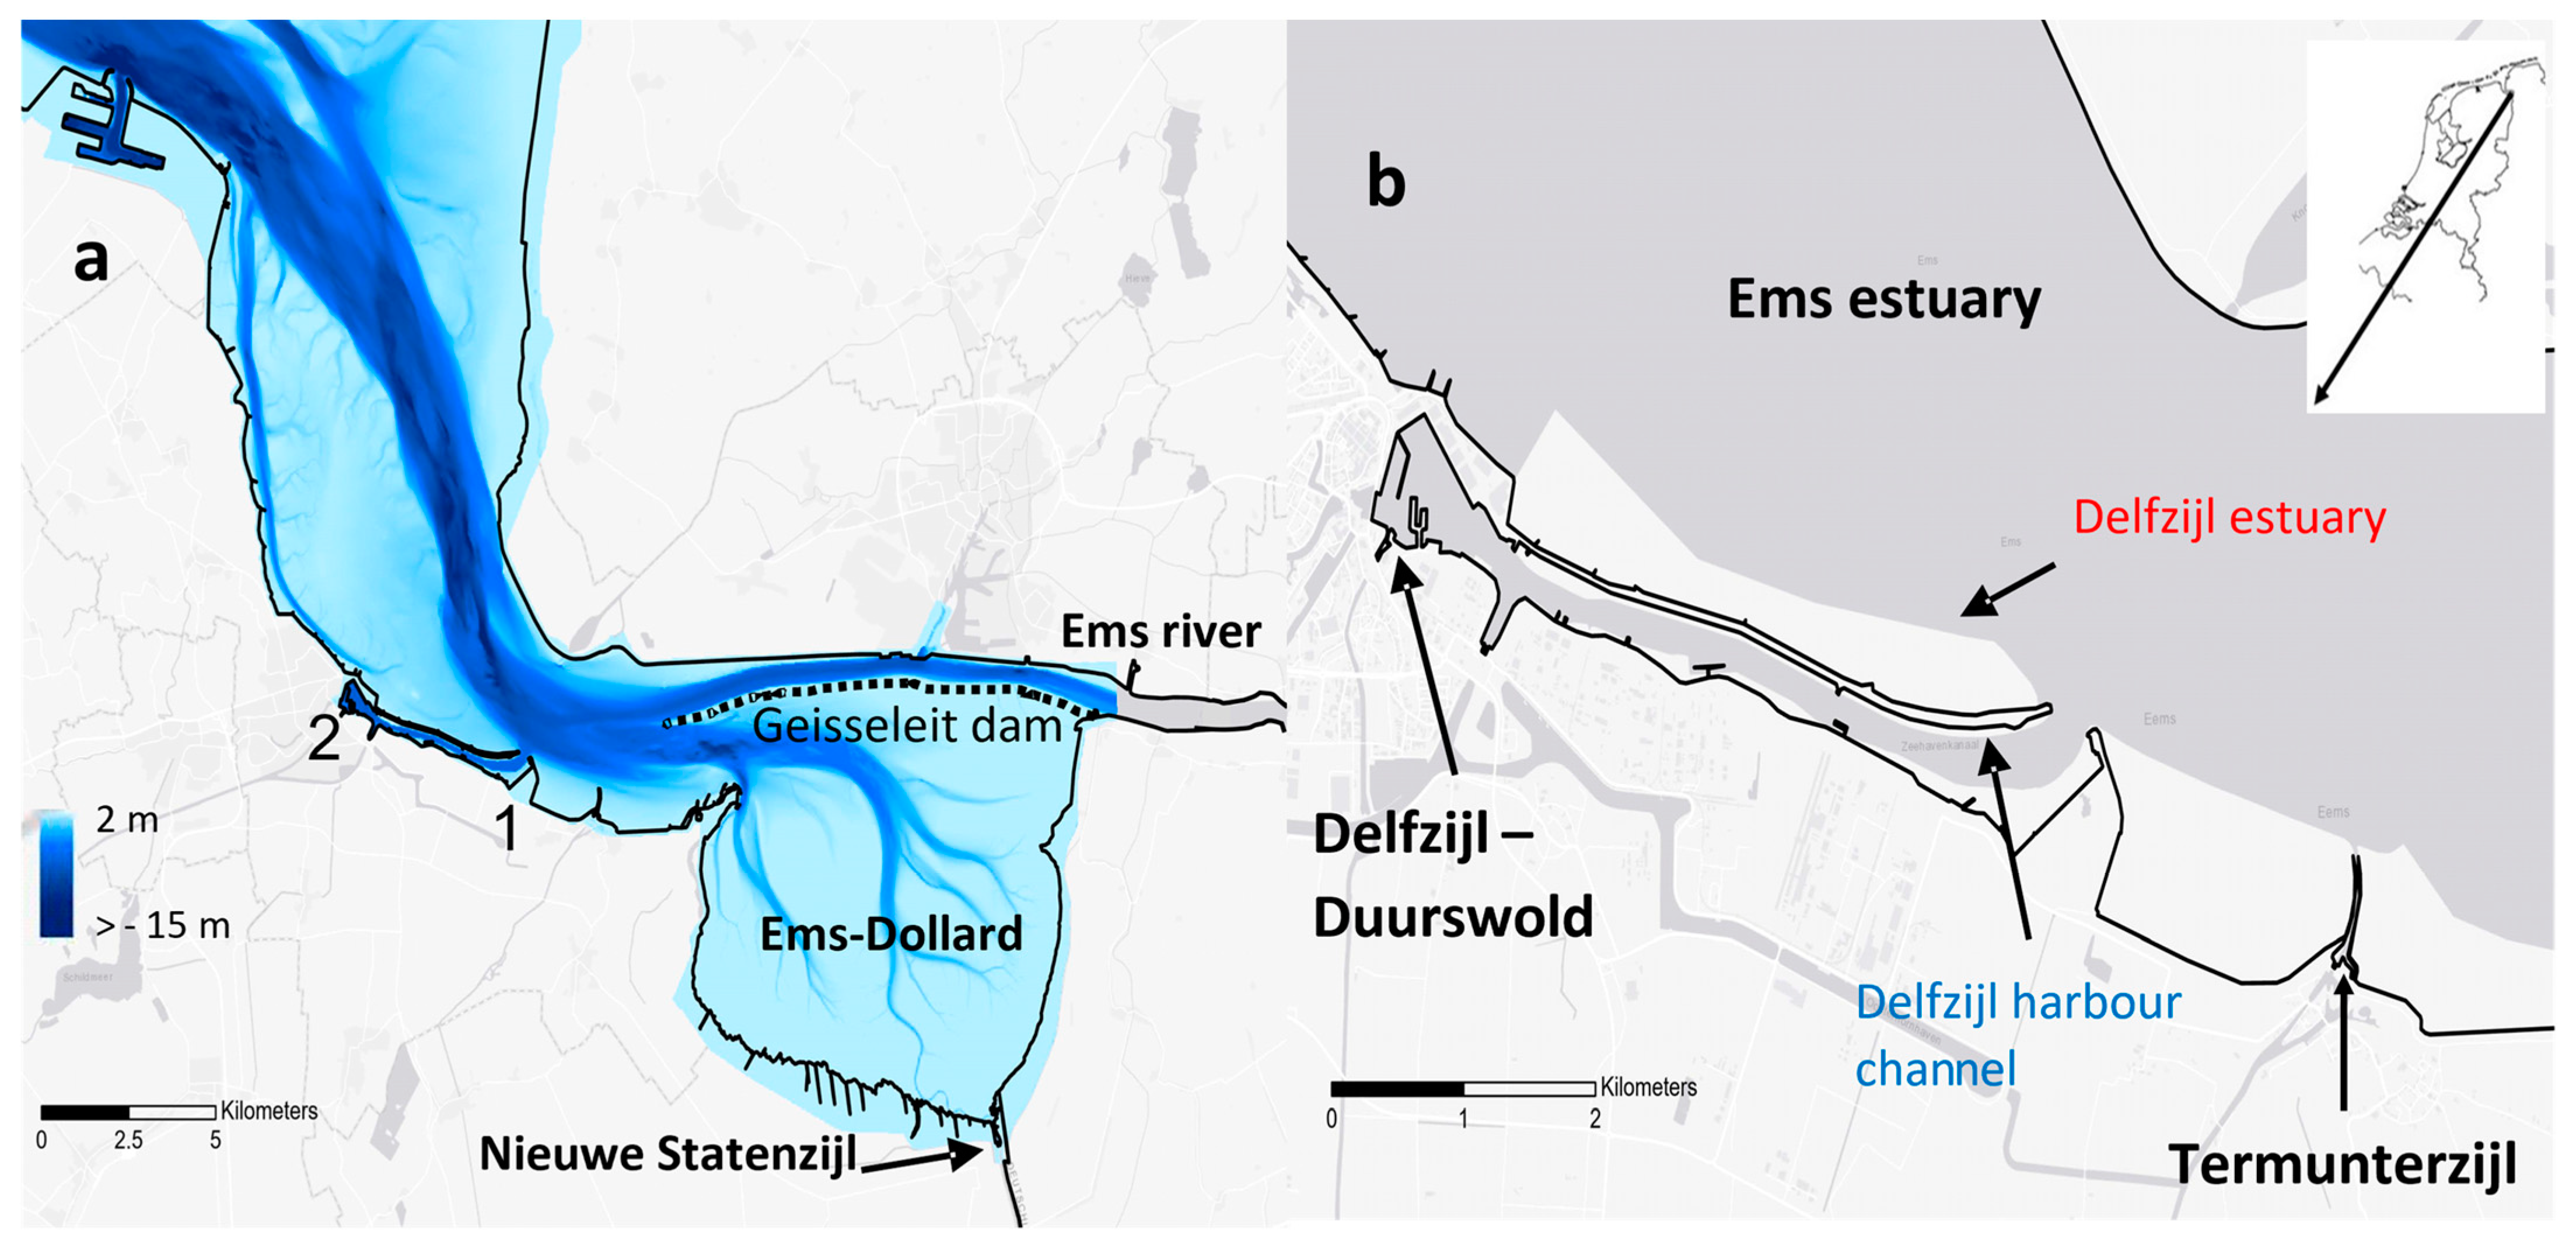
2.1. Study Area

The Dutch–German Ems estuary (Figure 1a) is used for industrial activities and includes the port of Delfzijl. Dredging and construction measures in harbours greatly altered the physical processes in the Ems river, including an increased tidal range [20]. The tidal amplitude in the Ems estuary is ca. 3 m [21]. The Ems–Dollard is part of the Ems estuary and is designated under the Habitats Directive [22] and is separated from the tidal Ems river by the Geisseleit dam (Figure 1b). There are four freshwater entry points in the industrial harbour of Delfzijl; in this study we focussed on one, the pumping station and sluice complex Delfzijl–Duurswold. The tidal amplitude in the harbour of Delfzijl is also ca. 3 m [23]. Termunterzijl is a small recreational harbour and is situated a few kilometres south of the harbour of Delfzijl (Figure 1b). The opening of both harbours is situated perpendicular to the main tidal flow in the Ems estuary (Figure 1b). The discharge sluice of Nieuwe Statenzijl is located at the end of the Ems–Dollard basin (Figure 1a). The catchments sizes of the freshwater entry points are Nieuwe Statenzijl (89,000 ha), Termunterzijl (18,808 ha), and Delfzijl–Duurswold (21,524 ha). Glass eel fisheries are not allowed in the Ems estuary.

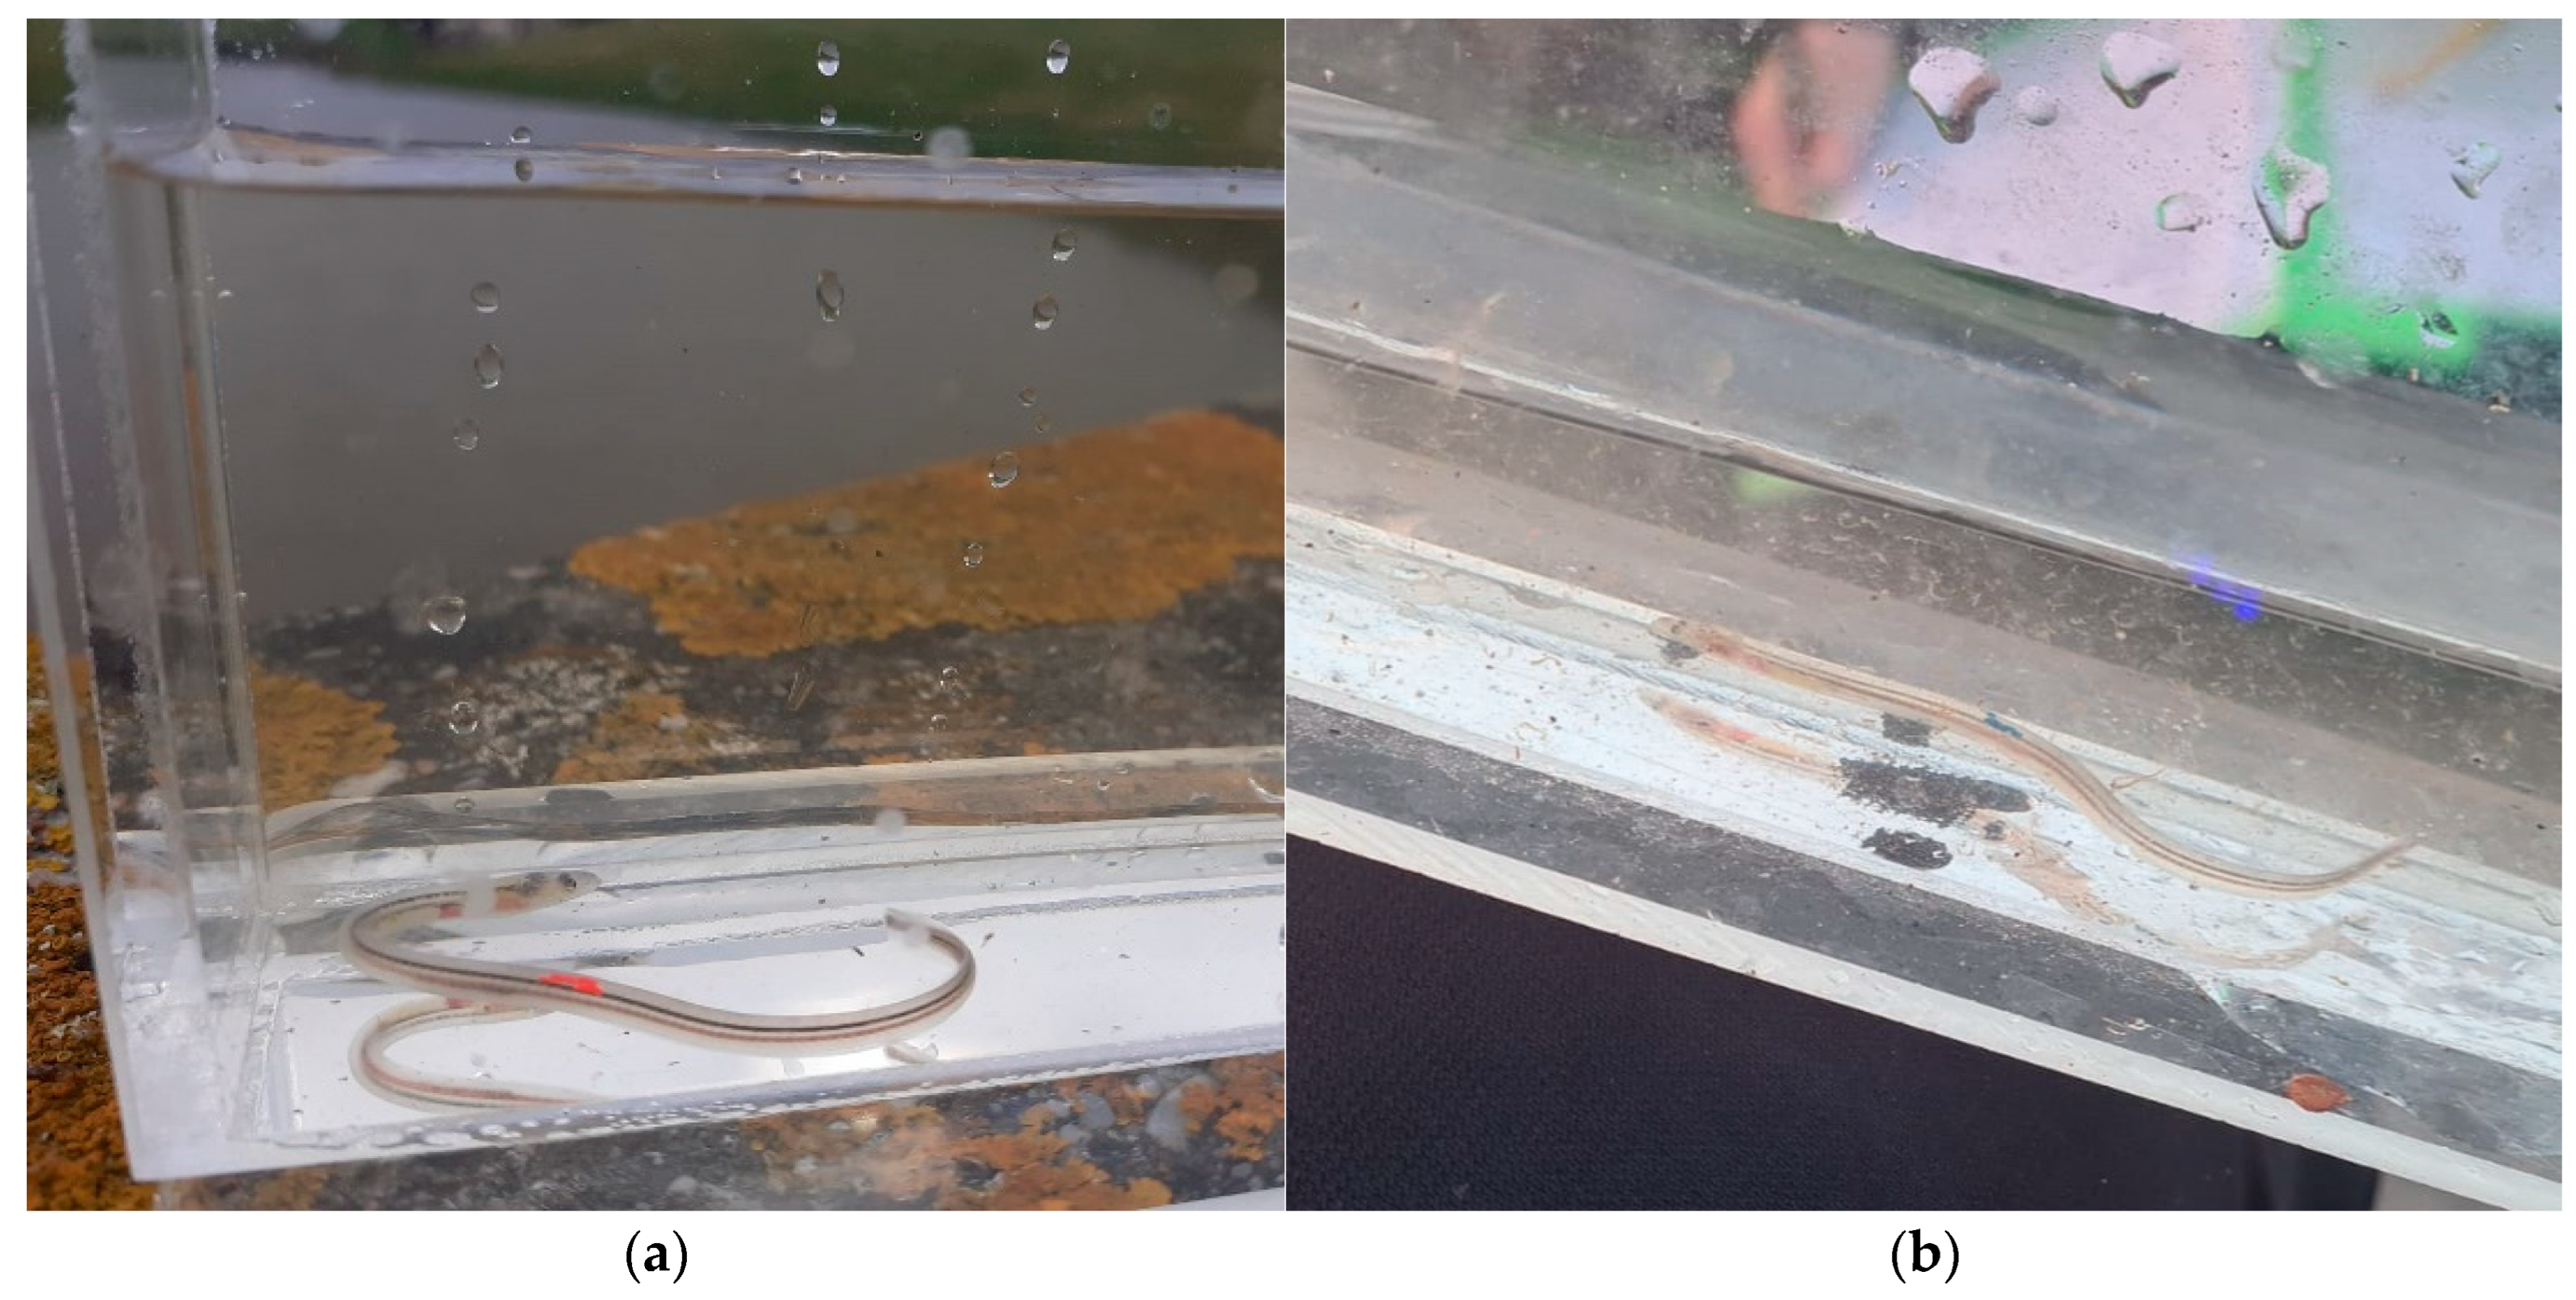
2.2. Mark–Recapture of Glass Eels

To assess migration of glass eels towards the freshwater entry points at Delfzijl–Duurswold, Termunterzijl, and Nieuwe Statenzijl (Figure 1a,b), we designed a mark–recapture experiment using VIE tags. VIE tags have been used to mark small fish [24,25]. VIE tags do not affect glass eel survival [26], supporting their suitability for mark–recapture experiments on glass eels in estuaries.
We VIE-tagged a total of 3000 glass eels. Tagged glass eels were caught (between 22nd and 25 April 2022) at the fish pass adjacent to the pumping station of Roptazijl. Roptazijl is located ~100 km west of the Ems estuary (Friesland, The Netherlands). Glass eels were caught on the sea side using a lift net (1 m2, mesh size 1 mm) that was lowered in front of the inlet of the fish passage and lifted every 10 min for a 6 h period from low to high tide. Caught glass eels were temporally held inside the pumping station in large tubs (65 L) with aerated salt water which was temperature controlled at 5–8 °C for a maximum of 3 days. The glass eels were then transported to the research laboratory at the Van Hall Larenstein Applied Sciences University, Leeuwarden. On the 25 April 2022, all 3000 glass eels were tagged (Figure 2).
VIE tags were inserted on the dorsal side of the glass eel at approximately half of the body length (Figure 2), using a syringe with 0.3 mm needle. Glass eels were anaesthetised using 0.4 mL/L 2-phenoxyethanol and individually tagged with a red or blue VIE tag. After marking, the sedated glass eels were placed in a recovery tub and, after recovery, in large, aerated holding tanks with salt water and a water temperature of 5–8 °C.
On 26 April, the glass eels were transported in aerated tanks with salt water and released at two release sites. To study glass eel migration in the Ems estuary, we released 2000 red-VIE-tagged eels at “Delfzijl estuary” (53.321° N, 6.996° E) (Figure 1b). To study glass eel migration in industrial harbours, we released a batch of 1000 blue-VIE-tagged eels at “Delfzijl harbour channel” (53.315° N, 6.994° E) (Figure 1b) on the inside of the harbour of Delfzijl. The number of VIE-tagged glass eels in the harbour was smaller, as the distance between the release site and the sampling site is smaller (ca. 5 km), and hence the probability of recapture is higher. The two release sites are henceforth named ‘Delfzijl estuary’ and ‘Delfzijl harbour channel’. Glass eels prefer the edges of estuaries [27,28] and were therefore released in the nearshore zone in ca. 0.5 m deep water. In addition, glass eels were released just after low tide and 4 days before spring tide, adhering to natural migration processes [29].
To study recruitment of glass eels and recapture VIE-tagged glass eels, we used eel collectors adapted from an earlier design of Bult et al. [30]. We placed collectors at two locations situated perpendicular to main tidal flow: Delfzijl–Duurswold and Termunterzijl. We placed a glass eel collector in front of the pumping station–sluice complex at Delfzijl–Duurswold, which is located in the industrial harbour of Delfzijl. For practical reasons, it was not possible to place Delfzijl–Duurswold collectors at the other freshwater entry points in the harbour of Delfzijl. We also placed a glass eel collector in the small recreational harbour of Termunterzijl. The glass eel collector was placed adjacent to the pumping station near the opening of the harbour. To determine glass eel migration at the end of the estuary, a collector was placed at the discharge sluice at Nieuwe Statenzijl (Figure 1b).
The eel collector consisted of a 0.6 m × 0.6 m × 0.6 m holding tank in a floating container. A funnel with a 1 × 1 mm mesh size allowed glass eels to enter the collector. The opening (0.1 m diameter) of the collector was ~0.2 m below the surface of the water and freshwater was pumped from the polder side over the dike into the collector, creating a flow of freshwater on the estuary side of ~4 L/s. For practical reasons and because glass eels prefer the sides of water courses [28], the collectors were placed near walls in the vicinity of the discharge points. We used UV light torches to ensure detection of VIE-tagged glass eels [31].

2.3. Data Collection

The collectors were emptied daily at high tide for a total of 25 days between 26 April and 20 May 2022. We recorded daily catches of untagged and VIE-tagged glass eels at Delfzijl–Duurswold, Termunterzijl, and Nieuwe Statenzijl. We also collected data on environmental variables during our data collection period. The average daily water temperature (in °C) was calculated for all three recapture locations using data from the closest measurement buoy in the estuary, ‘Randzelgat Noord boei’ (waterinfo.rws.nl). The tidal difference was defined as the difference between the daily maximum and minimum of the tide per location as a measure for tidal flow, i.e., the higher the difference, the higher the tidal flow will be. Water level (ca. 15 min) and daily discharge (m3/day) data of all discharge points were obtained from the Waterschap Hunze en Aa’s. The moon phase was included as the daily percentage of moon fullness, in which 0% is a new moon and 100% is a full moon, and was calculated from r-package lunar v0.2-1 [32].

2.4. Data Analysis

2.4.1. Analyses of Total Glass Eels Caught

We used a negative binomial generalized additive model (NB GAM) with a log-link function in R (mgcv version 1.8-35) to test the daily total catches of glass eels at Delfzijl–Duurswold and Nieuwe Statenzijl as a function of the fixed covariates: catch location, daily tidal difference, maximal daily difference between maximum and minimum sea water level (m), day of the year, mean daily water surface temperature (°C), discharge (m3/day), and moon phase (%). An NB GAM was chosen because of the nonlinear relationship between day of the year and daily catches at Delfzijl–Duurswold and Nieuwe Statenzijl [33]. The log link function in the model ensures positive fitted values. A negative binomial distribution is typically used for over-dispersed count data, which we found when comparing the variance of the catch data to the mean. Visual inspection of the moon phase in relation to the day of the year showed a high correlation (r = 0.92, p < 0.001), and therefore the moon phase was not included in the model. The initial NB GAM included all main covariates plus a smoother for day of the year for both catch sites, the interaction between daily tidal difference and catch location, and the interaction between daily water temperature and catch location. We kept our focus covariates, catch location and tidal difference, in our final model, and used backwards model selection to select the model that best fitted the data. A control covariate was only included in the model when including it substantially improved the Akaike information criterion (AIC) (i.e., the AIC was reduced by more than 2 units) [34]. Temporal autocorrelation between subsequent days within a catch location did not need to be taken into account based on the low autocorrelation and partial autocorrelation values in the daily catch of glass eels. As a result of the very low numbers of glass eels that were caught at Termunterzijl, this location was not used in the analyses.

2.4.2. Recapture Probability

We used a binomial GLM (r-package stats version 4.1.0) with a logit link function to assess the effect of release location (i.e., Delfzijl estuary or Delfzijl harbour channel) on the recapture probability of the 3000 VIE-tagged glass eels. Per recapture location (i.e., Delfzijl–Duurswold and Nieuwe Statenzijl), one model was made. Binomial GLMs were used because of the binary response variable (1 = recaptured, 0 = not recaptured).

2.4.3. Migration Speed

The migration speed was defined as the time in days between release and recapture location of the VIE-tagged glass eels (105 in total) that were caught in relation to the distance between the release site and sampling location. We used a negative binomial GLM (r package glmmTMB version 1.1.4) [35] with a log link function to assess the effect of release location (i.e., Delfzijl estuary or Delfzijl harbour channel) and recapture location (i.e., Delfzijl–Duurswold and Nieuwe Statenzijl) on the glass eel migration speed (km/day). A negative binomial distribution was used to account for the overdispersion in the migration speed count data, which we found when comparing the variance to the mean. To account for the difference in distance between the two release locations and recapture locations, we included the natural logarithmic of the difference in distance between release and recapture locations (km) as an offset variable. Our initial migration speed NB GLM included covariates: release location (i.e., Delfzijl estuary or Delfzijl harbour channel), recapture location (i.e., Delfzijl–Duurswold and Nieuwe Statenzijl), and the interaction between release and recapture locations. We used backwards model selection, dropping covariates, to find the model with the lowest AIC. Using the r-package emmeans (version 1.7.1-1) [36], we performed a pairwise comparison for the combination of the interaction between release and recapture location.
For all final models, we performed residual diagnostics using the DHARMa R package version 0.4.5 [37]. Plots of the residuals versus the continuous covariates of the analysis of the total catches showed nonlinear patterns, which is why we included a smoother for the day of the year for both collector locations. The residual plots of the recapture probability and migration speed analysis did not show a clear nonlinear pattern, and therefore it was not necessary to model nonlinear patterns.

2.5. Animal Welfare

This research was conducted in accordance with the animal welfare protocol number VD7110020197584.

3. Results

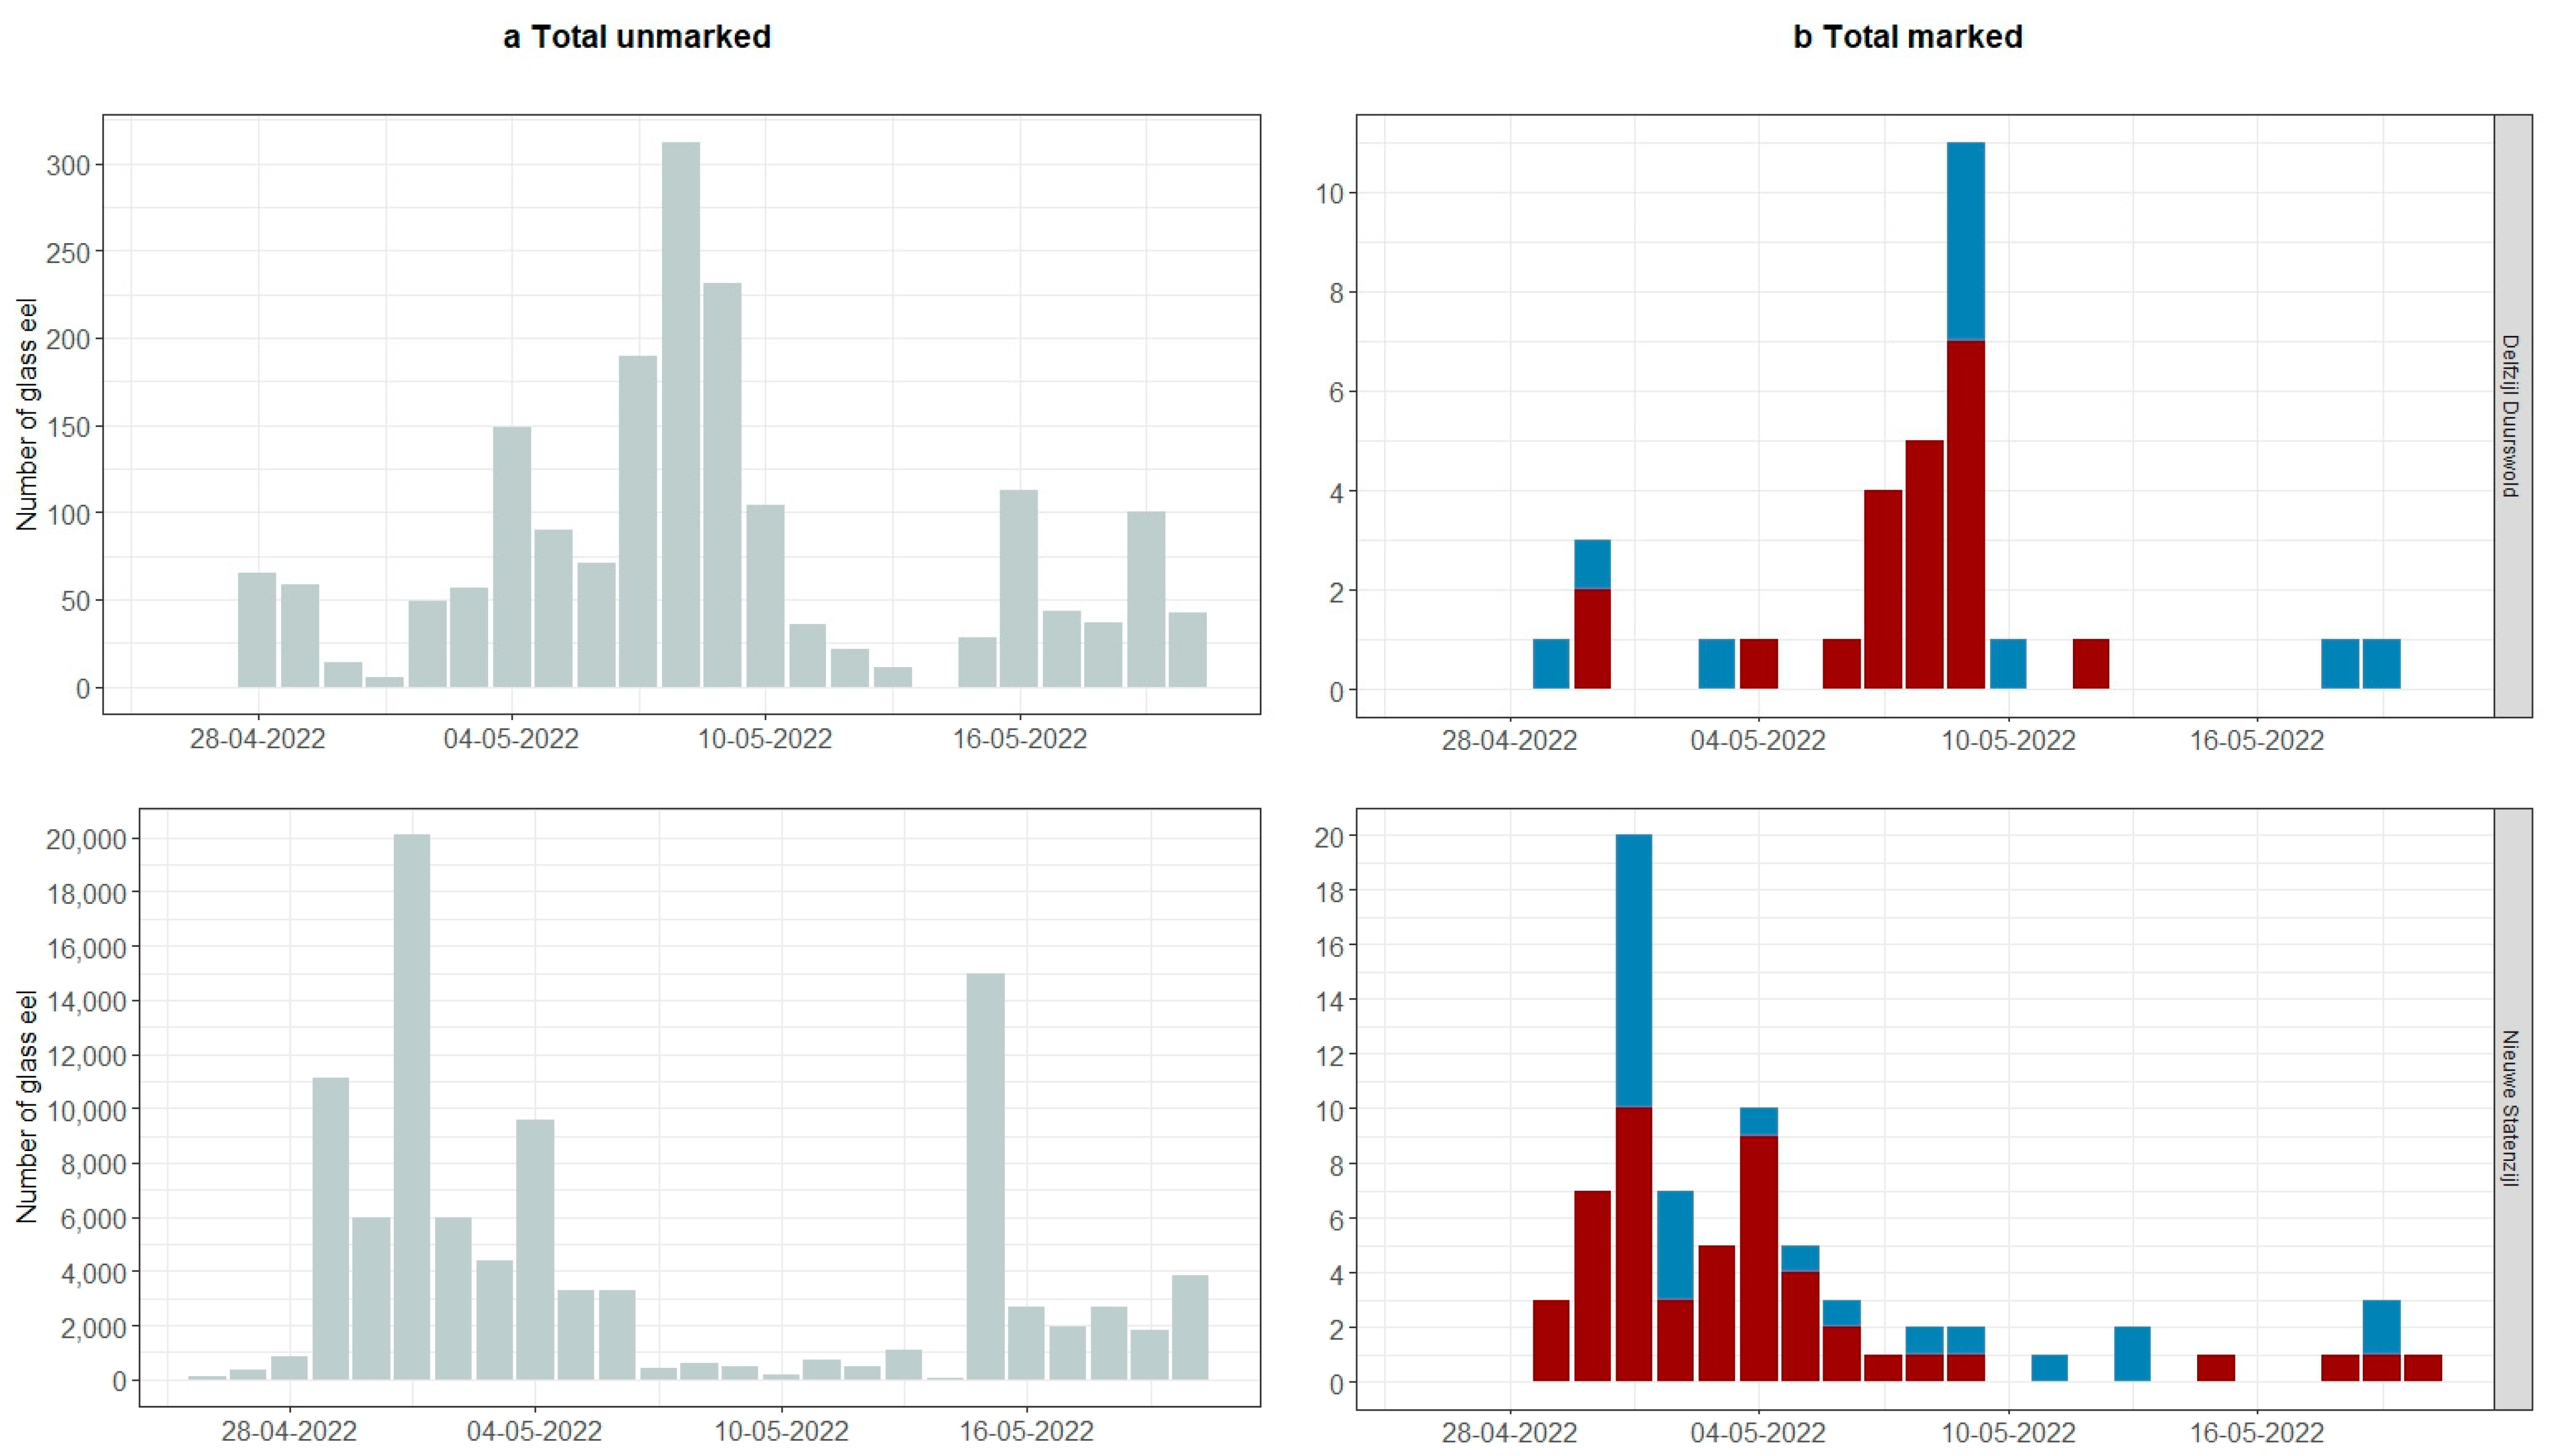
3.1. Spatial and Temporal Arrival of Glass Eels at Freshwater Entry Points in the Estuary

During our research period (26 April 2022–20 May 2022), high numbers of glass eels were caught at Nieuwe Statenzijl (n = 97.089), the furthest location from both release sites. Low numbers of glass eels were caught at Delfzijl–Duurswold (n = 1.856) and Termunterzijl (n = 1.192) (Table 1). The peaks of tagged glass eels mimicked the peaks of the arrival of untagged glass eels (Figure 3). The total recapture rate of VIE-tagged glass eels released in Delfzijl harbour and Delfzijl estuary was 3.5% and 3.9%, respectively.
The final NB GAM to investigate daily catches of glass eels included the recapture location (Delfzijl–Duurswold and Nieuwe Statenzijl), the daily tidal difference per recapture location, and two smoothers for the day of the year by location (Table 2). We found that the daily catches of glass eels were significantly different (p < 0.001) between Nieuwe Statenzijl and Delfzijl–Duurswold. At Nieuwe Statenzijl, the catch size was 32 (95% CI [18.31–56.02]) times higher than at Delfzijl–Duurswold. We found no significant influence of the tidal difference on the daily catch size (p = 0.50).
At Delfzijl–Duurswold, most glass eels were caught on 8 May and at Nieuwe Statenzijl on the 1 May (Figure 3a). This earlier peak in the number of caught glass eels at Nieuwe Statenzijl was reflected by the modelled predicted catch sizes per day and location (Figure S1). At both locations, the total daily catch of glass eels depended on the day of the year (p = 0.003 and p < 0.001, respectively) (Figure S1).

3.2. Recapture of VIE-Tagged Glass Eels

Of the 2000 VIE-tagged glass eels released in the estuary, 21 migrated to Delfzijl–Duurswold, 6 were caught at Termunterzijl, and 50 migrated towards Nieuwe Statenzijl (Table 1). Of the 1000 VIE-tagged glass eels released in Delfzijl harbour, 10 were caught at Delfzijl–Duurswold, 1 was caught at Termunterzijl, and 24 were caught at Nieuwe Statenzijl (Table 1). The recapture probability of catching VIE-tagged glass eels from either of the two release sites did not differ significantly for location: Delfzijl–Duurswold (Wald X2 = 0.016, df = 1, p = 0.90) and Nieuwe Statenzijl (Wald X2 = 0.027, df = 1, p = 0.87) (Figure S2).

3.3. Migration Speed

The final NB GLM to investigate the migration speed included release location with an interaction with recapture location (Table 3). The release site and recapture location had an interactive effect on the migration speed (p = 0.013). The average migration speed of the glass eels caught at Delfzijl–Duurswold differed significantly between the two release sites (p = 0.003, Figure 4); this was not the case for Nieuwe Statenzijl (p = 0.83, Figure 4). Overall, the migration speed of glass eels caught at Nieuwe Statenzijl was higher than glass eels caught at Delfzijl–Duurswold (p < 0.001, Table 3, Figure 4).

4. Discussion

4.1. Spatial Variation of Glass Eels

This study shows that recruitment of glass eel at tributaries in an estuary is not necessarily a function of the distance from the opening of the estuary. On the contrary, our results show that the highest number of glass eels (tagged and untagged) was found at Nieuwe Statenzijl, the tributary furthest from the opening of the estuary. Low catches of glass eels at Termunterzijl and Delfzijl may indicate that anthropogenically altered tidal flows hinder glass eel migration towards locations that are situated perpendicular to the main tidal flow. The glass eel migration speed was the highest at the furthest location, i.e., Nieuwe Statenzijl. We will discuss glass eel catches and migration speed in the light of estuarine-specific tidal flows and anthropogenic impacts in the estuary and harbour of Delfzijl.
Catches of untagged glass eels and tagged glass eels show similar spatial and temporal patterns (Figure 3) per location, resembling the migration patterns of all glass eels in the Ems. In addition, the recapture rate for VIE-tagged glass eels for both release sites was 3.5% and 3.9%, which is similar to other studies. Using dyes, Aprahamian and Wood [38] reported recapture rates of 1.3–4.4% in the Severn estuary and Briand et al. [39] reported recapture rates of 0.4% to 3.7% at several locations in the Vilaine estuary.
The pronounced difference in catches of glass eels between sampled locations was unexpected. Tidal flow is a well-known factor in estuaries with regard to glass eel migration [11,40]. However, most glass eels do not utilize all available flood tidal flows [14], but may skip a tide or partially use a single flood tide. In addition, Gascuel [41] found that only 10% of glass eels use the full flood tides to migrate upstream in a small French estuary. As such, a prime explanation for the pronounced difference in glass eel catches could be the estuarine-specific (tidal) flow conditions. Indeed, the Ems estuary can be classified as a flood-dominated system [42]. The flood tidal flow curve has been altered by human activity, resulting in unnaturally fast flood tidal flows shortly after ebb tides [19]. This may especially affect glass eels, as they move up in the water column after slack tides to utilize flood tidal flows.
Can the tidal flow characteristics of the Ems estuary fully explain the low catches of tagged and untagged glass eels at Delfzijl? Fitri [43] has shown that the angle of approach contributes to nearshore hydro-morphodynamical responses to coastal structures in sediment dynamics, and this could therefore impact tidal migrants such as glass eels as well. As a result of breakwater dams [44], the entrances of the harbours at Delfzijl and Termunterzijl are located perpendicular to the main tidal flow. Therefore, high flood tidal flows (>1 m/s) in the Ems estuary [16] could mean that glass eels are mechanistically hindered in their migration towards both harbours, i.e., washed past the harbour entrances. This notion is supported by the fact that glass eels are considered to be weak swimmers that can sustain a swimming speed of 15 cm/s for 60 min [45].
In addition, two-thirds of the flood tidal flow in the Ems estuary is pushed in to the large Ems–Dollard basin [46], probably due to the shape of the estuary and the Geiseleitdam (Figure 1b). Able et al. [9] suggested that the volume of water exchanged through two inlets between the sea and an estuary could explain spatial variations in glass eel recruitment at tributaries. As such, glass eels may utilize the anthropogenic (high) flood tidal flow and are subsequently pushed by the volume of the (tidal) flow towards Nieuwe Statenzijl.
Some authors point to the discharge of tributaries as directional factors influencing glass eel migration [8,47]. The discharge of freshwater into the harbour of Delfzijl is intermittent and occasionally high (Figure S3), and this may influence [48] the attractiveness of the freshwater entry points for glass eels. However, lower numbers of glass eels were caught in Termunterzijl even though discharge at this location was more continuous (Figure S3). Some models assume that the glass eel distribution is a function of catchment size [7], as catchment size affects discharge. The catchment size of Nieuwe Statenzijl is ca. 4 times larger than the other two catchments. However, the number of glass eels caught at Nieuwe Statenzijl was ca. 32 times higher than at Delfzijl–Duurswold. Furthermore, Nieuwe Statenzijl is located further upstream, and its discharge will be diluted in the large Ems–Dollard basin. Therefore, we believe that the catchment size and/or discharge cannot explain the large difference in glass eel catches at freshwater entry points in the Ems estuary. The sampling locations at Termunterzijl and Delfzijl are in the vicinity of extensively used shipping locks. However, shipping locks are ineffective as a primary fish migration solution [49] and this could be due to the intermittent flow coming from sluicing events. Indeed, glass eels may be less attracted to pumping stations with a low frequency of pumping activity [48].
Some of the glass eels released in the harbour of Delfzijl migrated out into the estuary, pointing towards more local disturbances in the harbour itself. Verwilligen et al. [23] reported that daily dredging of the harbour entrance results in a high sediment load and that the bottom of the harbour channel consists of fluid mud. However, other anthropogenic disturbances such as industrial wastewater discharges or other harbour-related activities cannot be excluded. Importantly, tidal harbours are often situated in a pivotal position in the connection between the estuarine and/or marine environment and the rivers in the hinterland. Further research is needed to determine the possible effects of harbour-related activities on glass eel migration and fish migration in general.

4.2. Temporal Distribution and Migration Speed of Glass Eels

Although Nieuwe Statenzijl is ca. 12 km further from the release sites than Delfzijl, the peak of glass eels reached Nieuwe Statenzijl ca. 8 days (Figure 3) earlier. Glass eels caught at Nieuwe Statenzijl swam with an average speed of 2.08 km/day (release site estuary) and 2.27 km/day (release site harbour channel Delfzijl). This is slightly lower but comparable to reported migration speeds in the Gironde of 3–4 km/day [14] and 3–8 km/day for A. rostrata [50]. The maximum daily tidal change influenced (although not significantly) the daily catches at Nieuwe Statenzijl, underpinning the concept that glass eels utilize tidal flows to move to tidal barriers. This notion is further supported by the double peak of glass eel catches at Nieuwe Statenzijl, which seems to adhere to daily tidal action (S4). In contrast, glass eel arrivals at Delfzijl–Duurswold peak at a low daily tidal difference, indicating that other migratory mechanisms are prevailing.
Glass eels released in the estuary migrated almost twice as fast to Delfzijl–Duurswold than those released in the harbour channel. We suggest that glass eels released in the estuary awaited better migration circumstances, for example, a lower turbidity. These results strengthen the notion that local disturbances in the harbour are influencing glass eel migration.

5. Conclusions

Our results show that glass eels migrate in higher numbers and speeds to a tributary at the end of the Ems estuary than towards two other tributaries which are closer to the estuary entrance. Estuarine-specific tidal flows in relation to the angle of approach may guide glass eel migration towards freshwater entry points, especially in anthropogenically altered estuaries. In addition, the low migration speed and tagged glass eels leaving the harbour of Delfzijl point towards harbour-specific migratory problems. Water managers need to be aware that estuary-specific tidal flows may determine recruitment of glass eels (or fish in general) at freshwater entry points, and this may have catchment-wide implications. This knowledge may assist in the assessment of current and future anthropogenic impacts on fish migration in estuaries and understanding the recruitment of fish at freshwater entry points.

Supplementary Materials

The following supporting information can be downloaded at: https://www.mdpi.com/article/10.3390/fishes8080392/s1, Figure S1. Predicted daily catch over days of the year at Delfzijl–Duurswold and Nieuwe Statenzijl. Figure S2. Recapture probability of VIE tagged blue and red eel at Delfzijl (a) and Nieuwe Statenzijl (b). Figure S3. Daily discharge at Delfzijl, Nieuwe Statenzijl, total discharge at Delfzijl and Termunterzijl. Figure S4. Daily number of glass eels caught at Delfzijl (a) and Nieuwe Statenzijl (b), and daily tidal difference (cm).

Author Contributions

Conceptualization, J.B.J.H., I.v.d.K., L.A.J.N. and P.P.S.; methodology, J.B.J.H., I.v.d.K., H.J.K. and L.A.J.N.; validation, I.v.d.K, H.J.K. and J.B.J.H.; formal analysis, I.v.d.K., J.B.J.H. and H.J.K.; investigation, J.B.J.H., I.v.d.K. and P.P.S.; data curation, I.v.d.K., J.B.J.H.; writing—original draft reparation, J.B.J.H., I.v.d.K.; writing—review and editing, J.B.J.H., I.v.d.K., L.A.J.N. and P.P.S.; visualization, I.v.d.K.; supervision, J.B.J.H.; project administration, J.B.J.H.; funding acquisition, J.B.J.H.; All authors have read and agreed to the published version of the manuscript.

Funding

This research was financed by the Waddenfonds (01755849/WF-2019/200914).

Institutional Review Board Statement

This research was performed in line with the animal welfare protocol number VD7110020197584, approved by the Centrale Commissie Dierproeven (The Netherlands) on 5 July 2019.

Informed Consent Statement

Not applicable

Data Availability Statement

The data presented in this study are available on demand from the first author at: jeroen.huisman@hvhl.nl.

Acknowledgments

We thank all students that helped with the monitoring and the water authority Hunze en Aa’s for assistance in the design and execution of field work. We would like to thank Joop van Eerbeek, Devika Narain, Tristan da Graca, and Jimmy van Rijn for their help with the VIE marking and field work.

Conflicts of Interest

The authors declare no conflict of interest

References

  1. Dafforn, K.A.; Simpson, S.L.; Kelaher, B.P.; Clark, G.F.; Komyakova, V.; Wong, C.K.; Johnston, E.L. The challenge of choosing environmental indicators of anthropogenic impacts in estuaries. Environ. Pollut. 2012, 163, 207–217. [Google Scholar] [CrossRef] [PubMed]
  2. Lotze, H.K. Radical changes in the Wadden Sea fauna and flora over the last 2000 years. Helgol. Mar. Res. 2005, 59, 71–83. [Google Scholar]
  3. Van Ginneken, V.J.; Maes, G.E. The European eel (Anguilla anguilla, Linnaeus), its lifecycle, evolution and reproduction: A literature review. Rev. Fish Biol. Fish. 2005, 15, 367–398. [Google Scholar]
  4. ICES. ICES: European eel (Anguilla anguilla) throughout its natural range. In ICES Advice: Recurrent Advice; Report; ICES: Copenhagen, Denmark, 2022. [Google Scholar] [CrossRef]
  5. Feunteun, E. Management and restoration of European eel population (Anguilla anguilla): An impossible bargain. Ecol. Eng. 2002, 18, 575–591. [Google Scholar]
  6. Harrison, A.J.; Walker, A.M.; Pinder, A.C.; Briand, C.; Aprahamian, M.W. A review of glass eel migratory behaviour, sampling techniques and abundance estimates in estuaries: Implications for assessing recruitment, local production and exploitation. Rev. Fish Biol. Fish. 2014, 24, 967–983. [Google Scholar]
  7. Drouineau, H.; Briand, C.; Lambert, P.; Beaulaton, L. GEREM (Glass Eel Recruitment Estimation Model): A model to estimate glass eel recruitment at different spatial scales. Fish Res. 2016, 174, 68–80. [Google Scholar]
  8. Cresci, A. A comprehensive hypothesis on the migration of European glass eels (Anguilla anguilla). Biol. Rev. 2020, 95, 1273–1286. [Google Scholar] [CrossRef]
  9. Able, K.W.; Smith, J.M.; Caridad, J.F. American eel supply to an estuary and its tributaries: Spatial variation in Barnegat Bay, New Jersey. Northeast. Nat. 2015, 22, 53–68. [Google Scholar]
  10. McCleave, J.D.; Kleckner, R.C. Selective tidal stream transport in the estuarine migration of glass eels of the American eel (Anguilla rostrata). ICES J. Mar. Sci. 1982, 40, 262–271. [Google Scholar] [CrossRef]
  11. Trancart, T.; Lambert, P.; Rochard, E.; Daverat, F.; Coustillas, J.; Roqueplo, C. Alternative flood tide transport tactics in catadromous species: Anguilla anguilla, Liza ramada and Platichthys flesus. Estuar. Coast. Shelf Sci. 2012, 99, 191–198. [Google Scholar]
  12. Jager, Z. Processes of Tidal Transport and Accumulation of Larval Flounder (Platichthys flesus L.) in the Ems-Dollard Nursery; Universiteit van Amsterdam: Amsterdam, The Netherlands, 1999. [Google Scholar]
  13. Cresci, A.; Durif, C.M.; Paris, C.B.; Shema, S.D.; Skiftesvik, A.B.; Browman, H.I. Glass eels (Anguilla anguilla) imprint the magnetic direction of tidal currents from their juvenile estuaries. Commun. Biol. 2019, 2, 366. [Google Scholar]
  14. Beaulaton, L.; Castelnaud, G. The efficiency of selective tidal stream transport in glass eel entering the Gironde (France). Bull. Bulletin Français de la Pêche et de la Pisciculture 2005, 378–379, 5–21. [Google Scholar] [CrossRef]
  15. Stanev, E.V.; Jacob, B.; Pein, J. German Bight estuaries: An inter-comparison on the basis of numerical modeling. Cont. Shelf Res. 2019, 174, 48–65. [Google Scholar]
  16. Schulz, K.; Burchard, H.; Mohrholz, V.; Holtermann, P.; Schuttelaars, H.M.; Becker, M.; Maushake, C.; Gerkema, T. Intratidal and spatial variability over a slope in the Ems estuary: Robust along-channel SPM transport versus episodic events. Estuar. Coast. Shelf Sci. 2020, 243, 106902. [Google Scholar]
  17. Ysebaert, T.; van der Wal, J.T.; Tangelder, M.; de Groot, A.V.; Baptist, M.J. Ecotopenkaart voor het Eems-Dollard Estuarium; IMARES: Yerseke, The Netherlands, 2016. [Google Scholar]
  18. Briand, C.; Sauvaget, B.; Girard, P.; Fatin, D.; Beaulaton, L. Push net fishing seems to be responsible for injuries and post fishing mortality in glass eel in the Vilaine estuary (France) in 2007. Knowl. Manag. Aquat. Ecosyst. 2012, 404, 2. [Google Scholar] [CrossRef] [Green Version]
  19. Pavlov, D.; Nazarov, D.Y.; Zvezdin, A.; Kucheryavyi, A. Downstream migration of early larvae of the European river lamprey Lampetra fluviatilis. In Doklady Biological Sciences; Springer: Berlin/Heidelberg, Germany, 2014; p. 344. [Google Scholar]
  20. Talke, S.A.; De Swart, H.E. Hydrodynamics and Morphology in the Ems/Dollard Estuary: Review of Models, Measurements, Scientific Literature and the Effects of Changing Conditions; Utrecht University Repository: Utrecht, The Netherlands, 2006. [Google Scholar]
  21. Benndorf, J.; Wünsche, A.; Jürges, J.; Naulin, M. Historic Developments of the Ems Estuary; ECSA: Johannesburg, South Africa, 2021. [Google Scholar]
  22. 92/43/EEC. Council Directive 92/43/EEC of 21 May 1992 on the conservation of natural habitats and of wild fauna and flora. Off. J. L 1992, 206, 7–50. [Google Scholar]
  23. Verwilligen, J.; Vantorre, M.; Delefortrie, G.; Meinsma, J.; Van der Made, K. Manoeuvrability in proximity of nautical bottom in the harbour of Delfzijl. In Proceedings of the 33rd PIANC World Congress, San Francisco, CA, USA, 1–5 June 2014; pp. 1–18. [Google Scholar]
  24. Josephson, D.C.; Robinson, J.M.; Weidel, B.C.; Kraft, C.E. Long-term retention and visibility of visible implant elastomer tags in brook trout. N. Am. J. Fish. Manag. 2008, 28, 1758–1761. [Google Scholar] [CrossRef]
  25. Jungwirth, A.; Balzarini, V.; Zöttl, M.; Salzmann, A.; Taborsky, M.; Frommen, J.G. Long-term individual marking of small freshwater fish: The utility of Visual Implant Elastomer tags. Behav. Ecol. Sociobiol. 2019, 73, 49. [Google Scholar]
  26. Imbert, H.; Beaulaton, L.; Rigaud, C.; Elie, P. Evaluation of visible implant elastomer as a method for tagging small European eels. J. Fish Biol. 2007, 71, 1546–1554. [Google Scholar] [CrossRef]
  27. Walmsley, S.; Bremner, J.; Walker, A.; Barry, J.; Maxwell, D. Challenges to quantifying glass eel abundance from large and dynamic estuaries. ICES J. Mar. Sci. 2018, 75, 727–737. [Google Scholar] [CrossRef]
  28. Piper, A.T.; Wright, R.M.; Kemp, P.S. The influence of attraction flow on upstream passage of European eel (Anguilla anguilla) at intertidal barriers. Ecol. Eng. 2012, 44, 329–336. [Google Scholar] [CrossRef]
  29. Sheldon, M.; McCleave, J. Abundance of glass eels of the American eel, Anguilla rostrata, in mid-channel and near shore during estuarine migration. Nat. Can. 1985, 112, 425–430. [Google Scholar]
  30. Bult, T.P.; Dekker, W. Experimental field study on the migratory behaviour of glass eels (Anguilla anguilla) at the interface of fresh and salt water. ICES J. Mar. Sci. 2007, 64, 1396–1401. [Google Scholar] [CrossRef] [Green Version]
  31. FitzGerald, J.L.; Sheehan, T.F.; Kocik, J.F. Visibility of visual implant elastomer tags in Atlantic salmon reared for two years in marine net-pens. N. Am. J. Fish. Manag. 2004, 24, 222–227. [Google Scholar] [CrossRef]
  32. Lazaridis, E. Lunar: Provides Functions to Calculate Lunar and Other Related Environmental Covariates. R-package 0.2-1. 2022. Available online: https://cran.r-project.org/web/packages/lunar/index.html (accessed on 30 May 2023).
  33. Zuur, A.F. A Beginner’s Guide to Generalized Additive Models with R; Highland Statistics Limited Newburgh: Newburgh, UK, 2012. [Google Scholar]
  34. Burnham, K.; Anderson, D. Model Selection and Inference: A Practical Information-Theoretic Approach, 2nd ed.; Springer: New York, NY, USA, 2000. [Google Scholar]
  35. Brooks, M.E.; Kristensen, K.; van Benthem, K.J.; Magnusson, A.; Berg, C.W.; Nielsen, A.; Skaug, H.J.; Maechler, M.; Bolker, B.M. glmmTMB Balances Speed and Flexibility among Packages for Zero-inflated Generalized Linear Mixed Modeling. R J. 2017, 9, 378–400. [Google Scholar] [CrossRef] [Green Version]
  36. Lenth, R.V. Emmeans: Estimated Marginal Means. R-package 1.7.1-1. 2021. Available online: https://cran.r-project.org/web/packages/emmeans/index.html (accessed on 30 May 2023).
  37. Hartig, F. DHARMa: Residual Diagnostics for Hierarchical (Multi-Level/Mixed) Regression Models. R Package Version 0.3. 2020. Available online: https://cran.r-project.org/web/packages/DHARMa/vignettes/DHARMa.html (accessed on 30 May 2023).
  38. Aprahamian, M.; Wood, P. Estimation of glass eel (Anguilla anguilla) exploitation in the Severn Estuary, England. Fish. Manag. Ecol. 2021, 28, 65–75. [Google Scholar] [CrossRef]
  39. Briand, C.; Fatin, D.; Feunteun, E.; Fontenelle, G. Estimating the stock of glass eels in an estuary by mark-recapture experiments using vital dyes. Bull. Fr. Pêche Piscic. 2005, 378–379, 23–46. [Google Scholar] [CrossRef] [Green Version]
  40. Creutzberg, F. The role of tidal streams in the navigation of migrating elvers (Anguilla vulgaris Turt.). In Orientierung der Tiere/Animal Orientation; Springer: Berlin/Heidelberg, Germany, 1963; pp. 118–127. [Google Scholar]
  41. Gascuel, D. Flow-carried and active swimming migration of the glass eel (Anguilla anguilla) in the tidal area of a small estuary on the French Atlantic coast. Helgoländer Meeresunters 1986, 40, 321–326. [Google Scholar] [CrossRef] [Green Version]
  42. Pein, J.U.; Stanev, E.V.; Zhang, Y.J. The tidal asymmetries and residual flows in Ems Estuary. Ocean Dyn. 2014, 64, 1719–1741. [Google Scholar] [CrossRef] [Green Version]
  43. Fitri, A.; Hashim, R.; Abolfathi, S.; Abdul Maulud, K.N. Dynamics of sediment transport and erosion-deposition patterns in the locality of a detached low-crested breakwater on a cohesive coast. Water 2019, 11, 1721. [Google Scholar] [CrossRef] [Green Version]
  44. Kamphuis, J.; Meinsma, R. Succesfull approach to ‘Keep the Sediment Navigable’ in port of Delfzijl. In Proceedings of the World Dredging Congress and Exhibition, Brussels, Belgium, 3–7 June 2013; pp. 3–7. [Google Scholar]
  45. Langdon, S.A.; Collins, A.L. Quantification of the maximal swimming performance of Australasian glass eels, Anguilla australis and Anguilla reinhardtii, using a hydraulic flume swimming chamber. N. Z. J. Mar. Freshw. Res. 2000, 34, 629–636. [Google Scholar] [CrossRef] [Green Version]
  46. Garrelts, E.; Harten, H.; Hovers, G.; Lucht, F.; Oebius, H.; Ohlmeyer, F.; Rohde, H.; Sindern, J.; Vollmers, H.-J.; Wigand, V. Die Ausbauten der Mündungsstrecken der deutschen Tideströme und deren Einfluß auf die Sandbewegung. Deutsche Beiträge. 23. In Proceedings of the Internationaler Schifffahrtskongreß, Ottawa, ON, Canada, 12 July 1973; pp. 197–228. [Google Scholar]
  47. Arribas, C.; Fernández-Delgado, C.; Oliva-Paterna, F.J.; Drake, P. Oceanic and local environmental conditions as forcing mechanisms of the glass eel recruitment to the southernmost European estuary. Estuar. Coast. Shelf Sci. 2012, 107, 46–57. [Google Scholar] [CrossRef] [Green Version]
  48. Kroes, R.; Van Loon, E.; Goverse, E.; Schiphouwer, M.; Van der Geest, H. Attraction of migrating glass eel (Anguilla anguilla) by freshwater flows from water pumping stations in an urbanized delta system. Sci. Total Environ. 2020, 714, 136818. [Google Scholar] [CrossRef] [PubMed]
  49. Larinier, M. Dams and Fish Migration; World Commission on Dams: Toulouse, France, 2000. [Google Scholar]
  50. Wuenschel, M.; Able, K. Swimming ability of eels (Anguilla rostrata, Conger oceanicus) at estuarine ingress: Contrasting patterns of cross-shelf transport? Mar. Biol. 2008, 154, 775–786. [Google Scholar]
Figure 1. (a) Map of the Ems estuary, including tidal gullies, depth (m), and sampling locations. The sampling locations at Termunterzijl (1) and Delfzijl–Duurswold (2) are indicated with numbers. Inlay represents the Netherlands and the general location of the Ems estuary. (b) Detailed map of the harbours of Delfzijl and Termunterzijl. Glass eel release sites “Delfzijl estuary” and “Delfzijl harbour channel” are indicated.
Fishes 08 00392 g001
Figure 2. Glass eel marked with a red VIE tag (a) and a glass eel marked with a blue VIE tag (b).
Fishes 08 00392 g002
Figure 3. (a) Daily total numbers of glass eels that were caught at Delfzijl–Duurswold and Nieuwe Statenzijl and (b) daily number of VIE-tagged glass eels that were caught at Delfzijl–Duurswold and Nieuwe Statenzijl. Red bars indicate the number of VIE-tagged glass eels released at Delfzijl estuary and blue bars indicate the VIE-tagged glass eels released at Delfzijl harbour channel.
Fishes 08 00392 g003
Figure 4. Modelled mean migration speed (in km/day) between release sites and recapture sites of VIE-tagged glass eels released at Delfzijl estuary (red) and those released at Delfzijl harbour channel (blue), including confidence intervals, asterisk indicates statistical significance.
Fishes 08 00392 g004
Table 1. Number (n) of glass eel catches (VIE-tagged and non-VIE-tagged eels) caught at Delfzijl–Duurswold, Termunterzijl, and Nieuwe Statenzijl.
LocationTotal Amount of Glass Eels Caught (n)Total Catch of VIE-Tagged Eels Released at Delfzijl Estuary (n), and Percentage of Recapture (%)Total Catch of VIE-Tagged Eels Released at Delfzijl Harbour Channel (n), and Percentage of Recapture (%)
Delfzijl–Duurswold185621 (1.1%)10 (1.0%)
Termunterzijl11926 (0.3%)1 (0.1%)
Nieuwe Statenzijl97,08950 (2.5%)24 (2.4%)
Table 2. The table shows the parameters included in the final negative binomial GAM modelling the total daily glass eel catch. Parameters included are catch location (Nieuwe Statenzijl = intercept), daily tidal difference (m), and two smoothers for day of the year at Delfzijl–Duurswold and Nieuwe Statenzijl. The table shows the estimate of the regression coefficient (β) and its standard error (SE), the effective degrees of freedom (Edf), the test statistic (z-value), degrees of freedom (df), exponentiated value of the regression coefficient (Exp(β)), the 95% confidence interval for Exp(β), and p-values.
β ± SEz-ValuedfExp(β) 95% IC for Exp(β)p-Value
Intercept 2.654 ± 2.1891.213 14.22[0.20, 1037.34]0.225
Tidal difference (m)0.004 ± 0.0060.66611.00[0.99, 1.02]0.505
Catch location Delfzijl–Duurswold a3.466 ± 0.28512.149132.02[18.31, 56.02]<0.001
S (day of the year, Delfzijl–Duurswold)Edf = 2.75815.312.76 0.003
S (day of the year, Nieuwe Statenzijl)Edf = 5.50134.345.5 <0.001
a Reference: Nieuwe Statenzijl.
Table 3. The parameters included in the final negative binomial GLM modelling migration speed. Model includes an offset variable of the natural logarithmic of the difference in distance between release and recapture location (km). Parameters included are release location (Delfzijl estuary = intercept), recapture location, and the interaction between release and recapture location. The table shows the estimate of the regression coefficient (β) and its standard error (SE), the test statistic (z-value), degrees of freedom (df), exponentiated value of the regression coefficient (Exp(β)), the 95% confidence interval for Exp(β), and p-value.
β ± SEz-ValuedfExp(β) 95% IC for Exp(β)p-Value
Intercept1.131 ± 0.1457.779 3.10[2.33, 4.12]<0.001
Release location (VIE colour) a−0.654 ± 0.180−3.63410.52[0.37, 0.74]<0.001
Recapture location b−1.855 ± 0.178−10.40610.16[0.11, 0.22]<0.001
Release * Recapture location0.547 ± 0.2202.48311.73[1.12, 2.66]0.013
a Reference: estuary (VIE red). b reference: Nieuwe Statenzijl.
Disclaimer/Publisher’s Note: The statements, opinions and data contained in all publications are solely those of the individual author(s) and contributor(s) and not of MDPI and/or the editor(s). MDPI and/or the editor(s) disclaim responsibility for any injury to people or property resulting from any ideas, methods, instructions or products referred to in the content.

