Article

Different Diets Based on Yellow Mealworm (Tenebrio molitor)—Part B: Modification of the Intestinal Inflammatory Response and the Microbiota Composition of Rainbow Trout (Oncorhynchus mykiss)

by
Federico Melenchón
1,
Ana María Larrán
1,
Marta Hernández
1,
David Abad
1,
Amalia E. Morales
2,
Héctor J. Pula
2,
Dmitri Fabrikov
3,
María José Sánchez-Muros
3,
Alba Galafat
3,
Francisco Javier Alarcón
3,
Helena M. Lourenço
4,5,
María-Fernanda Pessoa
6 and
Cristina Tomás-Almenar
7,*
1
Agro-Technological Institute of Castilla y León, Ctra. Arévalo s/n, 40196 Segovia, Spain
2
Department of Zoology, Campus Fuentenueva, Facultad de Ciencias, University of Granada, 18071 Granada, Spain
3
Department of Biology and Geology, University of Almería, 04120 Almería, Spain
4
IPMA, I.P.—Portuguese Institute of the Sea and Atmosphere, Av. Dr. Alfredo Magalhães Ramalho, 6, 1495-165 Lisboa, Portugal
5
CIIMAR—Interdisciplinary Centre of Marine and Environmental Research, Av. General Norton de Matos S/N, 4450-208 Matosinhos, Portugal
6
GeoBioTec, Departamento de Ciências da Terra, Faculdade de Ciências e Tecnologia, Nova School, 2829-516 Lisboa, Portugal
7
Animal Reproduction Department, National Institute of Agronomic Research (INIA-CSIC), Puerta de Hierro Avenue s/n, 28040 Madrid, Spain
*
Author to whom correspondence should be addressed.
Fishes 2023, 8(6), 284; https://doi.org/10.3390/fishes8060284
Submission received: 28 March 2023 / Revised: 17 May 2023 / Accepted: 24 May 2023 / Published: 26 May 2023

Abstract

:
With the purpose of improving aquaculture sustainability, the search for protein alternatives to fishmeal makes it necessary to test different variables and the possible repercussions of new ingredients. The use of insect meal as a protein source for aquaculture is well described, but the complex composition of insect meals (fat and other components) can affect the physiology of fish. For this reason, as a part of a bigger study, the aim of the current manuscript was to test diets based on three different presentations of insect meal coming from yellow mealworm (Tenebrio molitor): full fat, partially defatted, and supplemented with a long chain omega–3-enriched oil, and to evaluate their effects on protein digestibility, biometric indices, immunological system and gut health (intestinal histomorphology and microbiota) of rainbow trout (Oncorhynchus mykiss). Digestibility of the protein and body indices showed a minor but consistent trend. The non-specific immunological system did not show changes, but the histology of the intestine showed signs that insect meals could be softening a mild inflammatory response. The gut microbiota suffered several changes, which could be associated with the different amino acid and fatty acid compositions of the diets.
Key Contribution: The current manuscript provides further insight into the use of different diets based on yellow mealworm showing the repercussions of the intestinal inflammatory response and the microbiota composition of rainbow trout, including the possible repercussions of the defatting process.

1. Introduction

Aquaculture is seen as a promising solution for sustainable and efficient food production [1]. However, it is ironic that this very industry faces its own sustainability challenges, including its dependence on fishmeal. Despite reducing this dependence in recent decades [2,3], the growth of this industry demands continued efforts to reduce fishmeal consumption. As a result, the interest in protein alternatives to fishmeal, such as vegetable meals, unicellular protein or insect meals, continues to grow.
Typically, these alternative ingredients have their advantages and disadvantages. For example, fishmeal has excellent nutritional composition when compared to insect meals [4,5,6], but its overexploitation has made it increasingly expensive [7], aside from what was already mentioned about fishmeal being unsustainable. Vegetable ingredients such as soybean meal were a first attempt to tackle this issue, but many among them have a relatively poor protein value [8], contain antinutrients [9,10] and/or can induce inflammatory effects in the gastrointestinal tract of fish, such as a shortening of mucosal fold height or a loss of enterocyte supranuclear vacuoles [11,12]. Other new ingredients like yeast or microalgae have good compositions and some of them have shown interesting secondary functions [13,14,15,16], but they are expensive to produce, making it difficult to scale their production to meet the needs of the animal feeding industry. Insect meals fall into this category.
Insects grow and reproduce quickly, have good protein quality and can adapt well to different feeding substrates [4,5,17,18]. Studies also suggest that insects can have positive effects on fish physiology, like the enhancement of the antioxidant and immunological systems [19,20,21,22]. This is why insect meals could be considered functional ingredients, even though the biochemical principles behind these effects are not yet fully understood. For example, it has been reported that the chitin of insects could be involved in the increase of intracellular glutathione and in a scavenging effect of reactive oxygen species [23,24]. It is also possible that the different sizes of chitin molecules could have different effects due to their polymeric structure [25]. However, it is also described that high concentrations of chitin in the feed can disrupt protein digestibility [26,27,28]. Insects have other interesting components in their composition, such as the lauric acid of the black soldier fly (Hermetia illucens) [29,30], the riboflavin of giant yellow mealworm (Tenebrio molitor) and adult crickets (Acheta domesticus) [31] and several antimicrobial peptides [30,32]. Furthermore, the growing interest in insect meals as ingredients has led to many studies evaluating the effects of insect-based diets on fish gut microbiota. Although it is still early to draw firm conclusions, insect meals can modify the microbiome of fish [33,34,35].
The current manuscript is an extension of a trial that was previously reported [36]. Rainbow trout (Oncorhynchus mykiss) were fed five experimental diets to evaluate the differences between a diet with a 50% replacement of fishmeal by full-fat yellow mealworm, another one with partially defatted yellow mealworm, and two with full-fat yellow mealworm but enriched with an algal oil which had a high concentration of long-chain omega–3 polyunsaturated fatty acids. This article expands on what was mentioned for that trial to test the effect of these diets on protein digestibility, biometric indices, evaluation of the immunological system and gut health (intestinal histomorphology and microbiota).

2. Materials and Methods

2.1. Experimental Diets, Animals and Rearing Conditions

The diets and their composition (Table 1, Table 2 and Table 3), the animals and experimental conditions used for this study were the same as in Melenchón et al. [36]. Five isoproteic (48.9%) and isolipidic (18.5%) diets followed these principles: the control diet (C) had no fishmeal replacement; one experimental diet (T) had a 50% replacement of fishmeal with full-fat insect meal from yellow mealworm (Tenebrio molitor; Tebrio, Spain); one experimental diet had a 50% replacement of fishmeal with a partially defatted insect meal from yellow mealworm (diet dT; defatted yellow mealworm provided by Ÿnsect, France); the other two experimental diets were similar to the T diet, but with an increasing replacement of fish oil with an experimental algal oil rich in long chain omega–3 polyunsaturated fatty acids (the supplier decided to remain anonymous), 3.09% of algal oil for diet TO1 and 7.24% for diet TO2. Diets were enriched with methionine and lysine to satisfy the requirements of the fish [37,38].
Rainbow trout eggs (Oncorhynchus mykiss) from the private company Mundova (Albacete, Spain) were hatched and reared in the experimental facilities of the Aquaculture Research Centre of “Instituto Tecnológico Agrario de Castilla y León” (ITACyL). 500 female rainbow trout were allocated in a recirculation aquaculture system (20 cylindrical tanks, 500 L, four replicates per treatment) and were acclimated for three weeks. The experiment began at an initial weight of 46.1 ± 0.1 g and took place for 89 days with the following conditions: water temperature of 14.8 ± 0.7 °C, water dissolved oxygen of 7.8 ± 0.7 mg/L, room photoperiod of 12 h light: 12 h dark, ammonia <0.1 mg/L and nitrite <0.1 mg/L. Fish were hand-fed once per day (9:00 a.m.) to satiation or up to a maximum of 3% body weight. Feed intake and mortality were monitored daily.

2.2. Sample Collection

A modified Guelph method [39] was followed during the last days of the experiment (daily, approximately two weeks) to collect faeces from settling columns, one per tank; the faeces were frozen and kept at −80 °C until they were analysed. At the end of the 89 days trial, and after fasting for one day, two fish per tank were anaesthetised with an overdose of tricaine methanesulfonate (MS-222; 300 mg/L) in order to obtain blood, liver, distal intestine, pyloric caeca, skin mucus and dorsal fillet samples for different analyses. Other measures were taken during the process to analyse butchering yield and somatic indices. One exception was made for the previously mentioned: three fish per tank were taken for microbiota analyses (gut content samples from the distal intestine). Samples for enzyme determinations were kept in liquid nitrogen during the sampling procedure and frozen at −80 °C until their individual analyses. Samples for histomorphology analyses were fixed in 4% buffered formalin for 48 h before dehydration and processing. Gut content samples for microbiota analyses were frozen at −80 °C until their individual analyses.
The Directive of the European Union Council and the Spanish Government [40,41] was followed for the care and handling of the fish. The Bioethical Committee of “ITACyL” approved this experiment (Authorization number: 2017/19/CEEA).

2.3. Chemical Analyses

The apparent digestibility coefficient of the protein was determined using acid-insoluble ash as a marker in feeds and faeces [42]. The conversion factors for protein analyses was 6.25 for feeds and faeces [43]. N and protein content in diets and faeces, as well as amino acids and fatty acids from diets, were analysed as described in Melenchón et al. [36].

2.4. Non-Specific Immune Status

The non-specific immune status of the fish was assessed as follows: lysozyme, antiprotease, acid and alkaline phosphatases, and peroxidase activities, together with immunoglobulins concentration, were measured in plasma; acid and alkaline phosphatases, peroxidase, esterase and carbonic anhydrase activities were measured in skin mucus.
A turbidometric method [44] with Micrococcus lysodeikticus (Sigma, St. Louis, MO, USA) was used to measure lysozyme activity in plasma. The reaction was carried out for 20 min at 35 °C. The activity was expressed as U/mL, and one unit of activity was defined as the amount of enzyme that catalyzed a decrease in absorbance of 0.001 per minute at 450 nm.
The method described by Mashiter and Morgan [45] was followed to measure total esterase activity in skin mucus at 25 °C. The chosen substrate was P-nitrophenyl acetate (0.8 mM), and acetazolamide (1.6 mM) was used as the inhibitor of carbonic anhydrase activity. Samples were then incubated for 10 min, and the increase of absorbance was measured for 5 min at 405 nm. The activity was expressed in U/mg protein (1 unit was defined as 1 μmol of substrate transformed per minute).
Antiprotease activity was measured in plasma following the method of Thompson et al. [46]. The variation of optical density (410 nm, for 30 min) was used to quantify the production of 4-nitroaniline, using the activity of trypsin in the absence of plasma as control (CAS 90002-07-7, Acofarma, Spain). The activity was expressed in U/mg protein (1 unit was defined as the amount of enzyme that inhibits by 50% the control reaction).
The activity of acid and alkaline phosphatases in both plasma and skin mucus was determined following the method of Huang et al. [47]. To measure acid phosphatase, a buffer at pH 5 (CH3COOH/CH3COOHNa 0.1 M, MgCl2 1 mM) was used, and a buffer at pH 10 (NaHCO3/NaOH 0.05 M, MgCl2 1mM) was used to measure alkaline phosphatase, while the chosen substrate for both reactions was P-nitrophenyl phosphate (Sigma, St. Louis, MO, USA). The measurements were performed at 405 nm, 37 °C and 30 min. The activity was expressed in mU/mg protein (1 unit was defined as the amount of enzyme required to transform 1 μmol of substrate per minute).
The method of Mohanty and Sahoo [48] was followed to determine the activity of peroxidase in both plasma and skin mucus. TMB (3, 30, 5, 50-Tetramethylbenzidine) as a 20 mM solution was used as the substrate, while standard samples without plasma/skin mucus were used as controls. After blocking the reaction for 2 min, samples were read at 450 nm. The activity was expressed in U/mg protein (1 unit was defined as the amount of enzyme required to transform 1 μmol of substrate per minute).
The method described by Panigrahi et al. [49] was followed to determine total immunoglobulins in plasma. Immunoglobulins were precipitated by adding 12% polyethylene glycol (PEG) to plasma samples (10 μL plasma, 40 μL of saline solution, and 50 μL of PEG) and separated from the total proteins to calculate the difference in untreated plasma. Protein content in untreated and PEG-treated plasma samples was determined and immunoglobulin content was calculated by difference. The protein content of samples was analysed using the method of Bradford [50], with bovine serum albumin used as a standard.

2.5. Histomorphology

2.5.1. Samples Processing

Increasing ethanol solutions (25, 50, 75 and 100%) were used to dehydrate the fixed samples, which were then embedded in synthetic paraffin. A rotary microtome (FINESSE ME+ Thermo Scientific, Waltham, MA, USA) was used to obtain histological sections (3–4 µm). Samples were processed with hematoxylin and eosin techniques. A light microscopy with graded objective lenses was used to evaluate five random regions per tissue sample with an Olympus CX31 microscope and an Olympus EP50 microscope camera (Olympus, Barcelona, Spain).

2.5.2. Distal Intestine and Pyloric Caeca Histomorphology Analyses

The protocol followed was very similar to the one described by Melenchón et al. [51]. Briefly, the chosen measurements for the quantitative analyses of the distal intestine and pyloric caeca were villi height and width, enterocyte height, widths of stratum compactum, muscular layer and lamina propria, with the latter being measured at three different heights (apical, intermediate and basal lamina propria) to calculate a mean. Also, a subjective, qualitative analysis was carried out to evaluate the levels of lamina propria inflammatory infiltration and loss of supranuclear vacuolization of enterocytes. These subjective parameters were evaluated as absent (−) mild (+), medium (++) or severe (+++) levels.

2.6. Distal Intestine Gut Content Microbiota Analysis

Frozen gut content samples were thawed on ice. DNA extraction was carried out following the instructions of the commercial kits QIAamp Fast DNA Stool Mini Kit and QIAamp PowerFecal DNA Kit (QIAGEN Iberia, Barcelona, Spain). A DNA purification was carried out after the extraction, using the QIAGEN DNA blood&tissue kit (QIAGEN Iberia, Barcelona, Spain), followed by quantification with a Qubit fluorometer 4 (Fisher Scientific, Madrid, Spain). DNA samples were kept at −20 °C until library preparation.
Microbiome diversity was studied following the methodology of Hernández et al. [52]. Primers described by Klindworth et al. [53] were used to amplify the variable region V3-V4 of 16S rRNA from the DNA samples using the 16S metagenomic sequencing library protocol (Illumina, San Diego, MA, USA). Libraries normalised and pooled at 4 nM were denatured with NaOH 0.2 N, and combined with PhiX (Illumina, San Diego, MA, USA) as control. Samples were sequenced with parallel synthesis technology in a MiSeq platform (Illumina, San Diego, MA, USA), using a 2 × 300 (paired-end) cycle V3 Kit (Illumina, San Diego, MA, USA), following the Illumina sequencing protocols. After 72 h, approximately 7 GB of data was obtained and analysed through bioinformatics.
Paired-end sequences were quality filtered using Sickle with default parameters [54]. Then, QiimeReporter [55] was used to perform the microbiota analysis. Basically, it uses the DADA2 [56] package to infer Amplicon Sequence Variants (ASVs) and a pre-trained Naïve Bayes classifier [57] for ASV taxonomic assignment using the SILVA 138 database as a reference [58]. Chloroplasts, mitochondria and ASV without phylum assignment were removed from further analysis. Taxons with an overall abundance ≥0.5% of the sample were chosen, from both phylum and genus, to do the ANOVA analyses.

2.7. Statistical Analyses

The tank was used as an experimental unit since it was not possible to include the tank as a random effect for the lack of freedom degrees; the diets and fish were randomly assigned to each tank. A normalised analysis of variance (ANOVA) was performed and the diet was included as a fixed effect; when the ANOVA revealed a significant effect among diets (p-Value < 0.05), a post-hoc Tukey test was performed to compare the statistically different means. Values are shown as mean ± standard error of the mean. Alpha diversity indices Chao1, Shannon and Simpson were calculated from the results, as mentioned in the bibliography [59,60,61]. A Principal Component Analysis was performed, and a biplot was created to represent the relationship between diet composition (in relation to fatty acids and amino acids) and microbiota gut content composition at the genus level. Previous to Principal Component Analysis, the data were scaled to unit variance. The open-source programming tool R [62] and its RStudio interface [63] were used to carry out the statistical analyses, and the figures were created with RStudio Build 382.

3. Results and Discussion

3.1. Protein Use, Biometric Indices and Butchering Yield

There were no significant differences in growth performance among the experimental diets, as mentioned in Melenchón et al. [36]. T and TO2 showed a significantly higher protein efficiency ratio than dT, while TO1 and TO2 showed a significantly higher level of apparent digestibility coefficient of the protein than C, T and dT. Also, TO1 and TO2 showed significantly lower numbers for intestinal somatic index. The butchering yield of the fish was not statistically affected by the experimental treatments (Table 4).
Chitin might interfere with the digestibility of protein [26,64,65]. However, there are also cases like the present experiment where this did not happen [20,21,34], which aims to the idea that this phenomenon could be attenuated when the levels of chitin are low. The chitin of the experimental diets was not measured during this study, but the levels found in the different insect meals, 3.2% for full-fat yellow mealworm and 5.5% for defatted yellow mealworm [36], suggest that even the highest value (dT diet) should be around 1%. In our case, TO1 and TO2 showed a higher apparent digestibility coefficient of the protein than the rest of the diets. The results of the intestinal somatic index, lower in TO1 and TO2, were inversely related to those of the apparent digestibility coefficient of the protein. German and Horn [66] described that, from the point of view of evolution, a longer intestine is usually related to a lower digestibility of the diet; even though little is known about this fact when talking within the same species, it is possible that less digestible diets could lead to the development of a more active and bigger/longer intestine [67]. As an interesting detail, our results on intestinal somatic index and apparent digestibility coefficient of the protein followed this idea.

3.2. Immunological System

There were no statistically significant differences for any of the variables measured in plasma. In skin mucus, acid phosphatase showed significantly lower values in C, T and dT treatments and a significantly higher value for TO1. A similar trend was highlighted for alkaline phosphatase but showed significant differences only between C (lower) and TO1 (higher) (Table 5).
Even though it is described that insect-sourced ingredients might have a positive effect on the performance of the immune system [19,21], there is no clear evidence able to justify why these changes in the immune system occur after the inclusion of insect meals in the feed. It is theorised that different components within the composition of insects, such as their chitin, certain antibacterial peptides, or the lauric acid of black soldier fly (Hermetia illucens), could be, at least, partially responsible for these effects [20,32,68,69]. Henry et al. [19] described an enhancement of the trypsin inhibition, bacteriolytic and myeloperoxidase activities of rainbow trout serum after the partial substitution of fishmeal with yellow mealworm meal. Kumar et al. [70] highlighted an increased lysozyme activity in rainbow trout serum after a partial substitution of fishmeal with black soldier fly meal, but also an increased peroxidase activity after a total replacement of fish oil with black soldier fly oil. Interestingly, two of our own past experiments highlighted opposite results to the ones described in this manuscript, with a lower level of alkaline phosphatase for three out of four insect-based diets in one of those experiments [21] and a lower level of acid phosphatase in a diet based on yellow mealworm in the other one [51]. However, these results were found in different tissues, the present case being one where the highest values of phosphatases were found in skin mucus and not in plasma. Phosphatases are not only enzymes related to external stressors and infections [47,71,72] but also good indicators of tissue damage [73,74]. As it was described in the manuscript directly related to this one [36], TO1 was one of the diets with the highest levels of liver oxidative stress and lipidic accumulation and also had some of the highest values of long-chain omega–3 polyunsaturated fatty acids in the fillet. Considering that fish skin is an important reservoir of long-chain omega–3 polyunsaturated fatty acids [75], it is not surprising that skin mucus, a tissue that is persistently exposed to external aggressions, showed a higher expression of these enzymes in TO1, the case of TO2 being close behind.

3.3. Gut Health

Gut health was analysed from two different approaches: histomorphology (distal intestine and pyloric caeca) and microbiota study.

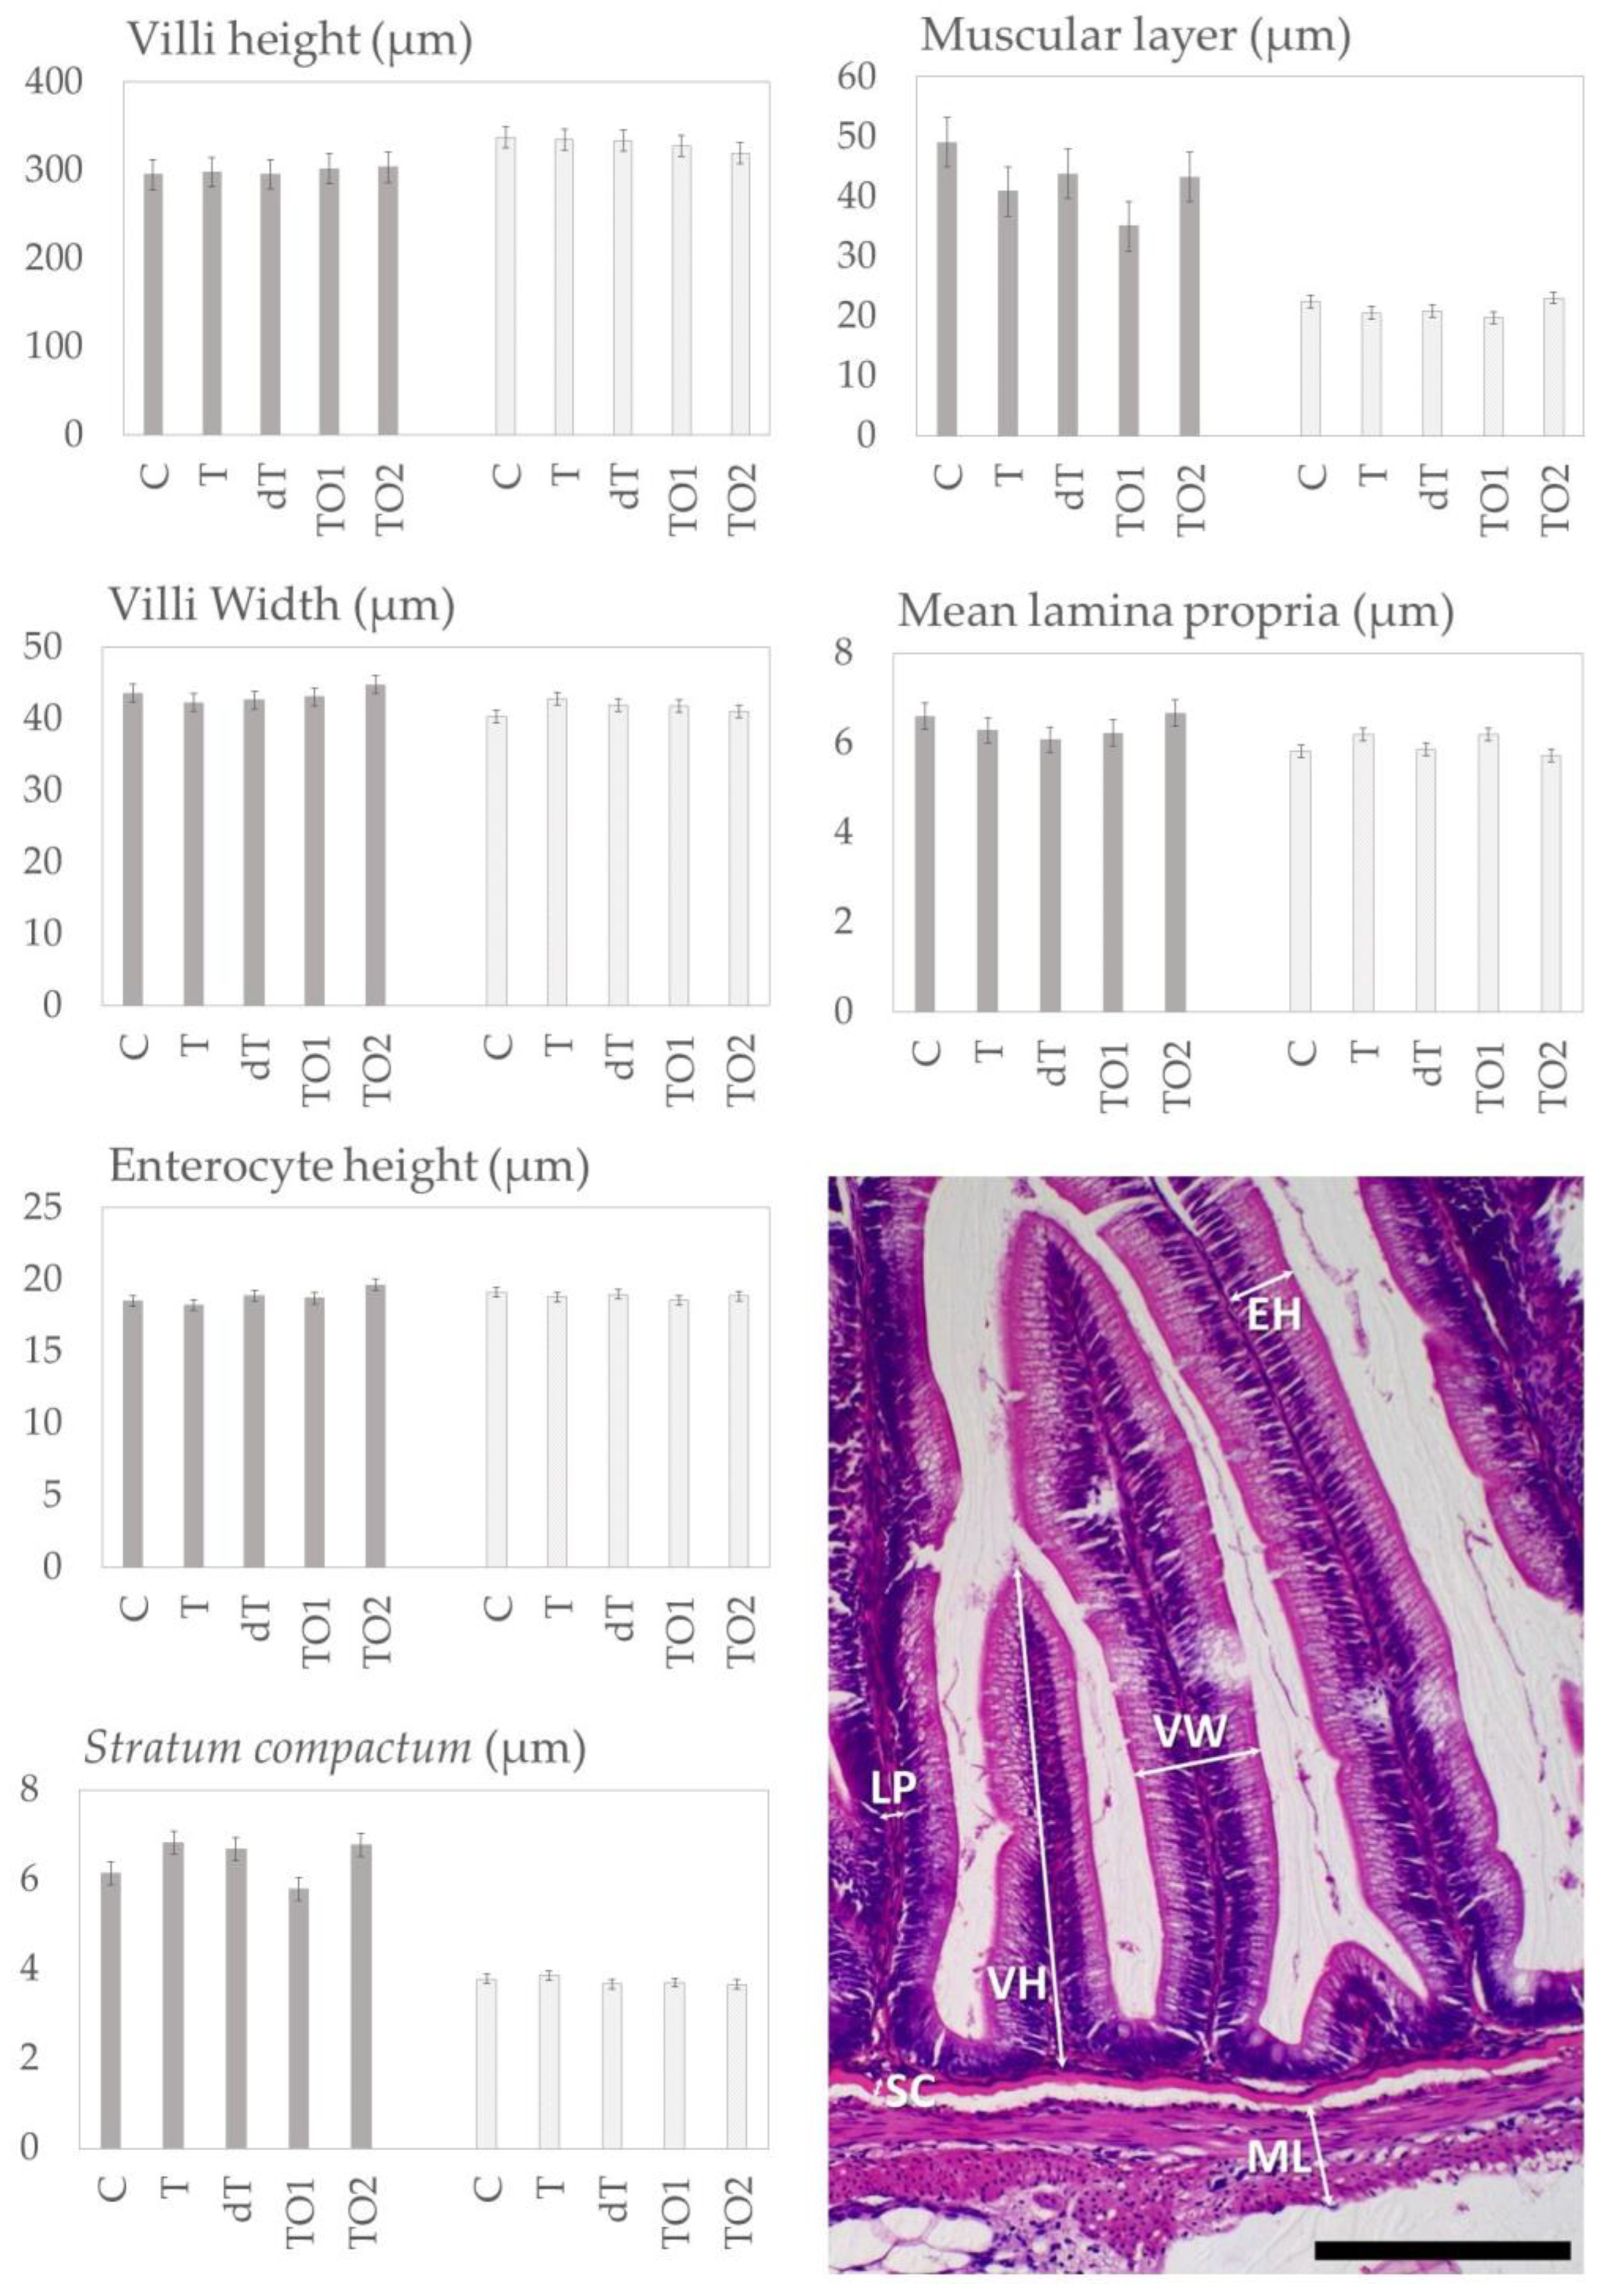
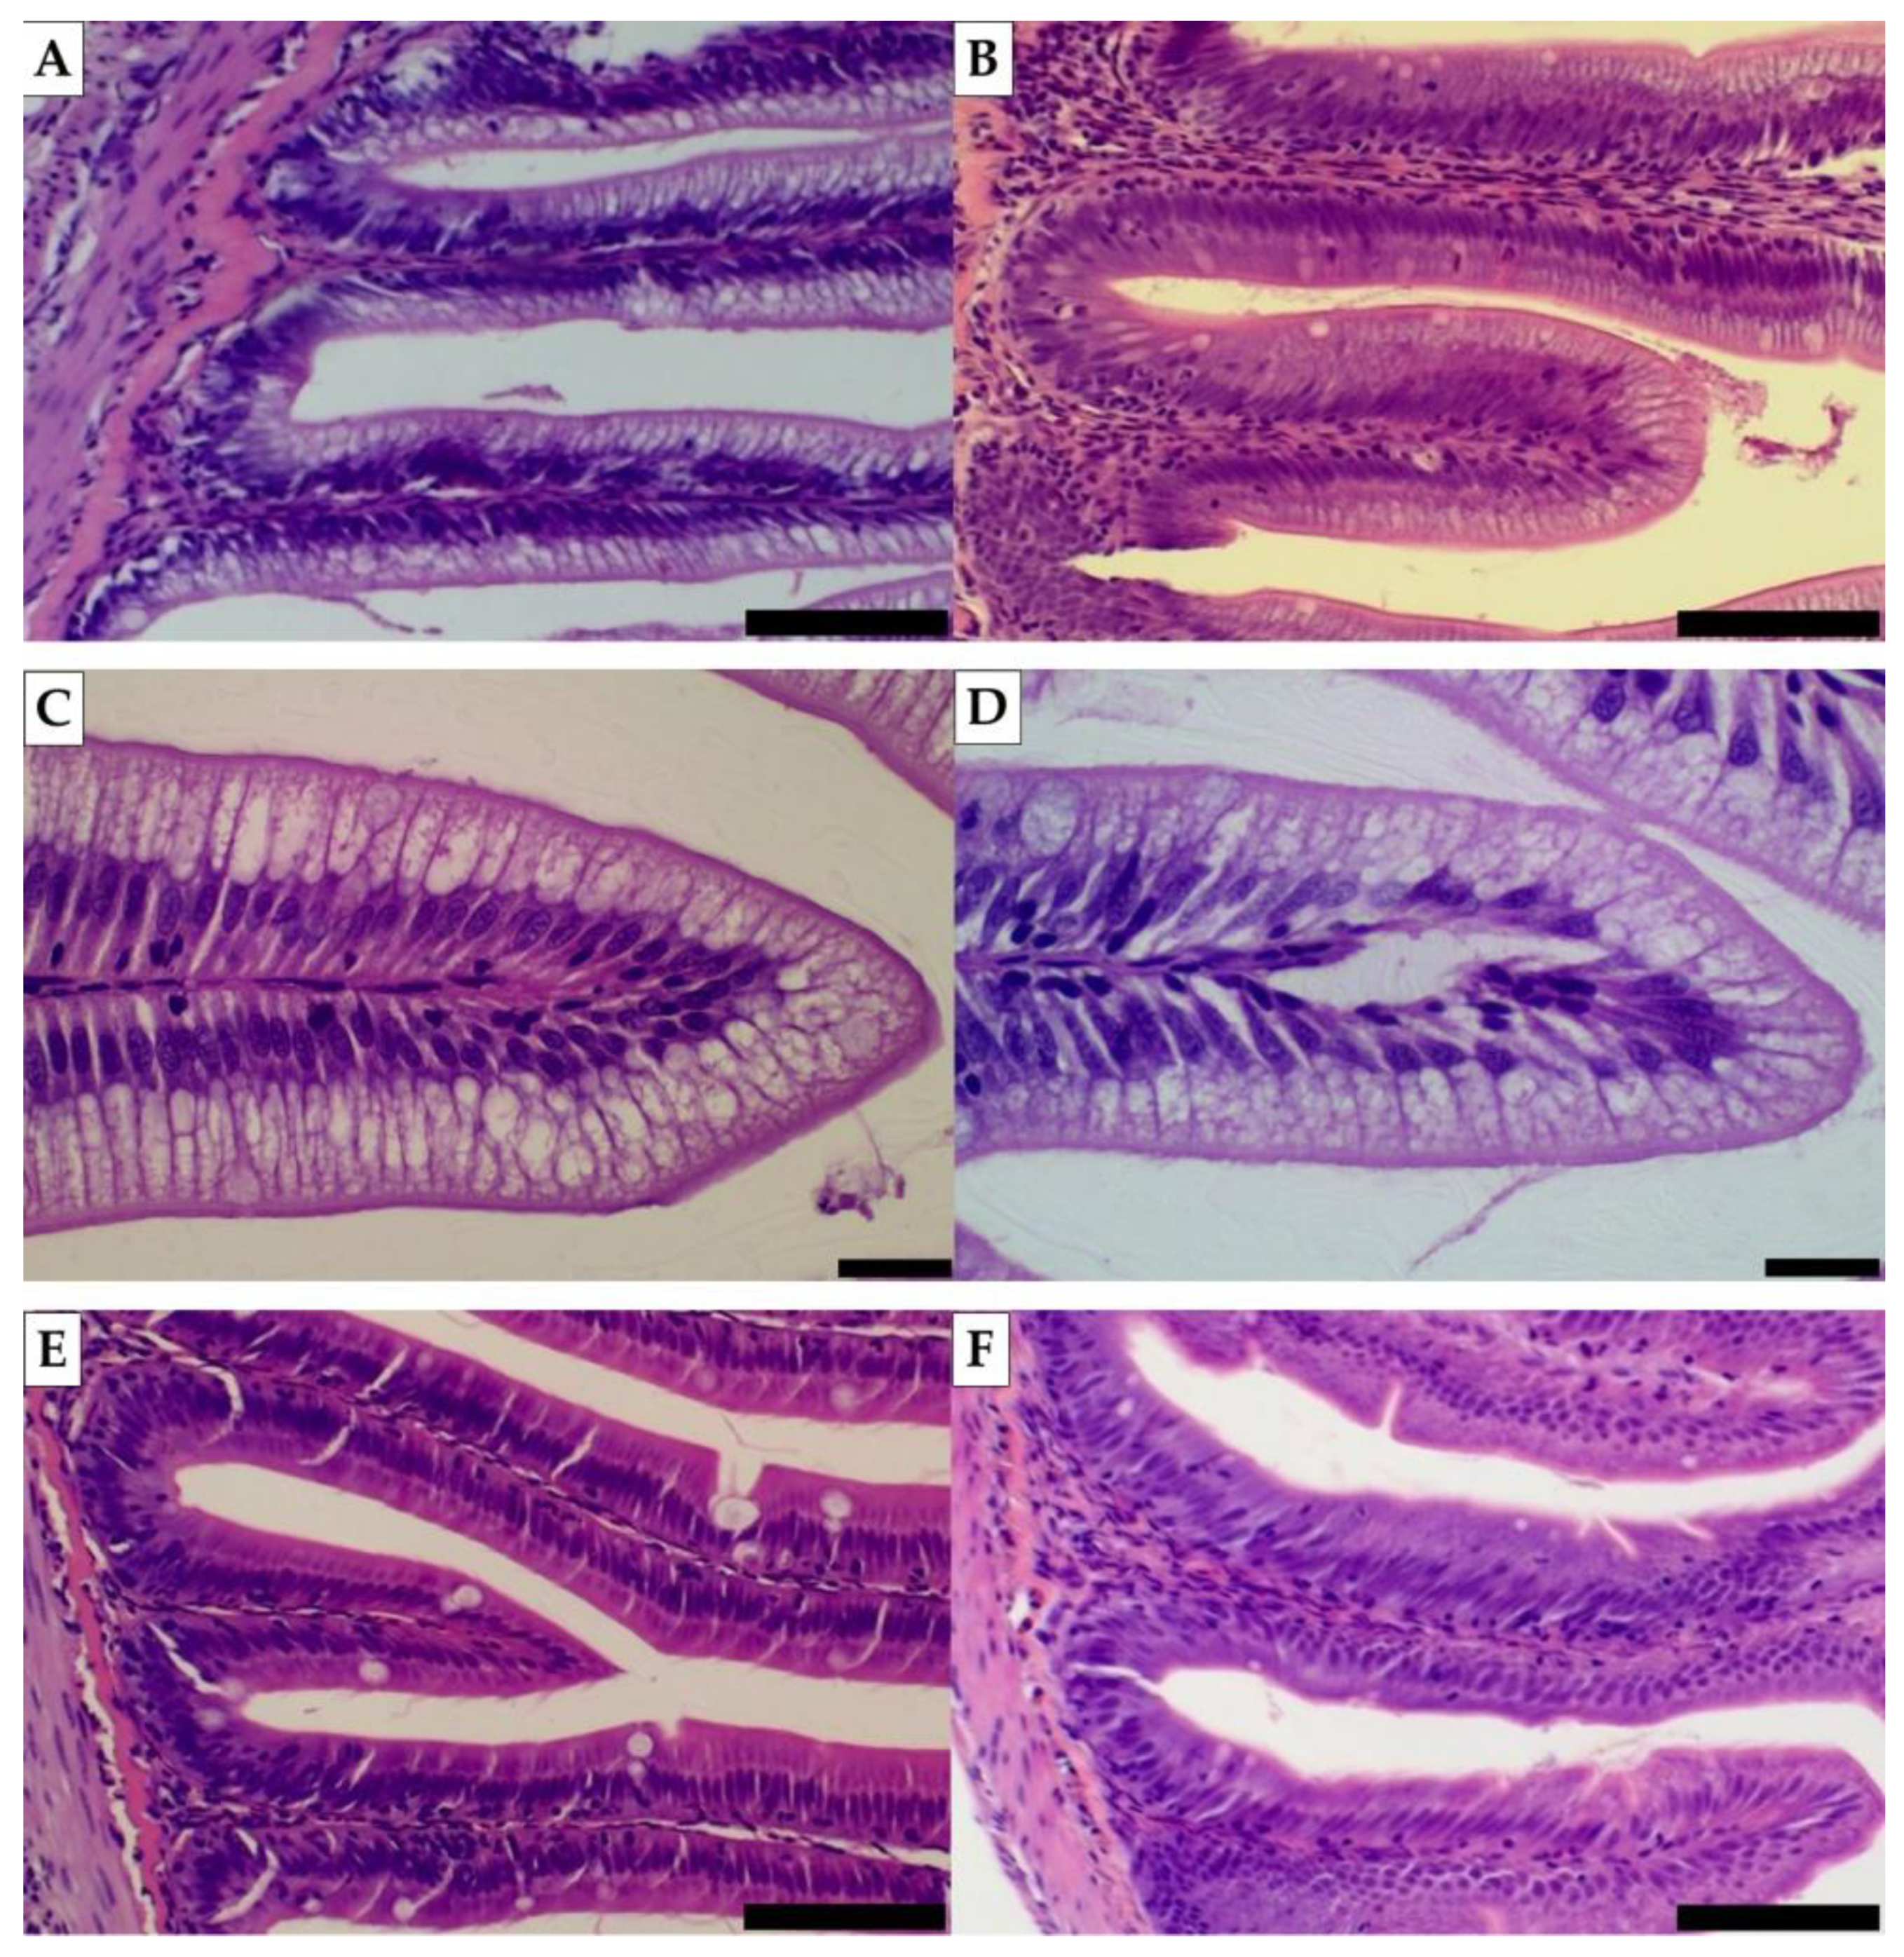
3.3.1. Intestinal Histomorphology

Concerning the status of intestinal histomorphology, no changes were highlighted for any of the quantitative variables, neither in the distal intestine nor in the pyloric caeca [Figure 1]. Minor changes are described for the qualitative analysis: in the distal intestine, the level of loss of enterocyte vacuoles was slightly higher in C (+) than in the rest of the diets (−); in pyloric caeca, the level of inflammatory infiltration in the submucosa and lamina propria layers was slightly higher in C and TO1 (+) than in T, dT and TO2 (−) [Figure 2].
Both qualitative variables (inflammatory infiltration and loss of enterocyte vacuoles) are signs of an abnormal immunological status of the gastrointestinal tract, so it is reasonable to assume that these results could be related to the same cause. It is known that several vegetable ingredients like soybean meal can cause, among others, undesired effects in the fish gastrointestinal tract, such as the previously mentioned [9,10,11,76,77], but it has also been described that insect meals or even insect oil can provoke a reduction of these inflammatory effects [70,78]. Even though the present experiment did not reveal a severe case of inflammation, it is interesting to notice that three out of four insect-based diets (T, TO1 and TO2) had a slightly higher amount of vegetable ingredients than C [36], suggesting that this inhibitory effect might be considerable. However, the different natures of the fat can influence the level of enterocyte vacuolization [79], so this could have been another minor factor involved in this change. The rest of the variables remained very stable among all treatments, which in general follows the trend of other studies related to insect-sourced ingredients as the main target, especially when talking about yellow mealworm [80,81,82].

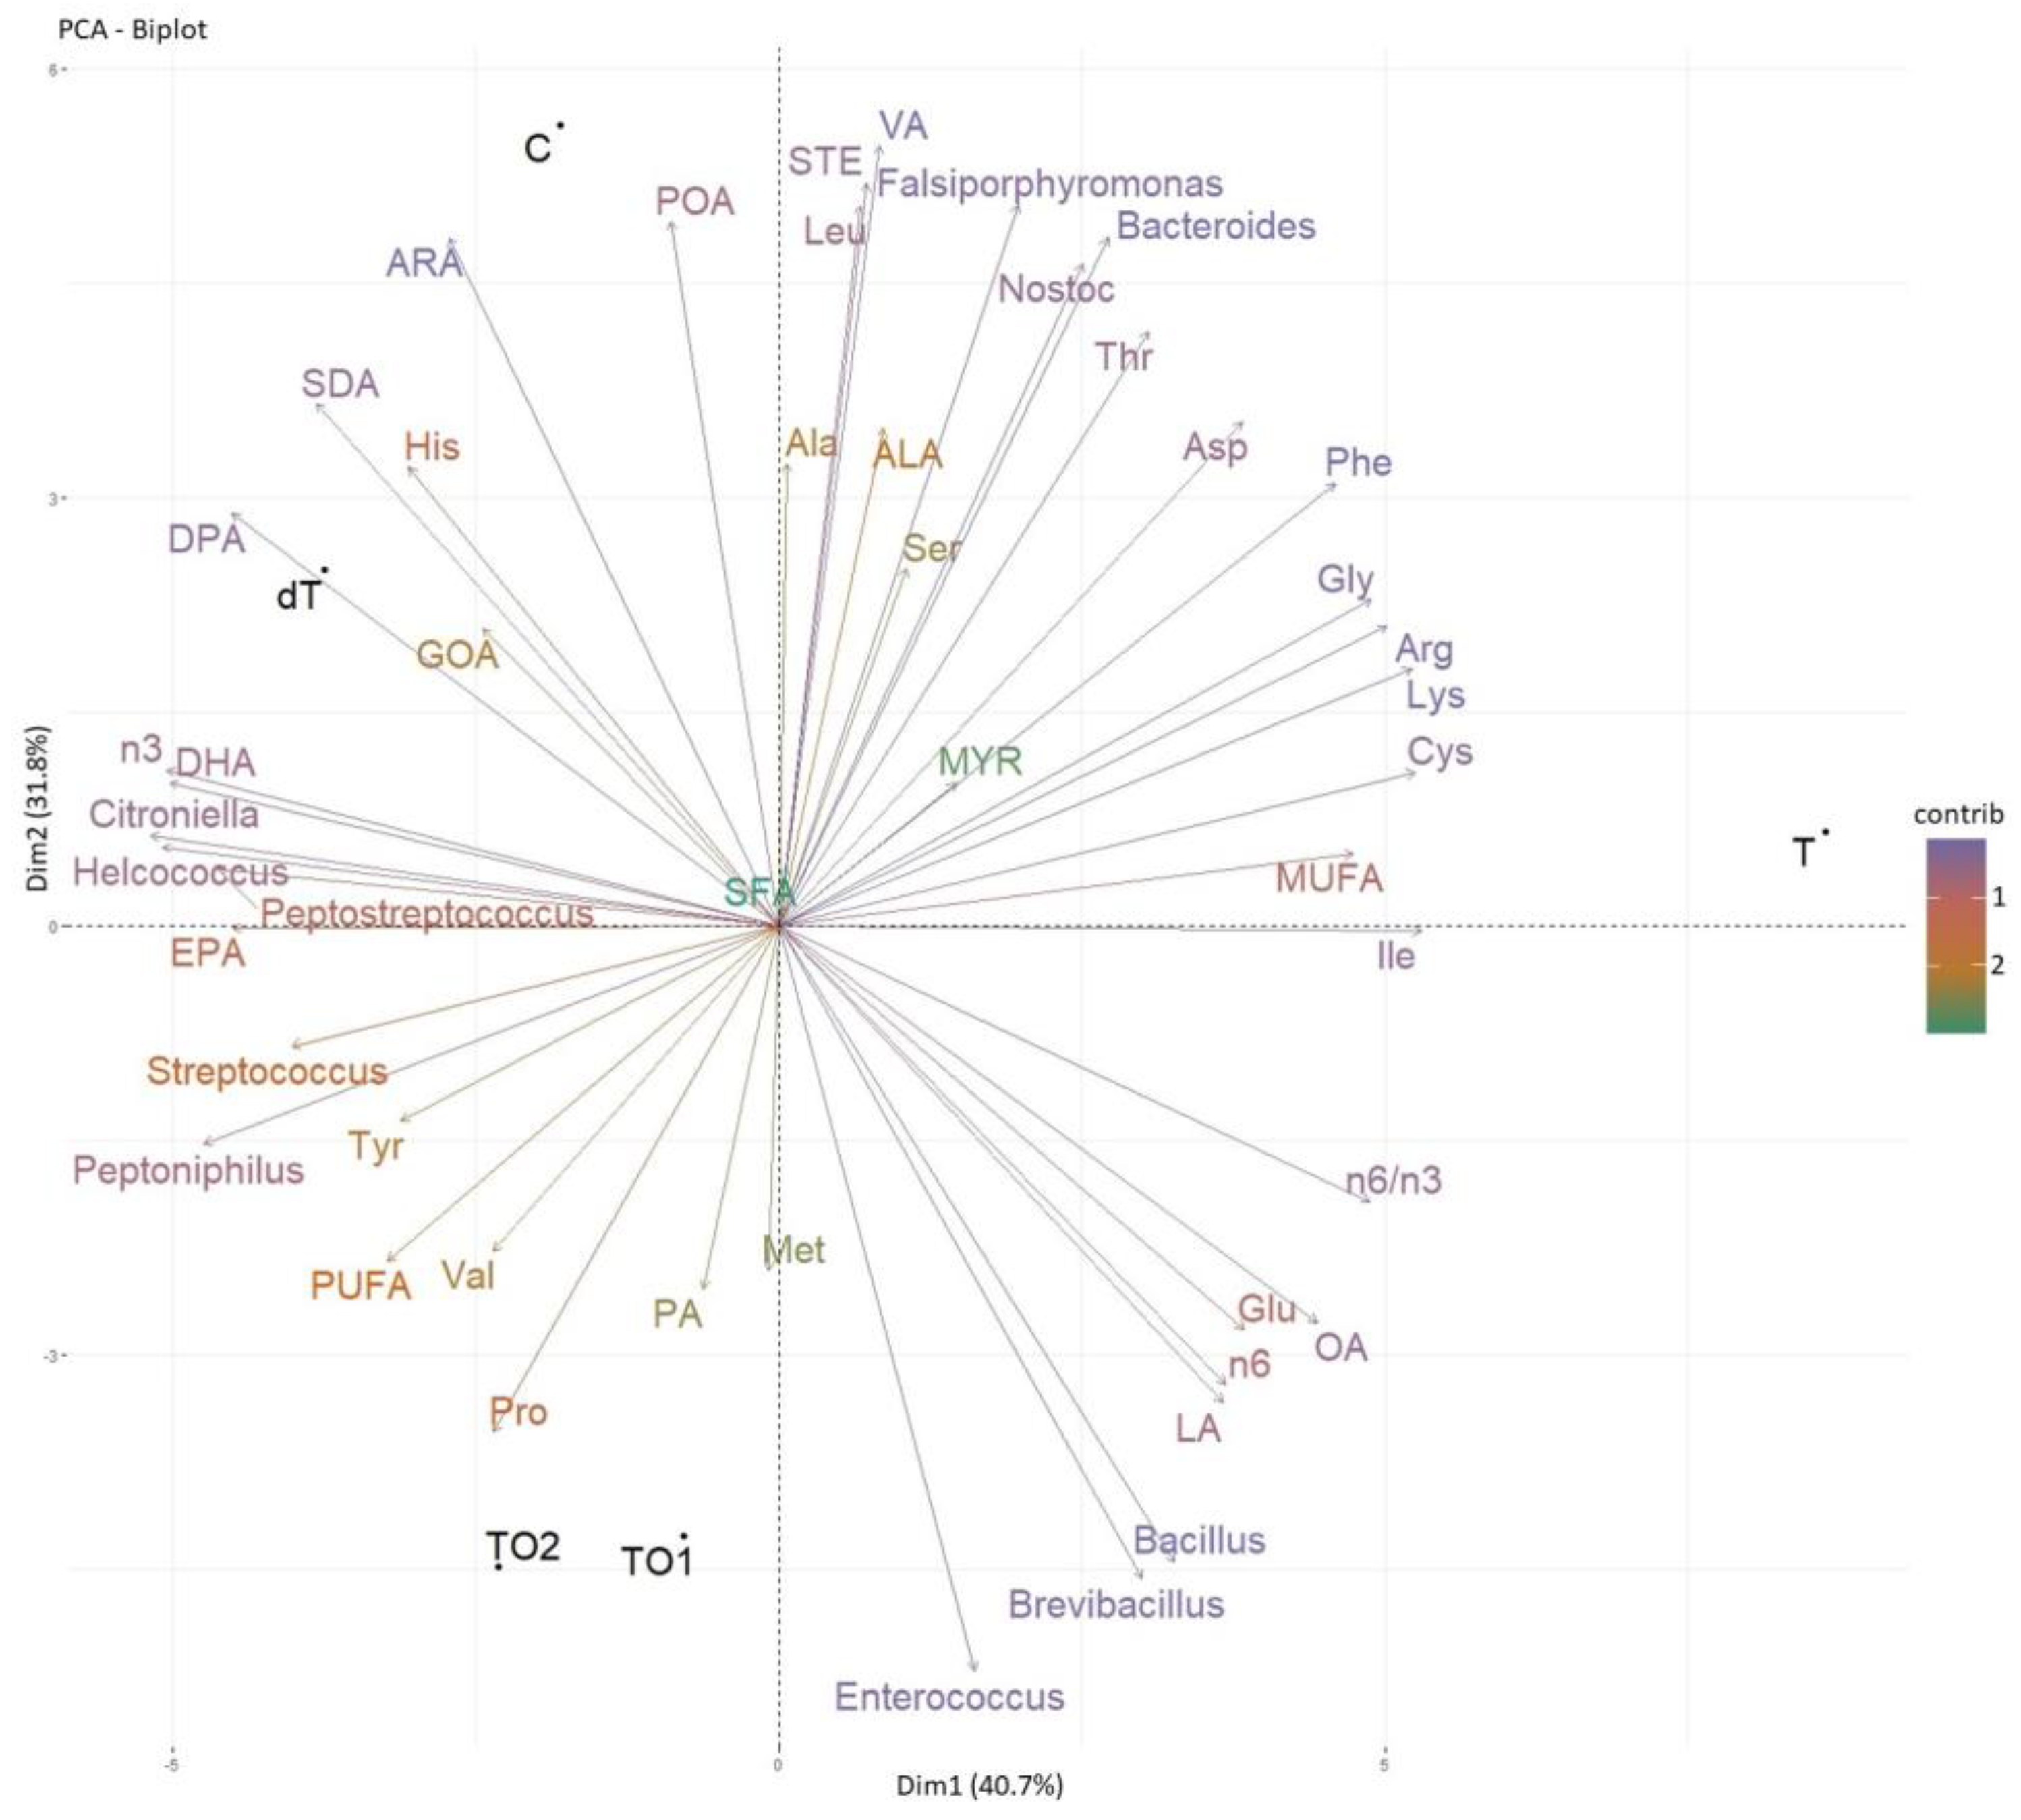
3.3.2. Gut Content Microbiota Analyses

  • Alpha diversity
The C diet had a significantly higher score for the Chao1 index, followed by T and dT, and with the lowest values for TO1 and TO2 diets. No differences were highlighted for the Simpson index. Shannon index was significantly higher in T than in dT (Table 6).
In sum, the experimental ingredients (insect meals, especially the defatted one and the algal oil) reduced the amount of absolute microbial populations. Chao1 index (richness) was significantly lowered by dT, TO1 and TO2, which aims to the idea that the inclusion of insect meals should be related to this change. Other experiments with both full-fat [83] and partially defatted [84] insect meals obtained similar results, but it would be worthwhile to mention that the opposite case has also been reported [34,85,86]. Shannon index only showed differences between T (higher) and dT (lower), possibly meaning that the evenness of the gut content microbiome was affected by the defatting process of the insect meal used in dT. This is partially supported by the current bibliography related to insect-fed fish since other experiments described lower levels of the Shannon index after using partially defatted insect meals [87,88], even in the feed itself [89].
  • Bacterial composition
Results are given at phylum and genus levels, and showed several differences among treatments. The results will be presented and discussed as groups to facilitate their overall comprehension, but the most specific details can be found in Table 7 and Table 8. At the phylum level, Bacillota was the most dominant population with a total abundance that went from ~66 to ~84% of the total. C treatment showed the highest values for Actinomycetota, with lower numbers for T, dT and TO2, staying TO1 in the middle. Bacteroidota was also higher for C, followed by T and dT, and with significant differences for the lowest values of TO1 and TO2. Cyanobacteria followed a similar trend, but in this case, dT had significant differences when compared with C and T, and TO1 offered the lowest results. Bacillota offered opposite results, with a higher value in TO2, middle scores for dT and TO1, and significantly lower levels for T and, finally, C. At the genus level, Peptostreptococcus (15.84–27.04%), Peptoniphilus (13.06–18.47%), Nostoc (4.49–13.18%) and Streptococcus (7.16–8.75%) were the most dominant. The number of Bacteroides and Falsiporphyromonas was higher in C, with a decreasing trend towards T and dT, and significant differences for TO1 and TO2. The amount of Nostoc was equivalent in C and T, with middle levels in dT (significantly different) and significantly lower levels for TO2 and TO1, in that order. Bacillus, Brevibacillus and Enterococcus followed similar trends, with significantly higher scores for T, TO1 and TO2 and lower for C and dT. dT showed the highest numbers for Helcococcus, Peptoniphilus, Citroniella and Peptostreptococcus, with medium values in C, TO1 and TO2 diets, and the lowest values in T, the case of Peptostreptococcus being more accused in these differences.
Bacterial composition was also affected by the experimental diets (Table 7 and Table 8). At the phylum level, there was an accused increase in Bacillota, especially for dT, TO1 and TO2, which seems to be a very common and steady result associated with the increase of insect meals in fish feedings [33,34,35,85]. This trend was inversely followed by Bacteroidota, a point where the bibliography offers more dispersed conclusions, even though a decrease in this population has been described as well [86,90,91].
The analysis at the genus level was reinforced with a Principal Component Analysis biplot between microbiota genus vs. amino acid and fatty acid compositions of the diets [Figure 3]. Three main groups of results are highlighted. First and foremost, the amount of Bacillus, Brevibacillus and Enterococcus suffered the most drastic changes among diets, with results close to zero in C and dT. According to the Principal Component Analysis, these differences were related to the levels of omega–6 fatty acids and linoleic acid in diets. Bacillus and Enterococcus are known for having probiotic properties in fish and promoting intestinal health [92,93,94]. Similar results were found in other trials with insect-fed fish [35,81,85,95], where these or other lactic-acid bacteria proliferated, which is positive from the point of view of using insect meals for fish diets. These results, and especially those of TO1 and TO2, matched the higher apparent digestibility coefficient of the protein previously described in this same study (Table 4). Because C and dT had the lowest values for these bacteria in our case, even though their populations showed some kind of tropism towards insect meals, it is possible that insect fat acted as the most relevant component.
The second group of results comprised Bacteroides, Falsiporphyromonas and Nostoc, which suffered a decrease in dT and a more pronounced decrease in TO1 and TO2. These populations showed a strong correlation with the amino acids leucine, threonine and aspartate, and with stearic and vaccenic acids, at the same time that they showed an inverse and strong relationship with polyunsaturated fatty acids. Lastly, Helcococcus, Citroniella, Peptostreptococcus and Peptoniphilus conformed to a third group that, with due differences, showed intermediate values for C, TO1 and TO2, and opposite behaviours between dT (highest values) and T (lowest values). The Principal Component Analysis revealed the particular relevance of omega–3, docosahexaenoic acid and eicosapentaenoic acid for this case, and an interesting interaction with tyrosine, even though its contribution was lesser. According to the composition of the insect meals [36], the diets (Table 2) and the bibliography [5], yellow mealworm is rich in tyrosine, which was reflected in the results of dT but not those of T in the Principal Component Analysis. This suggests that the composition of insect protein and omega–3 might be major determinants for the development of these bacteria, while high levels of oleic acid, omega–6, or even the higher omega–6/omega–3 ratio found in diets with insect fat (particularly marked in the T diet) could have acted as inhibitors, which would also make sense with the intermediate levels found in TO1 and TO2. Talking about the particular case of Peptostreptococcus, it is an anaerobic bacterium known for its ability to ferment amino acids, including those with an aromatic group [96,97], such as tyrosine. Even though no differences in growth were reported in this experiment [36], Peptostreptococcus had also been identified as an indicator taxa of fast-growing rainbow trout [98], which is a positive aspect of the evaluation of defatted yellow mealworm as an ingredient. Furthermore, the defatting process allows the concentration of more yellow mealworm protein in a diet formulation and, consequently, a higher amount of tyrosine.
Table 6. Effect of dietary treatments on microbiota alpha diversity of rainbow trout distal intestine content.
Alpha Diversity IndexCTdTTO1TO2SEMp ValueF ValueDF
Chao1309.75 a278.26 ab240.81 bc230.33 c224 c9.68<0.000114.124
Simpson0.930.950.910.930.930.010.12532.154
Shannon3.85 ab4.03 a3.67 b3.78 ab3.79 ab0.070.0343.474
Experimental diets: C—control (no fishmeal replacement); T—50% fishmeal replacement with Tenebrio molitor; dT—50% fishmeal replacement with partially defatted Tenebrio molitor; TO1—T diet supplemented with 3.09% of omega–3-enriched algal oil; TO2—T diet supplemented with 7.24% of algal oil. a,b,c show statistically significant differences among diets (p < 0.05); values are expressed as mean ± standard error of the mean (SEM; n = 4 tanks per diet). DF—degrees of freedom.
Table 7. Effect of dietary treatments on OTU composition at phylum level of rainbow trout distal intestine content.
Relative OTU Composition at Phylum LevelCTdTTO1TO2SEMp ValueF ValueDF
Actinomycetota 12.76 a1.83 b2.05 b2.21 ab1.78 b0.150.00187.284
Bacteroidota 212.44 a11.21 ab8.52 ab5.84 b5.50 b1.410.01034.864
Cyanobacteria13.86 a12.51 a7.99 b4.75 c6.11 bc0.58<0.000147.334
Bacillota 365.67 c69.17 bc78.78 ab79.04 ab83.59 a2.970.00346.364
Pseudomonadota 44.144.081.927.612.012.790.61280.694
Other1.131.200.740.541.00- ---
1: Phylum Actinomycetota, previously named Actinobacteria [99]; 2: phylum Bacteroidota, previously named Bacteroidetes [99]; 3: phylum Bacillota, previously named as Firmicutes [99]; 4: phylum Pseudomonadota, previously named as Proteobacteria [99]. Experimental diets: C—control (no fishmeal replacement); T—50% fishmeal replacement with Tenebrio molitor; dT—50% fishmeal replacement with partially defatted Tenebrio molitor; TO1—T diet supplemented with 3.09% of omega–3-enriched algal oil; TO2—T diet supplemented with 7.24% of algal oil. a,b,c show statistically significant differences among diets (p < 0.05); values are expressed as mean ± standard error of the mean (SEM; n = 4 tanks per diet). Chosen taxons had an overall abundance ≥ 0.5% of the sample. OTU—Operational taxonomic units. DF—degrees of freedom.
Table 8. Effect of dietary treatments on OTU composition at the genus level of rainbow trout distal intestine content.
Relative OTU Composition at Genus LevelCTdTTO1TO2SEMp ValueF ValueDF
Bacteroides3.7 a3.61 ab2.59 abc1.69 bc1.42 c0.440.00545.694
Falsiporphyromonas7.47 a6.46 ab5.11 ab3.62 b3.55 b0.830.01554.354
Nostoc13.18 a11.91 a7.56 b4.49 c5.77 bc0.56<0.000146.844
Bacillus0.21 b2.94 a0.25 b2.79 a2.5 a0.17<0.000169.584
Brevibacillus0.02 b8.06 a0.004 b7.12 a8.05 a0.5<0.000171.584
Enterococcus0.23 b1.78 a0.27 b2.51 a2.41 a0.19<0.000133.634
Streptococcus7.457.168.758.127.850.470.19481.734
Helcococcus1.18 ab0.86 b1.39 a1.22 a1.13 ab0.080.00555.674
Peptoniphilus14.86 ab13.06 b18.47 a16.2 ab17.64 a0.90.00485.864
Citroniella2.01 a1.55 b2.27 a2.04 a1.95 ab0.10.00236.894
Peptostreptococcus20.23 bc15.84 c27.04 a19.33 bc23.05 ab1.550.00187.324
Other29.4626.7726.330.8624.67-p-valueF-valueDF
Experimental diets: C—control (no fishmeal replacement); T—50% fishmeal replacement with Tenebrio molitor; dT—50% fishmeal replacement with partially defatted Tenebrio molitor; TO1—T diet supplemented with 3.09% of omega–3-enriched algal oil; TO2—T diet supplemented with 7.24% of algal oil. a,b,c show statistically significant differences among diets (p < 0.05); values are expressed as mean ± standard error of the mean (SEM; n = 4 tanks per diet). Chosen taxons had an overall abundance ≥ 0.5% of the sample. OTU—Operational taxonomic units. DF—degrees of freedom.

4. Conclusions

Despite showing no changes in growth, the use of protein was more efficient for TO1 and TO2, a result that was reflected as well in the intestinal somatic index. No changes were spotted in the performance of the non-specific immune system, but the activity of acid and alkaline phosphatases was higher for diets enriched with omega–3 (especially TO1). Intestinal histomorphology was mostly unaffected by the diets, but a mild level of inflammation was described for C, suggesting that insect meal-based diets could be softening a minor inflammatory effect induced by the vegetable ingredients present in all diets. Lastly, the diets modified the gut microbiome in a significant way, showing solid relationships with the amino acid and fatty acid composition of the diets.

Author Contributions

Conceptualization, A.E.M., H.J.P., M.J.S.-M. and C.T.-A.; Data curation, F.M. and C.T.-A.; Formal analysis, F.M. and C.T.-A.; Funding acquisition, A.M.L., A.E.M., H.J.P., M.J.S.-M. and C.T.-A.; Investigation, C.T.-A.; Methodology, F.M., A.M.L., M.H., D.A., A.E.M., H.J.P., D.F., A.G., F.J.A., H.M.L., M.-F.P. and C.T.-A.; Project administration, A.M.L. and C.T.-A.; Supervision, F.M. and A.M.L.; Writing—original draft, F.M. and C.T.-A.; Writing—review and editing, F.M. and C.T.-A. All authors have read and agreed to the published version of the manuscript.

Funding

This research was funded by INIA (Instituto Nacional de Investigación y Tecnología Agraria y Alimentaria) and co-funded by FEDER funds (Ref. RTA 2015-00021-C03). F. Melenchón was supported by a fellowship funded by AEI (Agencia Estatal de Investigación) awarded through the financial help of reference BES2017-080567 for PhD contracts with FSE funds. A. Galafat was supported by a fellowship funded by AquaTech4Feed (grant # PCI2020-112204) awarded by MCIN/AEI/10.13039/501100011033 and the EU “NextGenerationEU”/PRTR within the ERA-NET BioBlue COFUND.

Institutional Review Board Statement

The study was conducted according to the guidelines of the Declaration of Helsinki and approved by the Institutional Review Board (or Ethics Committee) of Instituto Tecnológico Agrario de Castilla y León (protocol code 2017/19/CEEA and date of approval 16 March 2017).

Data Availability Statement

Data are available on request due to restrictions (confidentiality agreements with private companies involved).

Acknowledgments

The authors would like to thank the Experimental Diets Service of the University of Almería (Almería, Spain) for the support in the feed formulation.

Conflicts of Interest

The authors declare no conflict of interest.

References

  1. FAO. The State of World Fisheries and Aquaculture 2022: Towards Blue Transformation; FAO: Rome, Italy, 2022. [Google Scholar] [CrossRef]
  2. Kok, B.; Malcorps, W.; Tlusty, M.F.; Eltholth, M.M.; Auchterlonie, N.A.; Little, D.C.; Harmsen, R.; Newton, R.W.; Davies, S.J. Fish as feed: Using economic allocation to quantify the Fish In: Fish Out ratio of major fed aquaculture species. Aquaculture 2020, 528, 735474. [Google Scholar] [CrossRef]
  3. Aas, T.S.; ÅsgÅrd, T.; Ytrestøyl, T. Utilization of feed resources in the production of rainbow trout (Oncorhynchus mykiss) in Norway in 2020. Aquac. Rep. 2022, 26, 101317. [Google Scholar] [CrossRef]
  4. Barroso, F.G.; de Haro, C.; Sánchez-Muros, M.-J.; Venegas, E.; Martínez-Sánchez, A.; Pérez-Bañón, C. The potential of various insect species for use as food for fish. Aquaculture 2014, 422–423, 193–201. [Google Scholar] [CrossRef]
  5. Makkar, H.P.; Tran, G.; Heuzé, V.; Ankers, P. State-of-the-art on use of insects as animal feed. Anim. Feed Sci. Technol. 2014, 197, 1–33. [Google Scholar] [CrossRef]
  6. Alfiko, Y.; Xie, D.; Astuti, R.T.; Wong, J.; Wang, L. Insects as a feed ingredient for fish culture: Status and trends. Aquac. Fish. 2022, 7, 166–178. [Google Scholar] [CrossRef]
  7. Nasdaq. Fishmeal Value. Available online: https://data.nasdaq.com/data/ODA/PFSHMEAL_USD (accessed on 20 January 2023).
  8. O’Keefe, T. Plant Protein Ingredients for Aquaculture Feeds: Use Considerations & Quality Standards; U.S. Soybean Export Council: Singapore, 2002. [Google Scholar]
  9. Krogdahl, Å.; Penn, M.; Thorsen, J.; Refstie, S.; Bakke, A.M. Important antinutrients in plant feedstuffs for aquaculture: An update on recent findings regarding responses in salmonids. Aquac. Res. 2010, 41, 333–344. [Google Scholar] [CrossRef]
  10. Hajra, A.; Mazumder, A.; Verma, A.; Ganguly, D.P.; Mohanty, B.P.; Sharma, A.P. Antinutritional factors in plant origin fish feed ingredients: The problems and probable remedies. In Advances in Fish Research; Goswami, U.C., Ed.; Narendra Publishing House: Delhi, India, 2013; Chapter 11; Volume V, ISBN 9789380428581. [Google Scholar]
  11. Baeverfjord, G.; Krogdahl, Å. Development and regression of soybean meal induced enteritis in Atlantic salmon, Salmo salar L., distal intestine: A comparison with the intestines of fasted fish. J. Fish. Dis. 1996, 19, 375–387. [Google Scholar] [CrossRef]
  12. Djordjevic, B.; Morales-Lange, B.; Øverland, M.; Mercado, L.; Lagos, L. Immune and proteomic responses to the soybean meal diet in skin and intestine mucus of Atlantic salmon (Salmo salar L.). Aquac. Nutr. 2021, 27, 929–940. [Google Scholar] [CrossRef]
  13. Todd Lorenz, R.; Cysewski, G.R. Commercial potential for Haematococcus microalgae as a natural source of astaxanthin. Trends Biotechnol. 2000, 18, 160–167. [Google Scholar] [CrossRef]
  14. Roy, S.S.; Pal, R. Microalgae in aquaculture: A review with special references to nutritional value and fish dietetics. Proc. Zool. Soc. 2015, 68, 1–8. [Google Scholar] [CrossRef]
  15. Hansen, J.Ø.; Hofossæter, M.; Sahlmann, C.; Ånestad, R.; Reveco-Urzua, F.E.; Press, C.M.; Mydland, L.T.; Øverland, M. Effect of Candida utilis on growth and intestinal health of Atlantic salmon (Salmo salar) parr. Aquaculture 2019, 511, 734239. [Google Scholar] [CrossRef]
  16. Agboola, J.O.; Øverland, M.; Skrede, A.; Hansen, J.Ø. Yeast as major protein-rich ingredient in aquafeeds: A review of the implications for aquaculture production. Rev. Aquac. 2021, 13, 949–970. [Google Scholar] [CrossRef]
  17. Van Huis, A. Potential of insects as food and feed in assuring food security. Annu. Rev. Entomol. 2013, 58, 563–583. [Google Scholar] [CrossRef] [PubMed]
  18. Van Huis, A.; Oonincx, D.G.A.B. The environmental sustainability of insects as food and feed. A review. Agron. Sustain. Dev. 2017, 37, 43. [Google Scholar] [CrossRef]
  19. Henry, M.A.; Gai, F.; Enes, P.; Pérez-Jiménez, A.; Gasco, L. Effect of partial dietary replacement of fishmeal by yellow mealworm (Tenebrio molitor) larvae meal on the innate immune response and intestinal antioxidant enzymes of rainbow trout (Oncorhynchus mykiss). Fish Shellfish Immunol. 2018, 83, 308–313. [Google Scholar] [CrossRef] [PubMed]
  20. Xu, X.; Ji, H.; Yu, H.; Zhou, J. Influence of dietary black soldier fly (Hermetia illucens Linnaeus) pulp on growth performance, antioxidant capacity and intestinal health of juvenile mirror carp (Cyprinus carpio var. specularis). Aquac. Nutr. 2020, 26, 432–443. [Google Scholar] [CrossRef]
  21. Melenchón, F.; Larrán, A.M.; de Mercado, E.; Hidalgo, M.C.; Cardenete, G.; Barroso, F.G.; Fabrikov, D.; Lourenço, H.M.; Pessoa, M.F.; Tomás-Almenar, C. Potential use of black soldier fly (Hermetia illucens) and mealworm (Tenebrio molitor) insectmeals in diets for rainbow trout (Oncorhynchus mykiss). Aquac. Nutr. 2021, 27, 491–505. [Google Scholar] [CrossRef]
  22. Hidalgo, M.C.; Morales, A.E.; Pula, H.J.; Tomás-Almenar, C.; Sánchez-Muros, M.J.; Melenchón, F.; Fabrikov, D.; Cardenete, G. Oxidative metabolism of gut and innate immune status in skin and blood of tench (Tinca tinca) fed with different insect meals (Hermetia illucens and Tenebrio molitor). Aquaculture 2022, 529, 735731. [Google Scholar] [CrossRef]
  23. Ngo, D.-N.; Kim, M.-M.; Kim, S.-K. Chitin oligosaccharides inhibit oxidative stress in live cells. Carbohydr. Polym. 2008, 74, 228–234. [Google Scholar] [CrossRef]
  24. Ngo, D.-H.; Kim, S.-K. Chapter two—Antioxidant effects of chitin, chitosan, and their derivatives. Adv. Food Nutr. Res. 2014, 73, 15–31. [Google Scholar] [CrossRef]
  25. Lee, C.G.; da Silva, C.A.; Lee, J.Y.; Hartl, D.; Elias, J.A. Chitin regulation of immune responses: An old molecule with new roles. Curr. Opin. Immunol. 2008, 20, 684–689. [Google Scholar] [CrossRef] [PubMed]
  26. Lindsay, G.J.H.; Walton, M.J.; Adron, J.W.; Fletcher, T.C.; Cho, C.Y.; Cowey, C.B. The growth of rainbow trout (Salmo gairdneri) given diets containing chitin and its relationship to chitinolytic enzymes and chitin digestibility. Aquaculture 1984, 37, 315–334. [Google Scholar] [CrossRef]
  27. Köprücü, K.; Özdemir, Y. Apparent digestibility of selected feed ingredients for Nile tilapia (Oreochromis niloticus). Aquaculture 2005, 250, 308–316. [Google Scholar] [CrossRef]
  28. Alegbeleye, W.O.; Obasa, S.O.; Olude, O.O.; Otubu, K.; Jimoh, W. Preliminary evaluation of the nutritive value of the variegated grasshopper (Zonocerus variegatus L.) for African catfish Clarias gariepinus (Burchell. 1822) fingerlings. Aquac. Res. 2012, 43, 412–420. [Google Scholar] [CrossRef]
  29. Lieberman, S.; Enig, M.G.; Preuss, H.G. A review of monolaurin and lauric acid: Natural virucidal and bactericidal agents. J. Altern. Complement. Med. 2006, 12, 310–314. [Google Scholar] [CrossRef]
  30. Gasco, L.; Finke, M.; van Huis, A. Can diets containing insects promote animal health? J. Insects Food Feed 2018, 4, 1–4. [Google Scholar] [CrossRef]
  31. Finke, M.D. Complete nutrient composition of commercially raised invertebrates used as food for insectivores. Zoo Biol. 2002, 21, 269–285. [Google Scholar] [CrossRef]
  32. Otvos, L. Antibacterial peptides isolated from insects. J. Peptide Sci. 2000, 6, 497–511. [Google Scholar] [CrossRef]
  33. Huyben, D.; Vidakovic, A.; Hallgren, S.W.; Langeland, M. High-throughput sequencing of gut microbiota in rainbow trout (Oncorhynchus mykiss) fed larval and pre-pupae stages of black soldier fly (Hermetia illucens). Aquaculture 2019, 500, 485–491. [Google Scholar] [CrossRef]
  34. Terova, G.; Rimoldi, S.; Ascione, C.; Gini, E.; Ceccotti, C.; Gasco, L. Rainbow trout (Oncorhynchus mykiss) gut microbiota is modulated by insect meal from Hermetia illucens prepupae in the diet. Rev. Fish Biol. Fish. 2019, 29, 465–486. [Google Scholar] [CrossRef]
  35. Weththasinghe, P.; Rocha, S.D.C.; Øyås, O.; Lagos, L.; Hansen, J.Ø.; Mydland, L.T.; Øverland, M. Modulation of Atlantic salmon (Salmo salar) gut microbiota composition and predicted metabolic capacity by feeding diets with processed black soldier fly (Hermetia illucens) larvae meals and fractions. Anim. Microbiome 2022, 4, 9. [Google Scholar] [CrossRef] [PubMed]
  36. Melenchón, F.; Larrán, A.M.; Sanz, M.-Á.; Rico, D.; Fabrikov, D.; Barroso, F.G.; Galafat, A.; Alarcón, F.J.; Morales, A.E.; Hidalgo, M.C.; et al. Different diets based on yellow mealworm (Tenebrio molitor)—Part A: Facing the decrease of omega-3 fatty acids in fillets of rainbow trout (Oncorhynchus mykiss). Fishes 2023, accepted. [Google Scholar]
  37. National Research Council. Nutrient Requirements of Fish; National Academies Press: Washington, DC, USA, 1993. [Google Scholar]
  38. Blanco Cachafeiro, M.C. La Trucha: Cría Industrial, 2nd ed.; Mundi-Prensa: Madrid, Spain, 2005. [Google Scholar]
  39. Cho, C.; Slinger, S.; Bayley, H. Bioenergetics of salmonid fishes: Energy intake, expenditure and productivity. Comp. Biochem. Physiol. Part B Comp. Biochem. 1982, 73, 25–41. [Google Scholar] [CrossRef]
  40. European Parliament. Book Directive 2010/63/EU of the European Parliament and of the Council of 22 September 2010 on the Protection of Animals Used for Scientific Purposes; European Parliament: Strasbourg, France, 2010; pp. 33–78. [Google Scholar]
  41. Real Decreto 53/2013, de 1 de Febrero, por El Que Se Establecen las Normas Básicas Aplicables para la Protección de los Animales Utilizados en Experimentación y Otros Fines Científicos, Incluyendo la Docencia. 2013. Available online: https://www.boe.es/eli/es/rd/2013/02/01/53 (accessed on 27 January 2023).
  42. Atkinson, J.L.; Hilton, J.W.; Slinger, S.J. Evaluation of acid-insoluble ash as an indicator of feed digestibility in rainbow trout (Salmo gairdneri). Can. J. Fish. Aquat. Sci. 1984, 41, 1384–1386. [Google Scholar] [CrossRef]
  43. Janssen, R.H.; Vincken, J.-P.; van den Broek, L.A.M.; Fogliano, V.; Lakemond, C.M.M. Nitrogen-to-protein conversion factors for three edible insects: Tenebrio molitor, Alphitobius diaperinus, and Hermetia illucens. J. Agric. Food Chem. 2017, 65, 2275–2278. [Google Scholar] [CrossRef]
  44. Swain, P.; Dash, S.; Sahoo, P.K.; Routray, P.; Sahoo, S.K.; Gupta, S.D.; Meher, P.K.; Sarangi, N. Non-specific immune parameters of brood Indian major carp Labeo rohita and their seasonal variations. Fish Shellfish Immunol. 2007, 22, 38–43. [Google Scholar] [CrossRef] [PubMed]
  45. Mashiter, K.E.; Morgan, M.R. Carbonic anhydrase levels in the tissues of flounders adapted to sea water and fresh water. Comp. Biochem. Physiol. Part A Mol. Integr. Physiol. 1975, 52, 713–717. [Google Scholar] [CrossRef] [PubMed]
  46. Thompson, I.; Choubert, G.; Houlihan, D.F.; Secombes, C.J. The effect of dietary vitamin A and astaxanthin on the immunocompetence of rainbow trout. Aquaculture 1995, 133, 91–102. [Google Scholar] [CrossRef]
  47. Huang, Z.-H.; Ma, A.-J.; Wang, X. The immune response of turbot, Scophthalmus maximus (L.), skin to high water temperature. J. Fish Dis. 2011, 34, 619–627. [Google Scholar] [CrossRef]
  48. Mohanty, B.R.; Sahoo, P.K. Immune responses and expression profiles of some immune-related genes in Indian major carp, Labeo rohita to Edwardsiella tarda infection. Fish Shellfish Immunol. 2010, 28, 613–621. [Google Scholar] [CrossRef]
  49. Panigrahi, A.; Kiron, V.; Puangkaew, J.; Kobayashi, T.; Satoh, S.; Sugita, H. The viability of probiotic bacteria as a factor influencing the immune response in rainbow trout Oncorhynchus mykiss. Aquaculture 2005, 243, 241–254. [Google Scholar] [CrossRef]
  50. Bradford, M. A rapid and sensitive method for the quantitation of microgram quantities of protein using the principle of protein dye-binding. Anal. Biochem. 1976, 72, 248–254. [Google Scholar] [CrossRef] [PubMed]
  51. Melenchón, F.; de Mercado, E.; Pula, H.J.; Cardenete, G.; Barroso, F.G.; Fabrikov, D.; Lourenço, H.M.; Pessoa, M.-F.; Lagos, L.; Weththasinghe, P.; et al. Fishmeal dietary replacement up to 50%: A comparative study of two insect meals for rainbow trout (Oncorhynchus mykiss). Animals 2022, 12, 179. [Google Scholar] [CrossRef]
  52. Hernández, M.; Quijada, N.M.; Rodríguez-Lázaro, D.; Eiros, J.M. Bioinformatics of next generation sequencing in clinical microbiology diagnosis. Rev. Argent. Microbiol. 2020, 52, 150–161. [Google Scholar] [CrossRef]
  53. Klindworth, A.; Pruesse, E.; Schweer, T.; Peplies, J.; Quast, C.; Horn, M.; Glöckner, F.O. Evaluation of general 16S ribosomal RNA gene PCR primers for classical and next-generation sequencing-based diversity studies. Nucleic Acids Res. 2013, 41, e1. [Google Scholar] [CrossRef]
  54. Joshi, N.A.; Fass, J.N. Sickle: A Sliding-Windows, Adaptive, Quality-Based Trimming Tool for FastQ Files; Version 1.33; 2011; Available online: https://github.com/najoshi/sickle (accessed on 27 April 2023).
  55. Abad, D.; Quijada, N.M.; Hernández, M. QiimeReporter. 2019. Available online: https://github.com/dabadgarcia/qiimereporter (accessed on 27 April 2023).
  56. Callahan, B.; McMurdie, P.; Rosen, M.; Han, A.W.; Johnson, A.J.; Holmes, S.P. DADA2: High-resolution sample inference from Illumina amplicon data. Nat. Methods 2016, 13, 581–583. [Google Scholar] [CrossRef] [PubMed]
  57. Wang, Q.; Garrity, G.M.; Tiedje, J.M.; Cole, J.R. Naïve bayesian classifier for rapid assignment of rRNA sequences into the new bacterial taxonomy. Appl. Environ. Microbiol. 2007, 73, 5261–5267. [Google Scholar] [CrossRef]
  58. Quast, C.; Pruesse, E.; Yilmaz, P.; Gerken, J.; Schweer, T.; Yarza, P.; Peplies, J.; Glöckner, F.O. The SILVA ribosomal RNA gene database project: Improved data processing and web-based tools. Nucleic Acids Res. 2013, 41, D590–D596. [Google Scholar] [CrossRef]
  59. Chao, A. Nonparametric estimation of the number of classes in a population. Scand. J. Stat. 1984, 11, 265–270. Available online: https://www.jstor.org/stable/4615964 (accessed on 27 April 2023).
  60. Simpson, E.H. Measurement of diversity. Nature 1949, 163, 688. [Google Scholar] [CrossRef]
  61. Shannon, C.E. A mathematical theory of communication. BSTJ 1948, 27, 379–423. [Google Scholar] [CrossRef]
  62. R Core Team. R: A Language and Environment for Statistical Computing; R Foundation for Statistical Computing: Vienna, Austria, 2021; Available online: https://www.R-project.org/ (accessed on 27 April 2023).
  63. RStudio Team. RStudio: Integrated Development Environment for R; RStudio, PBC: Boston, MA, USA, 2022; Available online: http://www.rstudio.com/ (accessed on 27 April 2023).
  64. Kroeckel, S.; Harjes, A.-G.E.; Roth, I.; Katz, H.; Wuertz, S.; Susenbeth, A.; Schulz, C. When a turbot catches a fly: Evaluation of a pre-pupae meal of the Black Soldier Fly (Hermetia illucens) as fish meal substitute—Growth performance and chitin degradation in juvenile turbot (Psetta maxima). Aquaculture 2012, 364–365, 345–352. [Google Scholar] [CrossRef]
  65. Marono, S.; Piccolo, G.; Loponte, R.; di Meo, C.; Attia, Y.A.; Nizza, A.; Bovera, F. In vitro crude protein digestibility of Tenebrio molitor and Hermetia illucens insect meals and its correlation with chemical composition traits. J. Anim. Sci. 2015, 14, 3889. [Google Scholar] [CrossRef]
  66. German, D.P.; Horn, M.H. Gut length and mass in herbivorous and carnivorous prickleback fishes (Teleostei: Stichaeidae): Ontogenetic, dietary, and phylogenetic effects. Mar. Biol. 2006, 148, 1123–1134. [Google Scholar] [CrossRef]
  67. Kramer, D.L.; Bryant, M.J. Intestine length in the fishes of a tropical stream: 2. Relationships to diet—The long and short of a convoluted issue. Environ. Biol. Fishes 1995, 42, 129–141. [Google Scholar] [CrossRef]
  68. Esteban, M.A.; Cuesta, A.; Ortuño, J.; Meseguer, J. Immunomodulatory effects of dietary intake of chitin on gilthead seabream (Sparus aurata L.) innate immune system. Fish Shellfish Immunol. 2001, 11, 303–315. [Google Scholar] [CrossRef] [PubMed]
  69. Veldkamp, T.; Dong, L.; Paul, A.; Govers, C. Bioactive properties of insect products for monogastric animals—A review. J. Insects Food Feed 2021, 8, 1027–1040. [Google Scholar] [CrossRef]
  70. Kumar, V.; Fawole, F.J.; Romano, N.; Hossain, M.S.; Labh, S.N.; Overturf, K.; Small, B.C. Insect (black soldier fly, Hermetia illucens) meal supplementation prevents the soybean meal-induced intestinal enteritis in rainbow trout and health benefits of using insect oil. Fish Shellfish Immunol. 2021, 109, 116–124. [Google Scholar] [CrossRef] [PubMed]
  71. Iger, Y.; Abraham, M. Rodlet cells in the epidermis of fish exposed to stressors. Tissue Cell 1997, 29, 431–438. [Google Scholar] [CrossRef]
  72. Ross, N.W.; Firth, K.J.; Wang, A.; Burka, J.F.; Johnson, S.C. Changes in hydrolytic enzyme activities of naïve Atlantic salmon Salmo salar skin mucus due to infection with the salmon louse Lepeophtheirus salmonis and cortisol implantation. Dis. Aquat. Org. 2000, 41, 43–51. [Google Scholar] [CrossRef]
  73. Moreno, I.M.; Mate, A.; Repetto, G.; Vázquez, C.M.; Cameán, A.M. Influence of microcystin-LR on the activity of membrane enzymes in rat intestinal mucosa. J. Physiol. Biochem. 2003, 59, 293–299. [Google Scholar] [CrossRef] [PubMed]
  74. Molina, R.; Moreno, I.; Pichardo, S.; Jos, A.; Moyano, R.; Monterde, J.G.; Cameán, A. Acid and alkaline phosphatase activities and pathological changes induced in tilapia fish (Oreochromis sp.) exposed subchronically to microcystins from toxic cyanobacterial blooms under laboratory conditions. Toxicon 2005, 46, 725–735. [Google Scholar] [CrossRef] [PubMed]
  75. Bruni, L.; Husein, Y.; Secci, G.; Tulli, F.; Parisi, G. Rainbow trout (Oncorhynchus mykiss) skin as potential n-3 fatty acid source. Waste Biomass Valoriz. 2021, 12, 5665–5673. [Google Scholar] [CrossRef]
  76. Zhou, Z.; Ringø, E.; Olsen, R.E.; Song, S.K. Dietary effects of soybean products on gut microbiota and immunity of aquatic animals: A review. Aquac. Nutr. 2018, 24, 644–665. [Google Scholar] [CrossRef]
  77. Agboola, J.O.; Mensah, D.D.; Hansen, J.Ø.; Lapeña, D.; Mydland, L.T.; Arntzen, M.Ø.; Horn, S.J.; Øyås, O.; Press, C.M.; Øverland, M. Effects of yeast species and processing on intestinal health and transcriptomic profiles of Atlantic salmon (Salmo salar) fed soybean meal-based diets in seawater. Int. J. Mol. Sci. 2022, 23, 1675. [Google Scholar] [CrossRef]
  78. Xu, X.; Ji, H.; Belghit, I.; Liland, N.S.; Wu, W.; Li, X. Effects of black soldier fly oil rich in n-3 HUFA on growth performance, metabolism and health response of juvenile mirror carp (Cyprinus carpio var. specularis). Aquaculture 2021, 533, 736144. [Google Scholar] [CrossRef]
  79. Løvmo, S.D.; Sundh, H.; Whatmore, P.; Nordvi, M.F.; Sigholt, T.; Madato, A.; Bardal, T.; Olsen, R.E. Intestinal health in Atlantic salmon post-smolt (Salmo salar) when fed low and high HUFA diets. Aquaculture 2022, 557, 738318. [Google Scholar] [CrossRef]
  80. Basto, A.; Calduch-Giner, J.; Oliveira, B.; Petit, L.; Sá, T.; Maia, M.R.G.; Fonseca, S.C.; Matos, E.; Pérez-Sánchez, J.; Valente, L.M.P. The use of defatted Tenebrio molitor larvae meal as a main protein source is supported in European sea bass (Dicentrarchus labrax) by data on growth performance, lipid metabolism, and flesh quality. Front. Physiol. 2021, 12, 659567. [Google Scholar] [CrossRef]
  81. Józefiak, A.; Nogales-Mérida, S.; Rawski, M.; Kierończyk, B.; Mazurkiewicz, J. Effects of insect diets on the gastrointestinal tract health and growth performance of Siberian sturgeon (Acipenser baerii Brandt, 1869). BMC Vet. Res. 2019, 15, 348. [Google Scholar] [CrossRef]
  82. Mikołajczak, Z.; Rawski, M.; Mazurkiewicz, J.; Kierończyk, B.; Józefiak, D. The Effect of hydrolyzed insect meals in sea trout fingerling (Salmo trutta m. trutta) diets on growth performance, microbiota and biochemical blood parameters. Animals 2020, 10, 1031. [Google Scholar] [CrossRef]
  83. Zarantoniello, M.; Randazzo, B.; Gioacchini, G.; Truzzi, C.; Giorgini, E.; Riolo, P.; Gioia, G.; Bertolucci, C.; Osimani, A.; Cardinaletti, G.; et al. Zebrafish (Danio rerio) physiological and behavioural responses to insect-based diets: A multidisciplinary approach. Sci. Rep. 2020, 10, 10648. [Google Scholar] [CrossRef] [PubMed]
  84. Gaudioso, G.; Marzorati, G.; Faccenda, F.; Weil, T.; Lunelli, F.; Cardinaletti, G.; Marino, G.; Olivotto, I.; Parisi, G.; Tibaldi, E.; et al. Processed animal proteins from insect and poultry by-products in a fish meal-free diet for rainbow trout: Impact on intestinal microbiota and inflammatory markers. Int. J. Mol. Sci. 2021, 22, 5454. [Google Scholar] [CrossRef] [PubMed]
  85. Rimoldi, S.; Antonini, M.; Gasco, L.; Moroni, F.; Terova, G. Intestinal microbial communities of rainbow trout (Oncorhynchus mykiss) may be improved by feeding a Hermetia illucens meal/low-fishmeal diet. Fish Physiol. Biochem. 2021, 47, 365–380. [Google Scholar] [CrossRef] [PubMed]
  86. Tran, H.Q.; Prokešová, M.; Zare, M.; Gebauer, T.; Elia, A.C.; Colombino, E.; Ferrocino, I.; Caimi, C.; Gai, F.; Gasco, L.; et al. How does pikeperch Sander lucioperca respond to dietary insect meal Hermetia illucens? Investigation on gut microbiota, histomorphology, and antioxidant biomarkers. Front. Mar. Sci. 2021, 8, 680942. [Google Scholar] [CrossRef]
  87. Rimoldi, S.; Gini, E.; Iannini, F.; Gasco, L.; Terova, G. The effects of dietary insect meal from Hermetia illucens prepupae on autochthonous gut microbiota of rainbow trout (Oncorhynchus mykiss). Animals 2019, 9, 143. [Google Scholar] [CrossRef]
  88. Biasato, I.; Chemello, G.; Oddon, S.B.; Ferrocino, I.; Corvaglia, M.R.; Caimi, C.; Resconi, A.; Paul, A.; van Spankeren, M.; Capucchio, M.T.; et al. Hermetia illucens meal inclusion in low-fishmeal diets for rainbow trout (Oncorhynchus mykiss): Effects on the growth performance, nutrient digestibility coefficients, selected gut health traits, and health status indices. Anim. Feed Sci. Technol. 2022, 290, 115341. [Google Scholar] [CrossRef]
  89. Terova, G.; Gini, E.; Gasco, L.; Moroni, F.; Antonini, M.; Rimoldi, S. Effects of full replacement of dietary fishmeal with insect meal from Tenebrio molitor on rainbow trout gut and skin microbiota. J. Anim. Sci. Biotechnol. 2021, 12, 30. [Google Scholar] [CrossRef]
  90. Antonopoulou, E.; Nikouli, E.; Piccolo, G.; Gasco, L.; Gai, F.; Chatzifotis, S.; Mente, E.; Kormas, K.A. Reshaping gut bacterial communities after dietary Tenebrio molitor larvae meal supplementation in three fish species. Aquaculture 2019, 503, 628–635. [Google Scholar] [CrossRef]
  91. Piazzon, M.C.; Naya-Català, F.; Pereira, G.V.; Estensoro, I.; del Pozo, R.; Calduch-Giner, J.A.; Nuez-Ortín, W.G.; Palenzuela, O.; Sitjà-Bobadilla, A.; Dias, J.; et al. A novel fish meal-free diet formulation supports proper growth and does not impair intestinal parasite susceptibility in gilthead sea bream (Sparus aurata) with a reshape of gut microbiota and tissue-specific gene expression patterns. Aquaculture 2022, 558, 738362. [Google Scholar] [CrossRef]
  92. Chang, C.-I.; Liu, W.-Y. An evaluation of two probiotic bacterial strains, Enterococcus faecium SF68 and Bacillus toyoi, for reducing edwardsiellosis in cultured European eel, Anguilla anguilla L. J. Fish Dis. 2002, 25, 311–315. [Google Scholar] [CrossRef]
  93. Capkin, E.; Altinok, I. Effects of dietary probiotic supplementations on prevention⁄treatment of yersiniosis disease. J. Appl. Microbiol. 2009, 106, 1147–1153. [Google Scholar] [CrossRef] [PubMed]
  94. Dimitroglou, A.; Merrifield, D.L.; Carnevali, O.; Picchietti, S.; Avella, M.; Daniels, C.; Güroy, D.; Davies, S.J. Microbial manipulations to improve fish health and production—A Mediterranean perspective. Fish Shellfish Immunol. 2011, 30, 1–16. [Google Scholar] [CrossRef] [PubMed]
  95. Józefiak, A.; Nogales-Mérida, S.; Mikołajczak, Z.; Rawski, M.; Kierończyk, B.; Mazurkiewicz, J. The utilization of full-fat insect meal in rainbow trout (Oncorhynchus mykiss) nutrition: The effects on growth performance, intestinal microbiota and gastrointestinal tract histomorphology. Ann. Anim. Sci. 2019, 19, 747–765. [Google Scholar] [CrossRef]
  96. Smith, E.A.; Macfarlane, G.T. Enumeration of human colonic bacteria producing phenolic and indolic compounds: Effects of pH, carbohydrate availability and retention time on dissimilatory aromatic amino acid metabolism. J. Appl. Bacteriol. 1996, 81, 288–302. [Google Scholar] [CrossRef]
  97. Neis, E.P.J.G.; Dejong, C.H.C.; Rensen, S.S. The role of microbial amino acid metabolism in host metabolism. Nutrients 2015, 7, 2930–2946. [Google Scholar] [CrossRef]
  98. Chapagain, P.; Arivett, B.; Cleveland, B.M.; Walker, D.M.; Salem, M. Analysis of the fecal microbiota of fast- and slow-growing rainbow trout (Oncorhynchus mykiss). BMC Genom. 2019, 20, 788. [Google Scholar] [CrossRef]
  99. Oren, A.; Garrity, G.M. Valid publication of the names of forty-two phyla of prokaryotes. Int. J. Syst. Evol. Microbiol. 2021, 71, 005056. [Google Scholar] [CrossRef]
Figure 1. Quantitative measures during histomorphology analyses of rainbow trout gut. Experimental diets: C—control (no fishmeal replacement); T—50% fishmeal replacement with Tenebrio molitor; dT—50% fishmeal replacement with partially defatted Tenebrio molitor; TO1—T diet supplemented with 3.09% of omega–3-enriched algal oil; TO2—T diet supplemented with 7.24% of algal oil. Grey bars—distal intestine measures; striped bars—pyloric caeca measures. Values expressed as mean ± standard error of the mean (SEM; n = 4 tanks per diet). Microphotograph representative of measures for the gut: villi height (VH), villi width (VW), enterocyte height (EH), stratum compactum (SC), muscular layer width (ML), lamina propria width (LP). Scale bar = 100 µm.
Fishes 08 00284 g001
Figure 2. Visual example of the histomorphology qualitative analyses carried out in rainbow trout intestine. Pictures (A,B) (distal intestine), with (E,F) (pyloric caeca) are examples of the degree of inflammatory infiltration and were taken at 100× magnification, scale bars = 50 µm. Pictures (C,D) (distal intestine) are examples of the degree of vacuole loss and were taken at 400× magnification, scale bars = 10 µm. Pictures on the left represent a negative level (−) of the variables, while pictures on the right represent a low level (+).
Fishes 08 00284 g002
Figure 3. Principal Component Analysis of main distal intestine content microbiota genus of rainbow trout vs. feed composition (amino acids and fatty acids). Experimental diets: C—control (no fishmeal replacement); T—50% fishmeal replacement with Tenebrio molitor; dT—50% fishmeal replacement with partially defatted Tenebrio molitor; TO1—T diet supplemented with 3.09% of omega–3-enriched algal oil; TO2—T diet supplemented with 7.24% of algal oil. Acronyms used for amino acids and fatty acids follow the same key as Table 2 and Table 3.
Fishes 08 00284 g003
Table 1. Table 1. Formulation and proximate composition of experimental diets.
Ingredients (%; on dry basis)CTdTTO1TO2
Fishmeal LT94 136.7818.2818.4818.2818.28
Yellow mealworm meal 2-19.05-19.0519.05
Defatted yellow mealworm meal 3--18.29--
Enriched omega–3 oil---3.097.24
Wheat gluten 411.0512.4110.6512.4112.41
Soybean protein concentrate 515.0916.415.4116.416.4
Wheat meal 616.1616.9816.1916.9816.98
Soybean lecithin 71.270.481.270.480.48
Fish oil 811.878.6811.95.61.45
Vitamin and mineral premix 91.951.931.951.931.93
Goma guar 101.951.931.951.931.93
Blood meal 103.893.863.903.863.86
Methionine 100.20.50.50.50.5
Lysine 10-0.10.10.10.1
Proximate composition
(%; on dry basis)
CTdTTO1TO2
Crude protein49.1948.7648.9849.2548.23
Crude lipid17.8018.5817.8618.9919.12
Crude fibre0.972.152.352.252.47
Ash8.638.496.316.226.12
Calcium (Ca)0.430.240.170.180.20
Phosphorus (P)0.310.240.240.240.24
Ca:P ratio1.381.00.730.770.86
Data taken from Melenchón et al. [36]. 1 Norsildemel, Norway. 2 Tebrio, Spain. 3 Ÿnsect, France. 4 78% crude protein (Lorca Nutrición Animal SA, Spain). 5 Soycomil, 60% crude protein, 1.5% crude lipid (ADM, Poland). 6 Local provider (Spain). 7 P700IP (Lecico, DE). 8 AF117DHA (Afamsa, Spain). 9 Lifebioencapsulation SL: Vitamin and mineral premix (g/100 g feed unless otherwise specified): vitamin A 2,000,000 UI; vitamin D3: 200,000 UI; vitamin E: 1.2; vitamin K3: 0.26; vitamin B1: 0.3; vitamin B2: 0.3; vitamin B6: 0.2; vitamin B9: 0.15; vitamin B12: 0.001; vitamin H: 0.03; inositol: 5; betaine: 5; calcium pantothenate: 1; nicotic acid: 2; Co: 0.006; Cu: 0.09; Fe: 0.06; I: 0.005; Mn: 0.095; Se: 0.0001; Zn: 0.075; Ca: 19; K: 2.4; Na: 4.1. 10 Lorca Nutrición Animal SA, Spain. C—control diet (no fishmeal replacement); T—50% fishmeal replacement with Tenebrio molitor; dT—50% fishmeal replacement with partially defatted Tenebrio molitor; TO1—T diet supplemented with 3.09% of omega–3-enriched oil; TO2—T diet supplemented with 7.24% of algal oil.
Table 2. Amino acid composition of experimental diets.
Amino Acid Composition
(g/100 g Wet Feed)
CTdTTO1TO2
Essential amino acids
Arg2.102.352.082.012.00
His1.091.021.051.051.04
Ile1.501.691.451.561.44
Leu3.002.993.022.902.88
Lys2.943.662.772.702.66
Met1.011.151.231.181.13
Phe2.072.192.011.961.95
Thr1.481.561.481.311.36
Val2.102.072.162.252.10
Non-essential amino acids
Ala2.012.062.181.951.94
Asp3.323.563.353.103.12
Cys0.460.660.460.430.44
Glu7.157.647.417.447.44
Gly1.922.201.911.811.80
Pro2.462.512.672.742.61
Ser1.761.871.911.651.79
Tyr1.631.782.942.122.42
Data taken from Melenchón et al. [36]. Experimental diets: C—control (no fishmeal replacement); T—50% fishmeal replacement with Tenebrio molitor; dT—50% fishmeal replacement with partially defatted Tenebrio molitor; TO1—T diet supplemented with 3.09% of omega–3-enriched algal oil; TO2—T diet supplemented with 7.24% of algal oil.
Table 3. Fatty acid composition of experimental diets.
Fatty Acid Composition
(g/100 Total Fatty Acids)
CTdTTO1TO2
MYR; C14:03.683.262.553.163.20
PA; C16:021.1319.3717.3520.7522.74
POA; C16:1n–74.682.973.563.022.00
STE; C18:05.674.784.963.952.87
OA; C18:1n–913.6723.0516.1720.4717.14
VA; C18:1n–72.601.541.420.000.00
LA; C18:2n–68.7718.6913.7515.3115.21
ALA; C18:3n–31.121.331.560.950.87
SDA; C18:4n–30.820.440.890.610.51
GOA; C20:1n–90.980.761.751.140.56
ARA; C20:4n–61.661.221.561.171.26
EPA; C20:5n–38.313.926.426.338.51
DPA; C22:5n–31.330.891.491.081.12
DHA; C22:6n–318.7914.0519.0716.1019.20
Other (up to 100%)6.793.737.505.964.81
∑SFA30.4827.4124.8727.8628.81
∑MUFA21.9328.3222.9124.6319.70
∑PUFA40.8040.5444.7341.5646.67
∑n–330.3720.6329.4225.0730.20
∑n–610.4319.9115.3116.4916.47
∑n–6/∑n–30.340.970.520.660.55
∑Total fatty acids100100100100100
Data taken from Melenchón et al. [36]. Experimental diets: C—control (no fishmeal replacement); T—50% fishmeal replacement with Tenebrio molitor; dT—50% fishmeal replacement with partially defatted Tenebrio molitor; TO1—T diet supplemented with 3.09% of omega–3-enriched algal oil; TO2—T diet supplemented with 7.24% of algal oil.
Table 4. Growth performance, protein utilization, biometric indices and butchering yield in rainbow trout fed experimental diets.
Growth performanceCTdTTO1TO2SEMp-valueF-valueDF
IBW (g)46.1146.2546.0846.246.050.110.64610.924
Final length (cm)29.9429.8630.0630.0129.840.120.67870.584
SGR (%/day)2.472.462.482.472.460.010.5920.724
FCR0.860.850.860.850.850.0050.45680.964
Protein utilizationCTdTTO1TO2SEMp-valueF-valueDF
PER2.63 ab2.68 a2.6 b2.64 ab2.67 a0.020.01424.474
PPV (%)46.8948.8346.6647.0547.10.680.21651.644
ADCprot (%)88.31 b88.86 b88.18 b90.5 a91.1 a0.22<0.000136.074
Biometric indicesCTdTTO1TO2SEMp-valueF-valueDF
CF (g/cm3)1.551.551.541.551.550.020.94070.194
HSI (%)1.331.31.21.171.140.150.12092.184
VSI (%)11.1410.4510.0210.139.940.360.16521.894
ISI (%)4.58 a4.3 abc4.33 ab3.82 c3.99 bc0.110.00217.094
IL/FL (%)70.2866.0767.166564.211.690.15241.964
Butchering yieldCTdTTO1TO2SEMp-valueF-valueDF
Dressing yield (%)89.9590.690.5490.8791.280.320.09692.394
Filleting yield (%)57.9158.7359.560.360.160.590.05972.874
Growth performance taken from Melenchón et al. [36]. Experimental diets: C—control (no fishmeal replacement); T—50% fishmeal replacement with Tenebrio molitor; dT—50% fishmeal replacement with partially defatted Tenebrio molitor; TO1—T diet supplemented with 3.09% of omega–3-enriched algal oil; TO2—T diet supplemented with 7.24% of algal oil. IBW—initial body weight; SGR (specific growth rate) = [(ln FBW − ln IBW)/days] × 100; FCR (feed conversion ratio) = [total feed intake (g)/(FBW − IBW)]; PER (protein efficiency ratio) = [total weight gain (g)/protein intake (g)]; PPV (productive protein value) = [(protein gain (g)/protein intake (g)) × 100]; ADCprot (apparent digestibility coefficient of the protein) = [1 − (marker in diet/marker in faeces) × (% protein in faeces/% protein in the diet)] × 100; CF (condition factor) = [weight (g)/length3 (cm)] × 100; HSI (hepatosomatic index) = [wet liver weight/FBW] × 100; VSI (viscerosomatic index) = [wet visceral weight/FBW] × 100; ISI (intestinal somatic index) = [wet intestine weight/FBW] × 100; IL/FL (intestine length/fish length) = [intestine length/fish length] × 100; dressing yield = (wet gutted body weight/FBW) × 100; filleting yield = (wet fillet weight/FBW) × 100. a,b,c show statistically significant differences among diets (p < 0.05). Values expressed as mean ± standard error of the mean (SEM; n = 4 tank per diet). DF—degrees of freedom.
Table 5. Effect of dietary treatments on plasma and skin mucus immunological status of rainbow trout.
Immunological system (plasma)CTdTTO1TO2SEMp-valueF-valueDF
Lysozyme2.222.221.991.682.620.210.07262.684
Antiprotease163.75168.86164.46164.12130.779.210.06052.864
Acid phosphatase973.55919.88746.491019.55926.2380.570.21331.654
Alkaline phosphatase1040.85834.11054.881036.89930.763.170.10972.274
Peroxidase0.820.940.760.810.760.070.38561.124
Immunoglobulins17.4818.1816.1915.116.250.860.15581.944
Immunological system (skin mucus)CTdTTO1TO2SEMp-valueF-valueDF
Acid phosphatase1256.02 b1095.21 b1376.64 b2471.43 a1642.04 ab207.110.00246.874
Alkaline phosphatase1286.65 b2196.06 ab2781.82 ab3320.95 a2694.87 ab431.580.04573.154
Peroxidase16.8323.0913.8520.4111.523.490.17711.824
Esterase11.9113.039.6711.79.441.240.24261.534
Carbonic anhydrase685.83485.73429.89131.3460.53153.970.16081.964
Experimental diets: C—control (no fishmeal replacement); T—50% fishmeal replacement with Tenebrio molitor; dT—50% fishmeal replacement with partially defatted Tenebrio molitor; TO1—T diet supplemented with 3.09% of omega–3-enriched algal oil; TO2—T diet supplemented with 7.24% of algal oil. Lysozyme activity expressed as U/mL; antiprotease, peroxidase and esterase as U/mg protein; acid and alkaline phosphatases and carbonic anhydrase as mU/mg protein; immunoglobulins as mg/mL. a,b show statistically significant differences among diets (p < 0.05); values are expressed as mean ± standard error of the mean (SEM; n = 4 tanks per diet). DF—degrees of freedom.
Disclaimer/Publisher’s Note: The statements, opinions and data contained in all publications are solely those of the individual author(s) and contributor(s) and not of MDPI and/or the editor(s). MDPI and/or the editor(s) disclaim responsibility for any injury to people or property resulting from any ideas, methods, instructions or products referred to in the content.

