
Distributional Changes in Fishery Resource Diversity Caused by Typhoon Pathways in the East/Japan Sea

Abstract
:1. Introduction
2. Data and Methods
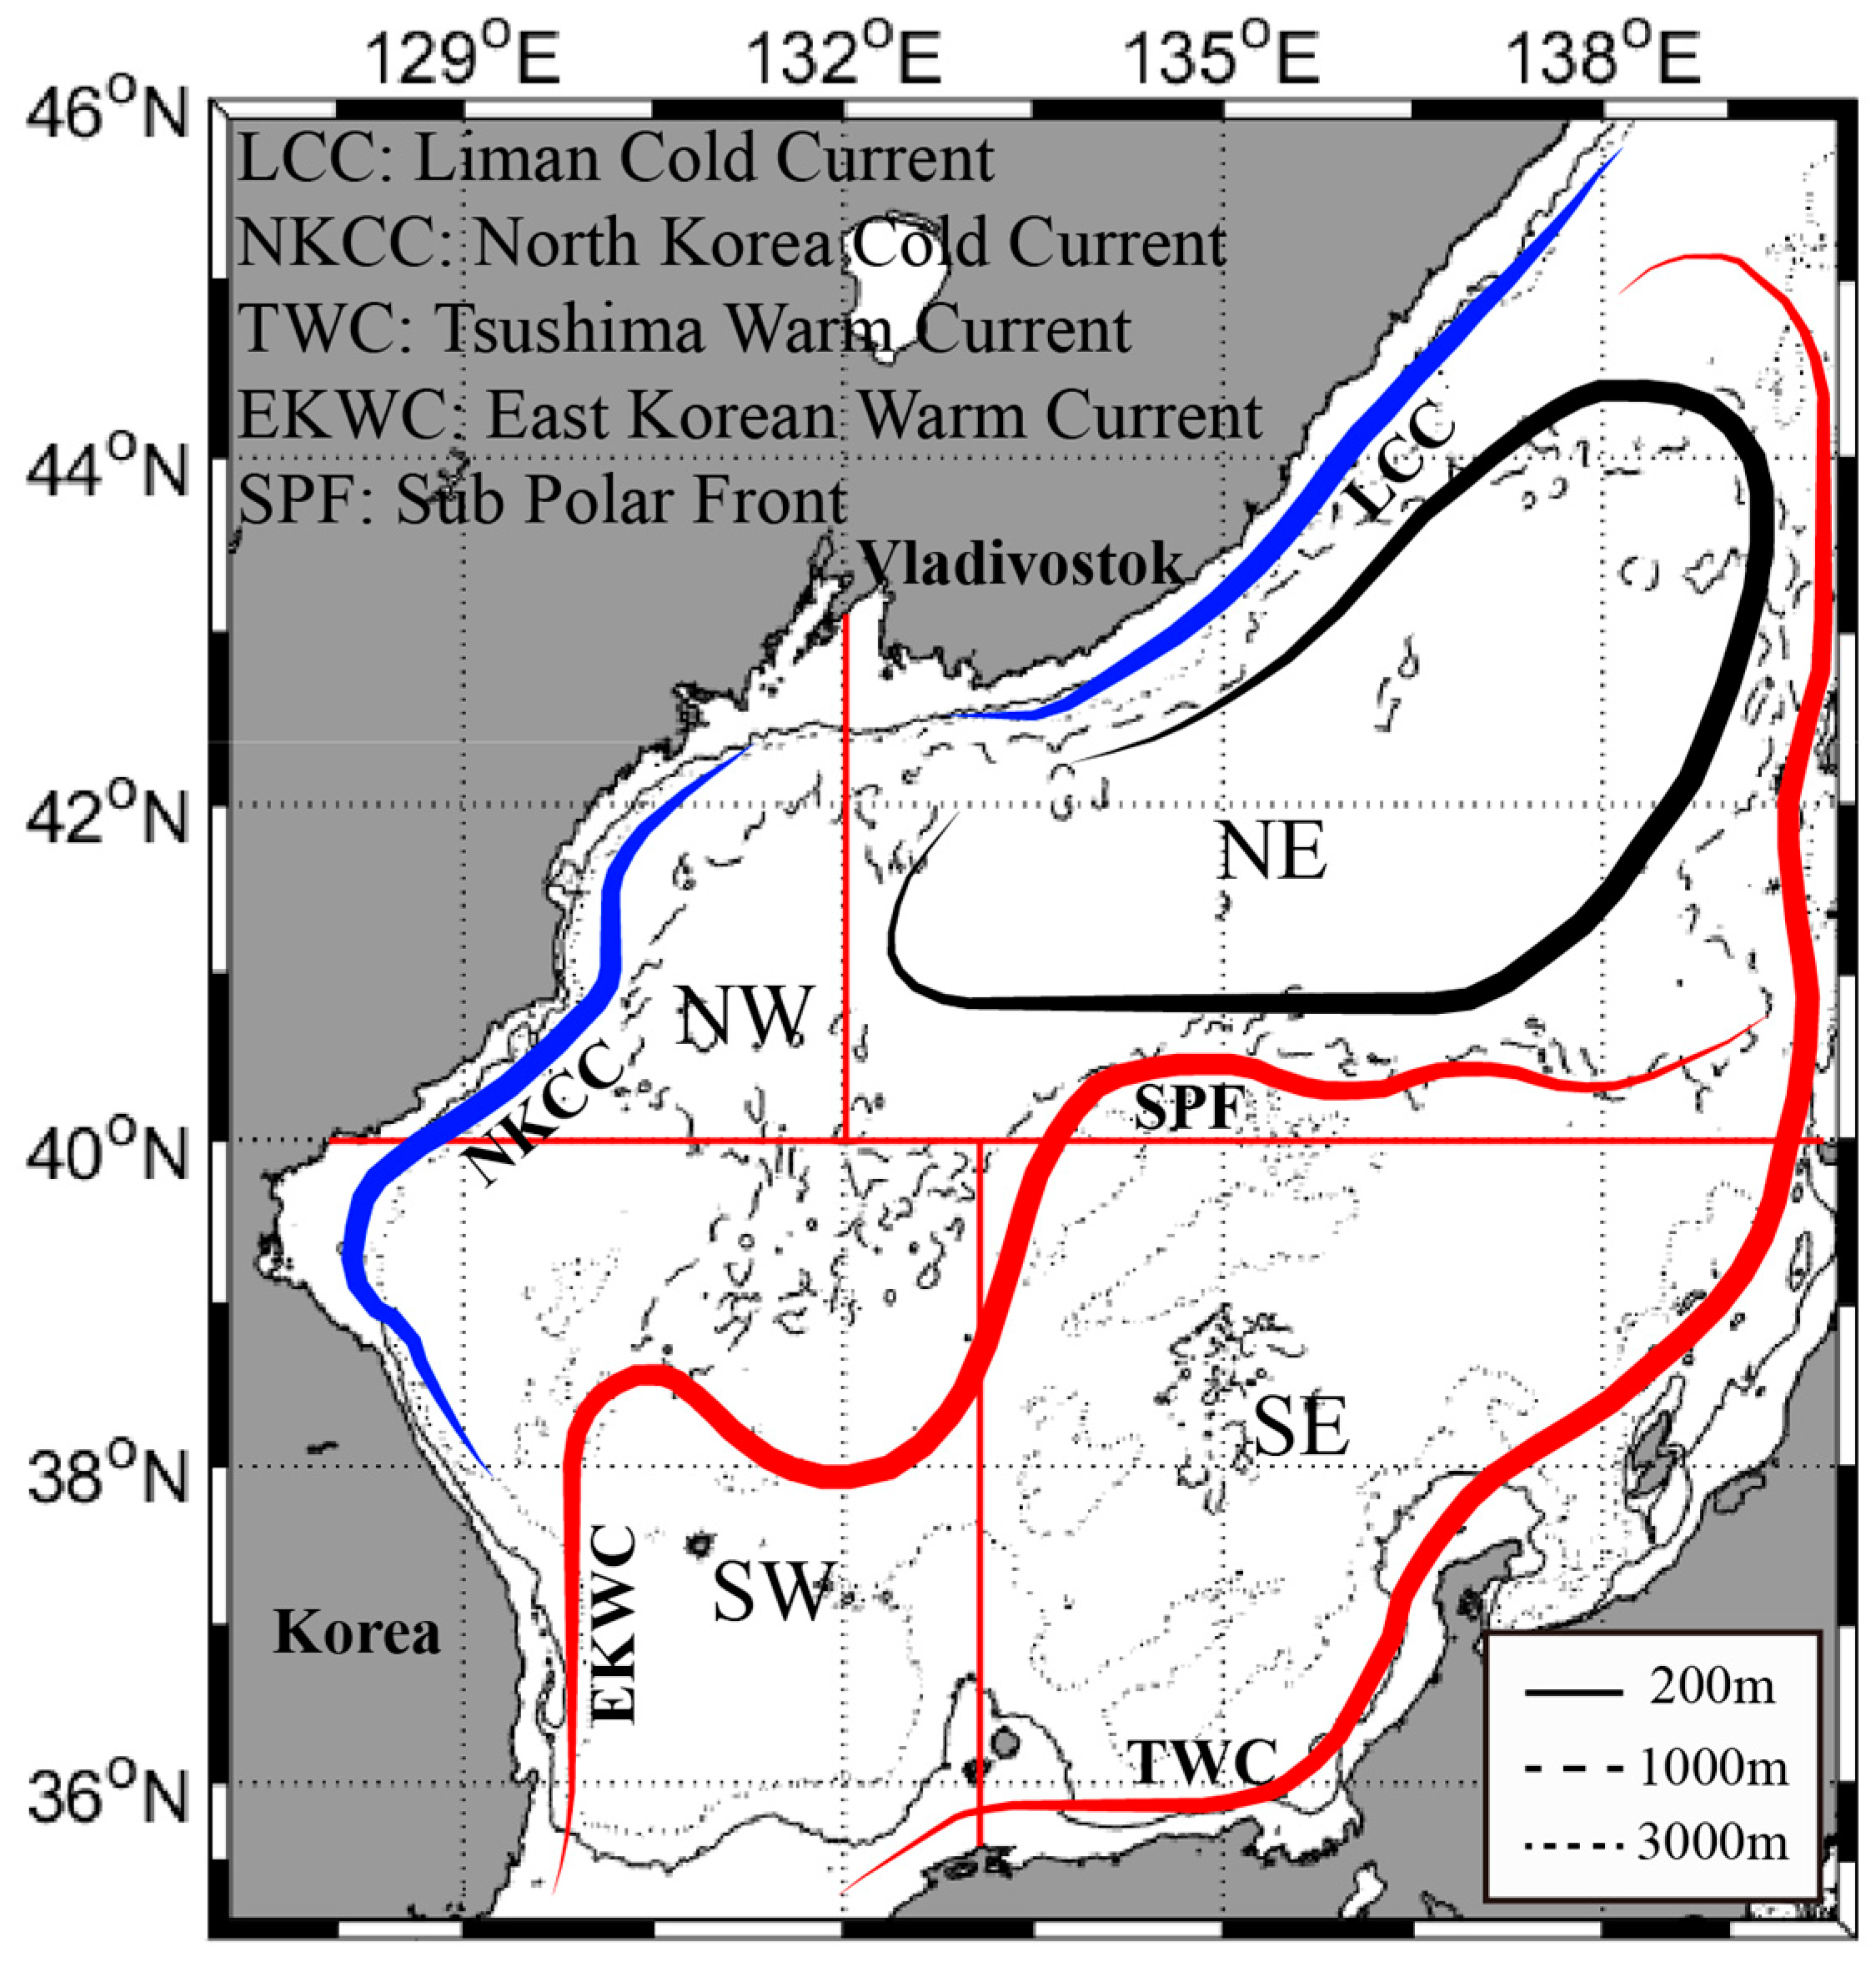
2.1. Study Area
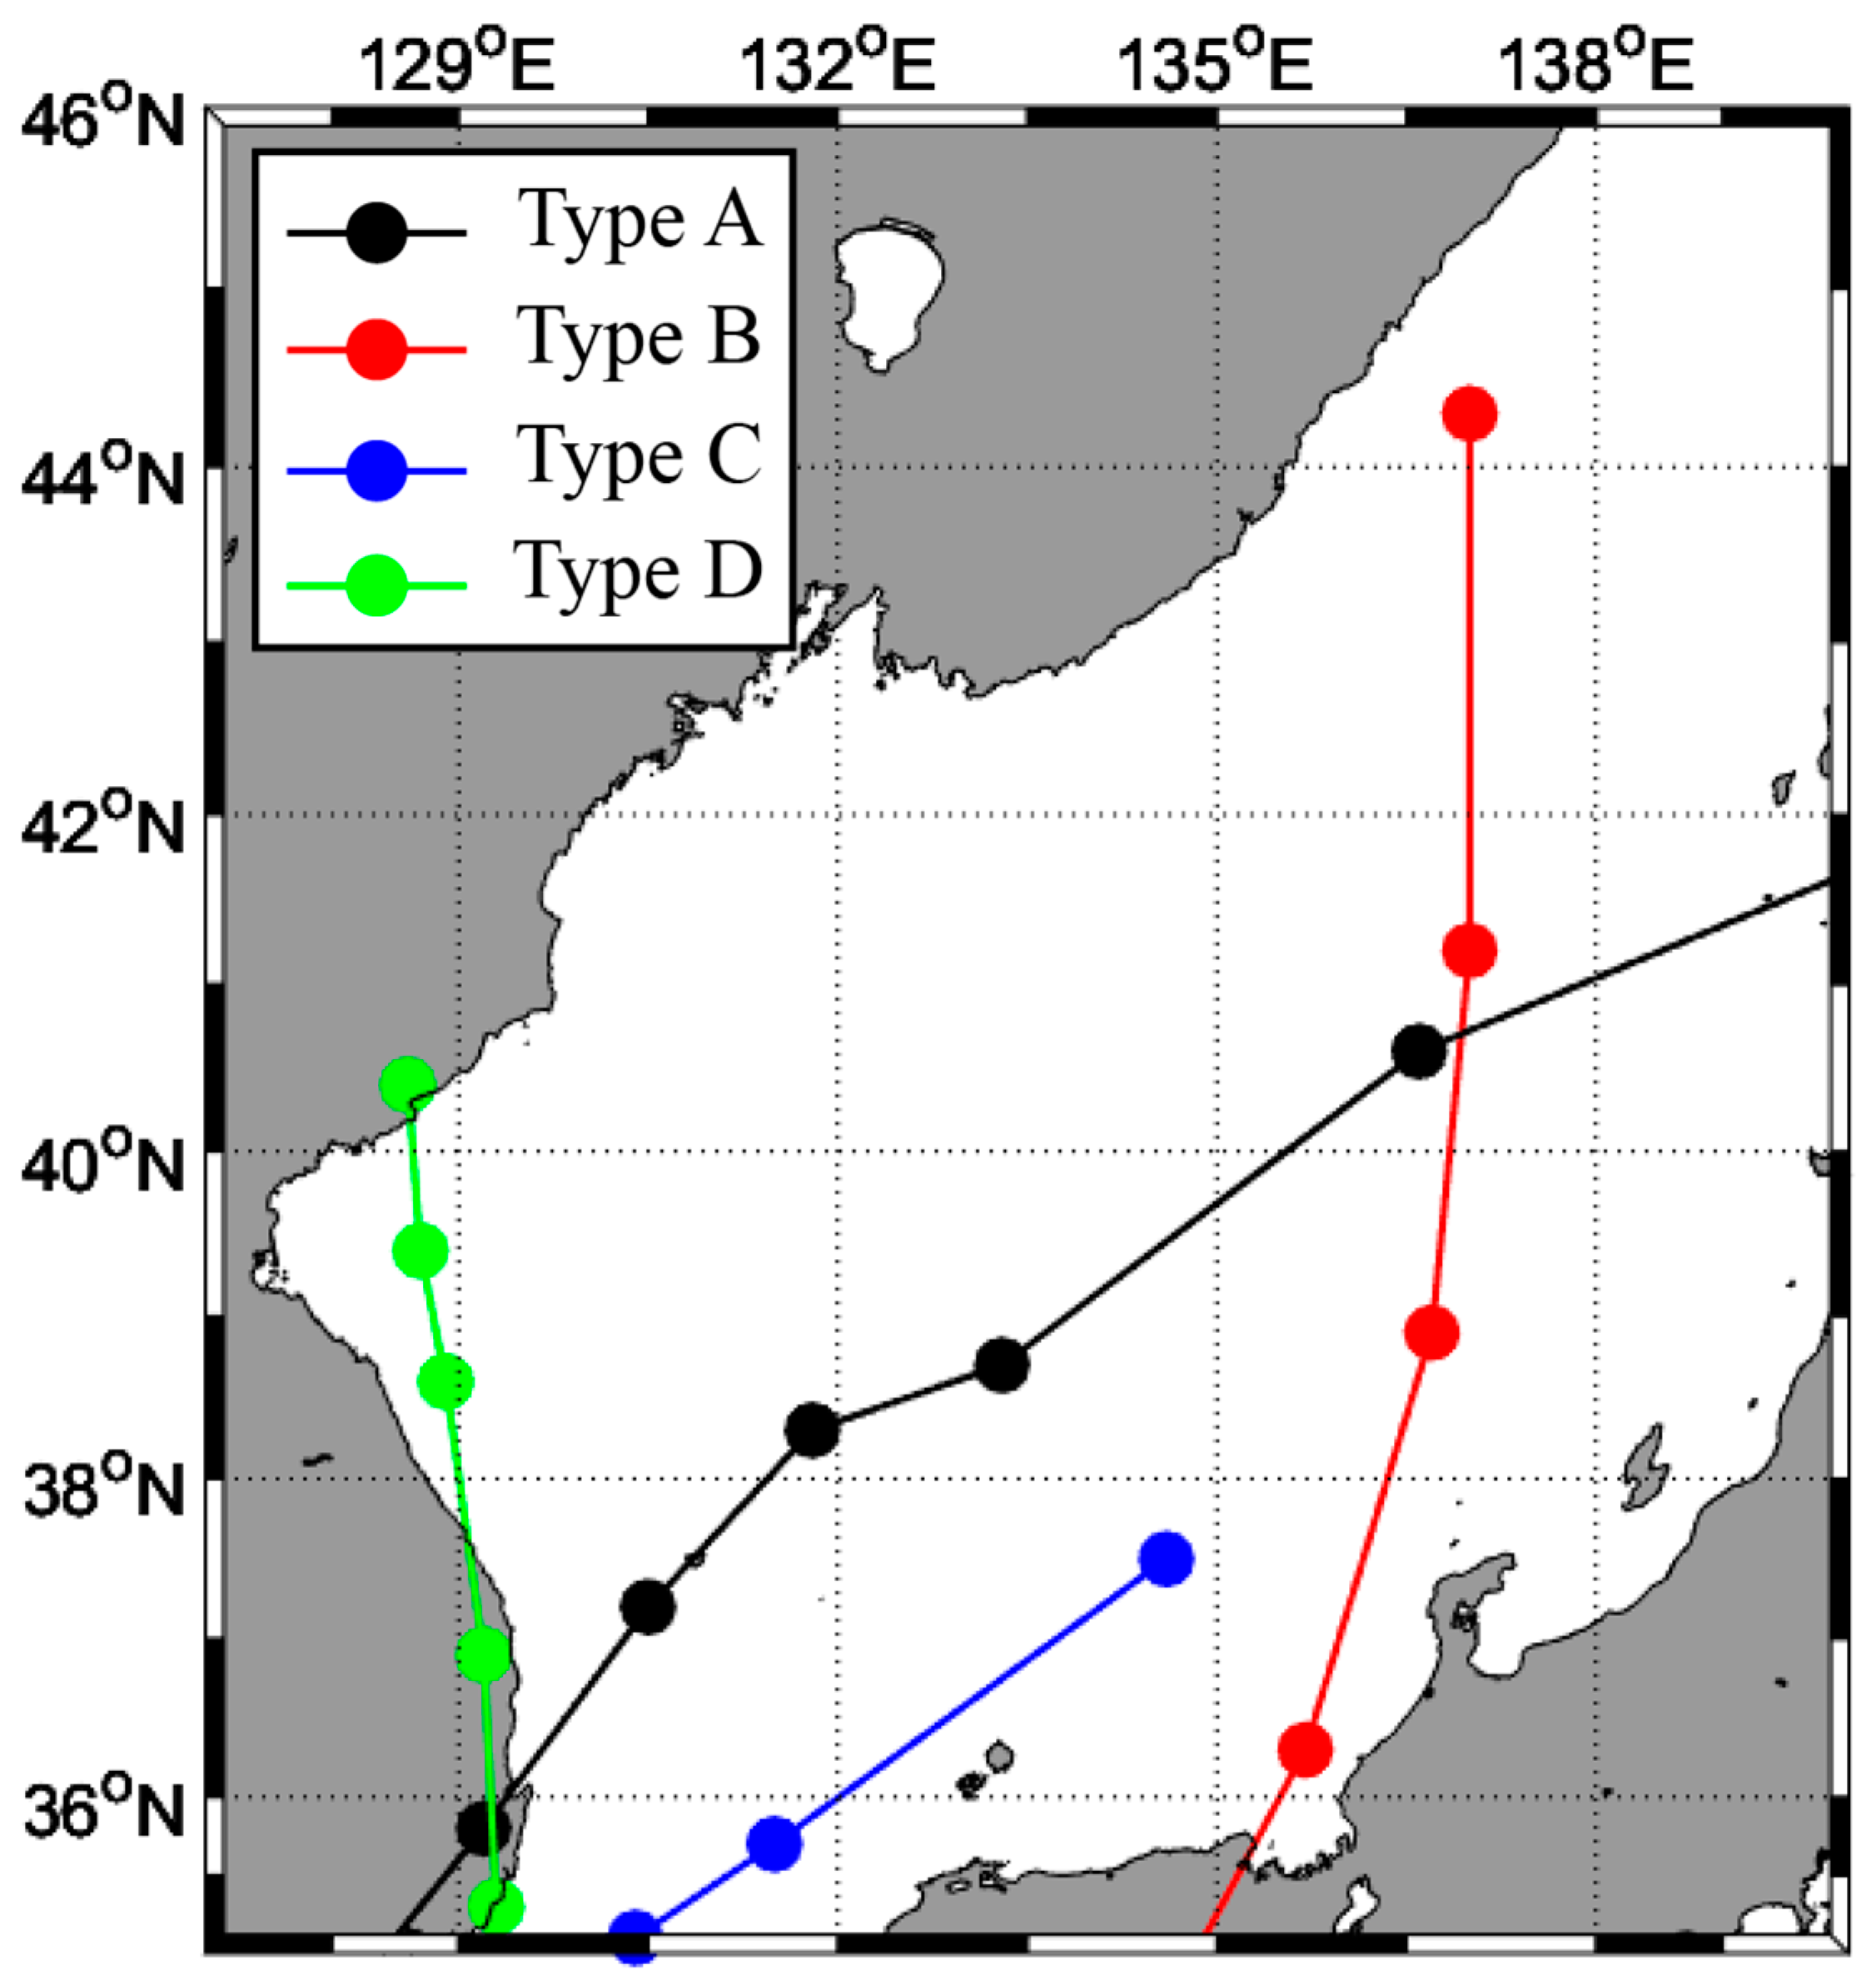
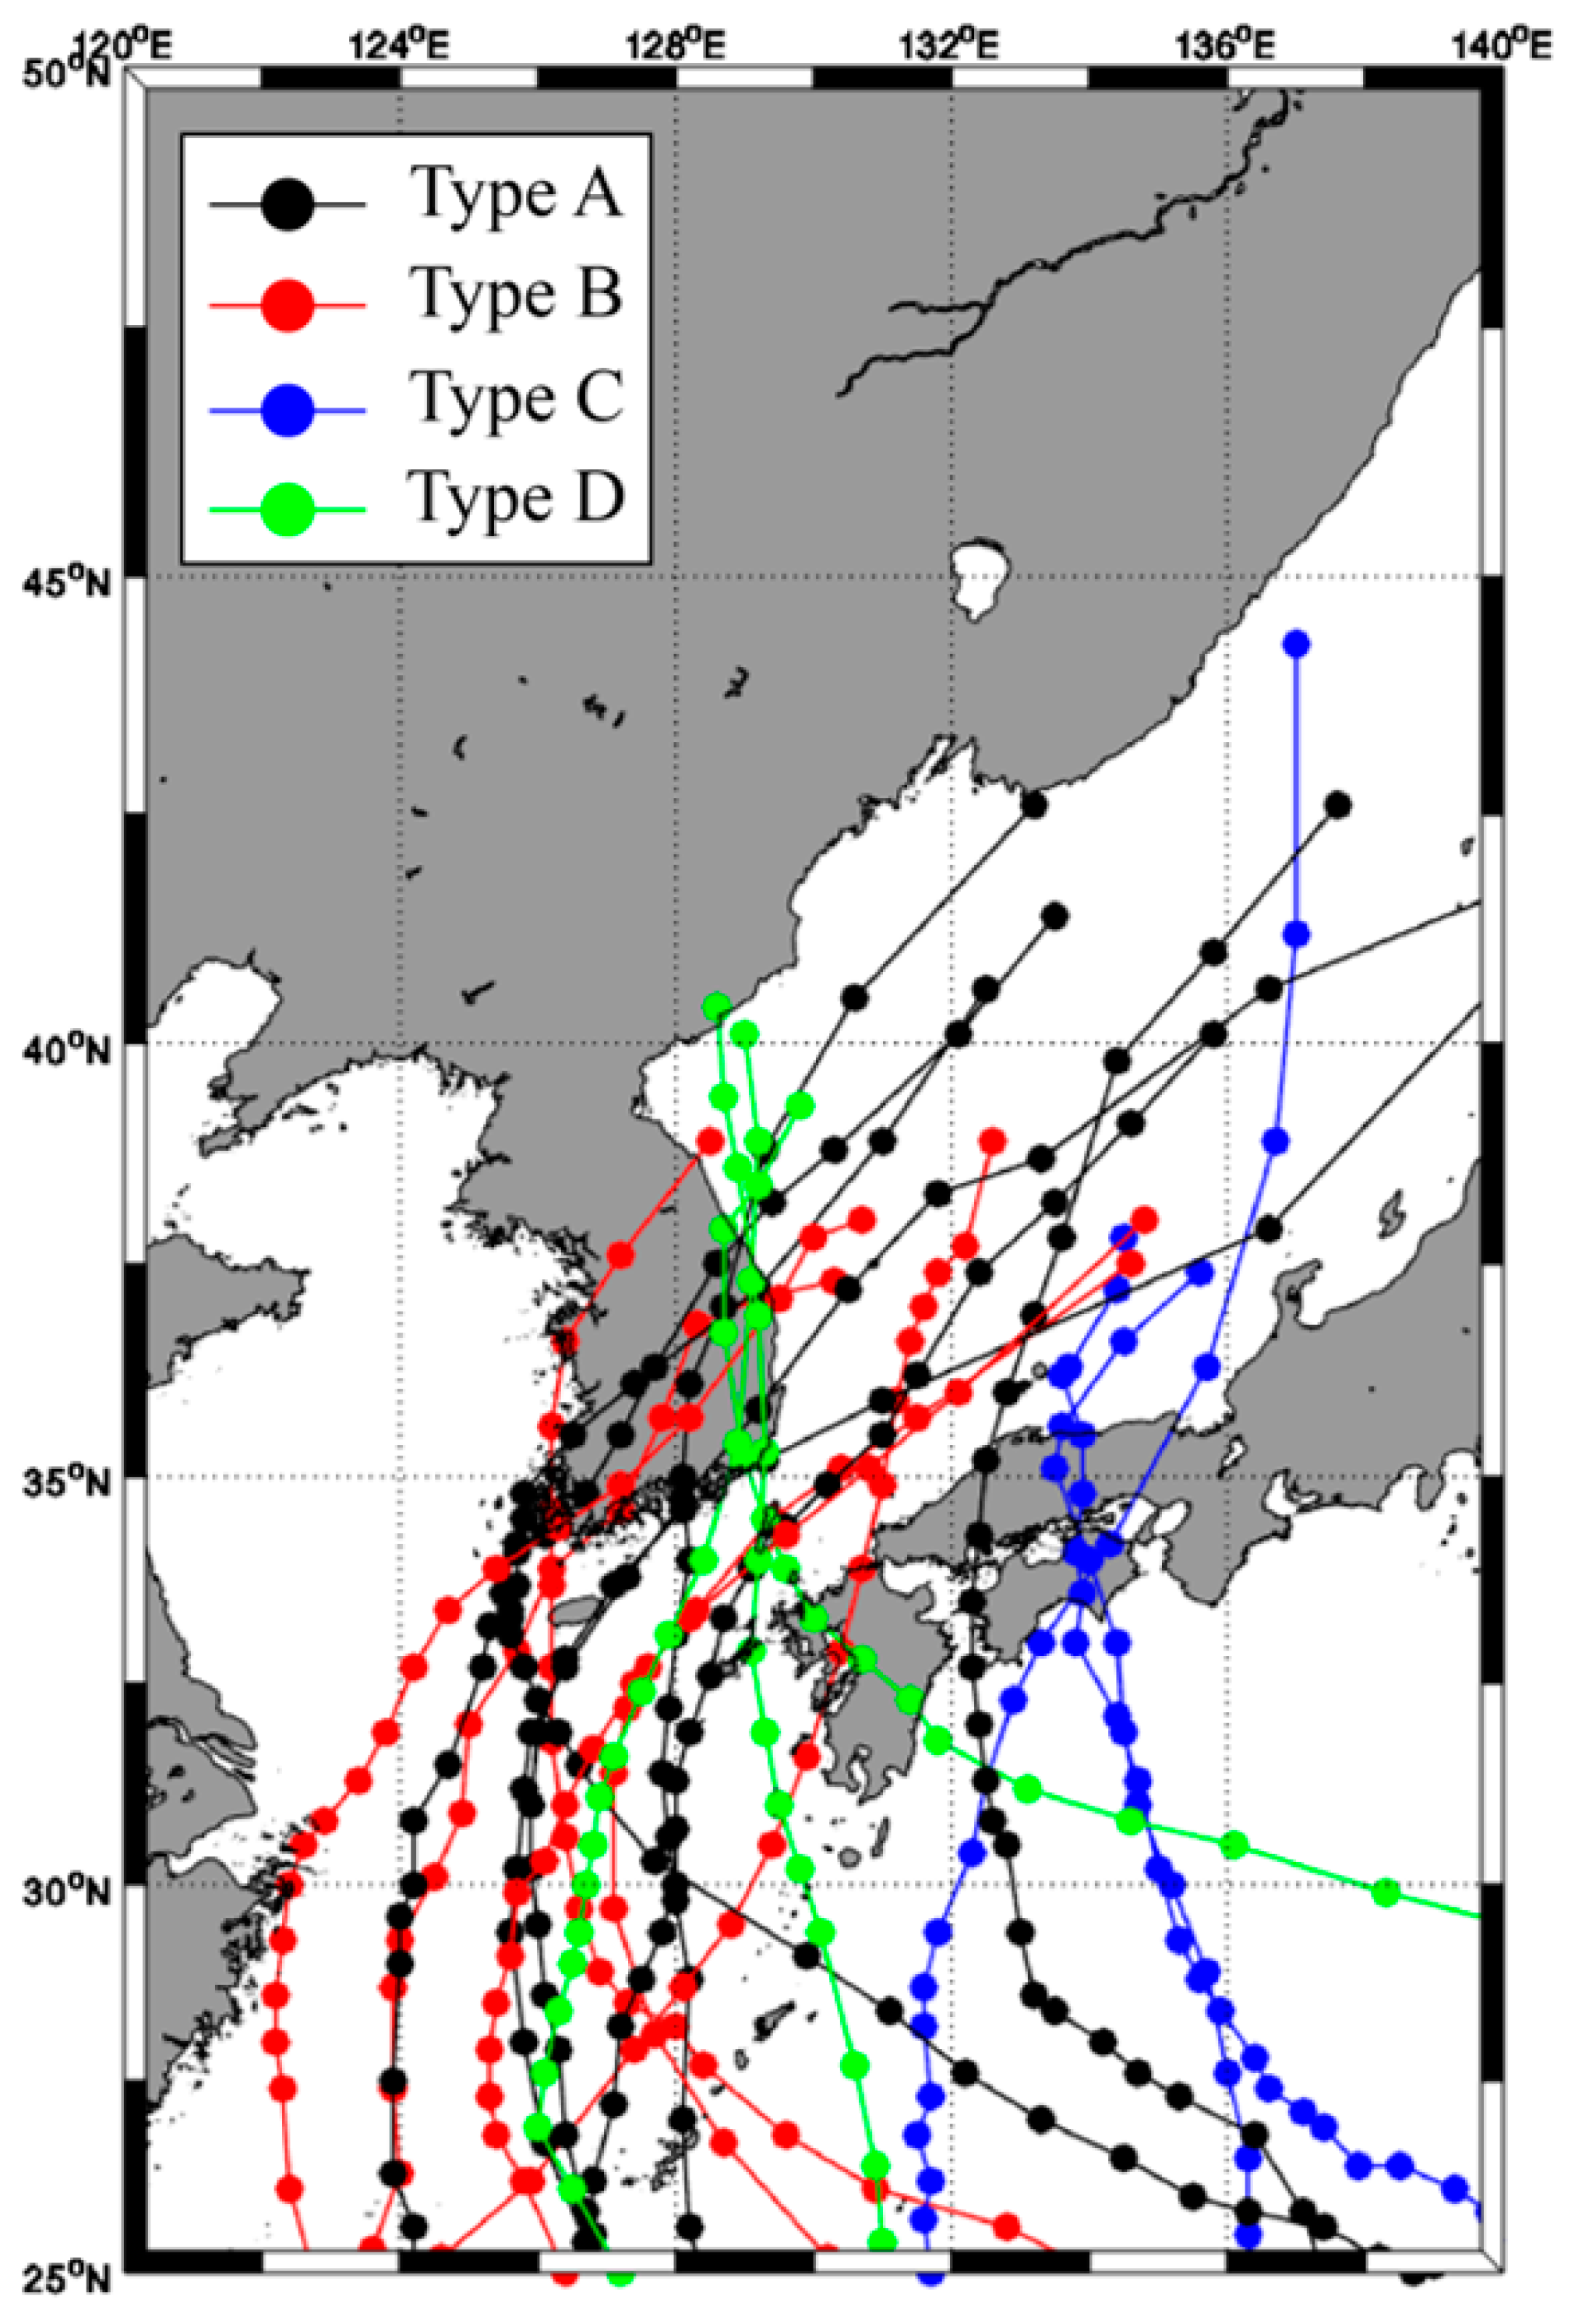
2.2. Path of the Typhoon
2.3. Marine Environments of the EJS
2.3.1. Sea Surface Temperature (SST)
2.3.2. Chlorophyll a (Chl-a)
2.3.3. Ekman Pumping Velocity (EPV)
2.3.4. Mixed Layer Depth (MLD)
2.4. Fishery Resources
3. Results
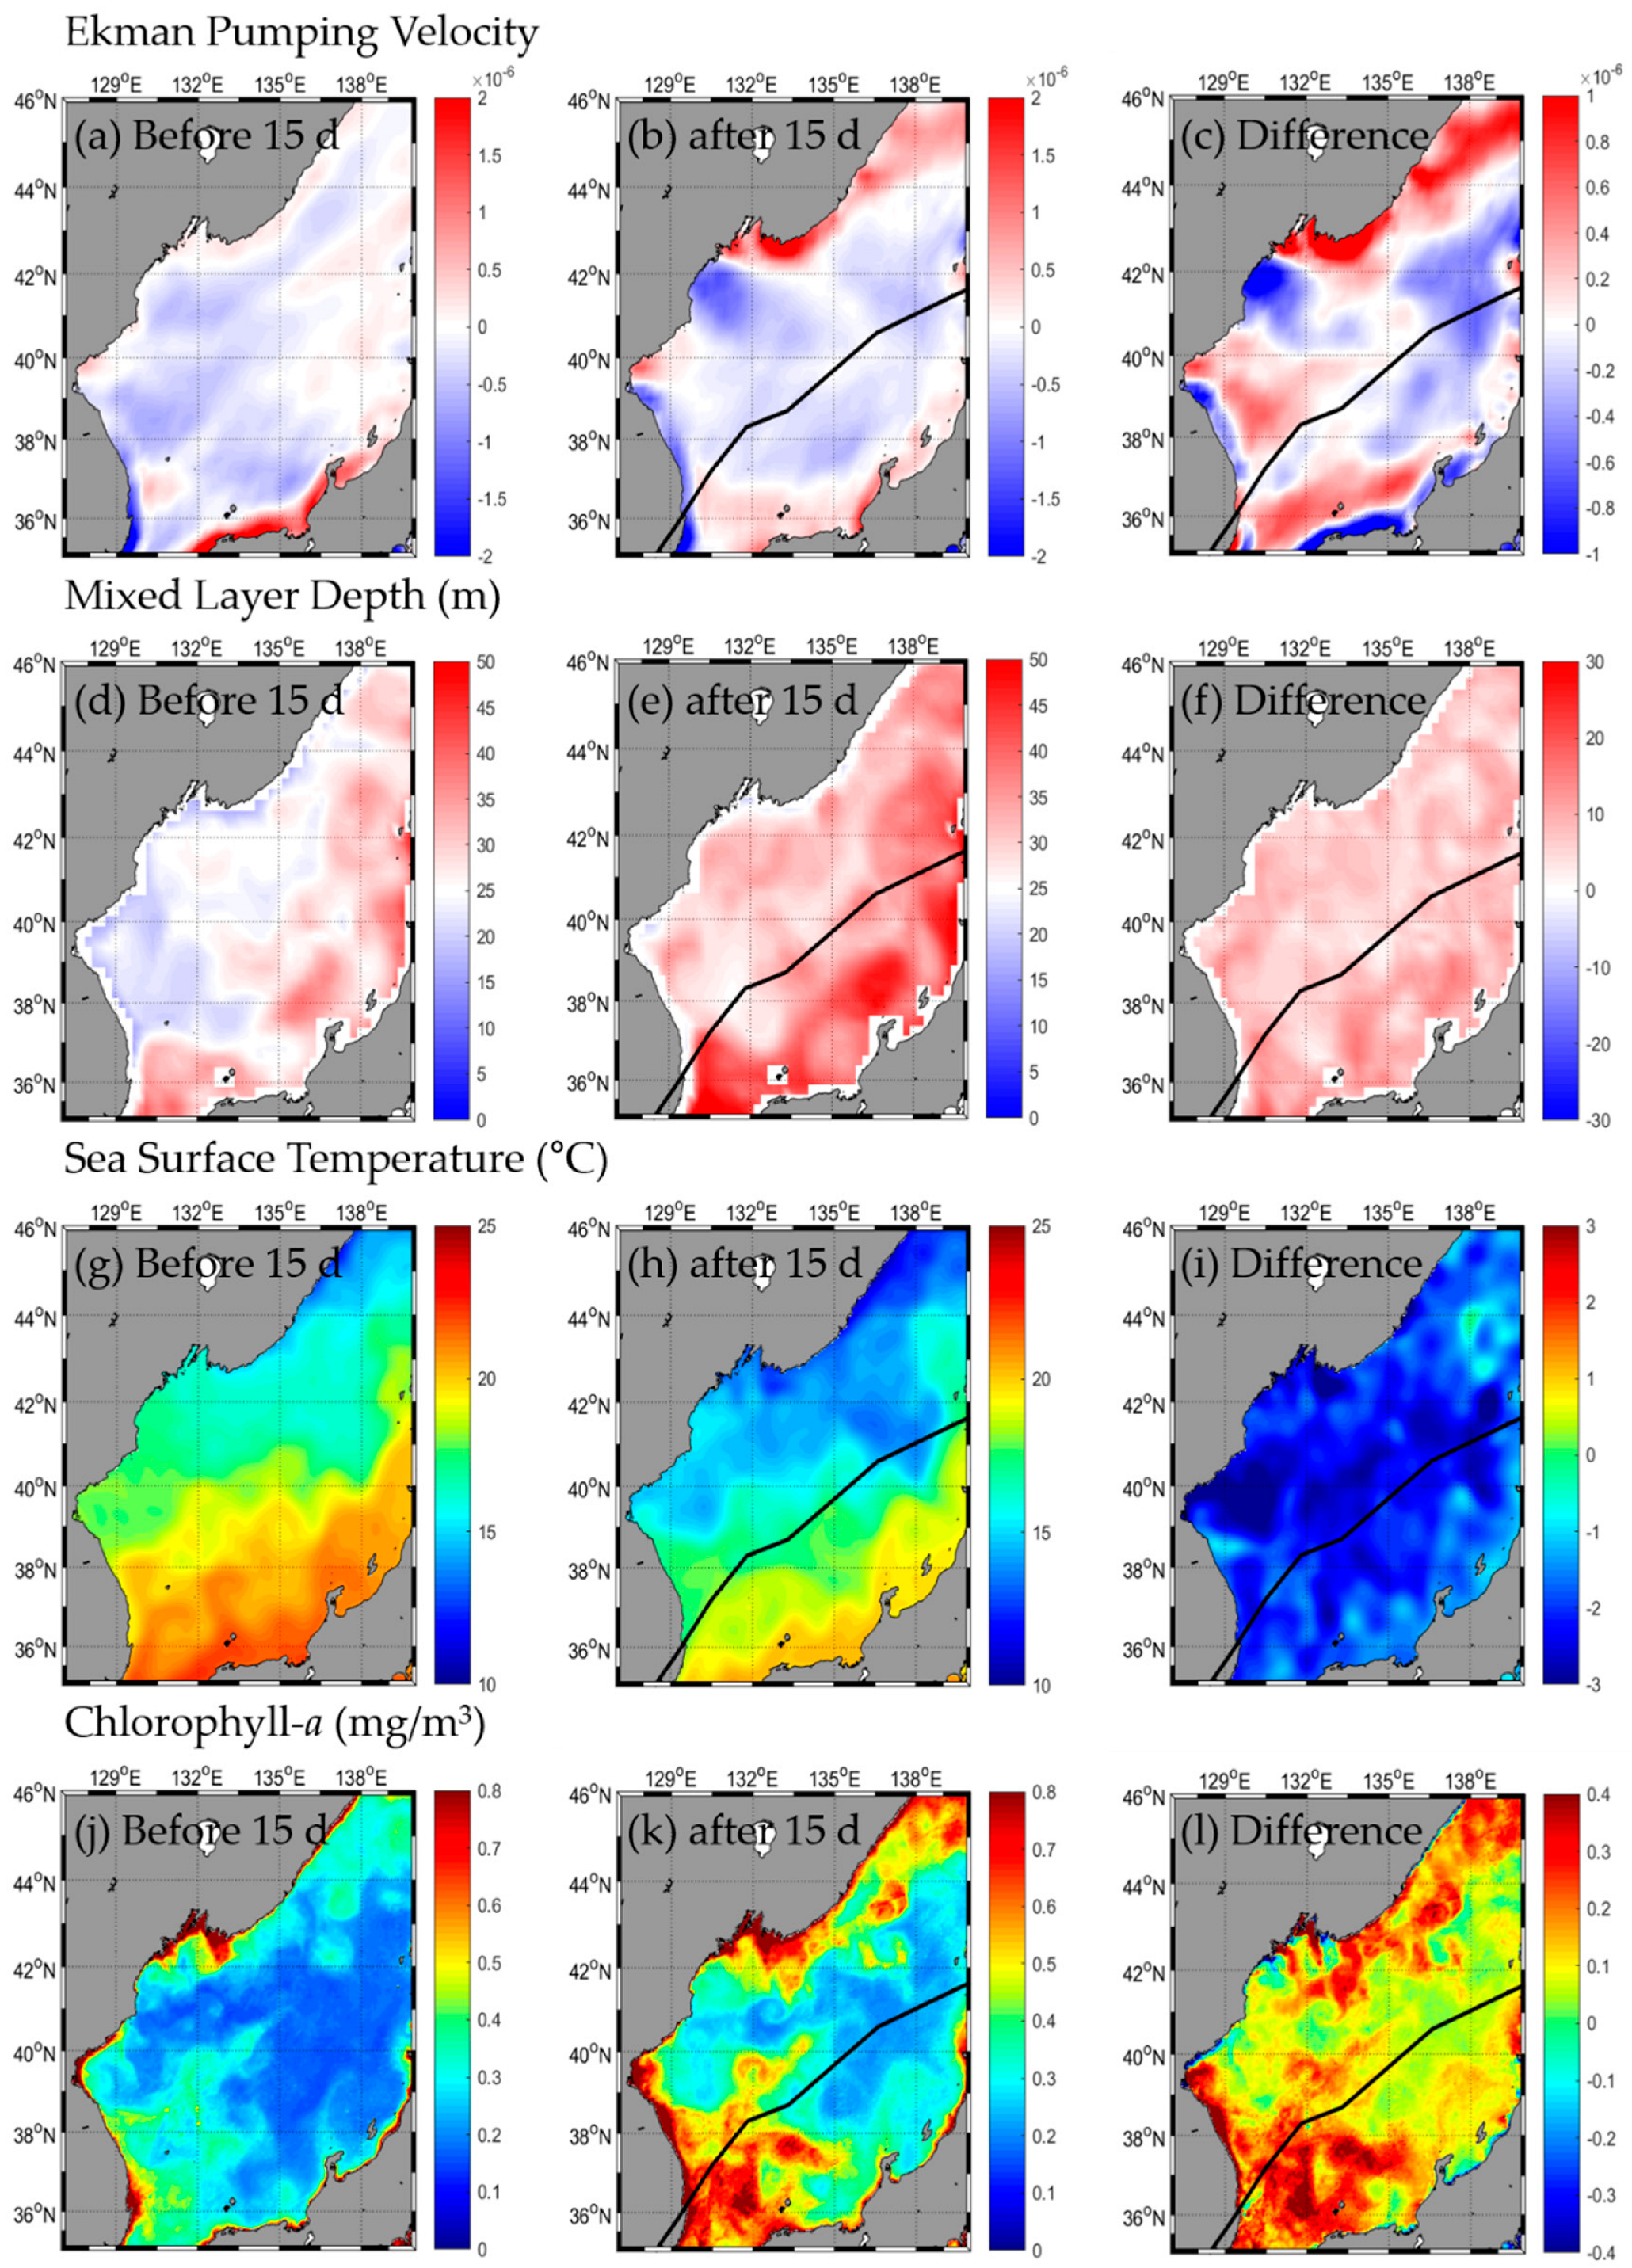
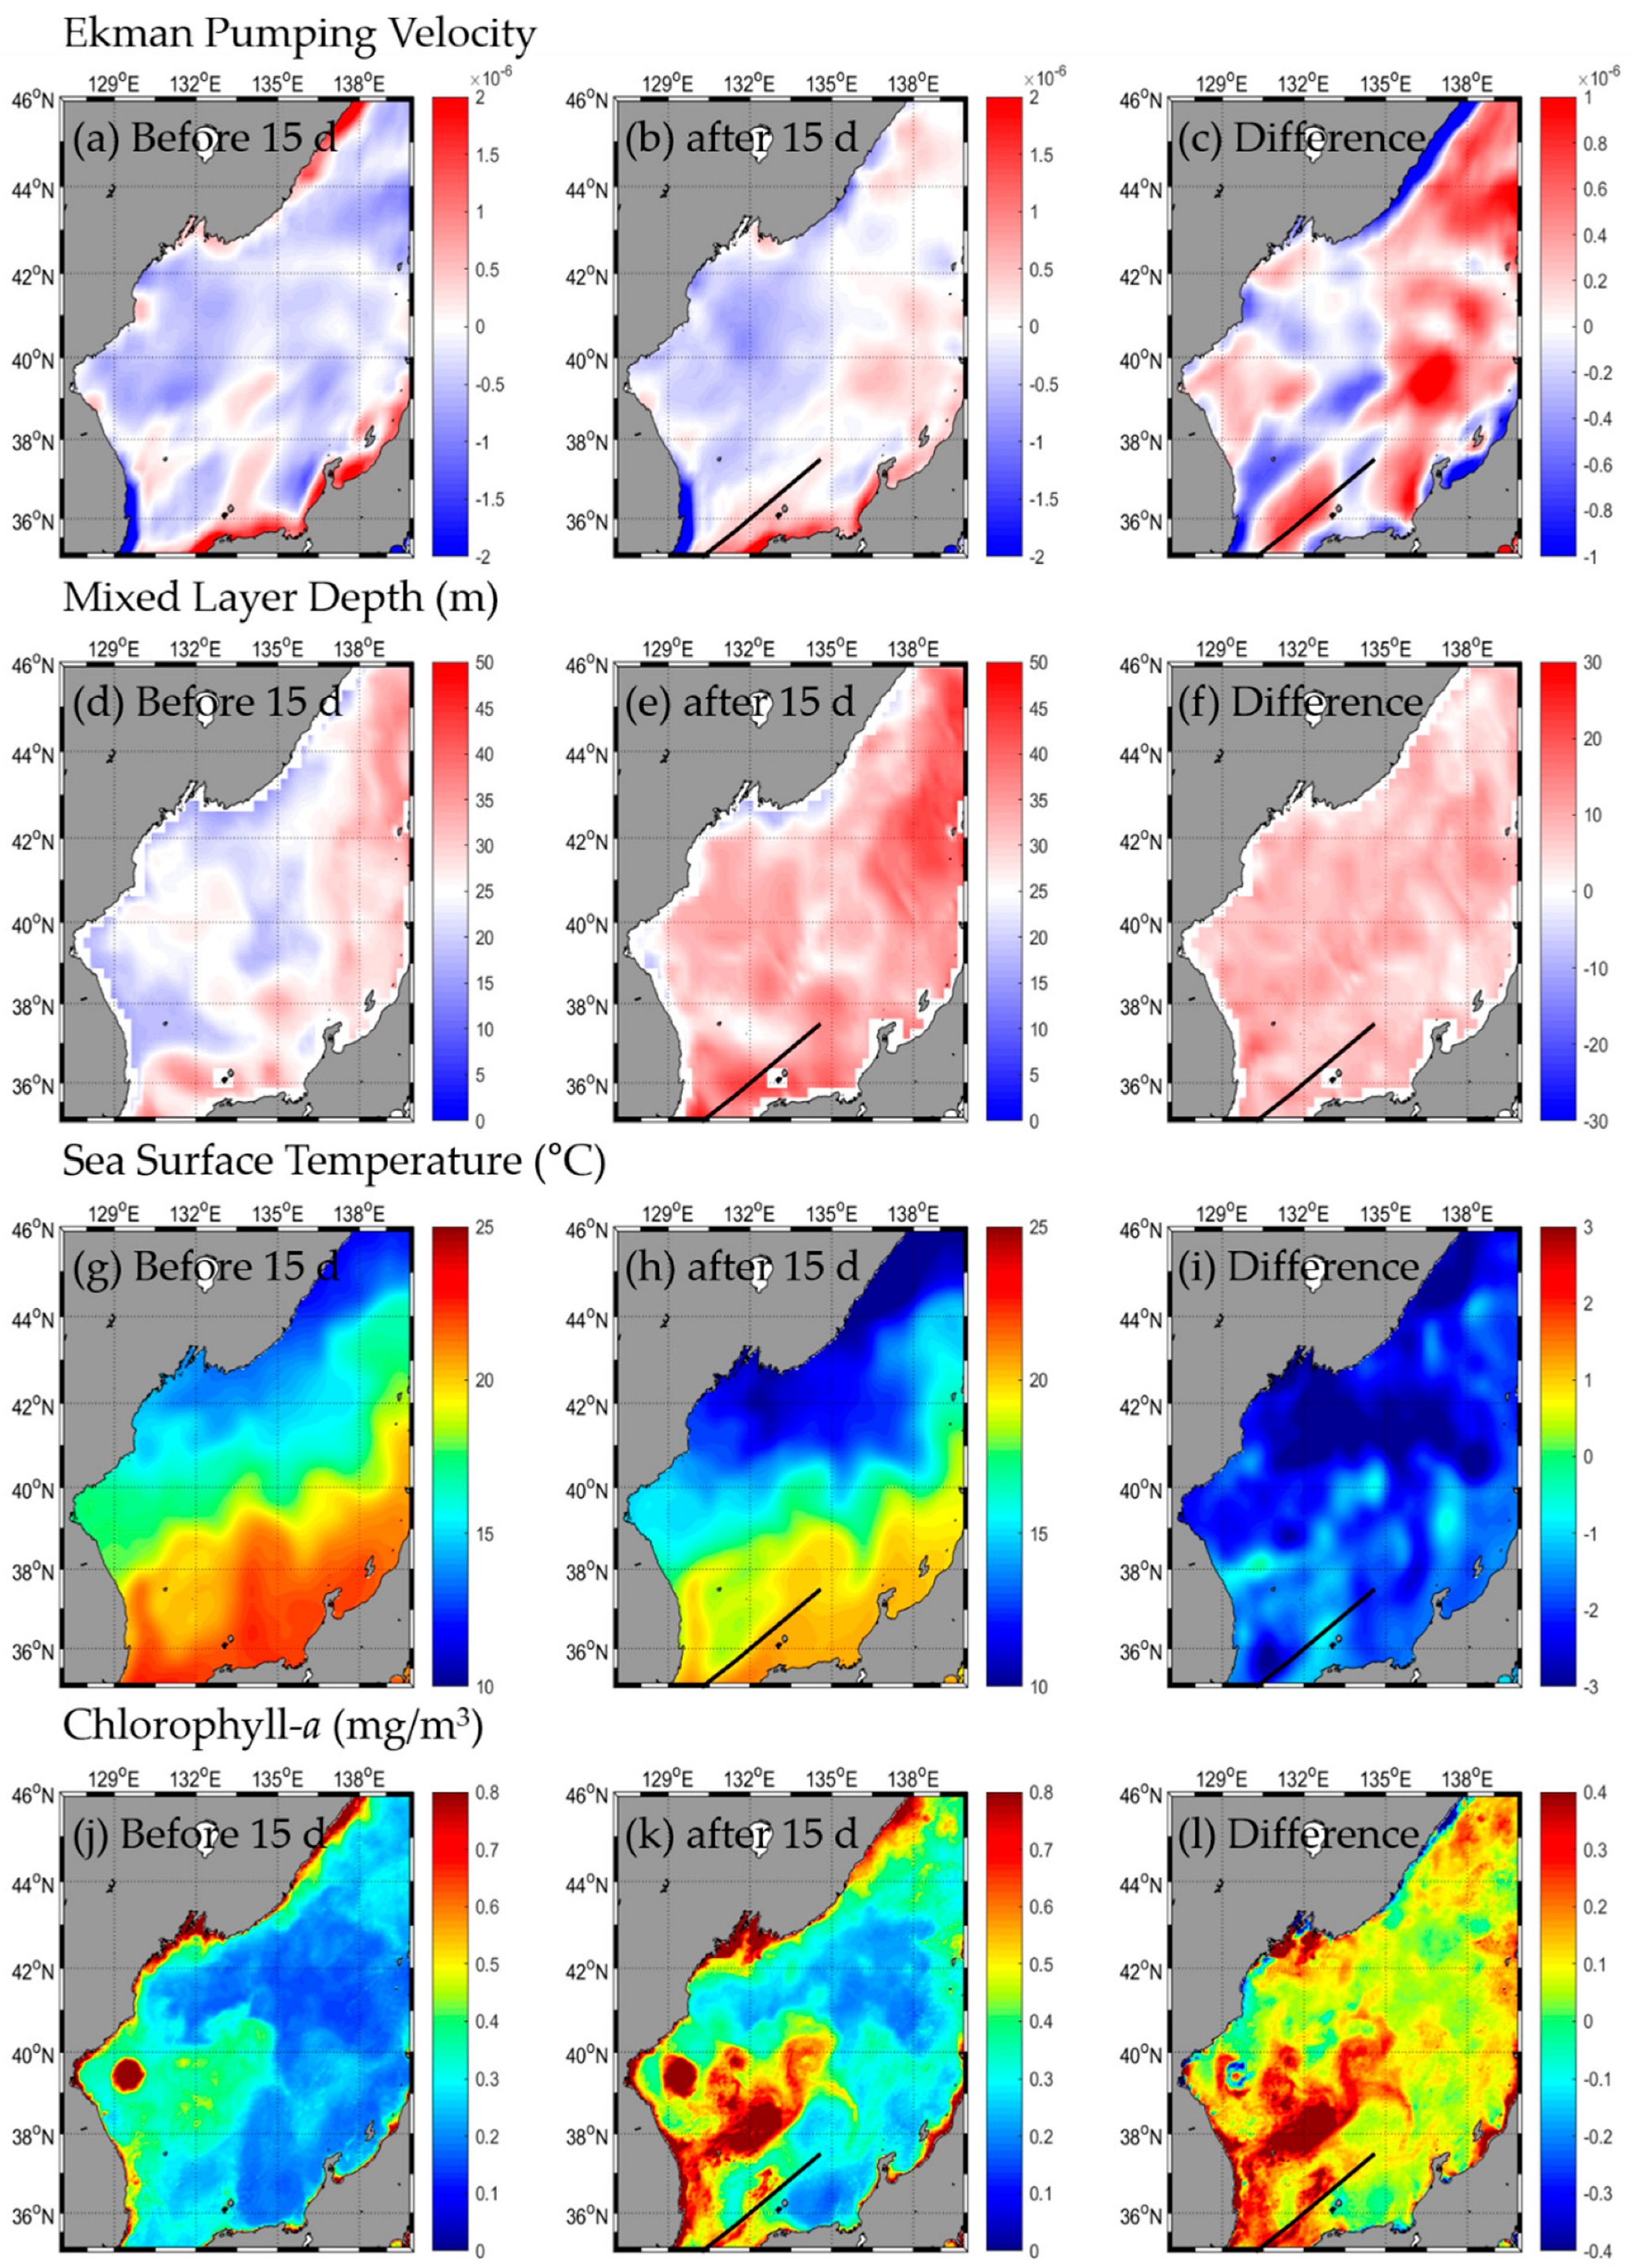
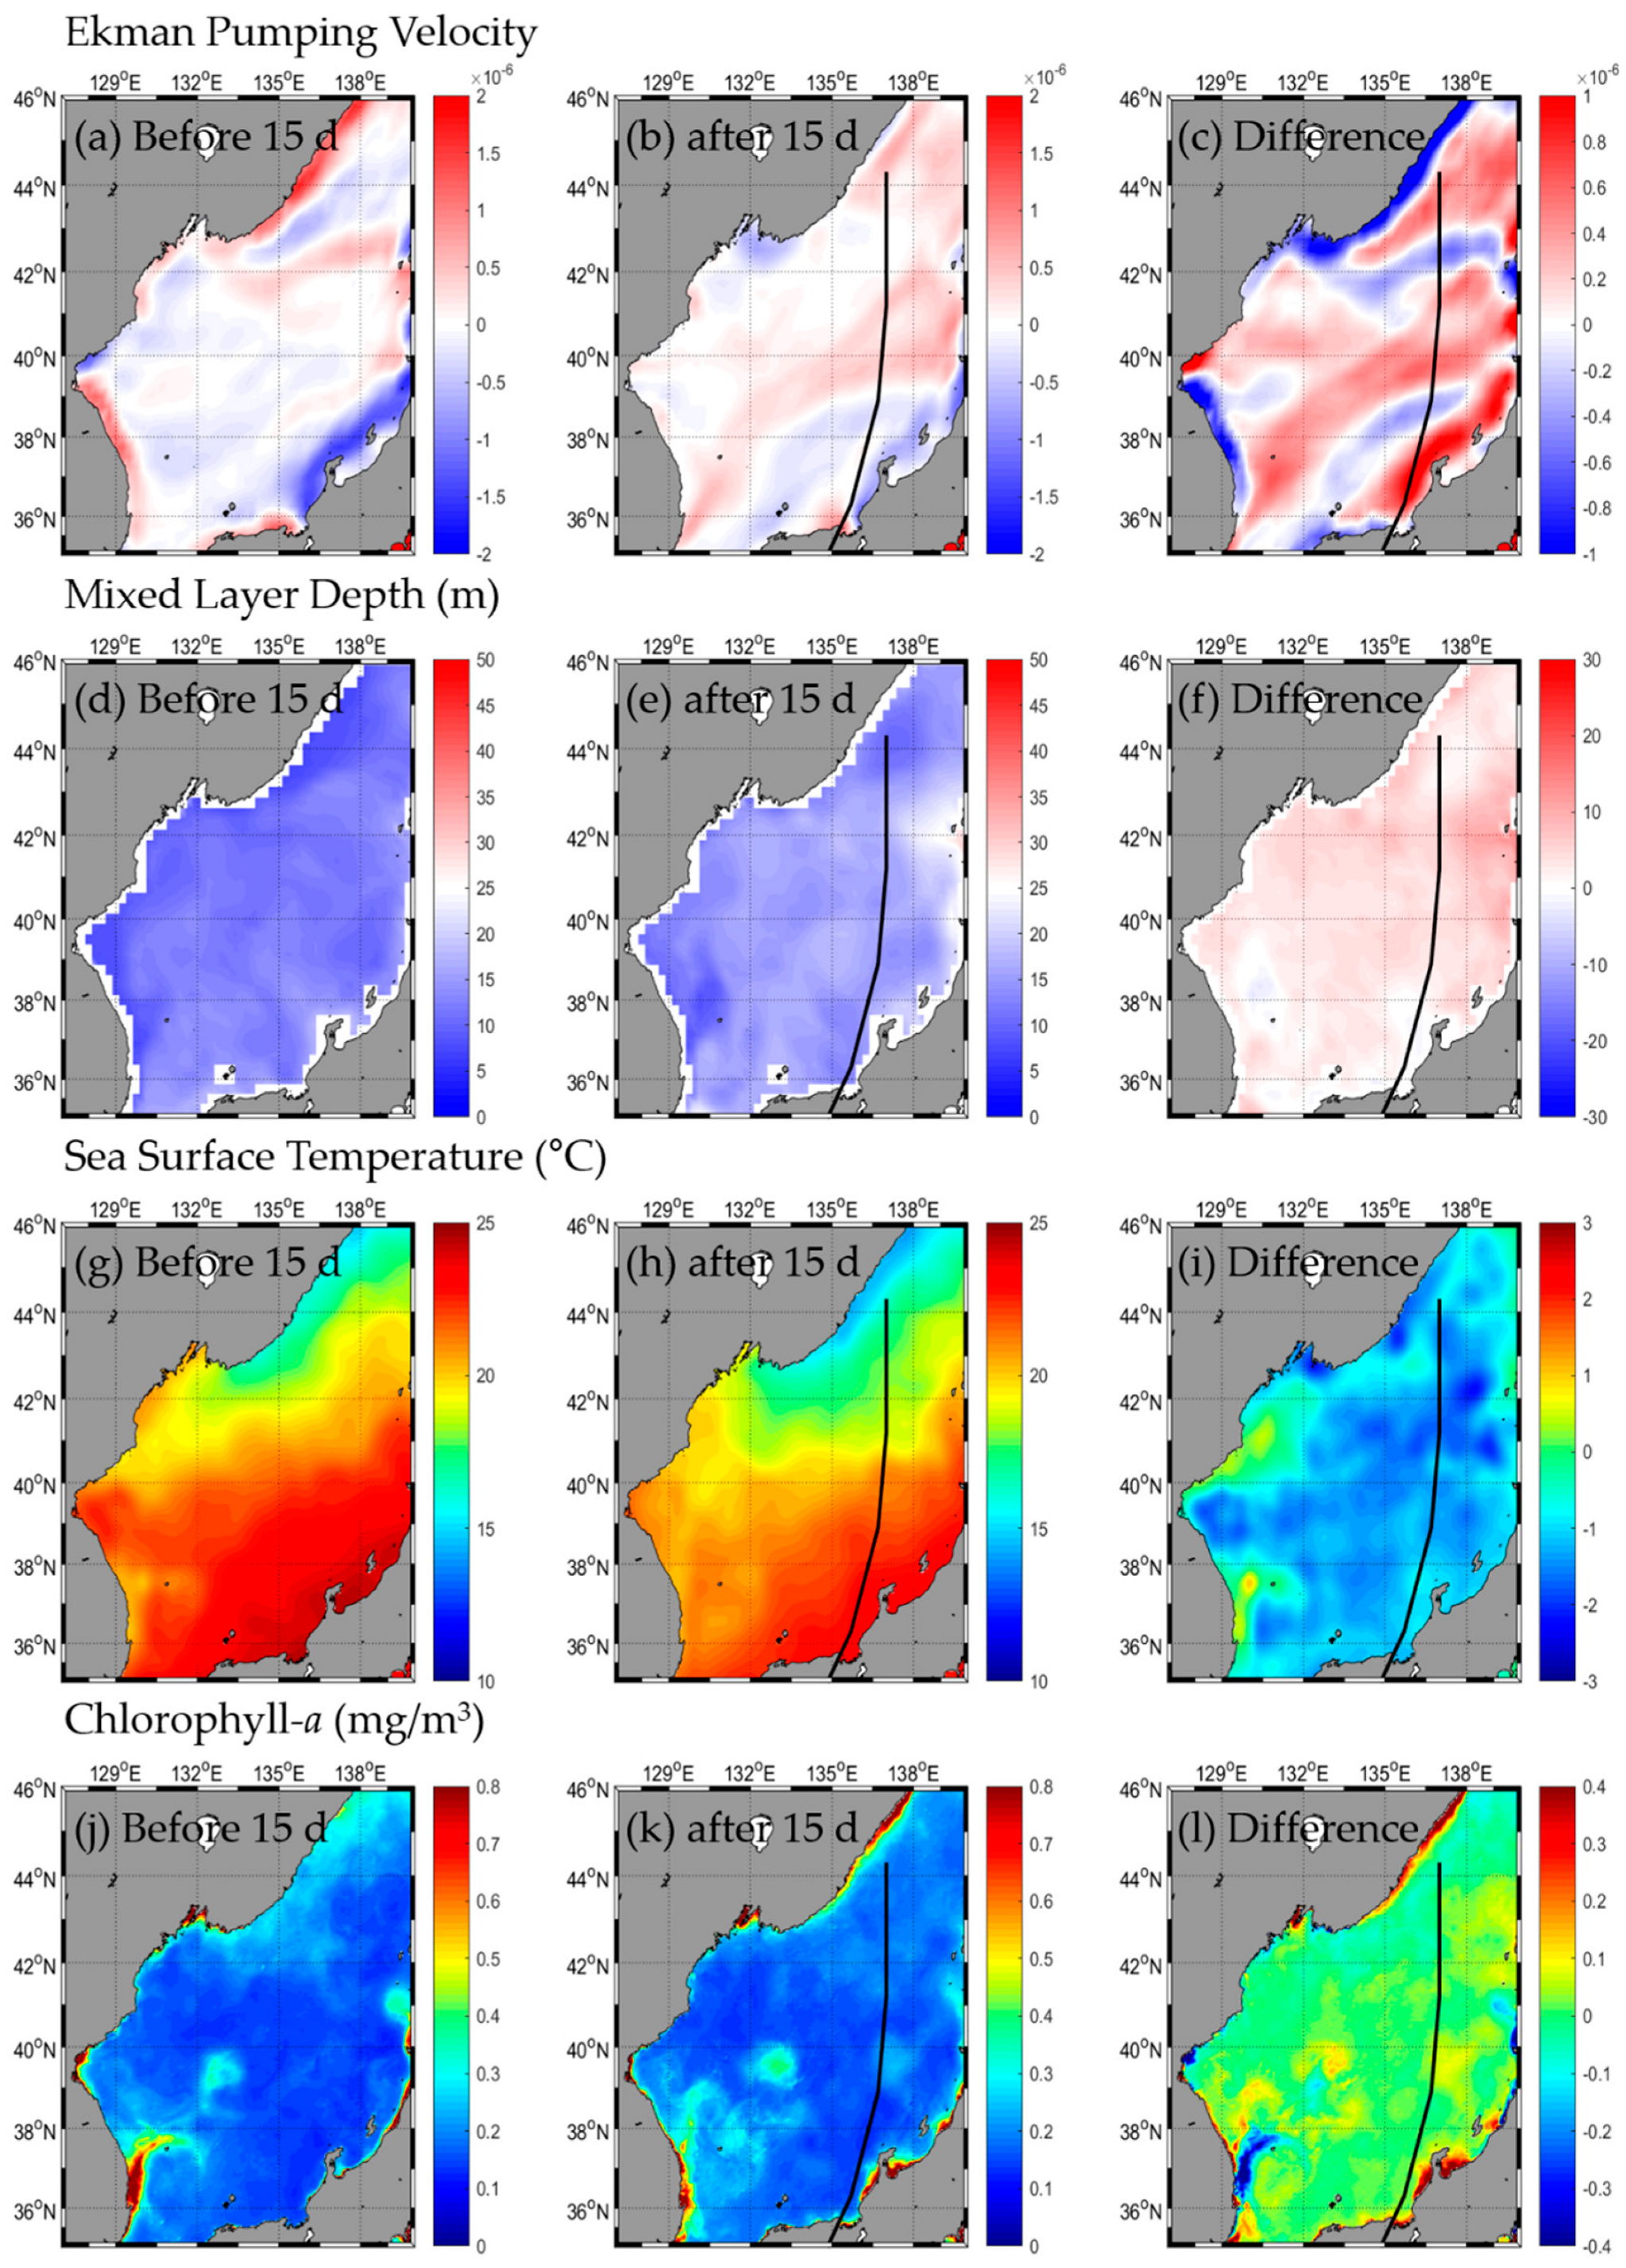
3.1. Change in Oceanic Condition: SST, Chl-a, EPV, MLD
3.1.1. Type A
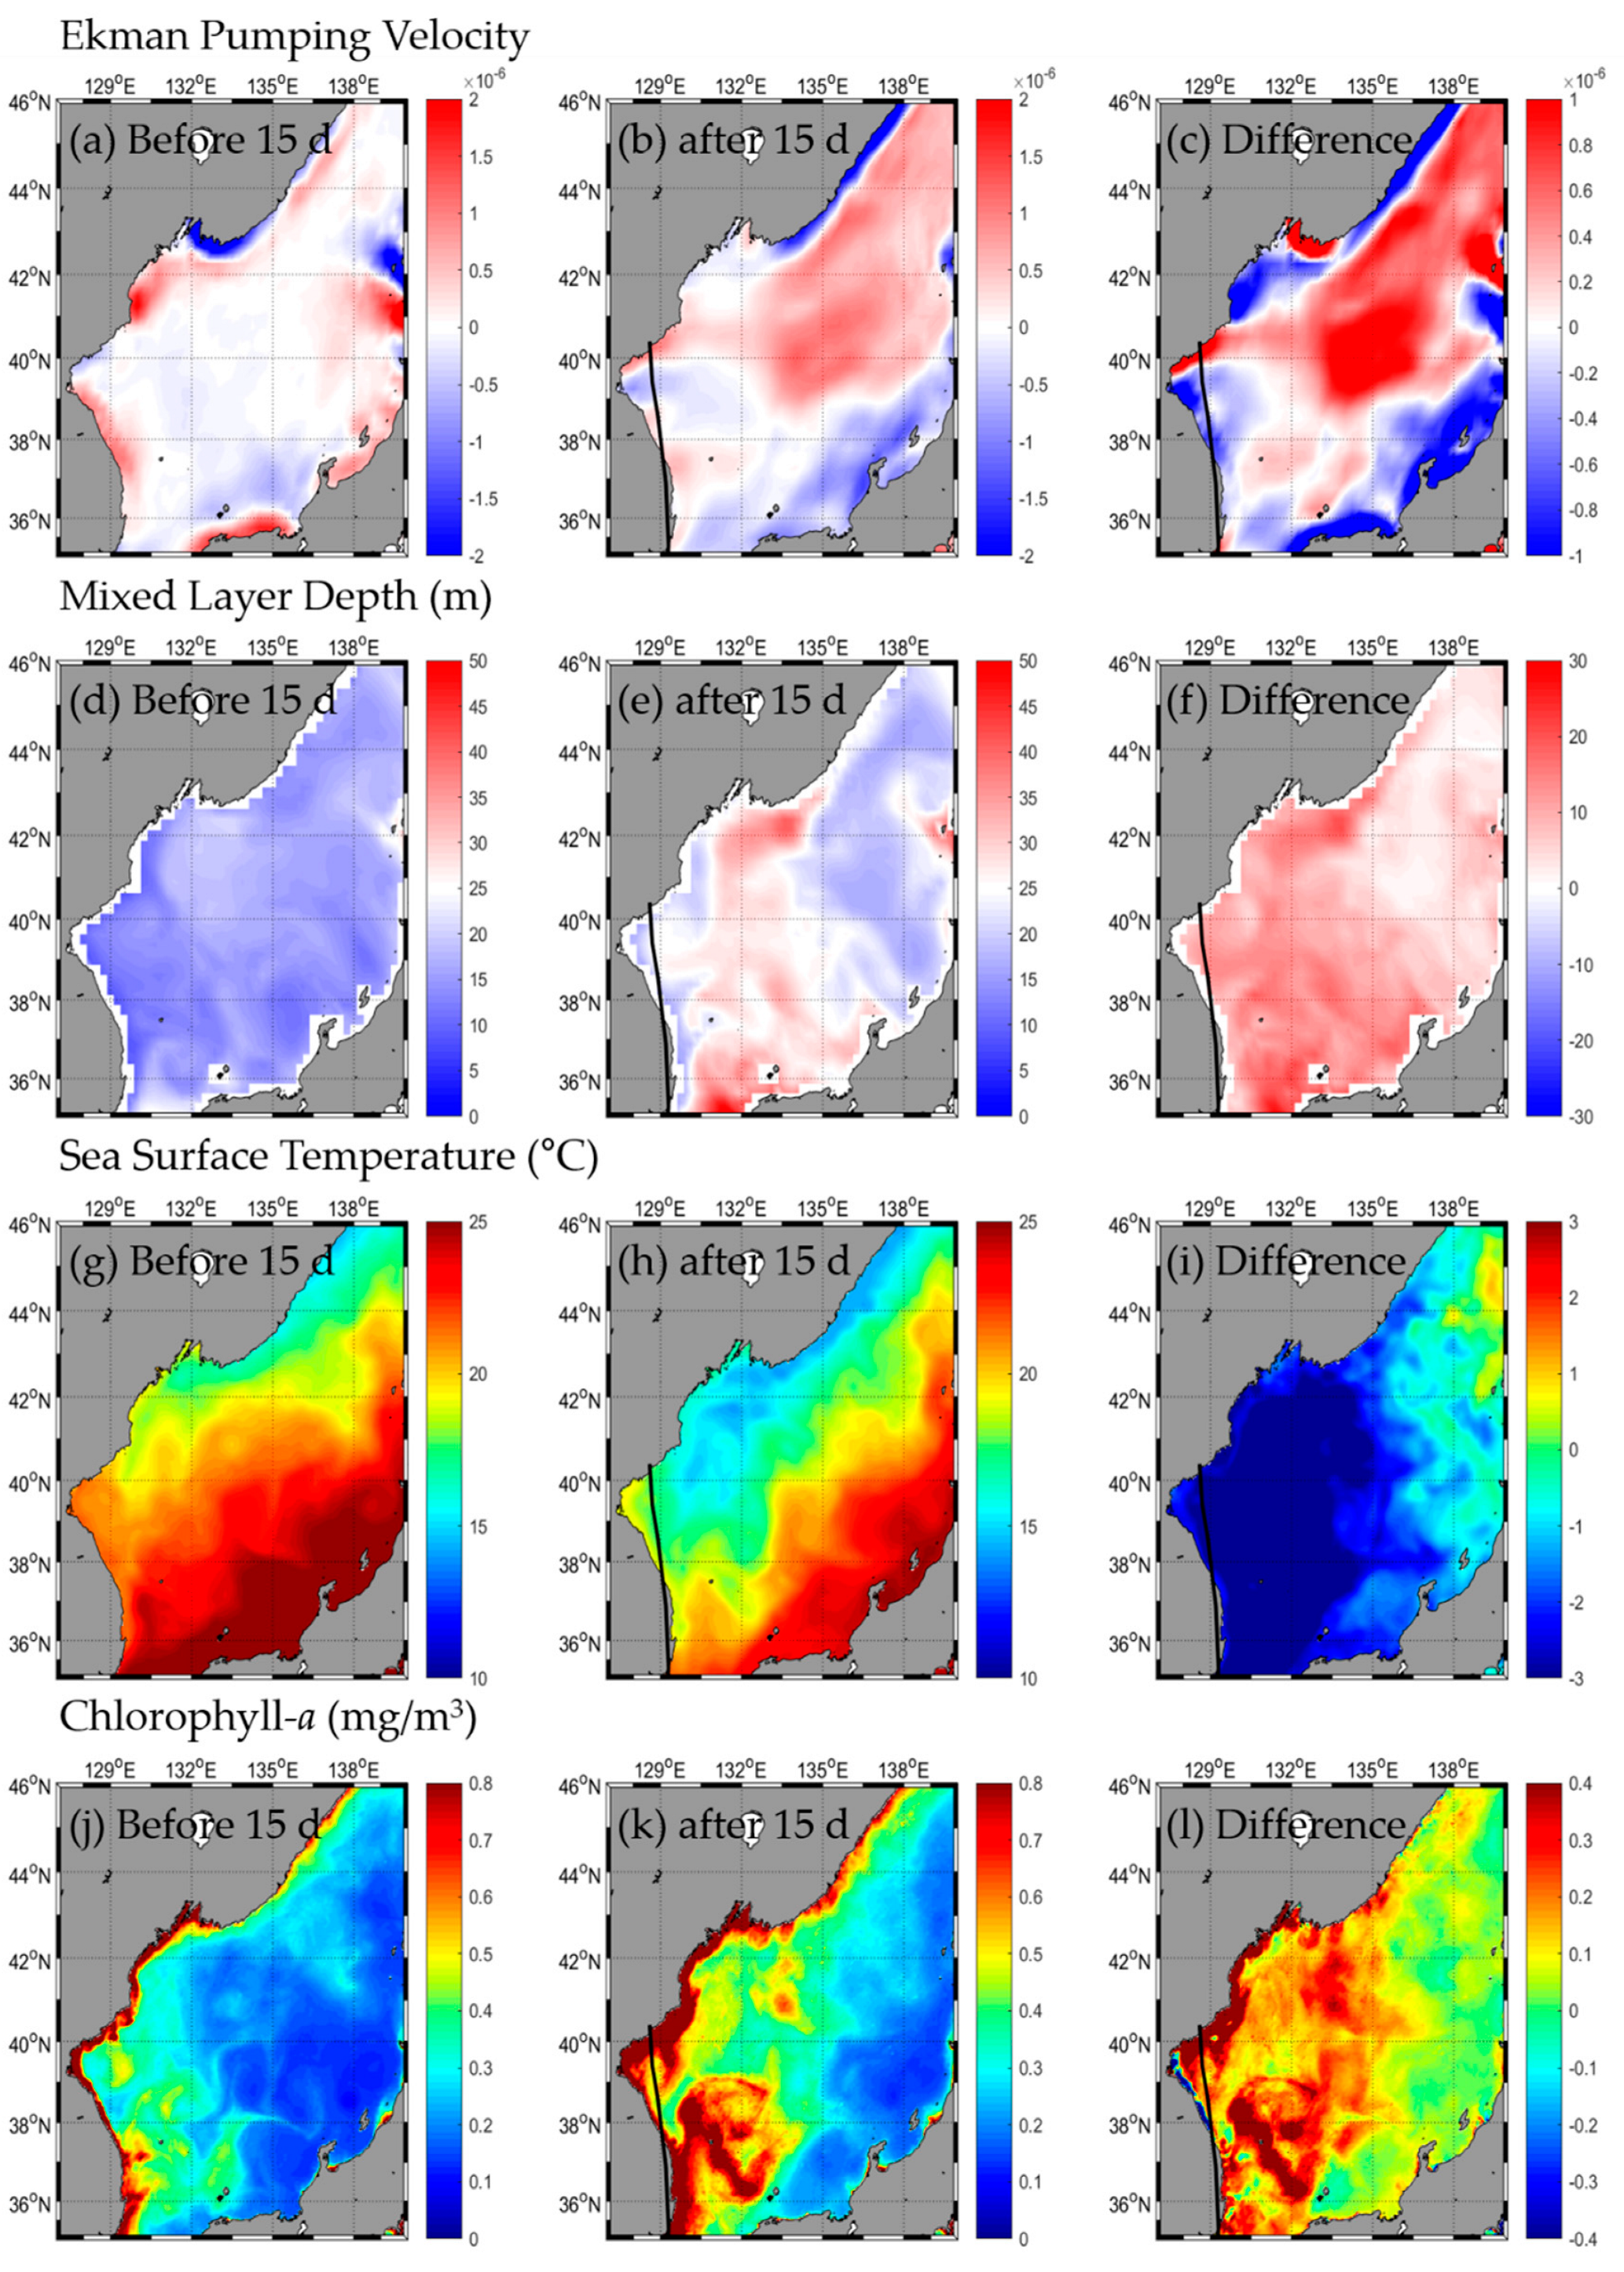
3.1.2. Type B
3.1.3. Type C
3.1.4. Type D
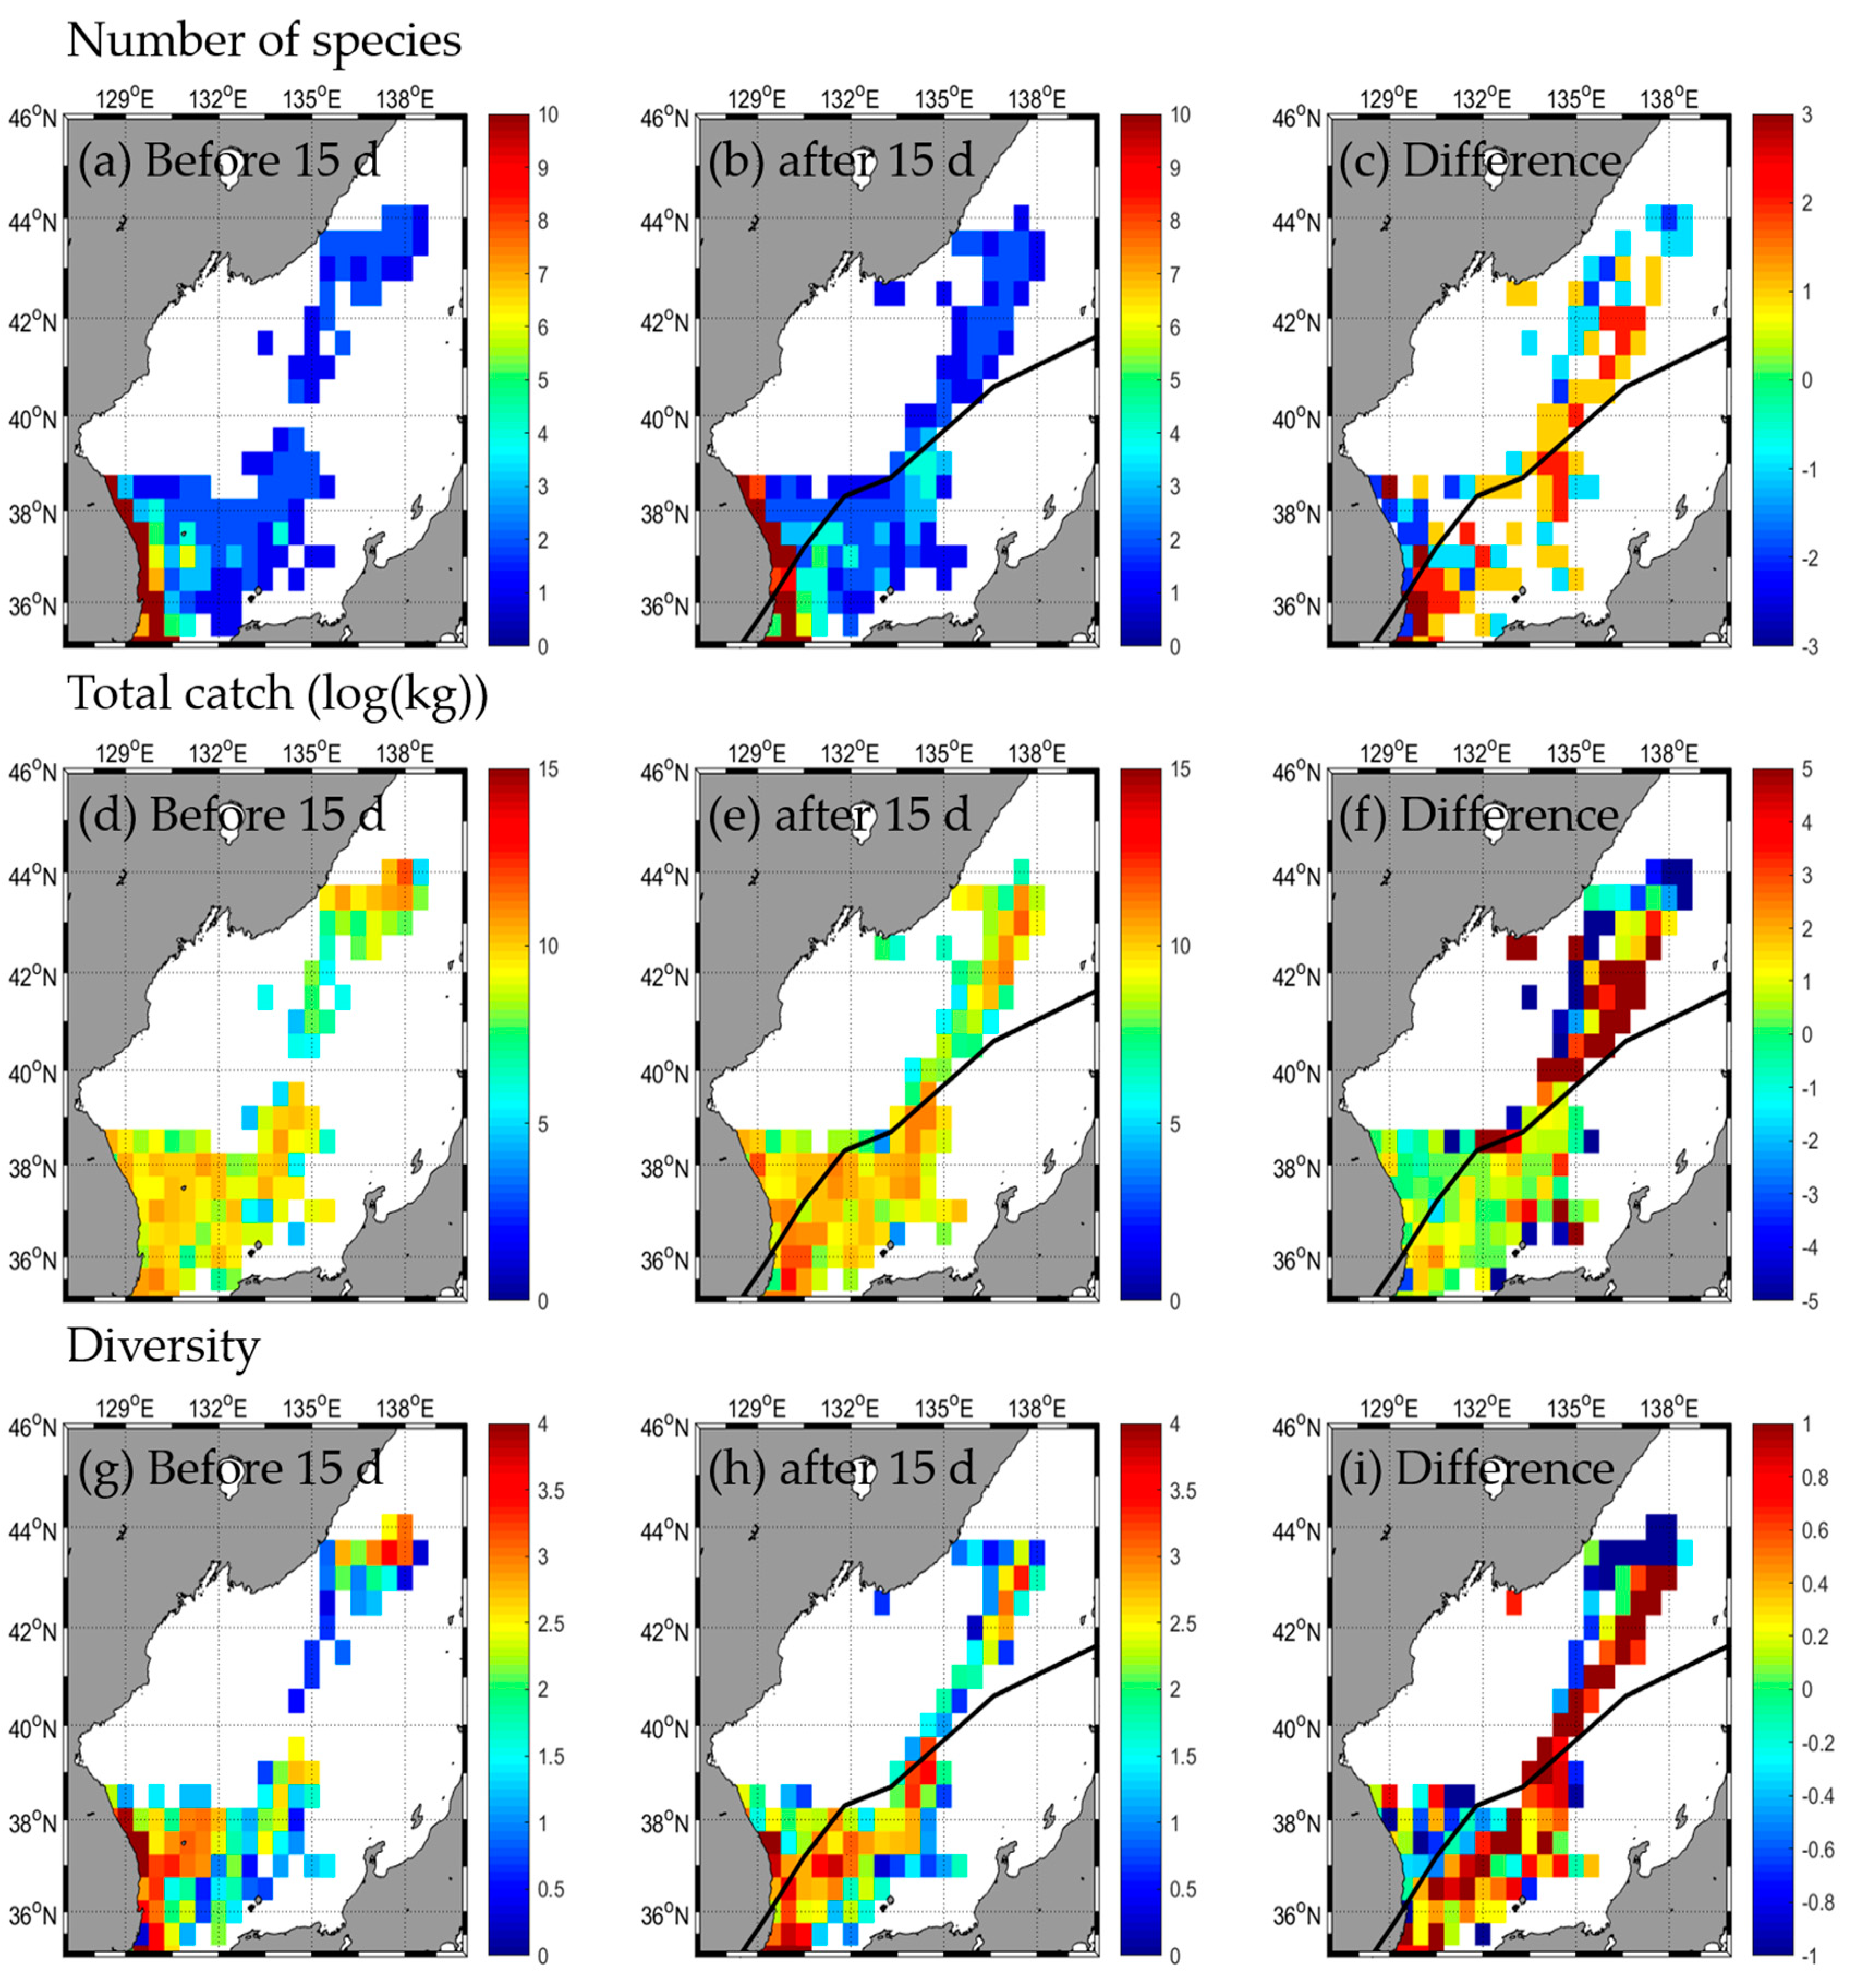
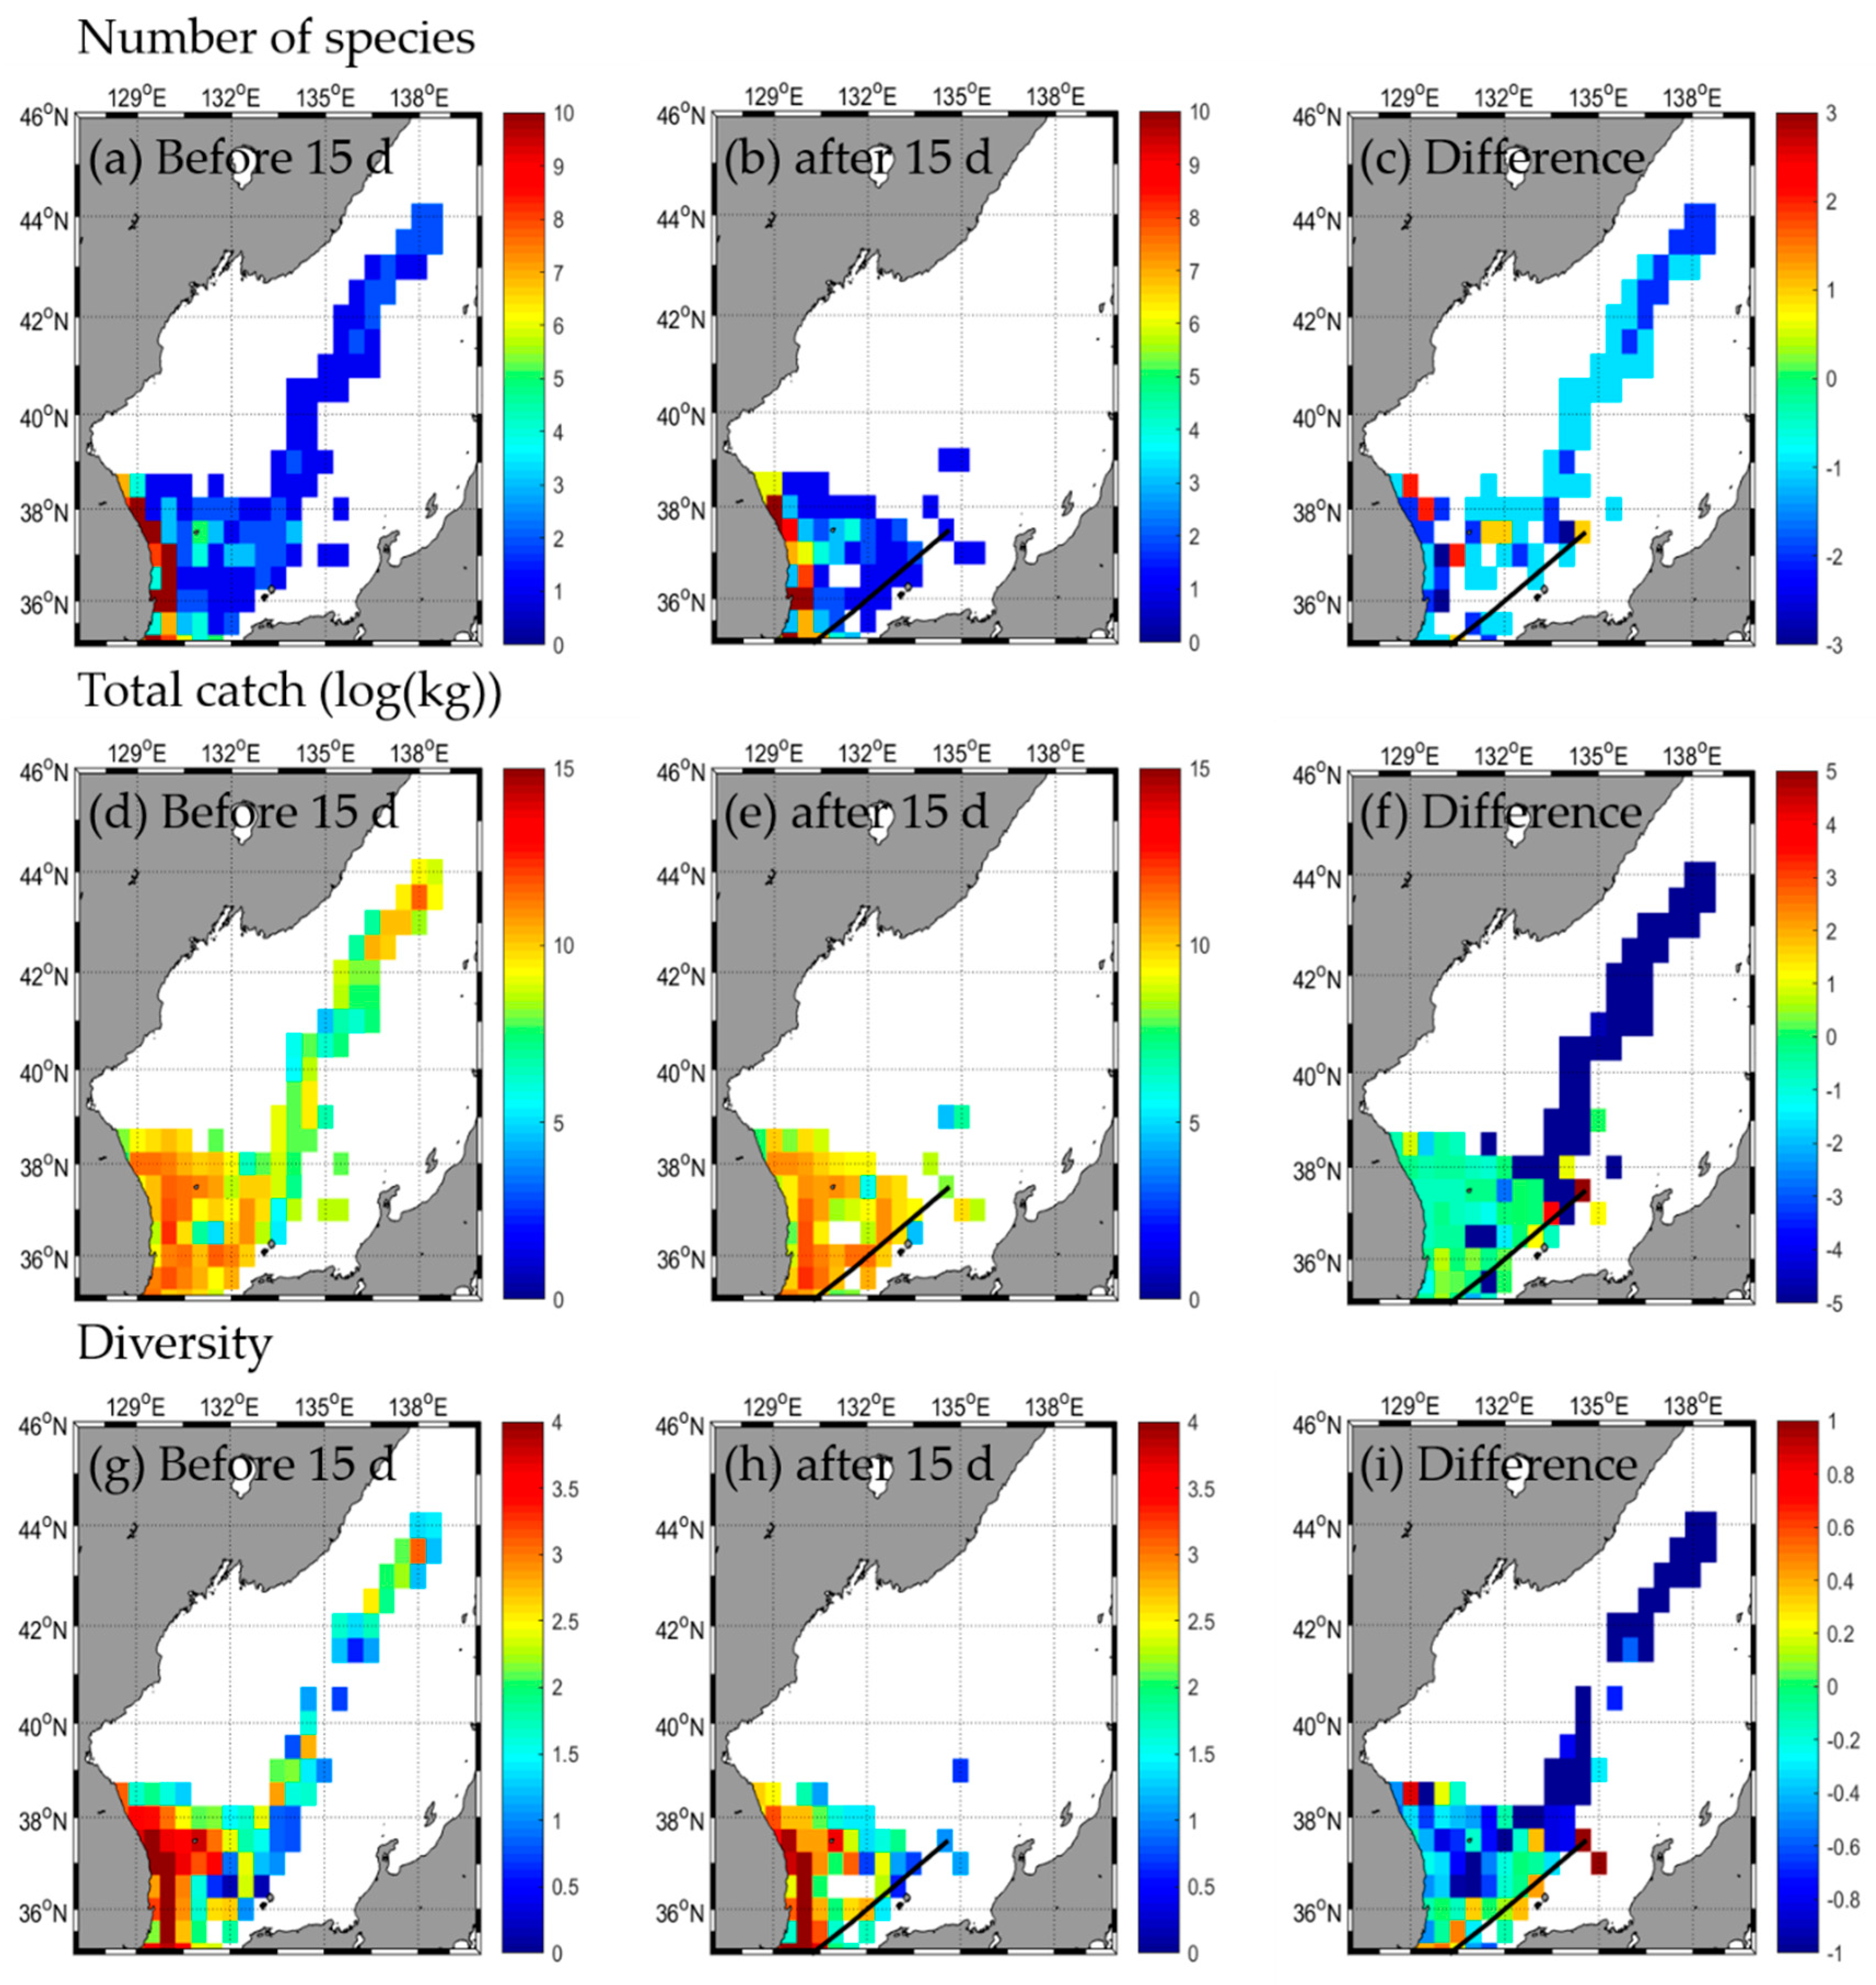
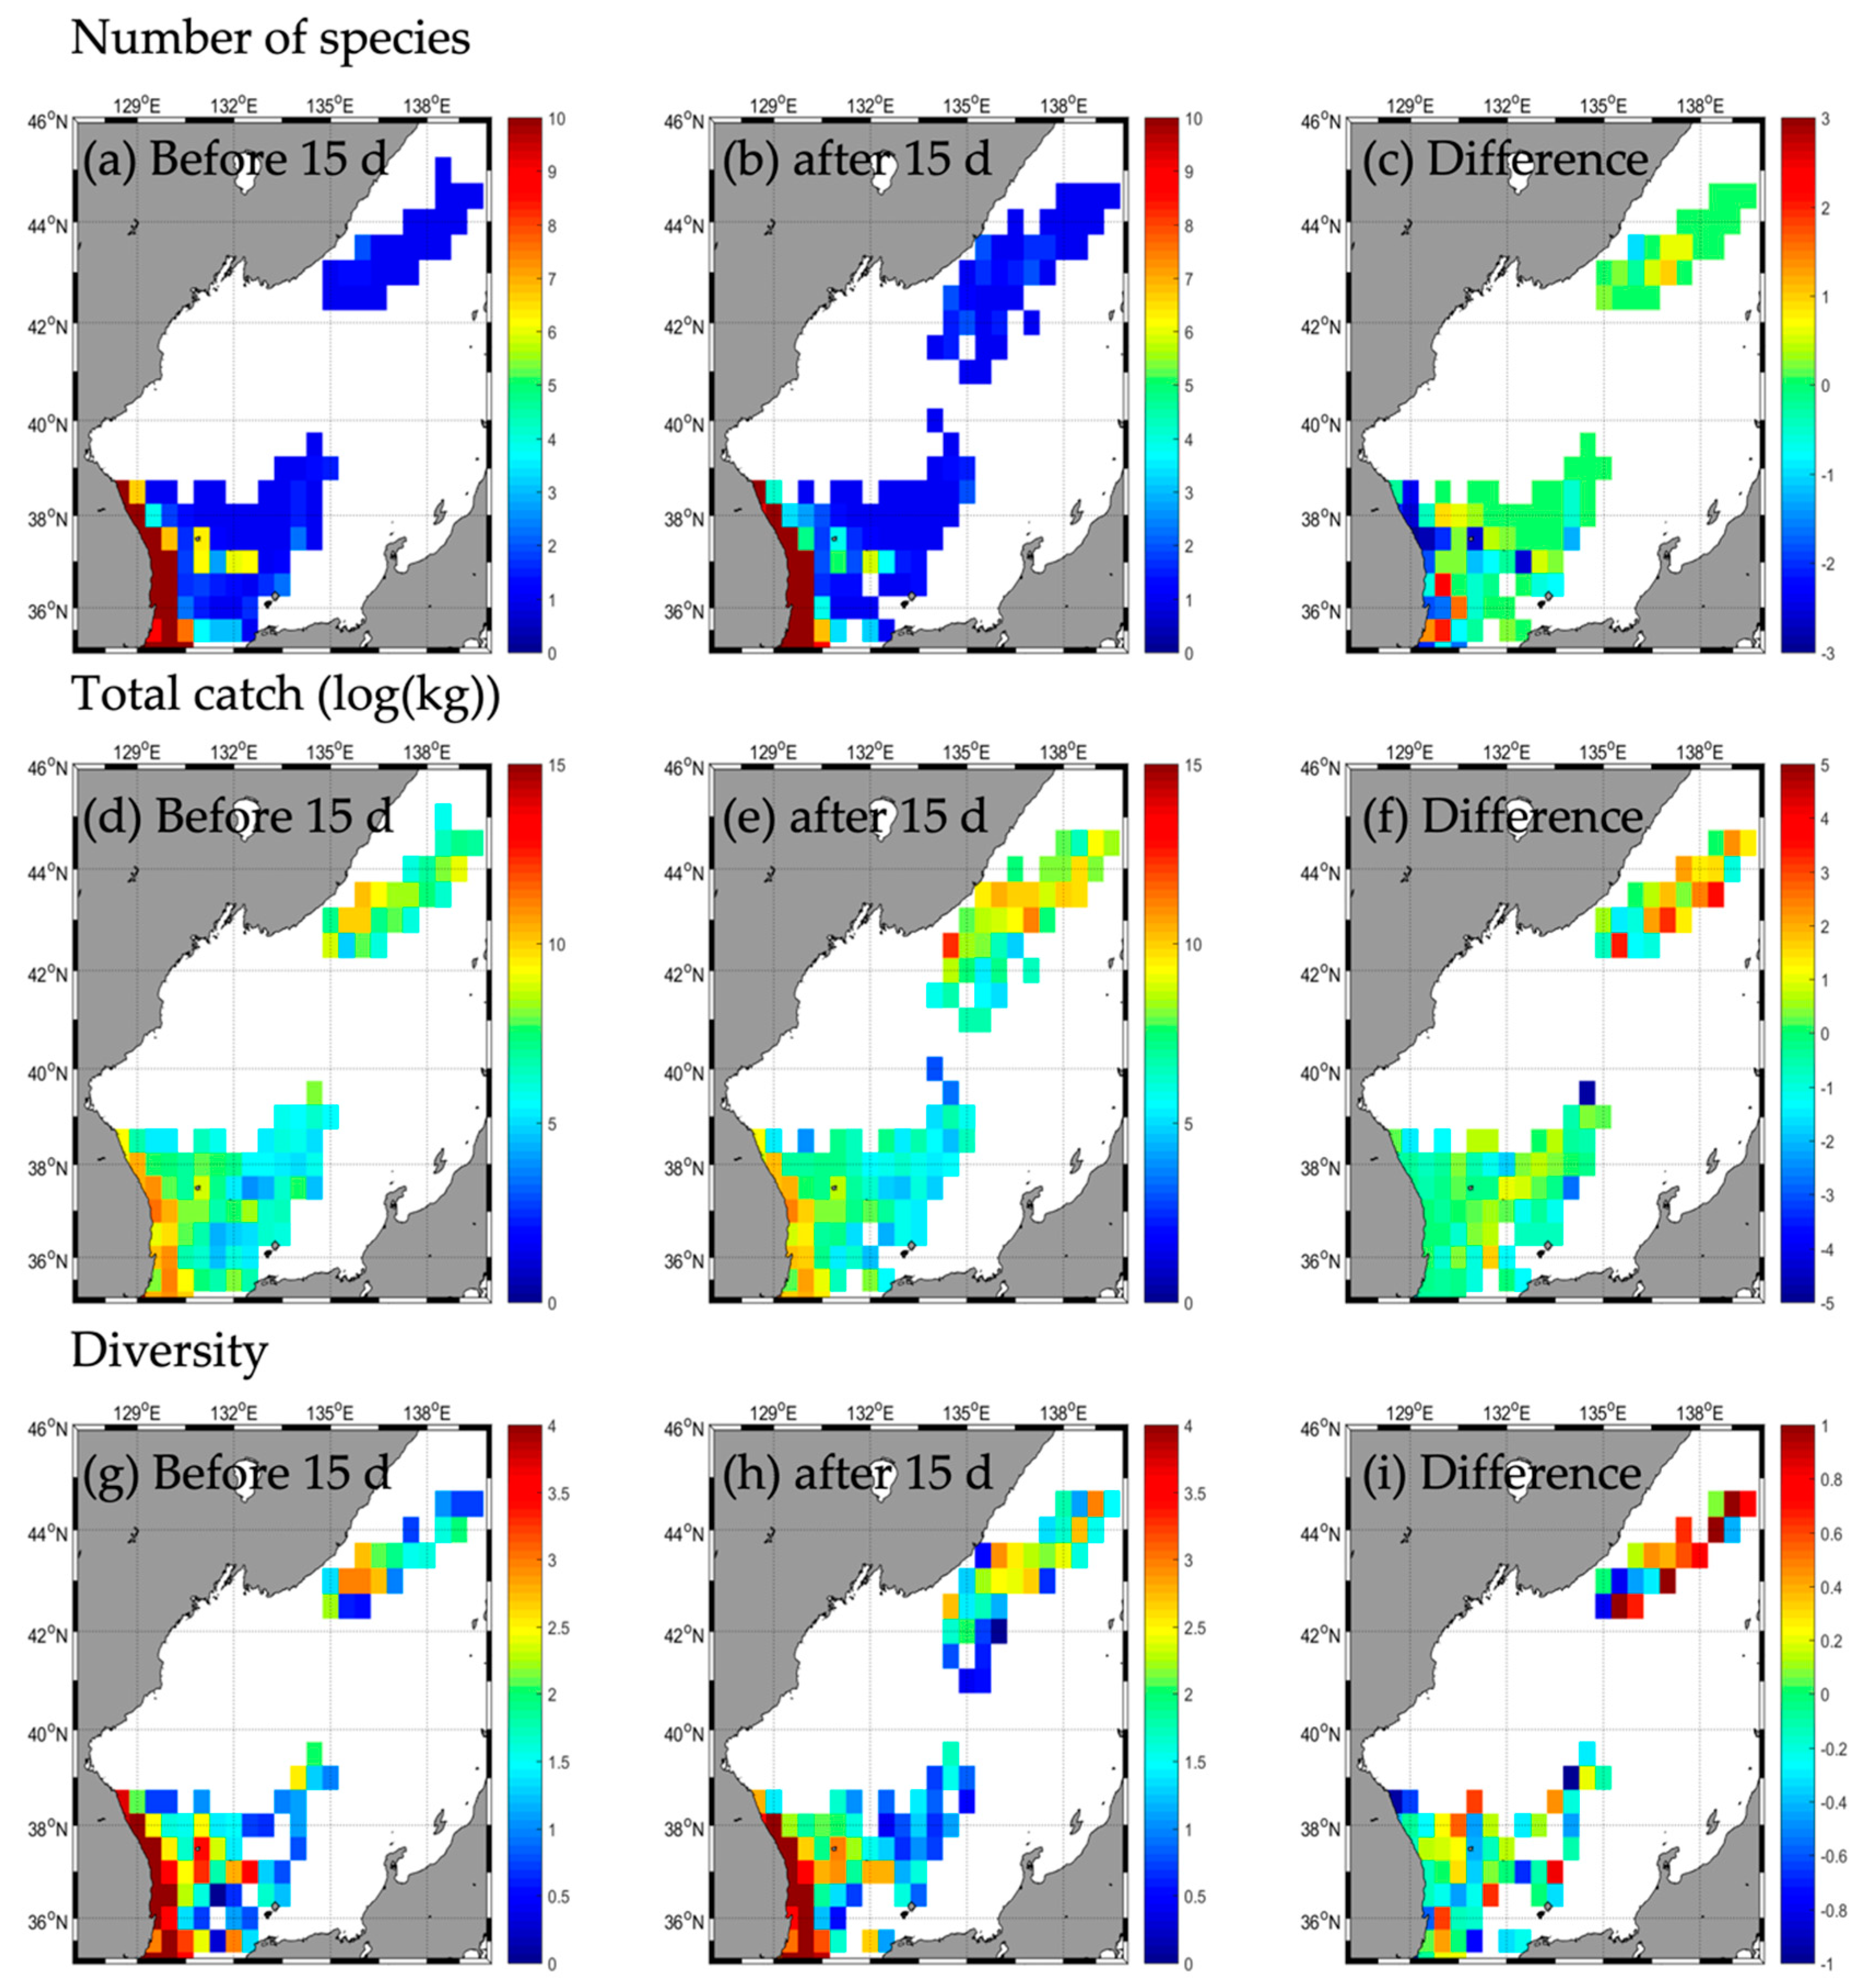
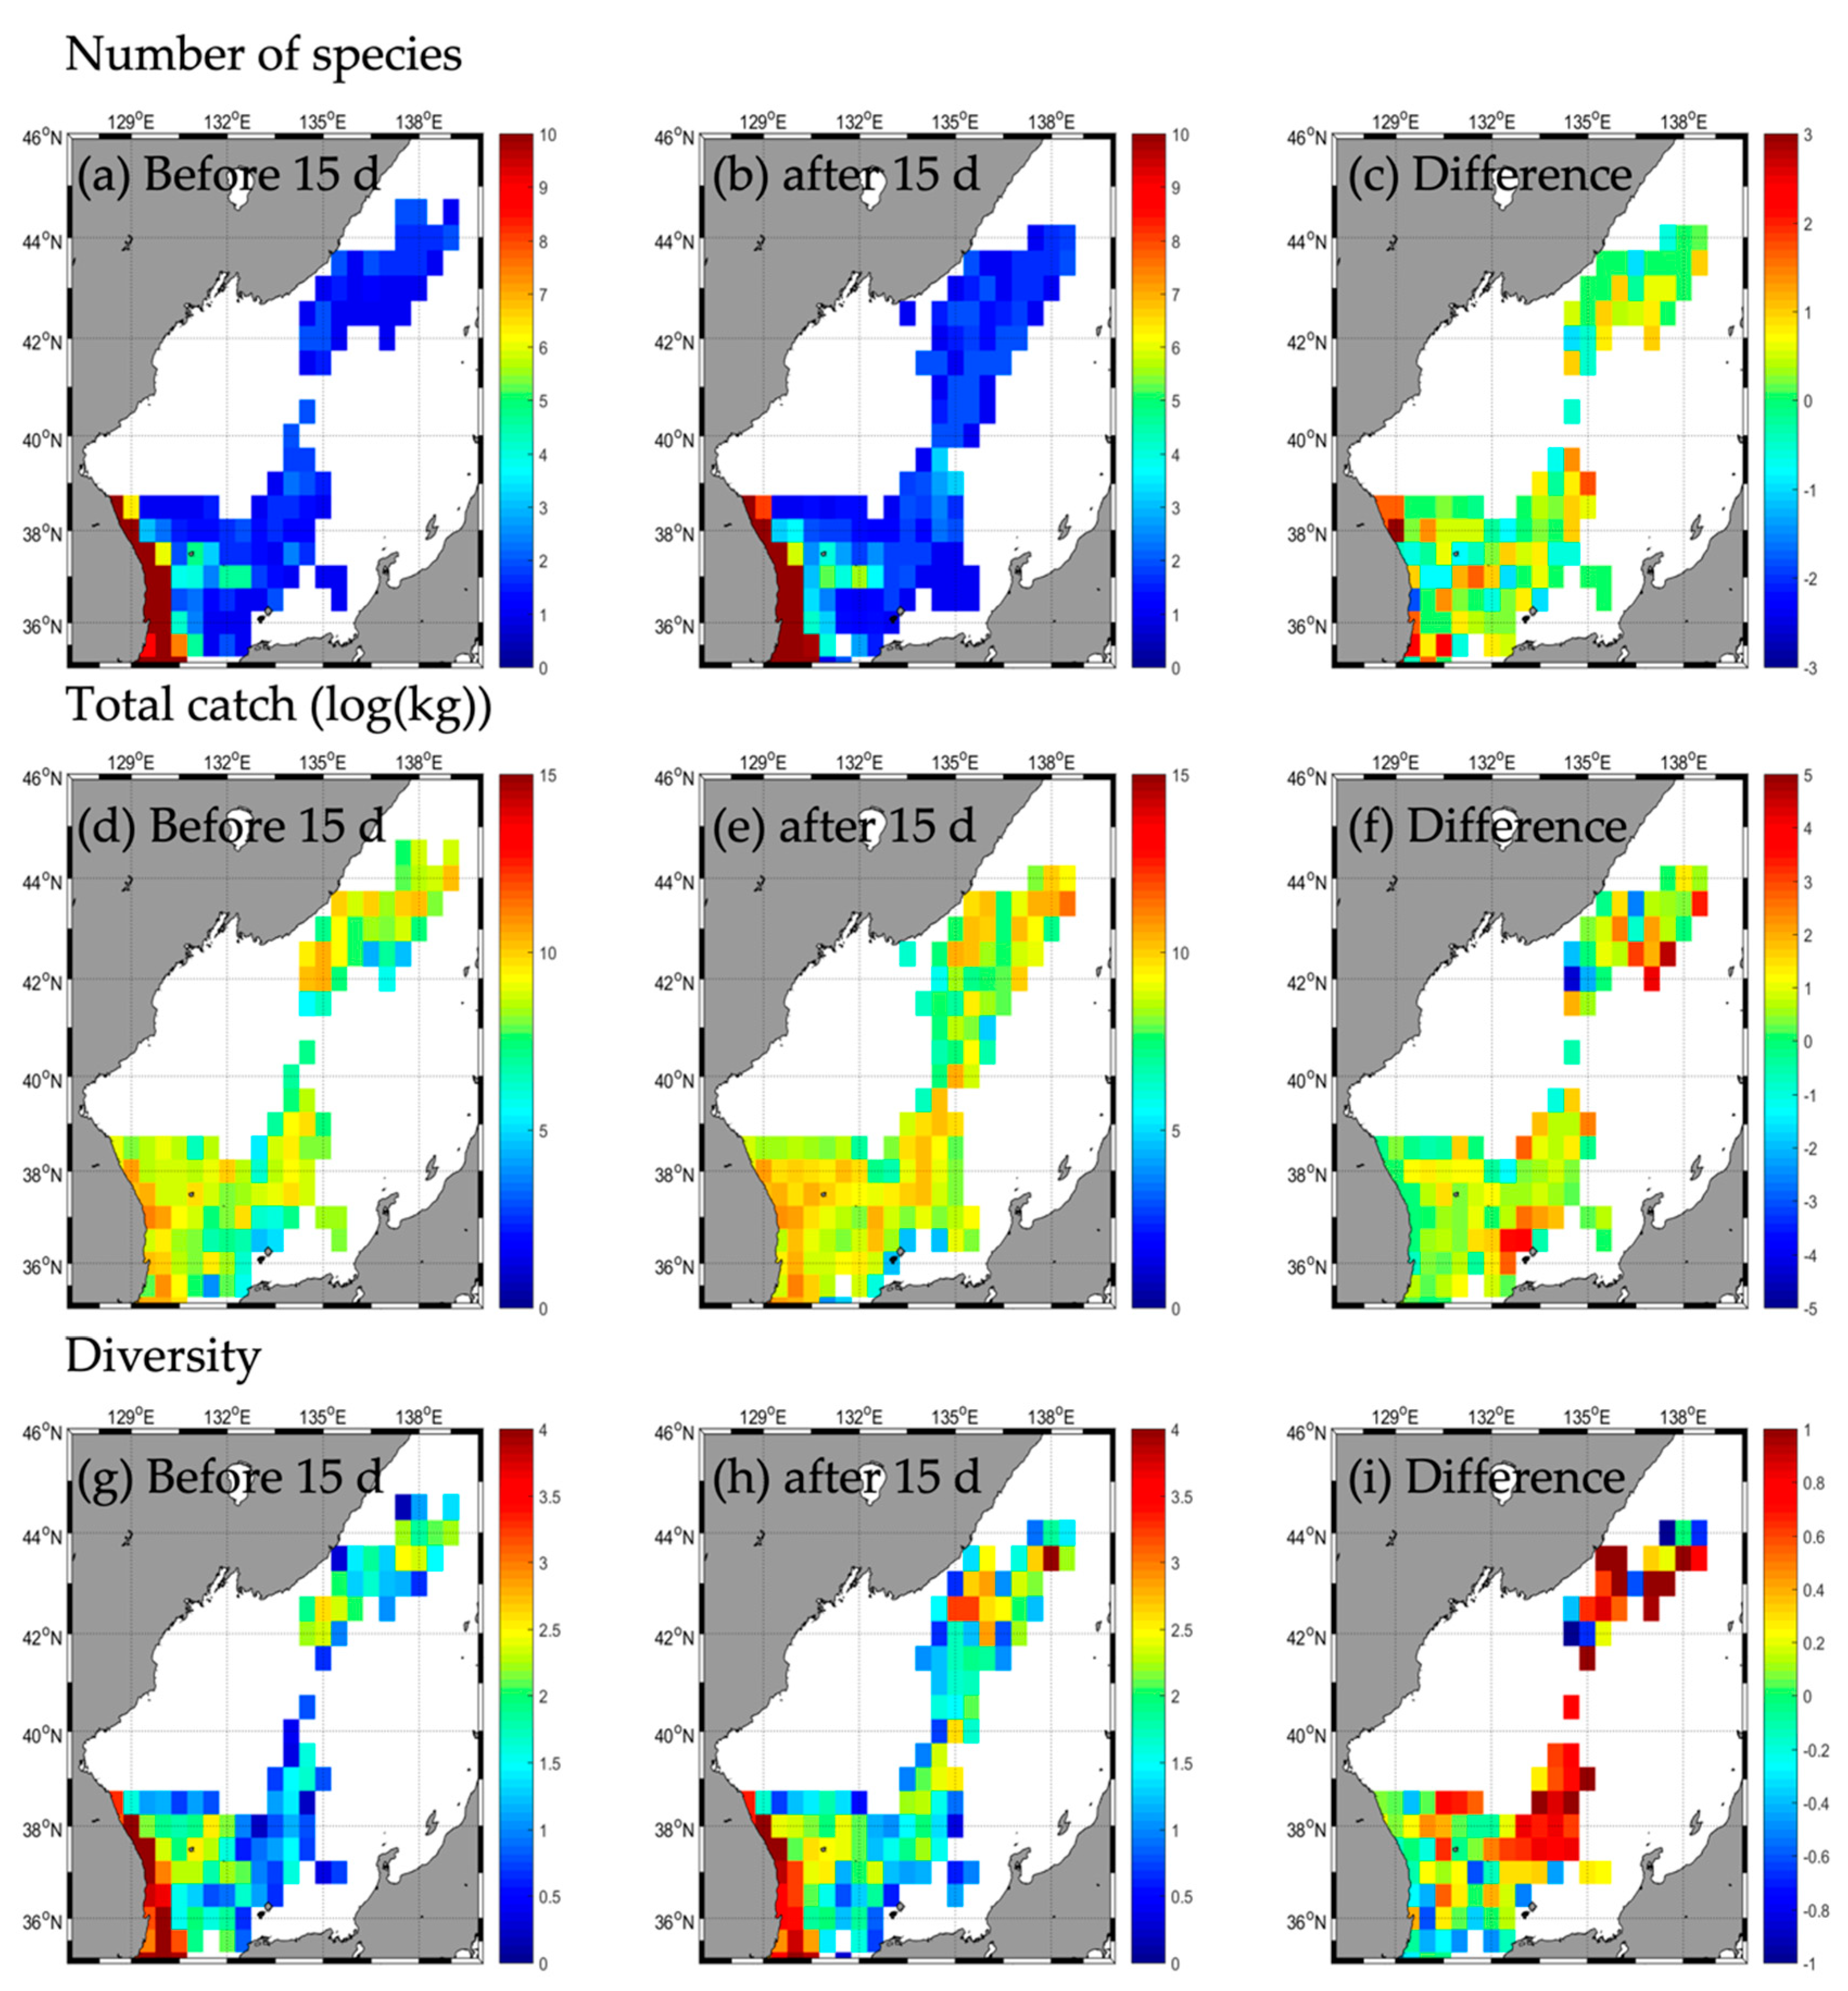
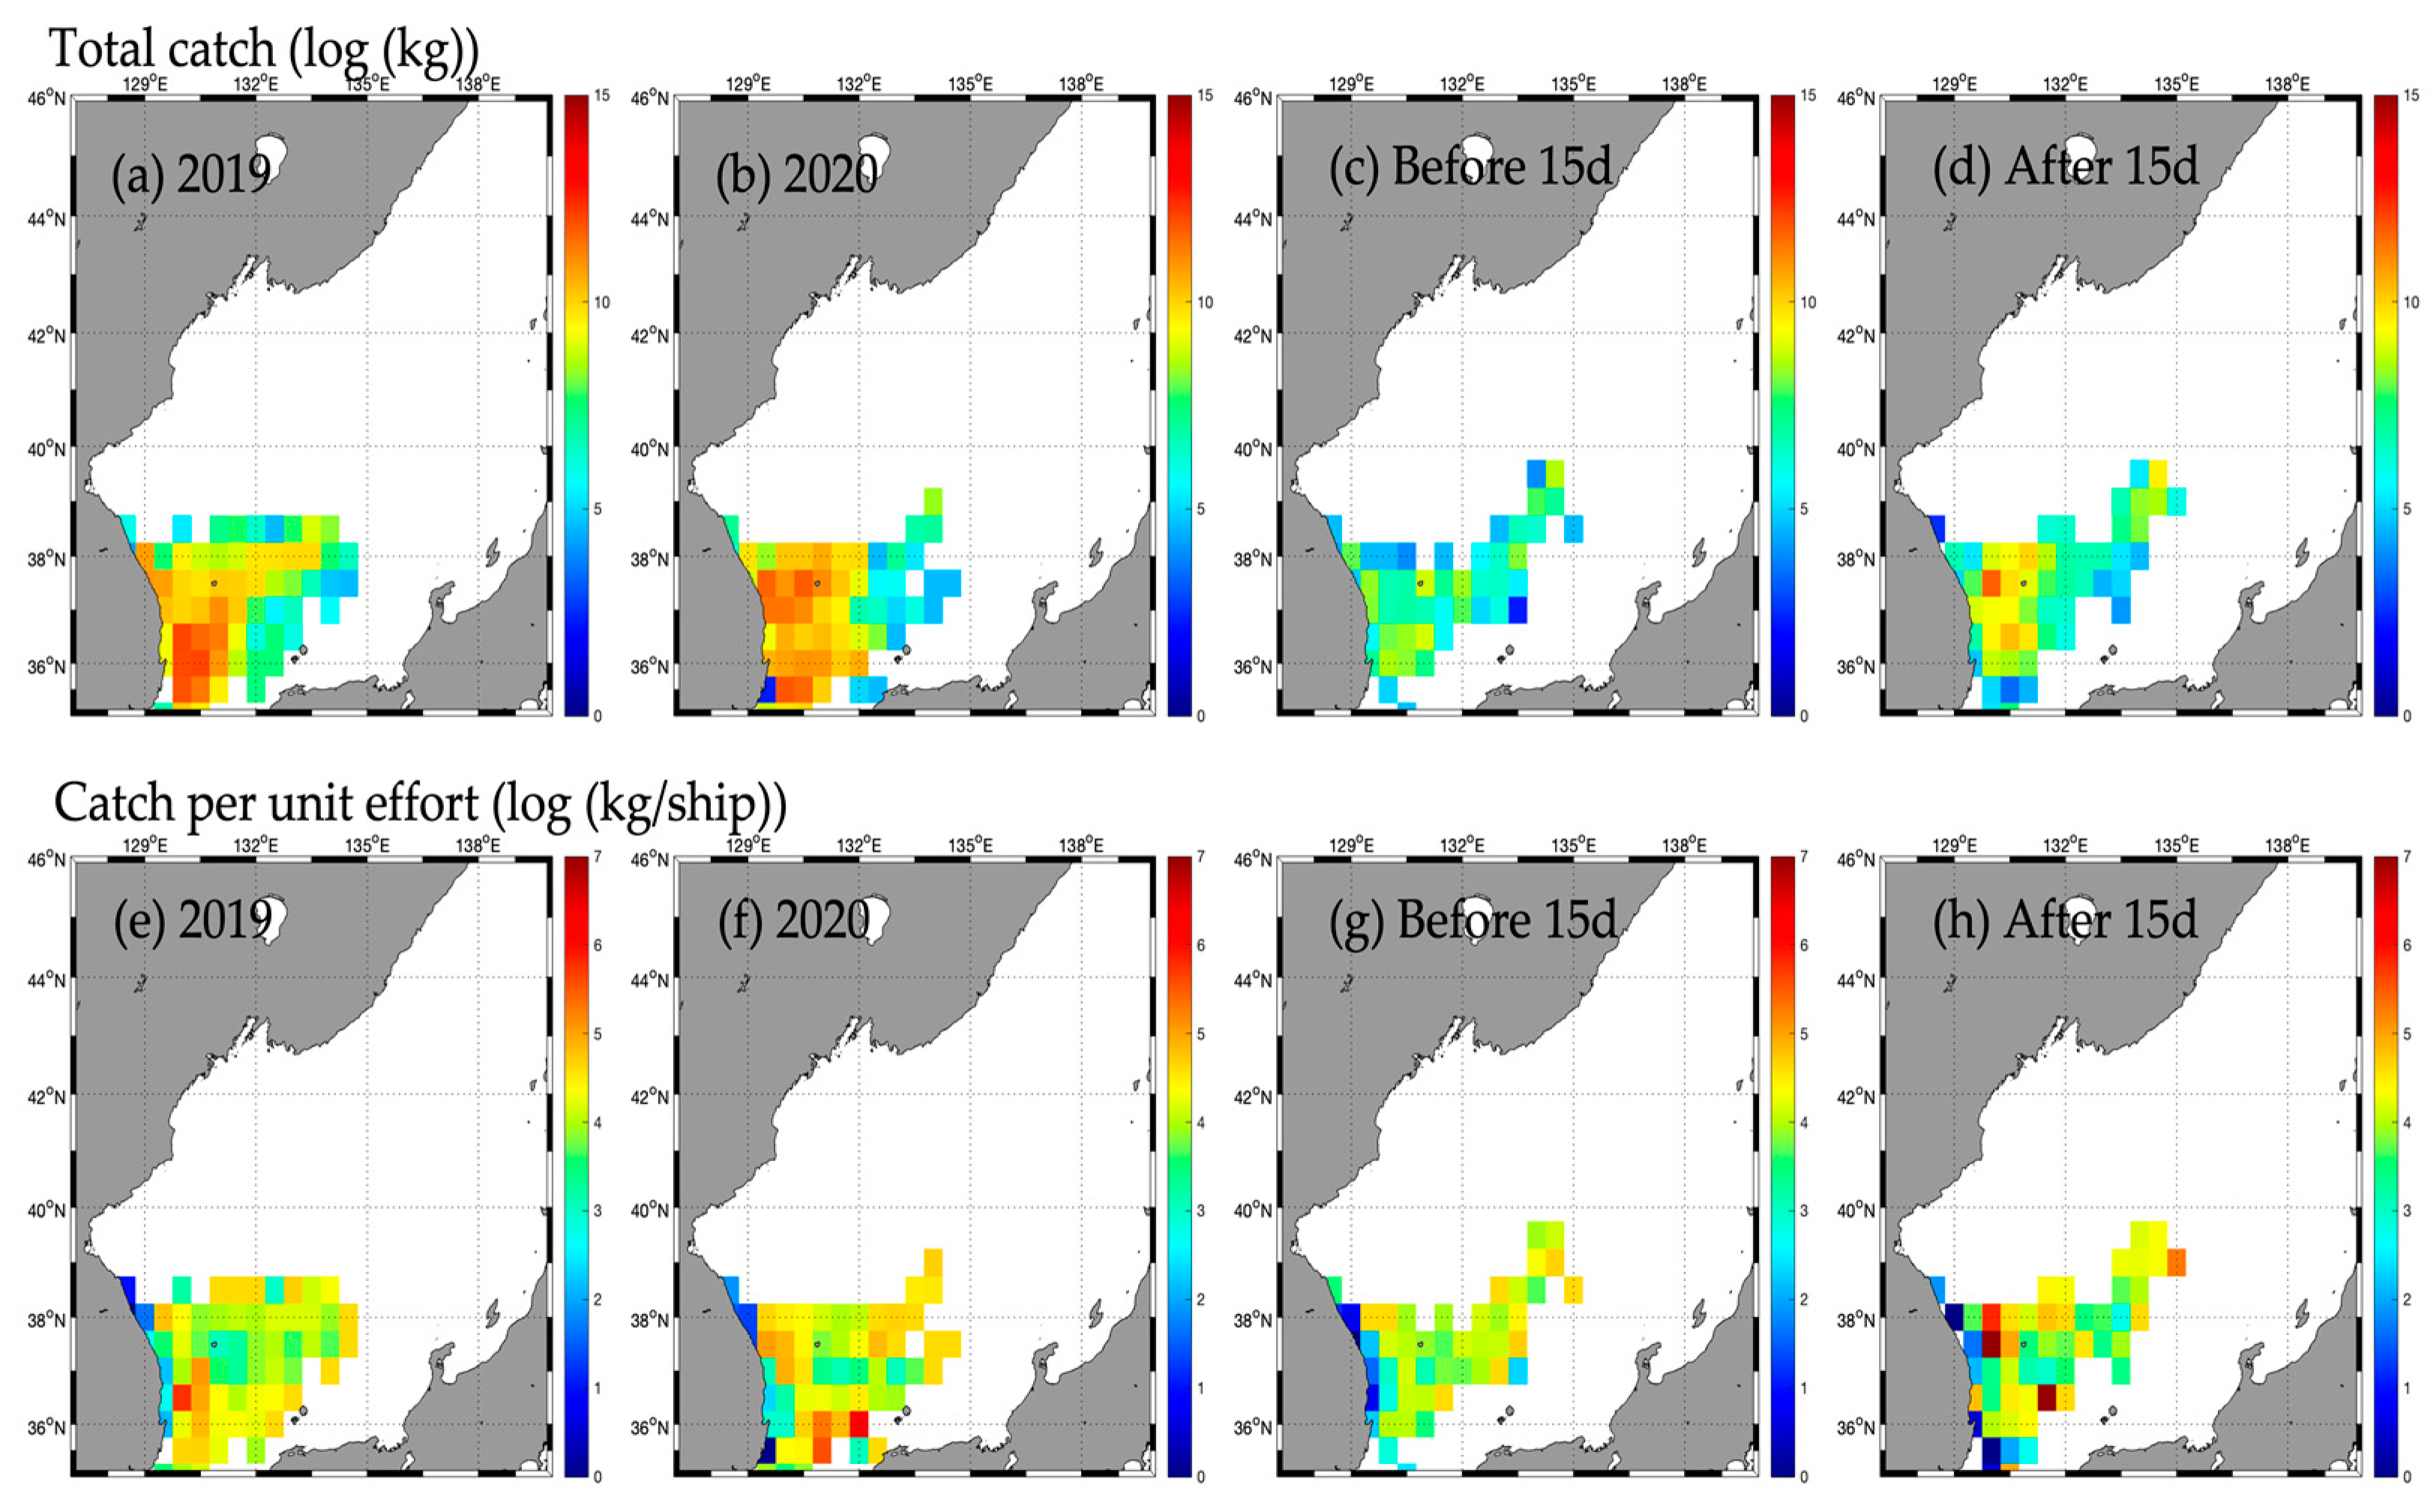
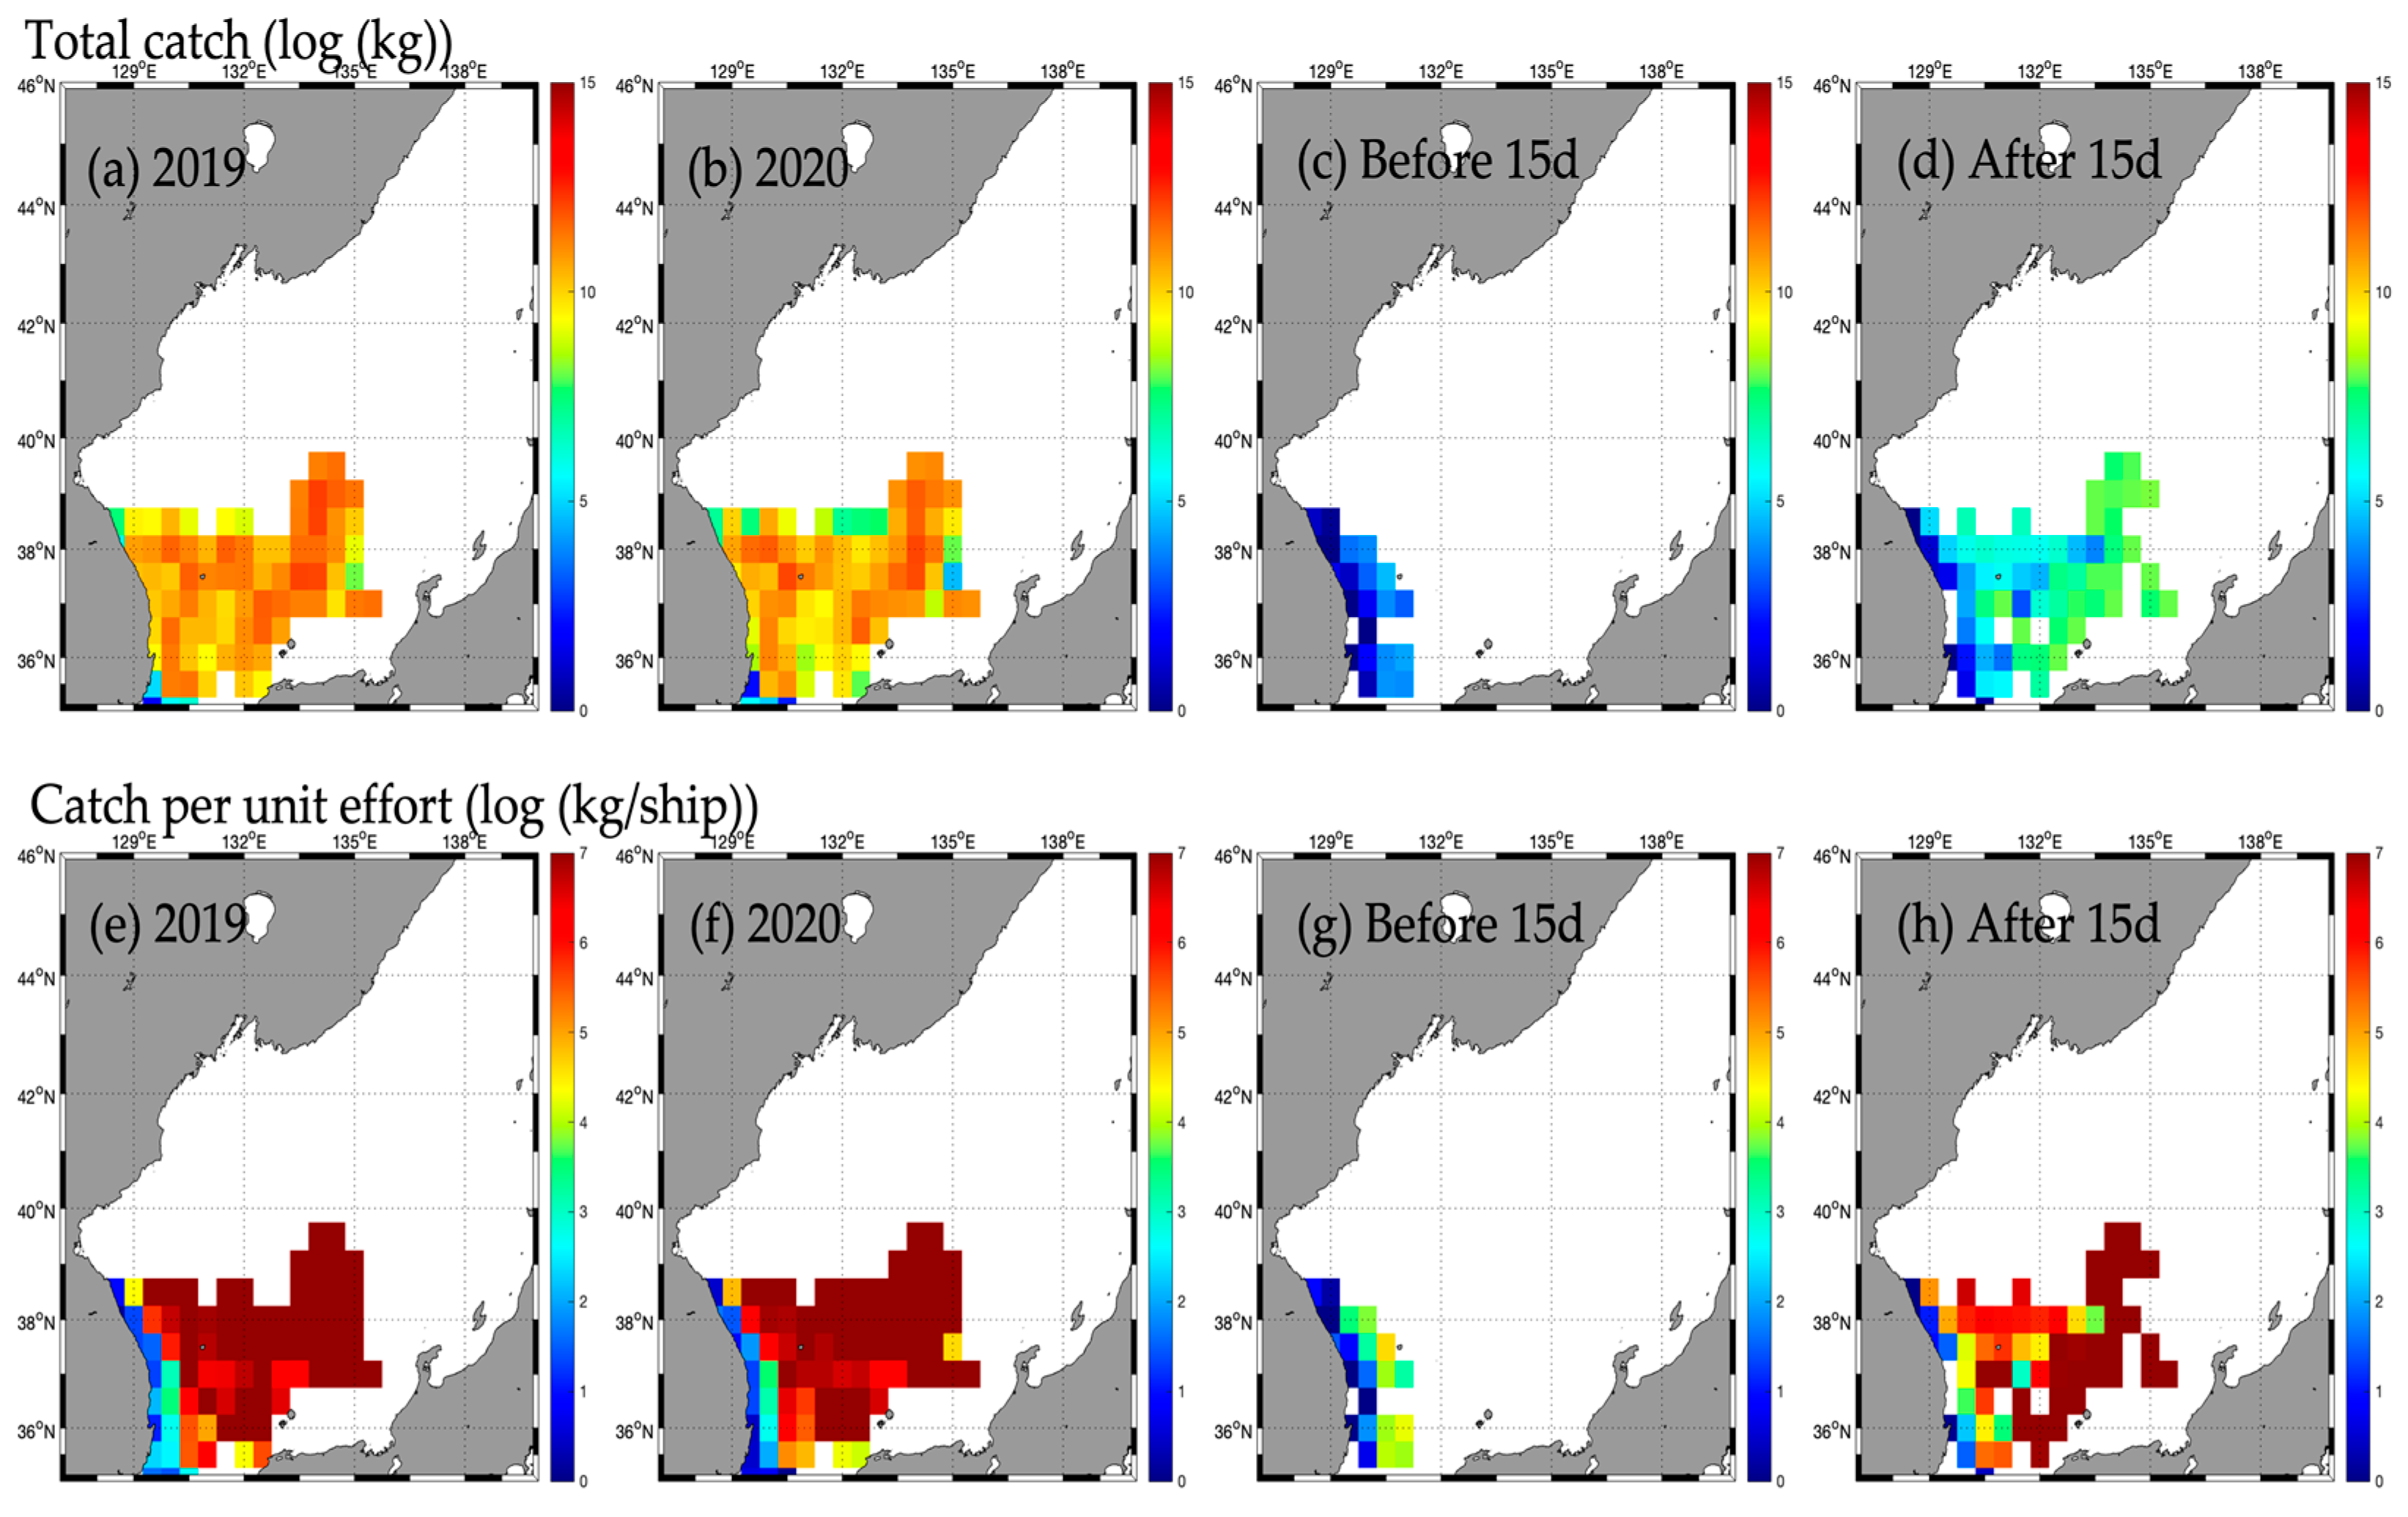
3.2. Responses in Fishery Resources
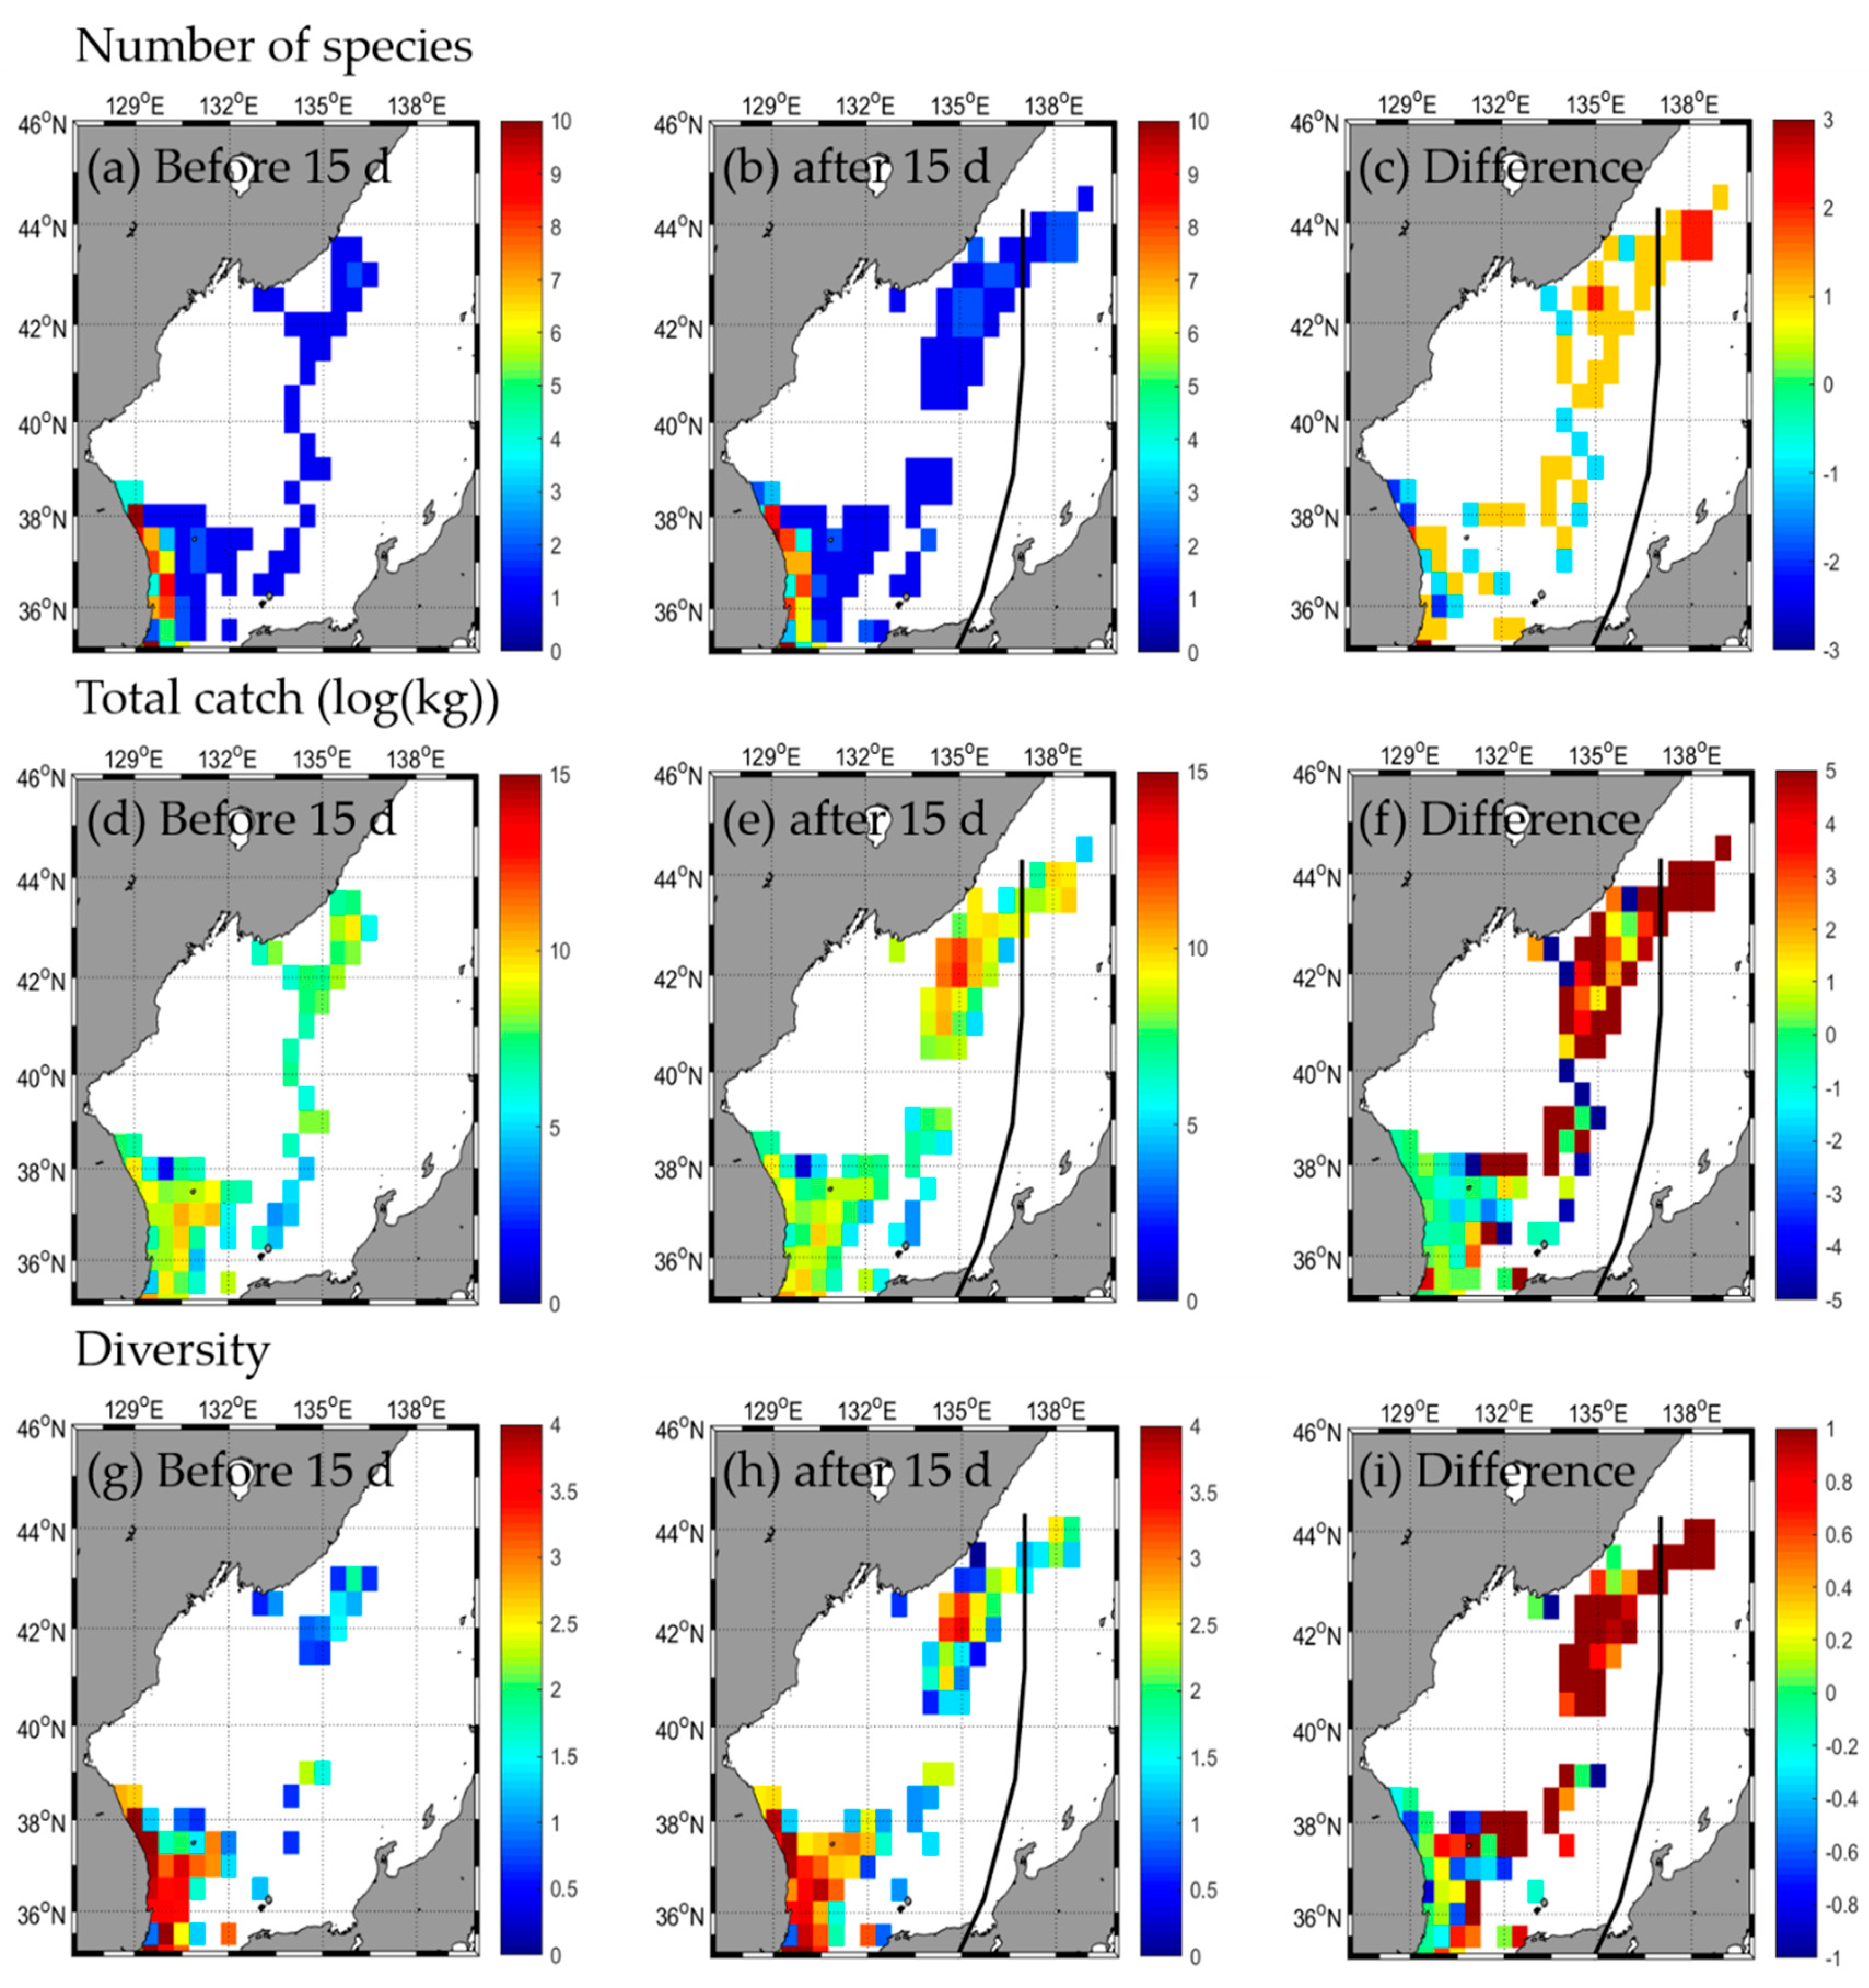
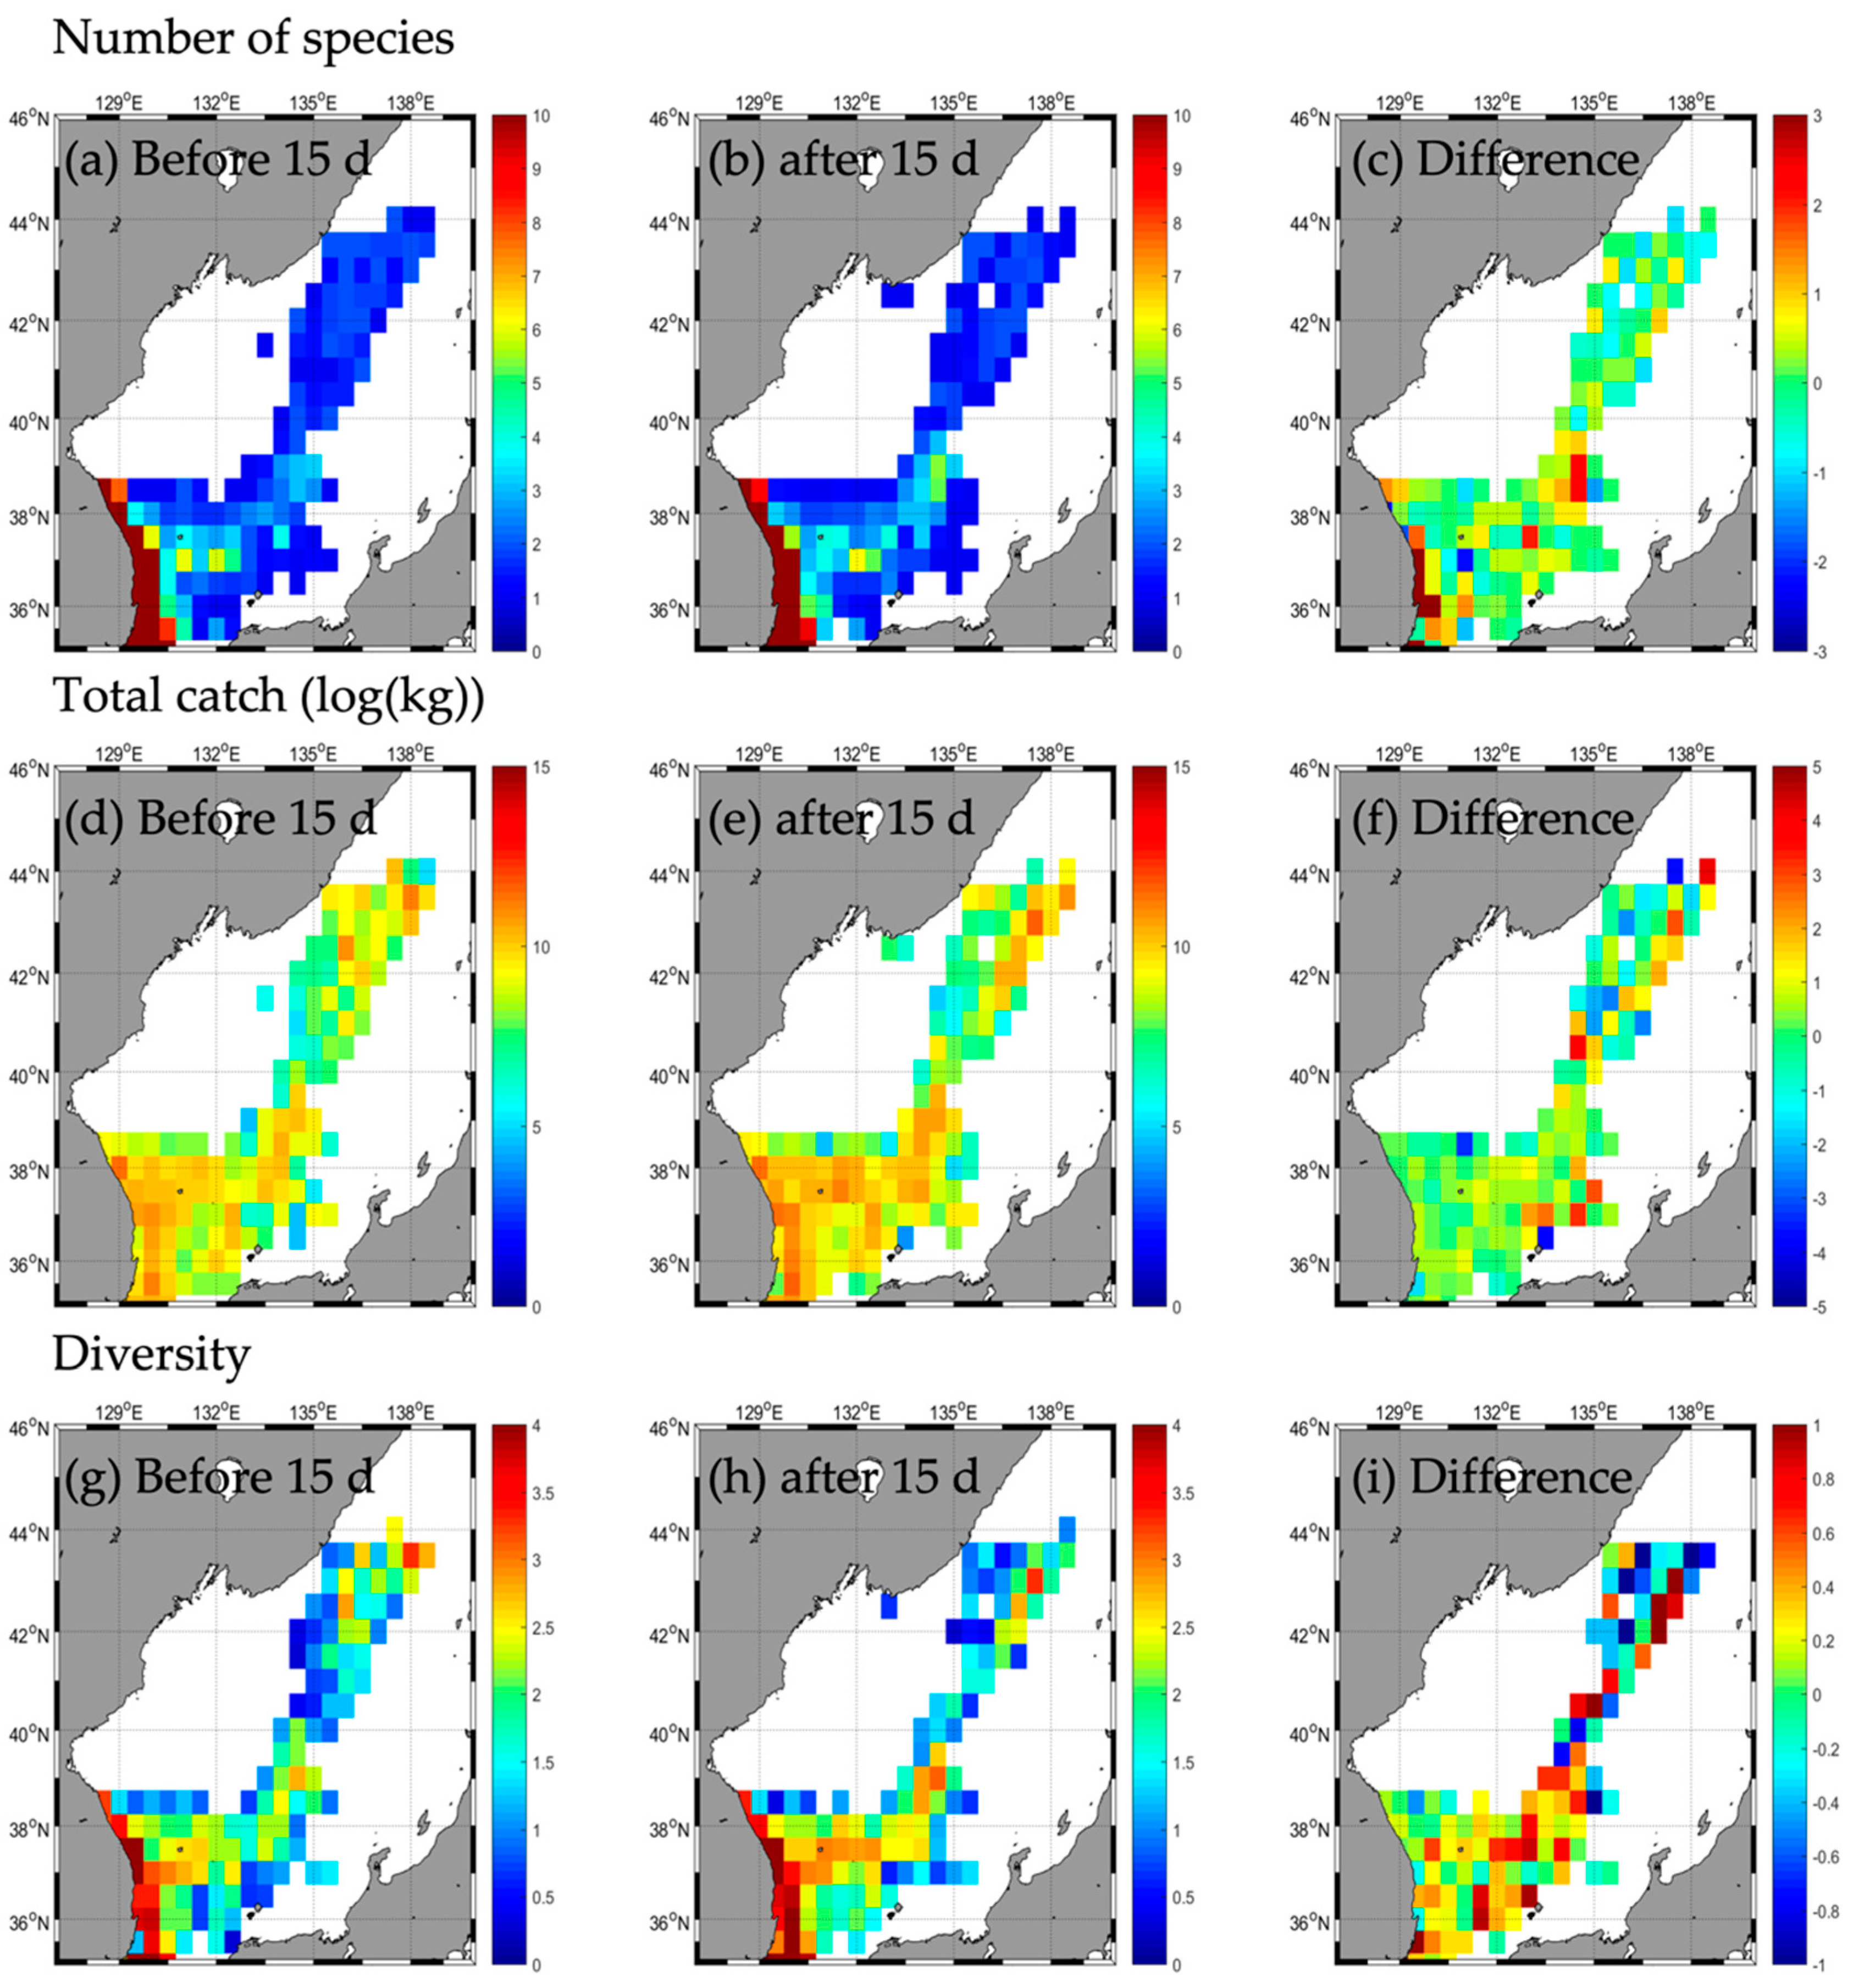
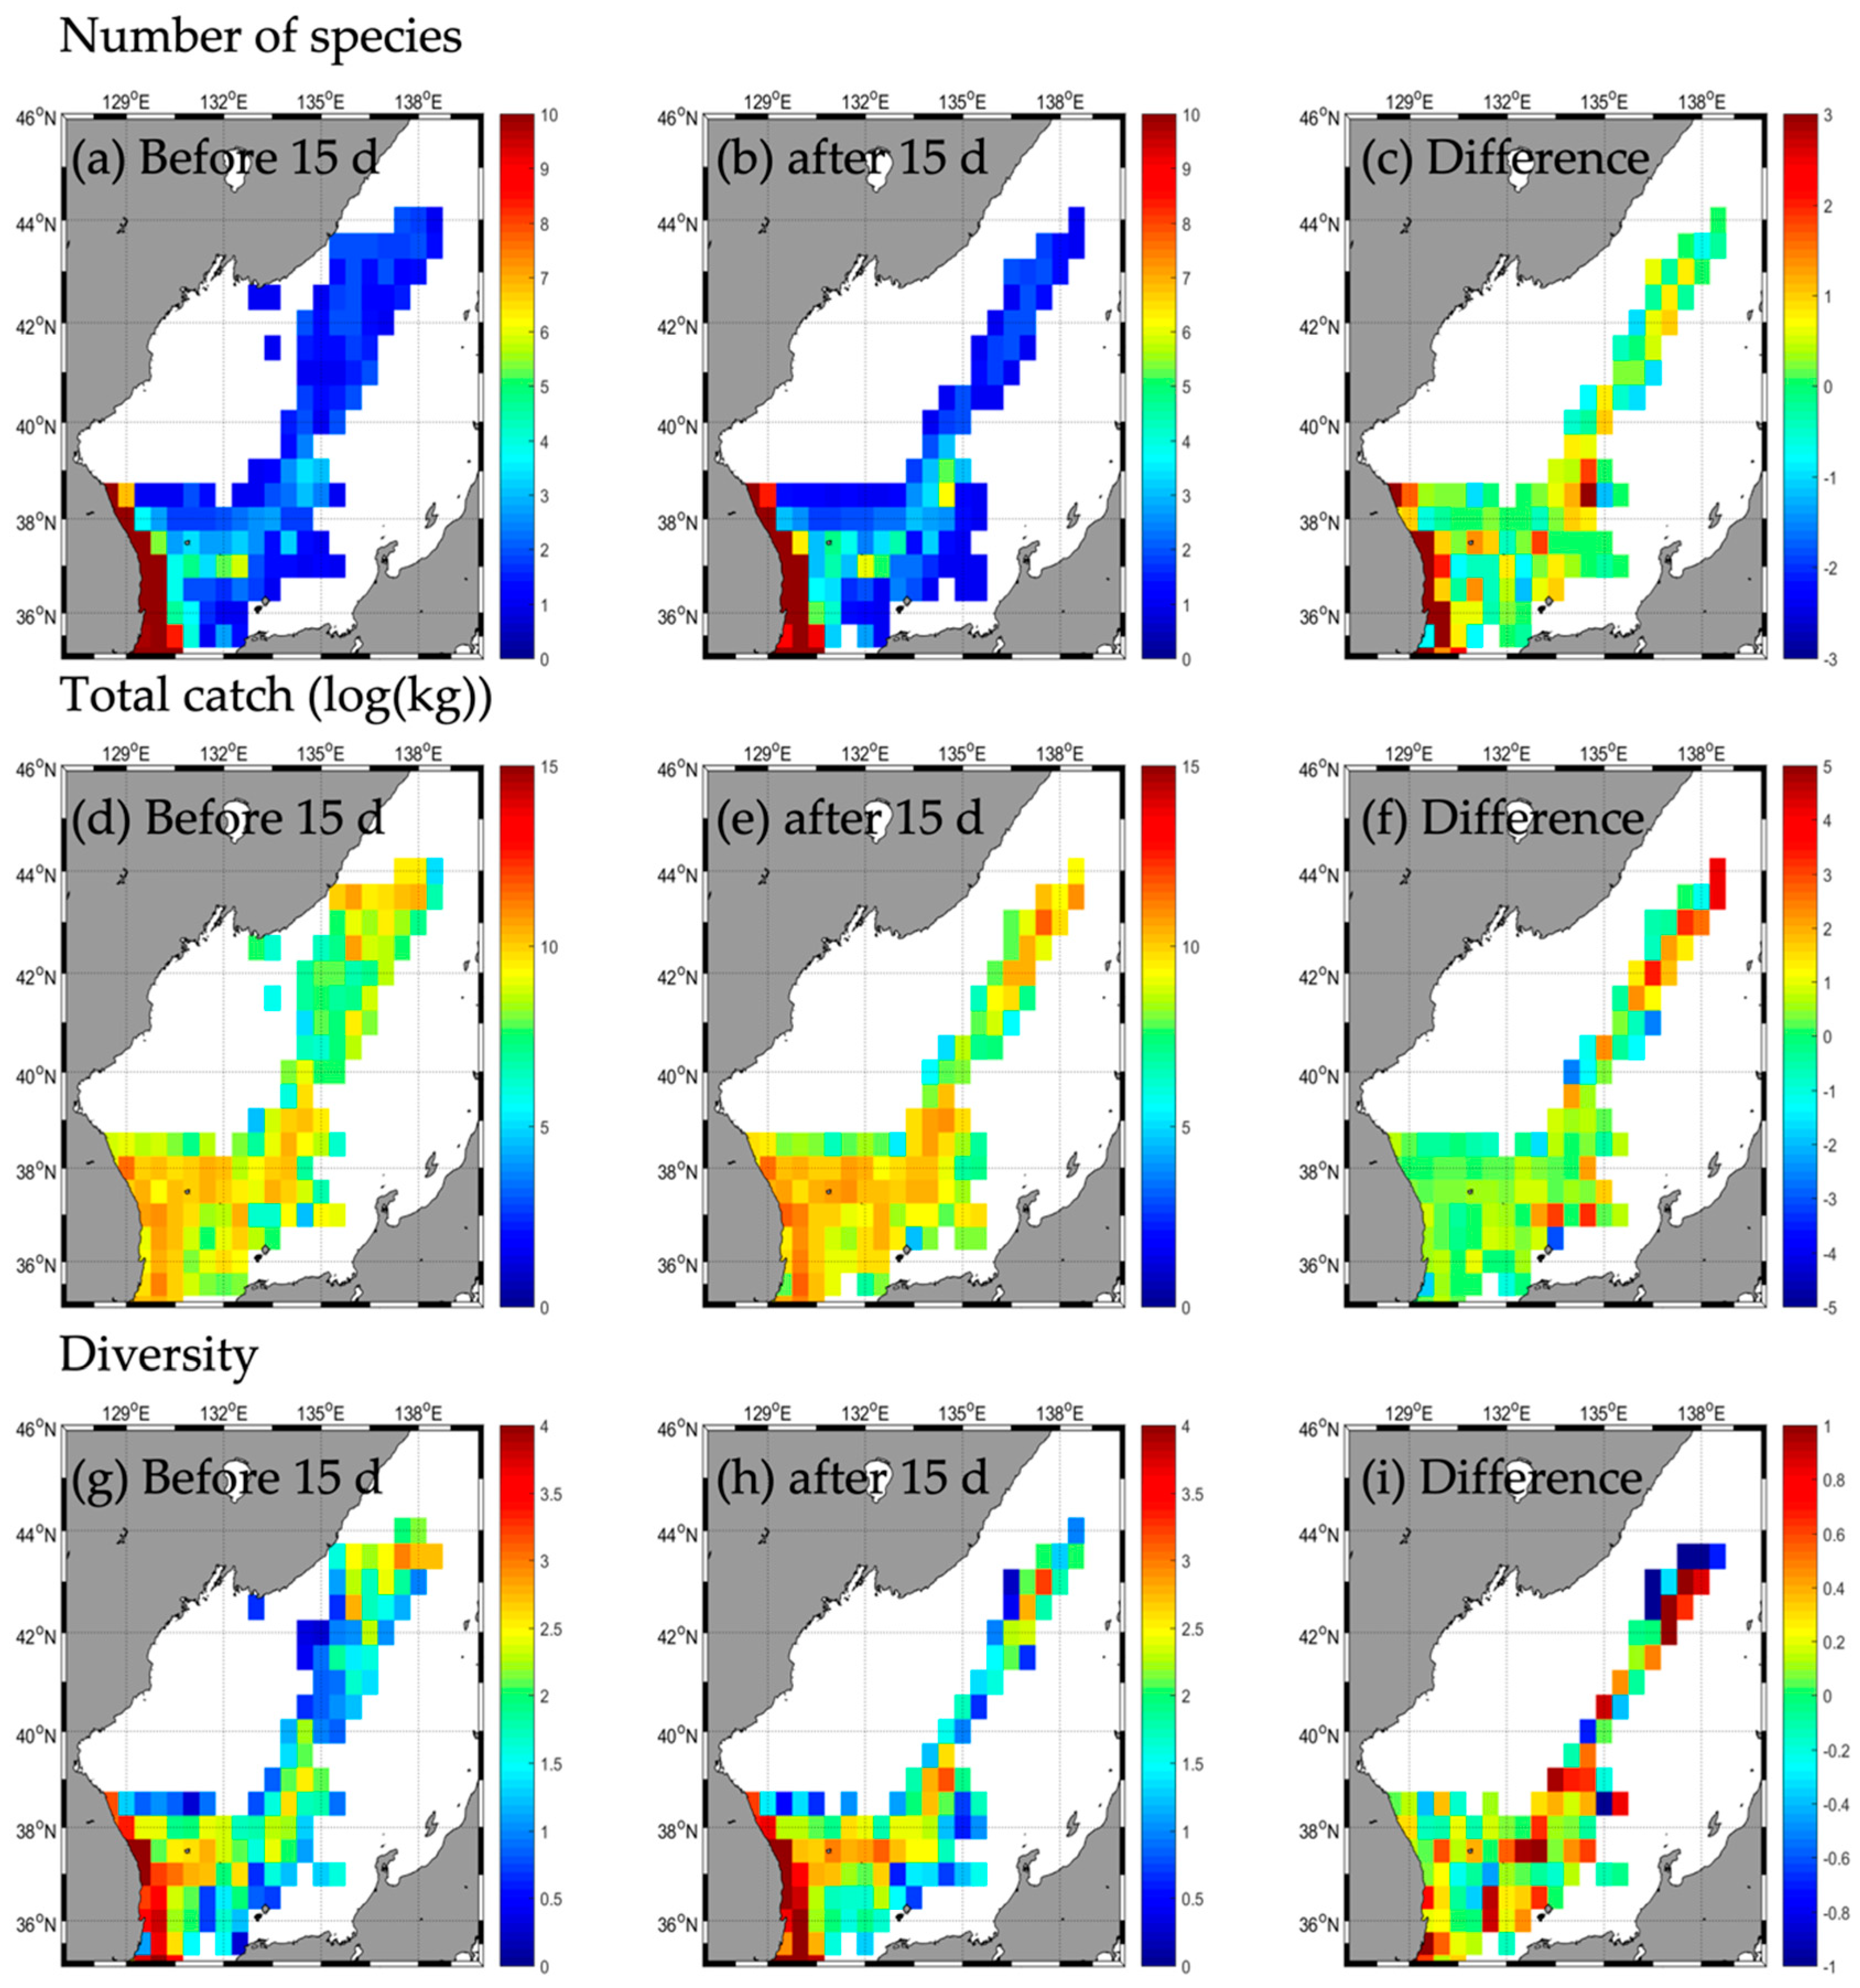
3.2.1. Type A
3.2.2. Type B
3.2.3. Type C
3.2.4. Type D
4. Discussion
5. Conclusions
Author Contributions
Funding
Institutional Review Board Statement
Informed Consent Statement
Data Availability Statement
Acknowledgments
Conflicts of Interest
Appendix A


| Type | Number | Name | Grade | Size | Occurrence | Enter | Dissipate |
|---|---|---|---|---|---|---|---|
| A | 1825 | KONGREY | 5 | M | September 2018 | 6 October 2018 | 7 October 2018 |
| B | 1324 | DANAS | 4 | M | 4 October 2013 | 9 October 2013 | 9 October 2013 |
| C | 1411 | HALONG | 5 | M | 29 July 2014 | 10 August 2014 | 15 August 2014 |
| D | 2010 | HAISHEN | 4 | L | 1 September 2020 | 7 September 2020 | 7 September 2020 |
| Type A | Type B | Type C | Type D | |||||||||||||||||||||||||||||||||||||
|---|---|---|---|---|---|---|---|---|---|---|---|---|---|---|---|---|---|---|---|---|---|---|---|---|---|---|---|---|---|---|---|---|---|---|---|---|---|---|---|---|
| SW | SE | NW | NE | Total | SW | SE | NW | NE | Total | SW | SE | NW | NE | Total | SW | SE | NW | NE | Total | |||||||||||||||||||||
| b | a | b | a | b | a | b | a | b | a | b | a | b | a | b | a | b | a | b | a | b | a | b | a | b | a | b | a | b | a | b | a | b | a | b | a | b | a | b | a | |
| Aptocyclus ventricosus | 38 | 194 | - | - | - | - | - | - | 38 | 194 | - | - | - | - | - | - | - | - | - | - | - | - | - | - | - | - | - | - | - | - | - | 17 | - | - | - | - | - | - | - | 17 |
| Arctoscopus japonicus | 452 | 3059 | - | - | - | - | - | - | 452 | 3059 | 383 | 467 | - | - | - | - | - | - | 383 | 467 | 213 | 80 | - | - | - | - | - | - | 213 | 80 | 3212 | 1440 | - | - | - | - | - | - | 3212 | 1440 |
| Batoidea | 33 | 20 | 200 | 125 | - | - | - | - | 233 | 145 | 50 | - | 100 | 300 | - | - | - | - | 150 | 300 | 30 | - | 100 | 100 | - | - | - | - | 130 | 100 | 59 | 55 | - | 238 | - | - | - | - | 59 | 293 |
| Chelidonichthys spinosus | 19 | 33 | - | - | - | - | - | - | 19 | 33 | - | 15 | - | - | - | - | - | - | - | 15 | - | - | - | - | - | - | - | - | - | - | 94 | 126 | - | - | - | - | - | - | 94 | 126 |
| Chionoecetes japonicus | 30,002 | 50,289 | 20,809 | 30,143 | - | - | - | - | 50,812 | 80,432 | 107,088 | 116,400 | 4000 | - | - | - | - | - | 111,088 | 116,400 | 545 | 741 | - | - | - | - | - | - | 545 | 741 | 1248 | 20,924 | - | 26,383 | - | - | - | - | 1248 | 47,306 |
| Clupea pallasii | 5956 | 2752 | - | - | - | - | - | - | 5956 | 2752 | 16 | 600 | - | - | - | - | - | - | 16 | 600 | 158 | 101 | - | - | - | - | - | - | 158 | 101 | 4154 | 5663 | - | - | - | - | - | - | 4154 | 5663 |
| Cololabis saira | - | 30 | - | - | - | - | - | - | - | 30 | 12 | - | - | - | - | - | - | - | 12 | - | - | 5 | - | - | - | - | - | - | - | 5 | - | - | - | - | - | - | - | - | - | - |
| Conger myriaster | 1217 | 1752 | - | - | - | - | - | - | 1217 | 1752 | 952 | 1502 | - | - | - | - | - | - | 952 | 1502 | 1579 | 1567 | - | - | - | - | - | - | 1579 | 1567 | 887 | 1642 | - | - | - | - | - | - | 887 | 1642 |
| Cottidae | 23 | 12 | - | - | - | - | - | - | 23 | 12 | - | - | - | - | - | - | - | - | - | - | - | - | - | - | - | - | - | - | - | - | 149 | 109 | - | - | - | - | - | - | 149 | 109 |
| Doederleinia berycoides | 590 | 514 | - | - | - | - | - | - | 590 | 514 | 200 | 175 | - | - | - | - | - | - | 200 | 175 | 548 | 183 | - | - | - | - | - | - | 548 | 183 | 467 | 571 | - | - | - | - | - | - | 467 | 571 |
| Engraulis japonicus | 6430 | 8404 | - | - | - | - | - | - | 6430 | 8404 | 8883 | 6740 | - | - | - | - | - | - | 8883 | 6740 | 2621 | 6233 | - | - | - | - | - | - | 2621 | 6233 | 8640 | 14,400 | - | - | - | - | - | - | 8640 | 14,400 |
| Gadus macrocephalus | 4580 | 3284 | - | - | - | - | - | - | 4580 | 3284 | 694 | 443 | - | - | - | - | - | - | 694 | 443 | 235 | 177 | - | - | - | - | - | - | 235 | 177 | 1114 | 2562 | - | - | - | - | - | - | 1114 | 2562 |
| Gymnothorax kidako | 295 | 324 | - | - | - | - | - | - | 295 | 324 | 154 | 110 | - | - | - | - | - | - | 154 | 110 | 26 | 126 | - | - | - | - | - | - | 26 | 126 | 87 | 225 | - | - | - | - | - | - | 87 | 225 |
| Hemitripterus villosus | 51 | 101 | - | - | - | - | - | - | 51 | 101 | - | - | - | - | - | - | - | - | - | - | - | - | - | - | - | - | - | - | - | - | 59 | 85 | - | - | - | - | - | - | 59 | 85 |
| Hexagrammos agrammus | 12 | 25 | - | - | - | - | - | - | 12 | 25 | 16 | 14 | - | - | - | - | - | - | 16 | 14 | 11 | 6 | - | - | - | - | - | - | 11 | 6 | 91 | 301 | - | - | - | - | - | - | 91 | 301 |
| Hexagrammos otakii | 34 | 7 | - | - | - | - | - | - | 34 | 7 | - | - | - | - | - | - | - | - | - | - | - | - | - | - | - | - | - | - | - | - | - | - | - | - | - | - | - | - | - | - |
| Konosirus punctatus | 198 | 343 | - | - | - | - | - | - | 198 | 343 | 2237 | 3632 | - | - | - | - | - | - | 2237 | 3632 | 3780 | 1758 | - | - | - | - | - | - | 3780 | 1758 | - | - | - | - | - | - | - | - | - | - |
| Labridae | 10 | 3 | - | - | - | - | - | - | 10 | 3 | 9 | - | - | - | - | - | - | - | 9 | - | - | - | - | - | - | - | - | - | - | - | 30 | - | - | - | - | - | - | - | 30 | - |
| Lateolabrax japonicus | 27 | 53 | - | - | - | - | - | - | 27 | 53 | - | - | - | - | - | - | - | - | - | - | 23 | 23 | - | - | - | - | - | - | 23 | 23 | - | - | - | - | - | - | - | - | - | - |
| Liparis tessellatus | 52 | 78 | - | - | - | - | - | - | 52 | 78 | 187 | 58 | - | - | - | - | - | - | 187 | 58 | - | - | - | - | - | - | - | - | - | - | - | - | - | - | - | - | - | - | - | - |
| Lophiomus setigerus | 4419 | 4118 | - | - | - | - | - | - | 4419 | 4118 | 804 | 446 | - | - | - | - | - | - | 804 | 446 | 2364 | 925 | - | - | - | - | - | - | 2364 | 925 | 2082 | 3400 | - | - | - | - | - | - | 2082 | 3400 |
| Miichthys miiuy | - | 7 | - | - | - | - | - | - | - | 7 | - | - | - | - | - | - | - | - | - | - | - | - | - | - | - | - | - | - | - | - | - | - | - | - | - | - | - | - | - | - |
| Mugil cephalus | 52 | 73 | - | - | - | - | - | - | 52 | 73 | - | - | - | - | - | - | - | - | - | - | 29 | - | - | - | - | - | - | - | 29 | - | 16 | 28 | - | - | - | - | - | - | 16 | 28 |
| Okamejei kenojei | - | 6 | - | - | - | - | - | - | - | 6 | - | - | - | - | - | - | - | - | - | - | - | - | - | - | - | - | - | - | - | - | - | 18 | - | - | - | - | - | - | - | 18 |
| Oncorhynchus keta | 113 | 209 | - | - | - | - | - | - | 113 | 209 | - | - | - | - | - | - | - | - | - | - | - | - | - | - | - | - | - | - | - | - | - | - | - | - | - | - | - | - | - | - |
| Pampus argenteus | 5 | 71 | - | - | - | - | - | - | 5 | 71 | - | - | - | - | - | - | - | - | - | - | - | - | - | - | - | - | - | - | - | - | - | - | - | - | - | - | - | - | - | - |
| Paralichthys olivaceus | 310 | 353 | - | - | - | - | - | - | 310 | 353 | 54 | 92 | - | - | - | - | - | - | 54 | 92 | 94 | 100 | - | - | - | - | - | - | 94 | 100 | 30 | 71 | - | - | - | - | - | - | 30 | 71 |
| Pennahia argentata | - | 19 | - | - | - | - | - | - | - | 19 | - | - | - | - | - | - | - | - | - | - | - | - | - | - | - | - | - | - | - | - | - | - | - | - | - | - | - | - | - | - |
| Pleurogrammus azonus | 52 | 150 | - | - | - | - | - | - | 52 | 150 | 81 | 24 | - | - | - | - | - | - | 81 | 24 | 50 | 3 | - | - | - | - | - | - | 50 | 3 | - | 20 | - | - | - | - | - | - | - | 20 |
| Pleuronectiformes | 10,184 | 21,674 | - | 75 | - | - | - | - | 10,184 | 21,749 | 8012 | 7852 | 75 | - | - | - | - | - | 8087 | 7852 | 5855 | 6953 | 50 | 83 | - | - | - | - | 5905 | 7036 | 15,743 | 29,055 | - | 50 | - | - | - | - | 15,743 | 29,105 |
| Pleuronichthys cornutus | 41 | 49 | - | - | - | - | - | - | 41 | 49 | 51 | 124 | - | - | - | - | - | - | 51 | 124 | 96 | 53 | - | - | - | - | - | - | 96 | 53 | - | - | - | - | - | - | - | - | - | - |
| Sardinops sagax | - | 8520 | - | - | - | - | - | - | - | 8520 | - | - | - | - | - | - | - | - | - | - | - | 30 | - | - | - | - | - | - | - | 30 | - | - | - | - | - | - | - | - | - | - |
| Saurida undosquamis | - | - | - | - | - | - | - | - | - | - | - | 150 | - | - | - | - | - | - | - | 150 | 20 | - | - | - | - | - | - | - | 20 | - | 130 | - | - | - | - | - | - | - | 130 | - |
| Scomber japonicus | 360 | 101 | - | - | - | - | - | - | 360 | 101 | 125 | - | - | - | - | - | - | - | 125 | - | - | - | - | - | - | - | - | - | - | - | 121 | 179 | - | - | - | - | - | - | 121 | 179 |
| Scomberomorus niphonius | 616 | 1307 | - | - | - | - | - | - | 616 | 1307 | 281 | 115 | - | - | - | - | - | - | 281 | 115 | 58 | 62 | - | - | - | - | - | - | 58 | 62 | 301 | 656 | - | - | - | - | - | - | 301 | 656 |
| Scombrops boops | 1 | 10 | - | - | - | - | - | - | 1 | 10 | - | - | - | - | - | - | - | - | - | - | - | - | - | - | - | - | - | - | - | - | - | 4 | - | - | - | - | - | - | - | 4 |
| Scorpaenidae | 79 | 71 | - | - | - | - | - | - | 79 | 71 | 70 | 50 | - | - | - | - | - | - | 70 | 50 | 20 | 44 | - | - | - | - | - | - | 20 | 44 | 37 | 119 | - | - | - | - | - | - | 37 | 119 |
| Sebastiscus marmoratus | 19 | 21 | - | - | - | - | - | - | 19 | 21 | - | - | - | - | - | - | - | - | - | - | 40 | - | - | - | - | - | - | - | 40 | - | - | - | - | - | - | - | - | - | - | - |
| Seriola dumerili | - | - | - | - | - | - | - | - | - | - | 50 | 50 | - | - | - | - | - | - | 50 | 50 | 37 | 75 | - | - | - | - | - | - | 37 | 75 | - | - | - | - | - | - | - | - | - | - |
| Seriola lalandi | 35 | 31 | - | - | - | - | - | - | 35 | 31 | - | - | - | - | - | - | - | - | - | - | 28 | 30 | - | - | - | - | - | - | 28 | 30 | - | - | - | - | - | - | - | - | - | - |
| Seriola quinqueradiata | 4399 | 1474 | - | - | - | - | - | - | 4399 | 1474 | 228 | 30 | - | - | - | - | - | - | 228 | 30 | 43 | 50 | - | - | - | - | - | - | 43 | 50 | 208 | 309 | - | - | - | - | - | - | 208 | 309 |
| Sillago sihama | - | 8 | - | - | - | - | - | - | - | 8 | - | - | - | - | - | - | - | - | - | - | - | - | - | - | - | - | - | - | - | - | - | - | - | - | - | - | - | - | - | - |
| Sparidae | 113 | 161 | 10 | - | - | - | - | - | 123 | 161 | 31 | 93 | - | - | - | - | - | - | 31 | 93 | 49 | 21 | - | - | - | - | - | - | 49 | 21 | 7 | 58 | - | - | - | - | - | - | 7 | 58 |
| Stephanolepis cirrhifer | 66 | 227 | - | - | - | - | - | - | 66 | 227 | 112 | 29 | - | - | - | - | - | - | 112 | 29 | 8 | 22 | - | - | - | - | - | - | 8 | 22 | 43 | 416 | - | - | - | - | - | - | 43 | 416 |
| Stichaeus grigorjewi | 6 | 9 | - | - | - | - | - | - | 6 | 9 | - | 70 | - | - | - | - | - | - | - | 70 | - | - | - | - | - | - | - | - | - | - | - | 3 | - | - | - | - | - | - | - | 3 |
| Tanakas snailfish | 231 | 185 | - | - | - | - | - | - | 231 | 185 | 82 | 336 | - | - | - | - | - | - | 82 | 336 | 47 | 30 | - | - | - | - | - | - | 47 | 30 | 110 | 438 | - | - | - | - | - | - | 110 | 438 |
| Tetraodontidae | 184 | 414 | - | 3775 | - | - | 453 | 455 | 637 | 4644 | 105 | 1204 | - | 1375 | - | - | 491 | - | 596 | 2579 | 15 | - | - | - | - | - | - | 115 | 15 | 115 | 271 | 90 | - | - | - | - | - | - | 271 | 90 |
| Gadus chalcogramma | 1 | 5 | - | - | - | - | - | - | 1 | 5 | - | - | - | - | - | - | - | - | - | - | - | - | - | - | - | - | - | - | - | - | - | - | - | - | - | - | - | - | - | - |
| Thunnini | - | 60 | - | - | - | - | - | - | - | 60 | - | - | - | - | - | - | - | - | - | - | - | 100 | - | - | - | - | - | - | - | 100 | 1620 | 170 | - | - | - | - | - | - | 1620 | 170 |
| Todarodes pacificus | 12,759 | 82,825 | 3194 | 3237 | - | - | 41,271 | 37,157 | 57,225 | 123,219 | 52,003 | 71,964 | 4099 | - | - | - | 21,496 | - | 77,598 | 71,964 | 14,268 | 5870 | 671 | 737 | - | - | 17,316 | 66,382 | 32,255 | 72,989 | 4987 | 30,694 | 1457 | 2489 | - | - | - | - | 6444 | 33,183 |
| Trachurus japonicus | 124 | 428 | - | - | - | - | - | - | 124 | 428 | 375 | 3500 | - | - | - | - | - | - | 375 | 3500 | - | 10 | - | - | - | - | - | - | - | 10 | 128 | 460 | - | - | - | - | - | - | 128 | 460 |
| Tribolodon hakonensis | 5 | - | - | - | - | - | - | - | 5 | - | - | - | - | - | - | - | - | - | - | - | - | - | - | - | - | - | - | - | - | - | 20 | 20 | - | - | - | - | - | - | 20 | 20 |
| Trichiurus lepturus | 49 | 282 | - | - | - | - | - | - | 49 | 282 | - | - | - | - | - | - | - | - | - | - | - | - | - | - | - | - | - | - | - | - | - | - | - | - | - | - | - | - | - | - |
| Zeus faber | - | 55 | - | - | - | - | - | - | - | 55 | - | - | - | - | - | - | - | - | - | - | - | - | - | - | - | - | - | - | - | - | 3 | - | - | - | - | - | - | - | 3 | - |
| Others | 1022 | 1227 | - | - | - | - | - | - | 1022 | 1227 | 1788 | 1630 | - | - | - | - | - | - | 1788 | 1630 | 104 | 367 | - | - | - | - | - | - | 104 | 367 | 2296 | 3112 | - | - | - | - | - | - | 2296 | 3112 |
| Total | 85,264 | 195,427 | 24,213 | 37,355 | - | - | 41,724 | 37,612 | 151,203 | 270,394 | 185,133 | 217,915 | 8274 | 1675 | - | - | 21,987 | - | 215,394 | 219,590 | 32,994 | 25,745 | 821 | 920 | - | - | 17,316 | 66,497 | 51,131 | 93,162 | 48,444 | 117,440 | 1457 | 29,160 | - | - | - | - | 49,901 | 146,599 |
| Fish Species | Habitat | Fishing Gear |
|---|---|---|
| Flatfish | Demersal | Gill net |
| Red snow crab | Demersal | Gill net, trap fishing |
| Cod | Demersal | Gill net |
| Monkfish | Demersal | Gill net |
| Pollock | Demersal | Gill net |
| Squid | Pelagic | Gill net |
| Herring | Pelagic | Gill net, jigging |
| Mackerel | Pelagic | Gill net |
| Pacific saury | Pelagic | Gill net |
| Japanese Spanish markerel | Pelagic | Gill net |
References
- Ferland, J.; Gosselin, M.; Starr, M. Environmental control of summer primary production in the Hudson Bay system: The role of stratification. J. Mar. Syst. 2011, 88, 385–400. [Google Scholar] [CrossRef]
- Hsieh, H.Y.; Lo, W.T.; Chen, H.H.; Meng, P.J. Larval fish assemblages and hydrographic characteristics in the coastal waters of southwestern Taiwan during non-and post-typhoon summers. Zool. Stud. 2016, 55, e18. [Google Scholar] [PubMed]
- Menkes, C.E.; Lengaigne, M.; Lévy, M.; Éthé, C.; Bopp, L.; Aumont, O.; Jullien, S. Global impact of tropical cyclones on primary production. Glob. Biogeochem. Cycles 2016, 30, 767–786. [Google Scholar] [CrossRef]
- Tsuchiya, K.; Kuwahara, V.S.; Yoshiki, T.; Nakajima, R.; Miyaguchi, H.; Kumekawa, N.; Toda, T. Phytoplankton community response and succession in relation to typhoon passages in the coastal waters of Japan. J. Plankton Res. 2014, 36, 424–438. [Google Scholar] [CrossRef]
- Zhang, H.; He, H.; Zhang, W.Z.; Tian, D. Upper ocean response to tropical cyclones: A review. Geosci. Lett. 2021, 8, 1. [Google Scholar] [CrossRef]
- Zhao, H.; Tang, D.; Wang, Y. Comparison of phytoplankton blooms triggered by two typhoons with different intensities and translation speeds in the South China Sea. Mar. Ecol. Prog. Ser. 2008, 365, 57–65. [Google Scholar] [CrossRef]
- Hong, C.H.; Masuda, A. Temperature Variations in the Mixed Layer with the Passage of Typhoons Using One-Dimensional Numerical Model. Korean J. Fish. Aquat. Sci. 2018, 51, 107–112. [Google Scholar]
- Jeong, Y.Y.; Moon, I.J.; Kim, S.H. A study on upper ocean response to typhoon Ewiniar (0603) and its impact. Atmosphere 2013, 23, 205–220. [Google Scholar] [CrossRef]
- Moon, I.J.; Kwon, S.J. Impact of upper-ocean thermal structure on the intensity of Korean peninsula landfall typhoons. Prog. Oceanogr. 2012, 105, 61–66. [Google Scholar] [CrossRef]
- Price, J.F. Metrics of hurricane-ocean interaction: Vertically-integrated or vertically-averaged ocean temperature? Ocean. Sci. 2009, 5, 351–368. [Google Scholar] [CrossRef]
- Price, J.F. Upper ocean response to a hurricane. J. Phys. Oceanogr. 1981, 11, 153–175. [Google Scholar] [CrossRef]
- Hong, C.H.; Yoon, J.H. A three dimensional numerical simulation of Typhoon Holly in the northwestern Pacific Ocean. J. Geophys. Res. Ocean. 2003, 108, 3282. [Google Scholar] [CrossRef]
- Lee, J.H.; Moon, J.H.; Kim, T. Typhoon-triggered phytoplankton bloom and associated upper-ocean conditions in the northwestern Pacific: Evidence from satellite remote sensing, Argo profile, and an ocean circulation model. J. Mar. Sci. Eng. 2020, 8, 788. [Google Scholar] [CrossRef]
- Lin, I.I.; Wu, C.C.; Pun, I.F.; Ko, D.S. Upper-ocean thermal structure and the western North Pacific category 5 typhoons. Part I: Ocean features and the category 5 typhoons’ intensification. Mon. Weather. Rev. 2008, 136, 3288–3306. [Google Scholar]
- Nam, S.H.; Yun, J.Y.; Kim, K. Observations on the coastal ocean response to typhoon MAEMI at the East Sea Real-time Ocean Buoy. Sea J. Korean Soc. Oceanogr. 2004, 9, 111–118. [Google Scholar]
- Shay, L.K.; Black, P.G.; Mariano, A.J.; Hawkins, J.D.; Elsberry, R.L. Upper ocean response to Hurricane Gilbert. J. Geophys. Res. Ocean. 1992, 97, 20227–20248. [Google Scholar] [CrossRef]
- Lee, C.I.; Park, M.O. Time series changes in sea-surface temperature, chlorophyll a, nutrients, and sea-wind in the East/Japan Sea on the left-and right-hand sides of Typhoon Shanshan’s track. Ocean. Sci. J. 2010, 45, 253–265. [Google Scholar] [CrossRef]
- Liu, Y.; Tang, D.; Tang, S.; Morozov, E.; Liang, W.; Sui, Y. A case study of Chlorophyll a response to tropical cyclone Wind Pump considering Kuroshio invasion and air-sea heat exchange. Sci. Total Environ. 2020, 741, 140290. [Google Scholar] [CrossRef]
- Son, S.; Platt, T.; Bouman, H.; Lee, D.; Sathyendranath, S. Satellite observation of chlorophyll and nutrients increase induced by Typhoon Megi in the Japan/East Sea. Geophys. Res. Lett. 2006, 33, L05607. [Google Scholar] [CrossRef]
- Zhao, H.; Shao, J.; Han, G.; Yang, D.; Lv, J. Influence of typhoon matsa on phytoplankton chlorophyll-a off East China. PLoS ONE 2015, 10, e0137863. [Google Scholar] [CrossRef]
- Zheng, G.M.; Tang, D. Offshore and nearshore chlorophyll increases induced by typhoon winds and subsequent terrestrial rainwater runoff. Mar. Ecol. Prog. Ser. 2007, 333, 61–74. [Google Scholar] [CrossRef]
- Chang, Y.; Chan, J.W.; Huang, Y.C.A.; Lin, W.Q.; Lee, M.A.; Lee, K.T.; Kuo, Y.C. Typhoon-enhanced upwelling and its influence on fishing activities in the southern East China Sea. Int. J. Remote Sens. 2014, 35, 6561–6572. [Google Scholar] [CrossRef]
- Houde, E.D.; Bichy, J.; Jung, S. Effects of hurricane Isabel on fish populations and communities in Chesapeake Bay. Hurrican Isabel Perspect. Proc. A Conf. 2005, 5, 193–199. [Google Scholar]
- Yagi, M. Short-term change in fish assemblages after the passage of a typhoon in a temperate, coastal bay. Acta Ichthyol. Piscat. 2021, 51, 175–183. [Google Scholar] [CrossRef]
- Yu, J.; Tang, D.; Chen, G.; Li, Y.; Huang, Z.; Wang, S. The positive effects of typhoons on the fish CPUE in the South China Sea. Cont. Shelf Res. 2014, 84, 1–12. [Google Scholar] [CrossRef]
- Yu, J.; Tang, D.; Li, Y.; Huang, Z.; Chen, G. Increase in fish abundance during two typhoons in the South China Sea. Adv. Space Res. 2013, 51, 1734–1749. [Google Scholar] [CrossRef]
- Kim, S.W.; Lim, J.W.; Lee, Y.; Yamada, K. Response of water temperature in Korean Waters caused by the passage of Typhoons. J. Korean Soc. Mar. Environ. Saf. 2016, 22, 508–520. [Google Scholar] [CrossRef]
- Park, M.H.; Lee, J.S.; Suh, Y.S.; Kim, H.D.; Bae, H.K. Characteristics of Variation of Sea Surface Temperature in the East Sea with the Passage of Typhoons. J. Environ. Sci. Int. 2015, 24, 1657–1671. [Google Scholar] [CrossRef]
- Suh, Y.S.; Kim, D.S.; Kim, B.K.; Lee, D.I.; Kim, Y.S.; Kim, I.K. Temporal and spatial variation of SST related to the path of typhoons around the Korean waters in summer. J. Environ. Sci. 2002, 11, 627–636. [Google Scholar]
- Park, K.A.; Chung, J.Y.; Kim, K. Sea surface temperature fronts in the East (Japan) Sea and temporal variations. Geophys. Res. Lett. 2004, 31, L07304. [Google Scholar] [CrossRef]
- Park, K.A.; Ullman, D.S.; Kim, K.; Chung, J.Y.; Kim, K.R. Spatial and temporal variability of satellite-observed subpolar front in the East/Japan Sea. Deep. Sea Res. Part I Oceanogr. Res. Pap. 2007, 54, 453–470. [Google Scholar] [CrossRef]
- Park, J.E.; Kim, S.Y.; Choi, B.J.; Byun, D.S. Estimation of mean surface current and current variability in the East Sea using surface drifter data from 1991 to 2017. Sea J. Korean Soc. Oceanogr. 2019, 24, 208–225. [Google Scholar]
- Park, K.; Park, J.E.; Choi, B.J.; Byun, D.S.; Lee, E.I. An oceanic current map of the East Sea for science textbooks based on scientific knowledge acquired from oceanic measurements. Sea J. Korean Soc. Oceanogr. 2013, 18, 234–265. [Google Scholar]
- Hyun, J.H.; Kim, D.; Shin, C.W.; Noh, J.H.; Yang, E.J.; Mok, J.S.; Yoo, S. Enhanced phytoplankton and bacterioplankton production coupled to coastal upwelling and an anticyclonic eddy in the Ulleung Basin, East Sea. Aquat. Microb. Ecol. 2009, 54, 45–54. [Google Scholar] [CrossRef]
- Shin, H.R.; Shin, C.W.; Kim, C.; Byun, C.K.; Hwang, S.C. Movement and structural variation of warm eddy WE92 for three years in the Western East/Japan Sea. Deep Sea Res. II 2005, 52, 1742–1762. [Google Scholar] [CrossRef]
- Joo, H.; Son, S.; Park, J.W.; Kang, J.J.; Jeong, J.Y.; Lee, C.I.; Lee, S.H. Long-term pattern of primary productivity in the East/Japan Sea based on ocean color data derived from MODIS-aqua. Remote Sens. 2015, 8, 25. [Google Scholar] [CrossRef]
- Kim, D.; Yang, E.J.; Kim, K.H.; Shin, C.W.; Park, J.; Yoo, S.; Hyun, J.H. Impact of an anticyclonic eddy on the summer nutrient and chlorophyll a distributions in the Ulleung Basin, East Sea (Japan Sea). ICES J. Mar. Sci. 2012, 69, 23–29. [Google Scholar] [CrossRef]
- Kim, S.W.; Saitoh, S.I.; Ishizaka, J.; Isoda, Y.; Kishino, M. Temporal and spatial variability of phytoplankton pigment concentrations in the Japan Sea derived from CZCS images. J. Oceanogr. 2000, 56, 527–538. [Google Scholar] [CrossRef]
- Lim, J.H.; Son, S.; Park, J.W.; Kwak, J.H.; Kang, C.K.; Son, Y.B.; Kwon, J.N.; Lee, S.H. Enhanced biological activity by an anticyclonic warm eddy during early spring in the East Sea (Japan Sea) detected by the geostationary ocean color satellite. Ocean. Sci. J. 2012, 47, 377–385. [Google Scholar] [CrossRef]
- Shibano, R.; Yamanaka, Y.; Okada, N.; Chuda, T.; Suzuki, S.I.; Niino, H.; Toratani, M. Responses of marine ecosystem to typhoon passages in the western subtropical North Pacific. Geophys. Res. Lett. 2011, 38, L18608. [Google Scholar] [CrossRef]
- Senjyu, T.; Watanabe, T. A sudden temperature decrease along the Sanin coast induced by a typhoon. Umi Sora 1999, 75, 1–8. [Google Scholar]
- Chang, Y.; Liao, H.T.; Lee, M.A.; Chan, J.W.; Shieh, W.J.; Lee, K.T.; Lan, Y.C. Multisatellite observation on upwelling after the passage of Typhoon HaiTang in the southern East China Sea. Geophys. Res. Lett. 2008, 35, L03612. [Google Scholar] [CrossRef]
- Hahm, D.; Rhee, T.S.; Kim, H.C.; Jang, C.J.; Kim, Y.S.; Park, J.H. An observation of primary production enhanced by coastal upwelling in the southwest East/Japan Sea. J. Mar. Syst. 2019, 195, 30–37. [Google Scholar] [CrossRef]
- Mei, W.; Xie, S.P.; Primeau, F.; McWilliams, J.C.; Pasquero, C. Northwestern Pacific typhoon intensity controlled by changes in ocean temperatures. Sci. Adv. 2015, 1, e1500014. [Google Scholar] [CrossRef]
- Seol, D.I. Global warming and trends of typhoon variation. J. Navig. Port Res. 2010, 34, 453–458. [Google Scholar] [CrossRef]
- Donlon, C.J.; Martin, M.; Stark, J.; Roberts-Jones, J.; Fiedler, E.; Wimmer, W. The operational sea surface temperature and sea ice analysis (OSTIA) system. Remote Sens. Environ. 2012, 116, 140–158. [Google Scholar] [CrossRef]
- Pickett, M.H.; Paduan, J.D. Ekman transport and pumping in the California Current based on the US Navy’s high-resolution atmospheric model (COAMPS). J. Geophys. Res. Ocean. 2003, 108, 3327. [Google Scholar] [CrossRef]
- Smith, R.L. Upwelling. In Oceanography and Marine Biology An Annual Review; Taylor & Francis: Abingdon, UK, 1968; Volume 6, pp. 11–46. [Google Scholar]
- Hersbach, H.; Bell, B.; Berrisford, P.; Hirahara, S.; Horányi, A.; Muñoz-Sabater, J.; Thépaut, J.N. The ERA5 global reanalysis. Q. J. R. Meteorol. Soc. 2020, 146, 1999–2049. [Google Scholar] [CrossRef]
- Menemenlis, D.; Campin, J.; Heimbach, P.; Hill, C.; Lee, T.; Nguyen, A.; Schodlock, M.; Zhang, H. ECCO2: High resolution global ocean and sea ice data synthesis. Mercator Ocean. Q. Newsl. 2008, 31, 13–21. [Google Scholar]
- Shannon, C.E.; Weaver, W. The Mathematical Theory of Communication; University of Illinois Press: Urbana, IL, USA, 1949; pp. 1–117. [Google Scholar]
- Tang, D.; Ye, H.J.; Sui, Y.; Afanasyev, Y.D.; Wang, S. Typhoon Impacts on Subsurface Marine Ecosystems. Adv. Nat. Technol. Hazards Res. 2014, 40, 219–240. [Google Scholar]
- Furey, H.H.; Bower, A.S. Synoptic temperature structure of the East China and southeastern Japan/East Seas. Deep-Sea Res. II Top. Stud. Oceanogr. 2005, 52, 1421–1442. [Google Scholar] [CrossRef]
- Lim, S.; Jang, C.J.; Park, J. Climatology of the mixed layer depth in the East/Japan Sea. J. Mar. Syst. 2012, 96, 1–14. [Google Scholar] [CrossRef]
- Yun, J.Y.; Magaard, L.; Kim, K.; Shin, C.W.; Kim, C.; Byun, S.K. Spatial and temporal variability of the North Korean Cold Water leading to the near-bottom cold water intrusion in Korea Strait. Prog. Oceanogr. 2004, 60, 99–131. [Google Scholar] [CrossRef]
- Hong, C.H.; Sohn, I.S. Sea surface cooling in the East Sea with the passage of typhoons. Korean J. Fish. Aquat. Sci. 2004, 37, 137–147. [Google Scholar]
- Kaufman, L.S. Effects of hurricane Allen on reef fish assemblages near Discovery Bay, Jamaica. Coral Reefs 1983, 2, 43–47. [Google Scholar] [CrossRef]
- Kim, S.; Kang, S. The status and research direction for fishery resources in the East Sea/Sea of Japan. J. Korean Soc. Fish. Res. 1998, 1, 44–58. [Google Scholar]
- Cury, P.; Roy, C. Optimal environmental window and pelagic fish recruitment success in upwelling areas. Can. J. Fish. Aquat. Sci. 1989, 46, 670–680. [Google Scholar] [CrossRef]
- Krebs, C.J. Ecological Methodology; Harper and Row Publishers: New York, NY, USA, 1989; p. 654. [Google Scholar]
- Peet, R.K. The measurement of species diversity. Annu. Rev. Ecol. Syst. 1974, 5, 285–307. [Google Scholar] [CrossRef]
- Pough, F.H.; Janis, C.M.; Heiser, J.B. Vertebrate Life, 8th ed.; Benjamin Cummings: San Francisco, CA, USA, 2009; p. 752. [Google Scholar]
- Kojima, S.; Ohta, S. Patterns of bottom environments and macrobenthos communities along the depth gradient in the bathyal zone off Sanriku, Northwestern Pacific. J. Oceanogr. 1989, 45, 95–105. [Google Scholar] [CrossRef]
- Smith Jr, K.L.; Kaufmann, R.S.; Baldwin, R.J.; Carlucci, A.F. Pelagic-benthic coupling in the abyssal eastern North Pacific: An 8-year time-series study of food supply and demand. Limnol. Oceanogr. 2001, 46, 543–556. [Google Scholar] [CrossRef]
- Gooday, A.J.; Pfannkuche, O.; Lambshead, P.J.D. An apparent lack of response by metazoan meiofauna to phytodetritus deposition in bathyal north-eastern Atlantic. J. Mar. Biol. Soc. UK 1996, 76, 297–310. [Google Scholar] [CrossRef]
- Berelson, W.M. Particle settling rates increase with depth in the ocean. Deep. Sea Res. Part II Top. Stud. Oceanogr. 2001, 49, 237–251. [Google Scholar] [CrossRef]
- Honda, M.C.; Sasai, Y.; Siswanto, E.; Kuwano-Yoshida, A.; Aiki, H.; Cronin, M.F. Impact of cyclonic eddies and typhoons on biogeochemistry in the oligotrophic ocean based on biogeochemical/physical/meteorological time-series at station KEO. Prog. Earth Planet. Sci. 2018, 5, 42. [Google Scholar] [CrossRef]
- Kim, M.; Hwang, J.; Rho, T.; Lee, T.; Kang, D.J.; Chang, K.I.; Kim, K.R. Biogeochemical properties of sinking particles in the southwestern part of the East Sea (Japan Sea). J. Mar. Syst. 2017, 167, 33–42. [Google Scholar] [CrossRef]
- Lassig, B.R. The effects of a cyclonic storm on coral reef fish assemblages. Environ. Biol. Fishes 1983, 9, 55–63. [Google Scholar] [CrossRef]
- Mackenzie, B.R. Turbulence, larval fish ecology and fisheries recruitment: A review of field studies. Oceanol. Acta 2000, 23, 357–375. [Google Scholar] [CrossRef]
- Odeh, M.; Noreika, J.F.; Haro, A.; Maynard, A.; Castro-Santos, T.; Cada, G.F. Evaluation of the Effects of Turbulence on the Behavior of Migratory Fish; Final Report 2002; Bonneville Power Administration: Portland, OR, USA, 2002; pp. 1–46.
- Chan, J.C.; Liu, K.S. Global warming and western North Pacific typhoon activity from an observational perspective. J. Clim. 2004, 17, 4590–4602. [Google Scholar] [CrossRef]
- Haghroosta, T.; Ismail, W.R. Typhoon activity and some important parameters in the South China Sea. Weather. Clim. Extrem. 2017, 17, 29–35. [Google Scholar] [CrossRef]


| Type A | Type B | Type C | Type D | ||||||||||||||
|---|---|---|---|---|---|---|---|---|---|---|---|---|---|---|---|---|---|
| SW | SE | NW | NE | SW | SE | NW | NE | SW | SE | NW | NE | SW | SE | NW | NE | ||
| EPV () | b | −0.41 | −0.01 | −0.05 | −0.04 | −0.43 | 0.01 | −0.27 | −0.25 | −0.08 | −0.26 | −0.15 | 0.12 | −0.03 | 0.03 | 0.15 | −0.20 |
| a | −0.16 | −0.08 | −0.25 | 0.07 | −0.47 | 0.19 | −0.37 | −0.12 | 0.13 | 0.05 | −0.04 | 0.29 | −0.04 | −0.22 | 0.17 | 0.46 | |
| d | 0.25 | −0.08 | −0.20 | 0.11 | −0.04 | 0.18 | −0.10 | 0.13 | 0.21 | 0.31 | 0.11 | 0.17 | −0.01 | −0.26 | 0.02 | 0.66 | |
| MLD (m) | b | 25.1 | 29.1 | 22.5 | 27.2 | 23.7 | 26.4 | 22.9 | 26.3 | 12.4 | 13.3 | 10.7 | 11.5 | 14.3 | 15.1 | 14.8 | 17.0 |
| a | 32.6 | 37.5 | 29.5 | 33.7 | 32.2 | 33.3 | 30.1 | 33.6 | 14.3 | 16.2 | 14.5 | 16.5 | 27 | 24.8 | 25.3 | 22.6 | |
| d | 7.5 | 8.4 | 7.0 | 6.5 | 8.5 | 6.9 | 7.3 | 7.3 | 1.9 | 3.1 | 3.8 | 5.0 | 12.7 | 9.7 | 10.5 | 5.6 | |
| SST (℃) | b | 19.7 | 20.4 | 17.1 | 16.5 | 19.5 | 21 | 15.2 | 15.5 | 22.0 | 23.3 | 19.8 | 19.3 | 22.5 | 24.6 | 18.9 | 19.4 |
| a | 17.5 | 18.6 | 14.7 | 14.5 | 17.8 | 19.2 | 12.7 | 13.1 | 21.0 | 22.1 | 19.4 | 18.1 | 18.8 | 22.8 | 15.5 | 18.3 | |
| d | −2.2 | −1.9 | −2.4 | −2.0 | −1.7 | −1.7 | −2.5 | −2.4 | −1.0 | −1.2 | −0.4 | −1.2 | −3.7 | −1.9 | −3.4 | −1.2 | |
| Chl−a (mg/m3) | b | 0.43 | 0.31 | 0.7 | 0.26 | 0.44 | 0.29 | 0.59 | 0.27 | 0.27 | 0.28 | 0.23 | 0.20 | 0.44 | 0.24 | 0.55 | 0.24 |
| a | 0.64 | 0.42 | 0.85 | 0.38 | 0.66 | 0.4 | 0.66 | 0.34 | 0.28 | 0.29 | 0.22 | 0.21 | 0.68 | 0.32 | 1.16 | 0.32 | |
| d | 0.21 | 0.11 | 0.15 | 0.12 | 0.22 | 0.11 | 0.07 | 0.08 | 0.01 | 0.01 | −0.01 | 0.01 | 0.24 | 0.08 | 0.61 | 0.09 | |
| Type A | Type B | Type C | Type D | ||||||||||||||
|---|---|---|---|---|---|---|---|---|---|---|---|---|---|---|---|---|---|
| SW | SE | NW | NE | SW | SE | NW | NE | SW | SE | NW | NE | SW | SE | NW | NE | ||
| Number of species | b | 45 | 4 | - | 2 | 31 | 4 | - | 2 | 31 | 3 | - | 1 | 33 | 1 | - | - |
| a | 52 | 5 | - | 2 | 30 | 2 | - | 0 | 30 | 3 | - | 2 | 35 | 4 | - | - | |
| d | 7 | 1 | 0 | −1 | −2 | −2 | −1 | 0 | 1 | 2 | 3 | ||||||
| Total catch | b | 85,263.2 | 24,213.5 | - | 41,723.9 | 185,131.2 | 8274.0 | - | 21,986.6 | 32,991.9 | 821.4 | - | 17,316.0 | 48,443.5 | 1456.7 | - | - |
| a | 195,422.8 | 37,354.5 | - | 37,612.2 | 217,914.0 | 1675.0 | - | 0.0 | 25,744.5 | 920.3 | - | 66,496.6 | 117,439.1 | 29,159.1 | - | - | |
| d | 110,159.6 | 13,141.0 | −4111.7 | 32,782.8 | −6599.0 | −21,986.6 | −7247.4 | 98.9 | 49,180.6 | 68,995.6 | 27,702.4 | ||||||
| Diversity | b | 2.2 | 0.4 | - | 0.1 | 1.2 | 0.8 | - | 0.1 | 1.8 | 0.6 | - | 0.0 | 2.2 | 0.0 | - | - |
| a | 1.8 | 0.6 | - | 0.1 | 1.3 | 0.5 | - | 0.0 | 2.0 | 0.6 | - | 0.0 | 2.0 | 0.4 | - | - | |
| d | −0.4 | 0.2 | - | 0.0 | 0.1 | −0.3 | - | −0.1 | 0.2 | 0.0 | - | 0.0 | −0.2 | 0.4 | - | - | |
Disclaimer/Publisher’s Note: The statements, opinions and data contained in all publications are solely those of the individual author(s) and contributor(s) and not of MDPI and/or the editor(s). MDPI and/or the editor(s) disclaim responsibility for any injury to people or property resulting from any ideas, methods, instructions or products referred to in the content. |
© 2023 by the authors. Licensee MDPI, Basel, Switzerland. This article is an open access article distributed under the terms and conditions of the Creative Commons Attribution (CC BY) license (https://creativecommons.org/licenses/by/4.0/).
Share and Cite
Jung, Y.W.; Kim, B.S.; Jung, H.K.; Lee, C.I. Distributional Changes in Fishery Resource Diversity Caused by Typhoon Pathways in the East/Japan Sea. Fishes 2023, 8, 242. https://doi.org/10.3390/fishes8050242
Jung YW, Kim BS, Jung HK, Lee CI. Distributional Changes in Fishery Resource Diversity Caused by Typhoon Pathways in the East/Japan Sea. Fishes. 2023; 8(5):242. https://doi.org/10.3390/fishes8050242
Chicago/Turabian StyleJung, Yong Woo, Beom Sik Kim, Hae Kun Jung, and Chung Il Lee. 2023. "Distributional Changes in Fishery Resource Diversity Caused by Typhoon Pathways in the East/Japan Sea" Fishes 8, no. 5: 242. https://doi.org/10.3390/fishes8050242