
A Simple Radioassay to Detect Nanoscale Membrane Disruption

Abstract
:1. Introduction
2. Experimental Design
2.1. Materials
2.1.1. Radiolabeled Phosphate (PO)
2.1.2. Membrane-Disrupting Agents
2.1.3. Bacterial Culture
2.1.4. Culture Media
2.1.5. Glassware and Plasticware
2.2. Equipment
2.2.1. Scintillation Counter
2.2.2. Radiation Protection
2.2.3. Cold Room (4 C)
2.2.4. Incubator-Shaker
2.2.5. Centrifuge
2.2.6. Gel-Rocker
2.2.7. Aseptic Environment
3. Protocol
3.1. Radiolabeled Phosphate Uptake
- Inoculate your culture in 10 mL of Muller Hinton broth. Incubate at 37 C/24 h, on a shaker incubator at 180 rpm.
- Pipette 2 mL of this culture into a suitable container (preferably a 5 mL microcentrifuge tube) and centrifuge at 10,000 rpm for 10 min. Collect the pellet and discard the supernatant.
- Resuspend the pellet with 2 mL fresh Muller Hinton broth (tube A1).
![Mps 06 00023 i001]() NOTE: Fresh broth is essential for PO uptake.
NOTE: Fresh broth is essential for PO uptake. - Add 100 µCi PO to tube A1.
![Mps 06 00023 i001]() CAUTION: Place an acrylic radiation shield between you and the radiation source whenever handling radioisotopes. Wear appropriate PPE.
CAUTION: Place an acrylic radiation shield between you and the radiation source whenever handling radioisotopes. Wear appropriate PPE. - Incubate tube A1 on a gel rocker at 4 C for 24 h. The PO uptake occurs via passive diffusion across the cell membrane in metabolically inactive cells.

3.2. Radiolabeled Phosphate Retention Check
- 1.
- Pipette 500 L of the incubated culture in tube A1 into an empty centrifuge tube (tube A2). The remaining culture in tube A1 can be refrigerated and used for further experiments.
- 2.
- Centrifuge tube A2 at 12,000 rpm for 5 min at 4 C. Separate the pellet (tube P1) and supernatant (tube S1).
- 3.
- Resuspend P1 in 500 L physiological saline.
![Mps 06 00023 i001]() NOTE: Do not use phosphate-buffered saline at any step in this protocol. Unlabeled phosphate may compete with radiolabeled phosphate.
NOTE: Do not use phosphate-buffered saline at any step in this protocol. Unlabeled phosphate may compete with radiolabeled phosphate. - 4–9.
- Repeat Steps 2–3 three more times. Over the course of this protocol, your pellet should be resuspended in physiological saline four times (P1→P4), resulting in four centrifuge tubes containing different supernatants at every step of the washing process (S1→S4).
- 10.
- Use a scintillation counter to enumerate the disintegration rates of tubes S1→S4 and P4.
- Disintegration rates are expected to fall approximately 10→100-fold from tubes S1→S3. This indicates that excess PO is being washed out from the media.
- Disintegration rates are expected to remain within the same order of magnitude between tubes S3 and S4. This indicates that all the excess PO has been washed out.
- Finally, the ratio of disintegration rates for P4:S4 is expected to be approximately 100:1. This ratio indicates the proportion of PO firmly retained within the cytoplasm vs. the proportion of PO released from the cytoplasm upon resuspension and centrifugation.
3.3. Radiolabeled Phosphate Release
- Transfer 333 L of the suspension from tube P4 to a 50 mL centrifuge tube containing 9.667 mL saline, bringing the total volume to 10 mL.
- Draw the entire contents (10 mL) into a 20 mL syringe.
- Release 250 L of the contents in the syringe into an empty microcentrifuge tube (Tube C). This tube serves as the pre-reaction total radiation check. The disintegration rate of this tube represents the total disintegration rate from PO in both the cells and the saline medium.
- Carefully remove and discard the needle. Attach a 0.2 m syringe filter to the syringe. Attach a new needle to the syringe filter. The filter will separate the saline filtrate from cells, allowing for the measurement of PO released from the cells while ignoring PO still present within the cells.
- Release 250 L of the contents in the syringe into an empty microcentrifuge tube (tube T0). This tube’s baseline disintegration rate indicates the amount of PO present in the saline medium (the filtrate) before the addition of your membrane disrupting agent (at time = 0).
- Draw 250 L of a pre-made stock solution of your membrane disrupting agent into the syringe. Note your stock solution will be diluted 40-fold within the syringe. Prepare your stock concentration accordingly. Replace your stock solution with saline for your negative control condition. Start timing your experiment from this point onwards.
- At predetermined timepoints, release 250 L of the contents in the syringe into microcentrifuge tubes (tubes T1→Tn).
- Use a scintillation counter to enumerate the disintegration rates of tubes C, T0, T1→Tn. The percentage of PO released at any timepoint (tube Tx) can be calculated using Equation (1).
4. Expected Results
4.1. Rationale for the Development of the PO Release Radioassay
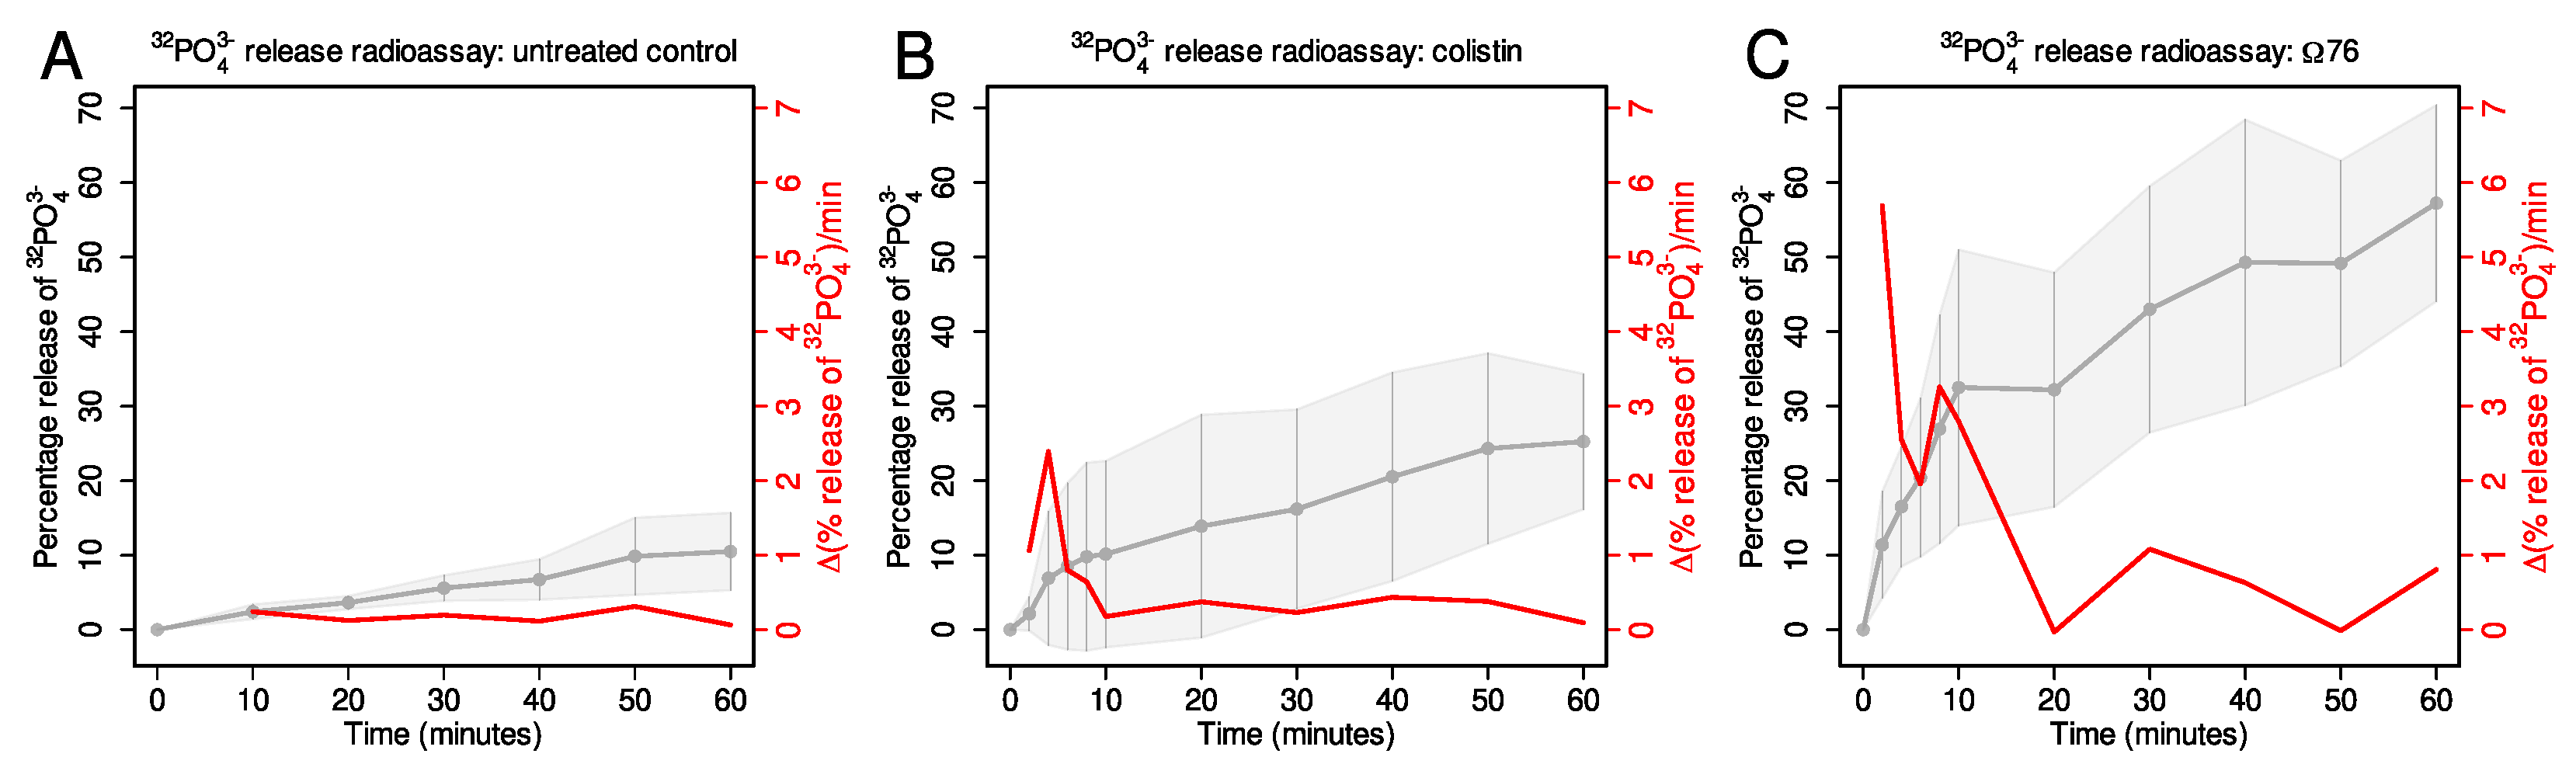
4.2. Expected Results for the PO Release Radioassay
- The untreated condition displayed the least phosphate release. Only 10% of PO was released after 60 min (Figure 5A). The rate of phosphate release remained fairly constant throughout this period, ranging from 0.06–0.3%/min.
- The 76 displayed the greatest phosphate release; 57% of PO was released after 60 min. The rate of phosphate release peaked at 5.7%/min at t = 2 min. Therefore, 76 causes the release of a greater percentage of cytoplasmic PO, and at a higher rate, compared to both the untreated and colistin-treated conditions.
5. Discussion
Author Contributions
Funding
Institutional Review Board Statement
Informed Consent Statement
Data Availability Statement
Acknowledgments
Conflicts of Interest
Sample Availability
References
- Deamer, D.; Dworkin, J.P.; Sandford, S.A.; Bernstein, M.P.; Allamandola, L.J. The first cell membranes. Astrobiology 2002, 2, 371–381. [Google Scholar] [CrossRef] [PubMed]
- Karimi, M.A.; Lee, E.; Bachmann, M.H.; Salicioni, A.M.; Behrens, E.M.; Kambayashi, T.; Baldwin, C.L. Measuring cytotoxicity by bioluminescence imaging outperforms the standard chromium-51 release assay. PLoS ONE 2014, 9, e89357. [Google Scholar] [CrossRef] [PubMed]
- Lisby, A.N.; Carlson, R.D.; Baybutt, T.R.; Weindorfer, M.; Snook, A.E. Evaluation of CAR-T cell cytotoxicity: Real-time impedance-based analysis. In MCB: CAR T Cells: Development, Characterization and Applications; Academic Press: Cambridge, MA, USA, 2022; p. 81. [Google Scholar]
- Armati-gulson, P.J.; Lisak, R.P.; Kuchmy, D.; Pollard, J. 51Cr release cytotoxicity radioimmunoassay to detect immune cytotoxic reactions to rat Schwann cells in vitro. Neurosci. Lett. 1983, 35, 321–326. [Google Scholar] [CrossRef] [PubMed]
- Townsend, A.; Skehel, J. The influenza A virus nucleoprotein gene controls the induction of both subtype specific and cross-reactive cytotoxic T cells. J. Exp. Med. 1984, 160, 552–563. [Google Scholar] [CrossRef] [PubMed] [Green Version]
- Yamamura, M.; Boler, J.; Valdimarsson, H. A /sup 51/Chromium release assay for phagocytic killing of Candida albicans. J. Immunol. Methods 1976, 13. [Google Scholar] [CrossRef]
- Cordier, G. Liquid scintillation counting of 51 Chromium. Application to a micromethod of cell-mediated cytotoxic assay. Pathologie-Biologie 1977, 25, 175–279. [Google Scholar]
- Klein, R.; Reginatto, M.; Party, E.; Gershey, E. Practical radiation shielding for biomedical research. Radiat. Prot. Manag. States 1990, 7. [Google Scholar]
- Packard, B.Z.; Akira, K.; Ucker, D.S. Forty-Nine-NK cell-mediated target cell death. In Natural Killer Cells; Academic Press: Cambridge, MA, USA, 2010; pp. 645–652. [Google Scholar]
- Fierer, J.; Finley, F.; Braude, A.I. Release of 51Cr-endotoxin from bacteria as an assay of serum bactericidal activity. J. Immunol. 1974, 112, 2184–2192. [Google Scholar] [CrossRef]
- Dengler, W.A.; Schulte, J.; Berger, D.P.; Mertelsmann, R.; Fiebig, H.H. Development of a propidium iodide fluorescence assay for proliferation and cytotoxicity assays. Anti-Cancer Drugs 1995, 6, 522–532. [Google Scholar] [CrossRef]
- Zhao, H.; Oczos, J.; Janowski, P.; Trembecka, D.; Dobrucki, J.; Darzynkiewicz, Z.; Wlodkowic, D. Rationale for the real-time and dynamic cell death assays using propidium iodide. Cytom. Part A J. Int. Soc. Adv. Cytom. 2010, 77, 399–405. [Google Scholar] [CrossRef] [Green Version]
- Ross, D.D.; Joneckis, C.C.; Ordóñez, J.V.; Sisk, A.M.; Wu, R.K.; Hamburger, A.W.; Nora, R.E. Estimation of cell survival by flow cytometric quantification of fluorescein diacetate/propidium iodide viable cell number. Cancer Res. 1989, 49, 3776–3782. [Google Scholar] [PubMed]
- Banerjee, A.; Majumder, P.; Sanyal, S.; Singh, J.; Jana, K.; Das, C.; Dasgupta, D. The DNA intercalators ethidium bromide and propidium iodide also bind to core histones. FEBS Open Bio 2014, 4, 251–259. [Google Scholar] [CrossRef] [PubMed] [Green Version]
- Riccardi, C.; Nicoletti, I. Analysis of apoptosis by propidium iodide staining and flow cytometry. Nat. Protoc. 2006, 1, 1458–1461. [Google Scholar] [CrossRef] [PubMed]
- Baskić, D.; Popović, S.; Ristić, P.; Arsenijević, N.N. Analysis of cycloheximide-induced apoptosis in human leukocytes: Fluorescence microscopy using annexin V/propidium iodide versus acridin orange/ethidium bromide. Cell Biol. Int. 2006, 30, 924–932. [Google Scholar] [CrossRef] [PubMed]
- Lakshmanan, I.; Batra, S.K. Protocol for apoptosis assay by flow cytometry using annexin V staining method. Bio-protocol 2013, 3, e374. [Google Scholar] [CrossRef] [PubMed] [Green Version]
- Schmid, I.; Krall, W.J.; Uittenbogaart, C.H.; Braun, J.; Giorgi, J.V. Dead cell discrimination with 7-amino-actinomcin D in combination with dual color immunofluorescence in single laser flow cytometry. Cytom. J. Int. Soc. Anal. Cytol. 1992, 13, 204–208. [Google Scholar] [CrossRef] [PubMed]
- Nagarajan, D.; Nagarajan, T.; Roy, N.; Kulkarni, O.; Ravichandran, S.; Mishra, M.; Chakravortty, D.; Chandra, N. Computational antimicrobial peptide design and evaluation against multidrug-resistant clinical isolates of bacteria. J. Biol. Chem. 2018, 293, 3492–3509. [Google Scholar] [CrossRef] [Green Version]
- Ma, H.; Zhao, X.; Yang, L.; Su, P.; Fu, P.; Peng, J.; Yang, N.; Guo, G. Antimicrobial peptide AMP-17 affects Candida albicans by disrupting its cell wall and cell membrane integrity. Infect. Drug Resist. 2020, 2509–2520. [Google Scholar] [CrossRef]
- Pfister, R.R.; Burstein, N. The effects of ophthalmic drugs, vehicles, and preservatives on corneal epithelium: A scanning electron microscope study. Invest Ophthalmol. 1976, 15, 246–259. [Google Scholar]
- Hartmann, M.; Berditsch, M.; Hawecker, J.; Ardakani, M.F.; Gerthsen, D.; Ulrich, A.S. Damage of the bacterial cell envelope by antimicrobial peptides gramicidin S and PGLa as revealed by transmission and scanning electron microscopy. Antimicrob. Agents Chemother. 2010, 54, 3132–3142. [Google Scholar] [CrossRef] [Green Version]
- Han, M.; Mei, Y.; Khant, H.; Ludtke, S.J. Pore formation by antimicrobial peptide, magainin 2, in phospholipd vesicles detected and visualized by cryo-electron microscopy. Microsc. Microanal. 2008, 14, 1610–1611. [Google Scholar] [CrossRef]
- Mularski, A.; Wilksch, J.J.; Hanssen, E.; Strugnell, R.A.; Separovic, F. Atomic force microscopy of bacteria reveals the mechanobiology of pore forming peptide action. Biochim. Biophys. Acta (BBA)-Biomembr. 2016, 1858, 1091–1098. [Google Scholar] [CrossRef]
- Hammond, K.; Ryadnov, M.G.; Hoogenboom, B.W. Atomic force microscopy to elucidate how peptides disrupt membranes. Biochim. Biophys. Acta (BBA)-Biomembr. 2021, 1863, 183447. [Google Scholar] [CrossRef]
- Hu, H.; Jiang, C.; Zhang, B.; Guo, N.; Li, Z.; Guo, X.; Wang, Y.; Liu, B.; He, Q. Investigation of morphological changes of HPS membrane caused by cecropin B through scanning electron microscopy and atomic force microscopy. J. Vet. Sci. 2021, 22, e59. [Google Scholar] [CrossRef]
- Nagarajan, D.; Roy, N.; Kulkarni, O.; Nanajkar, N.; Datey, A.; Ravichandran, S.; Thakur, C.; Aprameya, I.V.; Sarma, S.P.; Chakravortty, D.; et al. Ω76: A designed antimicrobial peptide to combat carbapenem-and tigecycline-resistant Acinetobacter baumannii. Sci. Adv. 2019, 5, eaax1946. [Google Scholar] [CrossRef] [Green Version]
- Personal Protective Equipment; Number 5 in Practical Radiation Technical Manual; International Atomic Energy Agency: Vienna, Austria, 2004.
- Brogden, K.A. Antimicrobial peptides: Pore formers or metabolic inhibitors in bacteria? Nat. Rev. Microbiol. 2005, 3, 238–250. [Google Scholar] [CrossRef] [PubMed]
- Sabnis, A.; Hagart, K.L.; Klöckner, A.; Becce, M.; Evans, L.E.; Furniss, R.C.D.; Mavridou, D.A.; Murphy, R.; Stevens, M.M.; Davies, J.C.; et al. Colistin kills bacteria by targeting lipopolysaccharide in the cytoplasmic membrane. eLife 2021, 10, e65836. [Google Scholar] [CrossRef] [PubMed]
- Vitale, M.; Zamai, L.; Mazzotti, G.; Cataldi, A.; Falcieri, E. Differential kinetics of propidium iodide uptake in apoptotic and necrotic thymocytes. Histochemistry 1993, 100, 223–229. [Google Scholar] [CrossRef]
- Lizard, G.; Fournel, S.; Genestier, L.; Dhedin, N.; Chaput, C.; Flacher, M.; Mutin, M.; Panaye, G.; Revillard, J.P. Kinetics of plasma membrane and mitochondrial alterations in cells undergoing apoptosis. Cytom. J. Int. Soc. Anal. Cytol. 1995, 21, 275–283. [Google Scholar] [CrossRef]
- Crowley, L.C.; Scott, A.P.; Marfell, B.J.; Boughaba, J.A.; Chojnowski, G.; Waterhouse, N.J. Measuring cell death by propidium iodide uptake and flow cytometry. Cold Spring Harb. Protoc. 2016, 2016, pdb.prot087163. [Google Scholar] [CrossRef] [PubMed]
- Kristensen, K.; Henriksen, J.R.; Andresen, T.L. Quantification of leakage from large unilamellar lipid vesicles by fluorescence correlation spectroscopy. Biochim. Biophys. Acta (BBA)-Biomembr. 2014, 1838, 2994–3002. [Google Scholar] [CrossRef] [PubMed] [Green Version]
- Bodelón, G.; Labrada, L.; Martínez-Costas, J.; Benavente, J. Modification of late membrane permeability in avian reovirus-infected cells: Viroporin activity of the S1-encoded nonstructural p10 protein. J. Biol. Chem. 2002, 277, 17789–17796. [Google Scholar] [CrossRef] [Green Version]
- Carrasco, L. Modification of membrane permeability by animal viruses. Adv. Virus Res. 1995, 45, 61–112. [Google Scholar]
- Li, Y.; Li, Y.; Mengist, H.M.; Shi, C.; Zhang, C.; Wang, B.; Li, T.; Huang, Y.; Xu, Y.; Jin, T. Structural basis of the pore-forming toxin/membrane interaction. Toxins 2021, 13, 128. [Google Scholar] [CrossRef]
- Podobnik, M.; Anderluh, G. Pore-forming toxins in Cnidaria. In Seminars in Cell & Developmental Biology; Elsevier: Amsterdam, The Netherlands, 2017; Volume 72, pp. 133–141. [Google Scholar]
- Nelson, J.; Gibbons, E.; Pickett, K.R.; Streeter, M.; Warcup, A.O.; Yeung, C.H.Y.; Judd, A.M.; Bell, J.D. Relationship between membrane permeability and specificity of human secretory phospholipase A2 isoforms during cell death. Biochim. Biophys. Acta (BBA)-Biomembr. 2011, 1808, 1913–1920. [Google Scholar] [CrossRef] [Green Version]
- Chekeni, F.B.; Elliott, M.R.; Sandilos, J.K.; Walk, S.F.; Kinchen, J.M.; Lazarowski, E.R.; Armstrong, A.J.; Penuela, S.; Laird, D.W.; Salvesen, G.S.; et al. Pannexin 1 channels mediate ‘find-me’signal release and membrane permeability during apoptosis. Nature 2010, 467, 863–867. [Google Scholar] [CrossRef] [PubMed] [Green Version]
- Zoratti, M.; Szabò, I. The mitochondrial permeability transition. Biochim. Biophys. Acta (BBA)-Rev. Biomembr. 1995, 1241, 139–176. [Google Scholar] [CrossRef]
- Kowaltowski, A.J.; Castilho, R.F.; Vercesi, A.E. Mitochondrial permeability transition and oxidative stress. FEBS Lett. 2001, 495, 12–15. [Google Scholar] [CrossRef] [Green Version]


| Tube | Untreated Control | Colistin | 76 | |||||||
|---|---|---|---|---|---|---|---|---|---|---|
| Rep-1 | Rep-2 | Rep-3 | Rep-1 | Rep-2 | Rep-3 | Rep-1 | Rep-2 | Rep-3 | ||
| S1 | 1.25 | 1.18 | 8.56 | 1.30 | 5.49 | 4.20 | 1.34 | 2.29 | 7.00 | |
| S2 | 4.88 | 3.17 | 3.44 | 4.30 | 6.80 | 9.51 | 3.27 | 5.32 | 4.57 | |
| S3 | 1.92 | 6.73 | 1.05 | 1.90 | 6.55 | 1.15 | 4.74 | 2.12 | 2.53 | |
| S4 | 1.05 | 4.38 | 4.05 | 1.03 | 9.79 | 4.08 | 1.51 | 1.10 | 1.15 | |
| P4 | 1.78 | 5.32 | 6.67 | 1.55 | 2.00 | 3.46 | 1.77 | 5.96 | 1.87 | |
| C | 3.23 | 1.05 | 1.21 | 3.35 | 5.85 | 1.70 | 3.33 | 1.16 | 5.80 | |
| 0 m | T0 | 4.65 | 3.26 | 2.71 | 6.39 | 1.05 | 1.78 | 1.30 | 4.96 | 1.58 |
| 2 m | T1 | 1.07 | 1.27 | 9.63 | 7.31 | 1.72 | 4.09 | |||
| 4 m | T2 | 1.67 | 1.29 | 3.05 | 8.91 | 2.49 | 6.00 | |||
| 6 m | T3 | 1.86 | 1.36 | 3.75 | 1.15 | 2.54 | 7.73 | |||
| 8 m | T4 | 2.16 | 1.37 | 4.23 | 1.51 | 3.27 | 8.72 | |||
| 10 m | T5 | 1.48 | 4.58 | 5.94 | 2.31 | 1.59 | 4.27 | 1.82 | 3.60 | 1.10 |
| 20 m | T6 | 1.93 | 6.18 | 6.76 | 3.69 | 2.07 | 5.31 | 1.69 | 3.90 | 1.13 |
| 30 m | T7 | 2.78 | 7.17 | 9.38 | 5.55 | 3.04 | 5.23 | 2.08 | 4.95 | 1.74 |
| 40 m | T8 | 3.60 | 8.37 | 8.96 | 7.32 | 4.85 | 5.98 | 2.38 | 5.45 | 2.02 |
| 50 m | T9 | 5.48 | 9.51 | 1.17 | 8.81 | 7.51 | 6.35 | 2.12 | 6.17 | 2.11 |
| 60 m | T10 | 5.71 | 1.09 | 1.16 | 8.83 | 1.04 | 5.96 | 2.42 | 6.54 | 2.74 |
Disclaimer/Publisher’s Note: The statements, opinions and data contained in all publications are solely those of the individual author(s) and contributor(s) and not of MDPI and/or the editor(s). MDPI and/or the editor(s) disclaim responsibility for any injury to people or property resulting from any ideas, methods, instructions or products referred to in the content. |
© 2023 by the authors. Licensee MDPI, Basel, Switzerland. This article is an open access article distributed under the terms and conditions of the Creative Commons Attribution (CC BY) license (https://creativecommons.org/licenses/by/4.0/).
Share and Cite
Nanajkar, N.; Mruthyunjaya, L.S.; Nagarajan, D. A Simple Radioassay to Detect Nanoscale Membrane Disruption. Methods Protoc. 2023, 6, 23. https://doi.org/10.3390/mps6020023
Nanajkar N, Mruthyunjaya LS, Nagarajan D. A Simple Radioassay to Detect Nanoscale Membrane Disruption. Methods and Protocols. 2023; 6(2):23. https://doi.org/10.3390/mps6020023
Chicago/Turabian StyleNanajkar, Neha, Lekhana S. Mruthyunjaya, and Deepesh Nagarajan. 2023. "A Simple Radioassay to Detect Nanoscale Membrane Disruption" Methods and Protocols 6, no. 2: 23. https://doi.org/10.3390/mps6020023