Article

Determination of UV Filters in Waste Sludge Using QuEChERS Method Followed by In-Port Derivatization Coupled with GC–MS/MS

1
Faculty of Engineering, Environmental Engineering Department, Dokuz Eylül University, Tınaztepe Campus, Buca, İzmir 35390, Turkey
2
Faculty of Science, Chemistry Department, Ege University, Bornova, İzmir 35040, Turkey
*
Author to whom correspondence should be addressed.
Methods Protoc. 2022, 5(6), 92; https://doi.org/10.3390/mps5060092
Submission received: 11 October 2022 / Revised: 10 November 2022 / Accepted: 20 November 2022 / Published: 23 November 2022
(This article belongs to the Special Issue Women’s Special Issue Series: Analytical Methods)

Abstract

:
UV filters (UVFs) are widely used in personal care and in industrial products for protection against photodegradation. In recent years, their potential toxicological and environmental effects have received growing attention. Due to their excessive use, their residue levels in the environment are gradually increasing and they tend to accumulate on biological wastewater treatment sludge. The utilization of sludge as fertilizer could be one of the main routes of UVF contamination in the environment. Therefore, the development of a reliable and sensitive method of analyzing their trace level residues in waste sludge samples is of great importance. The success of the method largely depends on the sample preparation technique in such complex matrices. This study presents a rapid, sensitive and green analysis method for eight UVFs in sludge samples, selected for their rather low no-observed-effect concentrations (NOEC). For this purpose, the QuEChERS methodology was coupled with in-port derivatization for subsequent detection of the targeted UVFs via GC–MS/MS. The analysis time was substantially shortened using this method, and reagent utilization was also reduced. The method was validated in the sludge samples, and high recovery (66–123%) and low RSD values (<25.6%) were obtained. In addition, major contributing uncertainty sources and expanded uncertainties were determined.

1. Introduction

UVFs are the general name for the chemical group that absorbs ultraviolet light, through which the adverse effects of UV light are eliminated. UVFs can be grouped as inorganic, such as TiO2 or ZnO [1], and organic, mostly used in personal care products, as well as in plastics, automobile paints and rubber industries to increase resistance towards UV light degradation [2]. These compounds can reach to water bodies through industrial and domestic effluents. Since their utilization in personal care products and industrial applications are widespread, the UVF residue levels in the environment are increasing extensively [3].
Organic UVFs are a wide range of compounds that differ in their structures and properties. These highly persistent compounds in the environment tend to accumulate in water [3,4,5], suspended particles, soil [6], sediment [7] and sludges [8,9,10]. Organic UVFs can also accumulate in biota and disrupt the endocrine systems of aquatic organisms by increasing their estrogen-induced cell proliferation [11]. It has been clearly stated that UVFs affect different hormonal targets as well as estrogenic activity in mammals and fish, and are therefore known as endocrine-disrupting chemicals (EDCs) [12,13]. Consequently, one of these compounds has recently been included in the Watch List by The European Water Framework Directive as a future priority pollutant [14]. Although the use of these compounds in cosmetics is legally restricted [15], there is no limit to their concentration in water and sewage sludge matrices. However, studies on the presence of UVFs in waste sludge have revealed that their concentration range from a few to thousands of µg/g in dry mass [16]. The use of this sludge as fertilizer is another concern due to the widespread distribution of UVF residues in agricultural soils and the possible contamination of crops.
Since their concentrations are very low, an appropriate preparation technique must be applied to the samples to isolate and preconcentrate these filters. Current trends in the determination of organic UVFs in environmental water samples based on microextraction techniques have been reviewed [3,17,18]. However, their determination in sludge samples faces difficulties due to the complexity of the matrices and their impact on the environment. To date, one of the techniques used for UVF extraction from sewage sludge comprises liquid–liquid extraction (LLE) followed by solid-phase extraction (SPE) [19,20,21,22] where the excessive use of solvent is the main drawback of the method. The other technique is pressurized liquid extraction (PLE), applied alone or coupled with SPE [23,24,25,26,27,28,29] or gel permeation chromatography (GPC) [30]. Despite the advantage of using a smaller solvent volume in the PLE technique, special equipment is required to conduct this method.
In the last few decades, method development studies have been devoted to modern sample preparation techniques based on shorter analytical periods and the minimization of organic solvent utilization for a wide range of pollutants. One of these modern techniques, called QuEChERS (which is an acronymic for quick, easy, cheap, effective, rugged and safe) has been well-established to improve laboratory efficiency and throughput. The main advantage of this method is its small quantities of solvent utilization. The method has already been tested for UVFs in human milk [31] and seafood samples [32], followed by liquid chromatography systems coupled with mass detectors (LC-MS) and sludge samples, and then, by detection using gas chromatography (GC–MS) [16,21,22,23]. LC-MS systems are preferred for the analysis of polar UVFs, and no derivatization step is required in accordance with the physicochemical properties of UVFs [33,34,35,36]. GC–MS has been used for rather non-polar and volatile UV filters. Although the GC method provides high separation efficiency, high selectivity and good sensitivity, it displays some disadvantages such as the derivatization step, in which more reagents, greater reaction time and more labor are required. Fortunately, the in-port derivatization technique is a practical and environmentally friendly solution to these issues wherein the reaction takes place in the injection block rather than in an off-line interaction. The analysis time can be substantially reduced using this method and the selectivity can be improved since the technique enables extra purification for the matrix effect.
In the present study, we aimed to detect eight UVFs in sludge samples. Benzophenone-3 (BP-3), 3-benzylidene camphor (3BC), 2-ethyl hexyl-4-(dimethyl amino) benzoate (EDP), 2-ethyl-hexyl-4-trimethoxy cinnamate (EHMC), ethylhexyl salicylate (EHS), homosalate (HMS), isoamyl p-methoxycinnamate (IAMC) and 4-methylbenzylidene camphor (4-MBC) were selected according to their no-observed-effect concentration (NOEC) values. Their chemical structures and NOEC limits are presented in Table 1. Considering the hydrophobicity (logKow: 3.79–6.16) of the analytes, the QuEChERS method was adopted; however, due to the low volatility of these analytes along with their weak acidity (pKa: 7.56–8.13), the analytes were derivatized using an in-port silylation technique prior to subsequent quantification using the GC–MS/MS system. To the best of our knowledge, this is the first report in the literature about the combination of QuEChERS with in-port derivatization followed by GC–MS/MS for a wide variety of UVF analyses in waste sludge. This method extensively decreases solvent or chemical consumption and shortens the analysis time compared to off-line derivatization. The method validation parameters, major contributing uncertainty sources and expanded uncertainties were determined.

2. Materials and Method

2.1. Reagents and Standard Solutions

The chemical standards of 2-ethylhexyl salicylate (EHS), 2-hydroxy-4-methoxybenzophenone (benzophenone-3, BP-3) >98%, 3,3,5-trimethylciclohexylsalicylate (homosalate, HMS) >98%, 4-methylbenzylidene camphor (4-MBC) 99%, 2-ethyl-hexyl-4-trimethoxy cinnamate (EHMC) 99%, and 2-ethyl hexyl-4-(dimethylamino) benzoate (EDP) 99% were obtained from Dr. Ehrenstorfer (Augsburg, Germany). 3-benzylidene camphor (3BC) 99%, isoamyl p-methoxycinnamate (IAMC) and % were acquired from Sigma-Aldrich (St. Louis, MO, USA), Toronto Research Chemicals (Toronto, ON, Canada) and Chemservice (West Chester, PA, USA), respectively.
LC-MS-grade methanol and acetonitrile, GC–MS-grade ethyl acetate (EtAC) and acetone, sodium chloride, sodium sulfate and orthophosphoric acid were purchased from Merck (Darmstadt, Germany). Bis(trimethylsilyl) trifluoroacetamide with 1% trimethylchlorosilane (BSTFA + TMCS; 99:1, v/v) from Macherey-Nagel was used as derivatization reagent. This reagent was stable for only 3 h during analysis. 2-dodecanol, 2-dodecanone, and 1-undecanol from Sigma were used as extraction solvents. Anhydrous magnesium sulphate (MgSO4), primary and secondary amine exchange bonded silica sorbent (PSA) and octadecylsilan (C18) were obtained from Supelco (Bellefonte, PA, USA) for the extraction step.
The stock solutions of individual UVFs (1000 µg mL−1) and mixtures of UVFs (50 µg mL−1) were prepared in ethyl acetate to optimize the injection port derivatization conditions in methanol to validate the QuEChERS method. These solutions of 1000 µg mL−1 and 50 µg mL−1 were stable for about 5 months and five days at −20 °C, respectively. The working aqueous solutions were prepared daily from standards in methanol at different concentrations using ultrapure water and environmental water. The sludge samples were collected from a domestic wastewater treatment plant in Izmir, Turkey. Sludges were air-dried and stored in the dark at −20 °C until analysis.

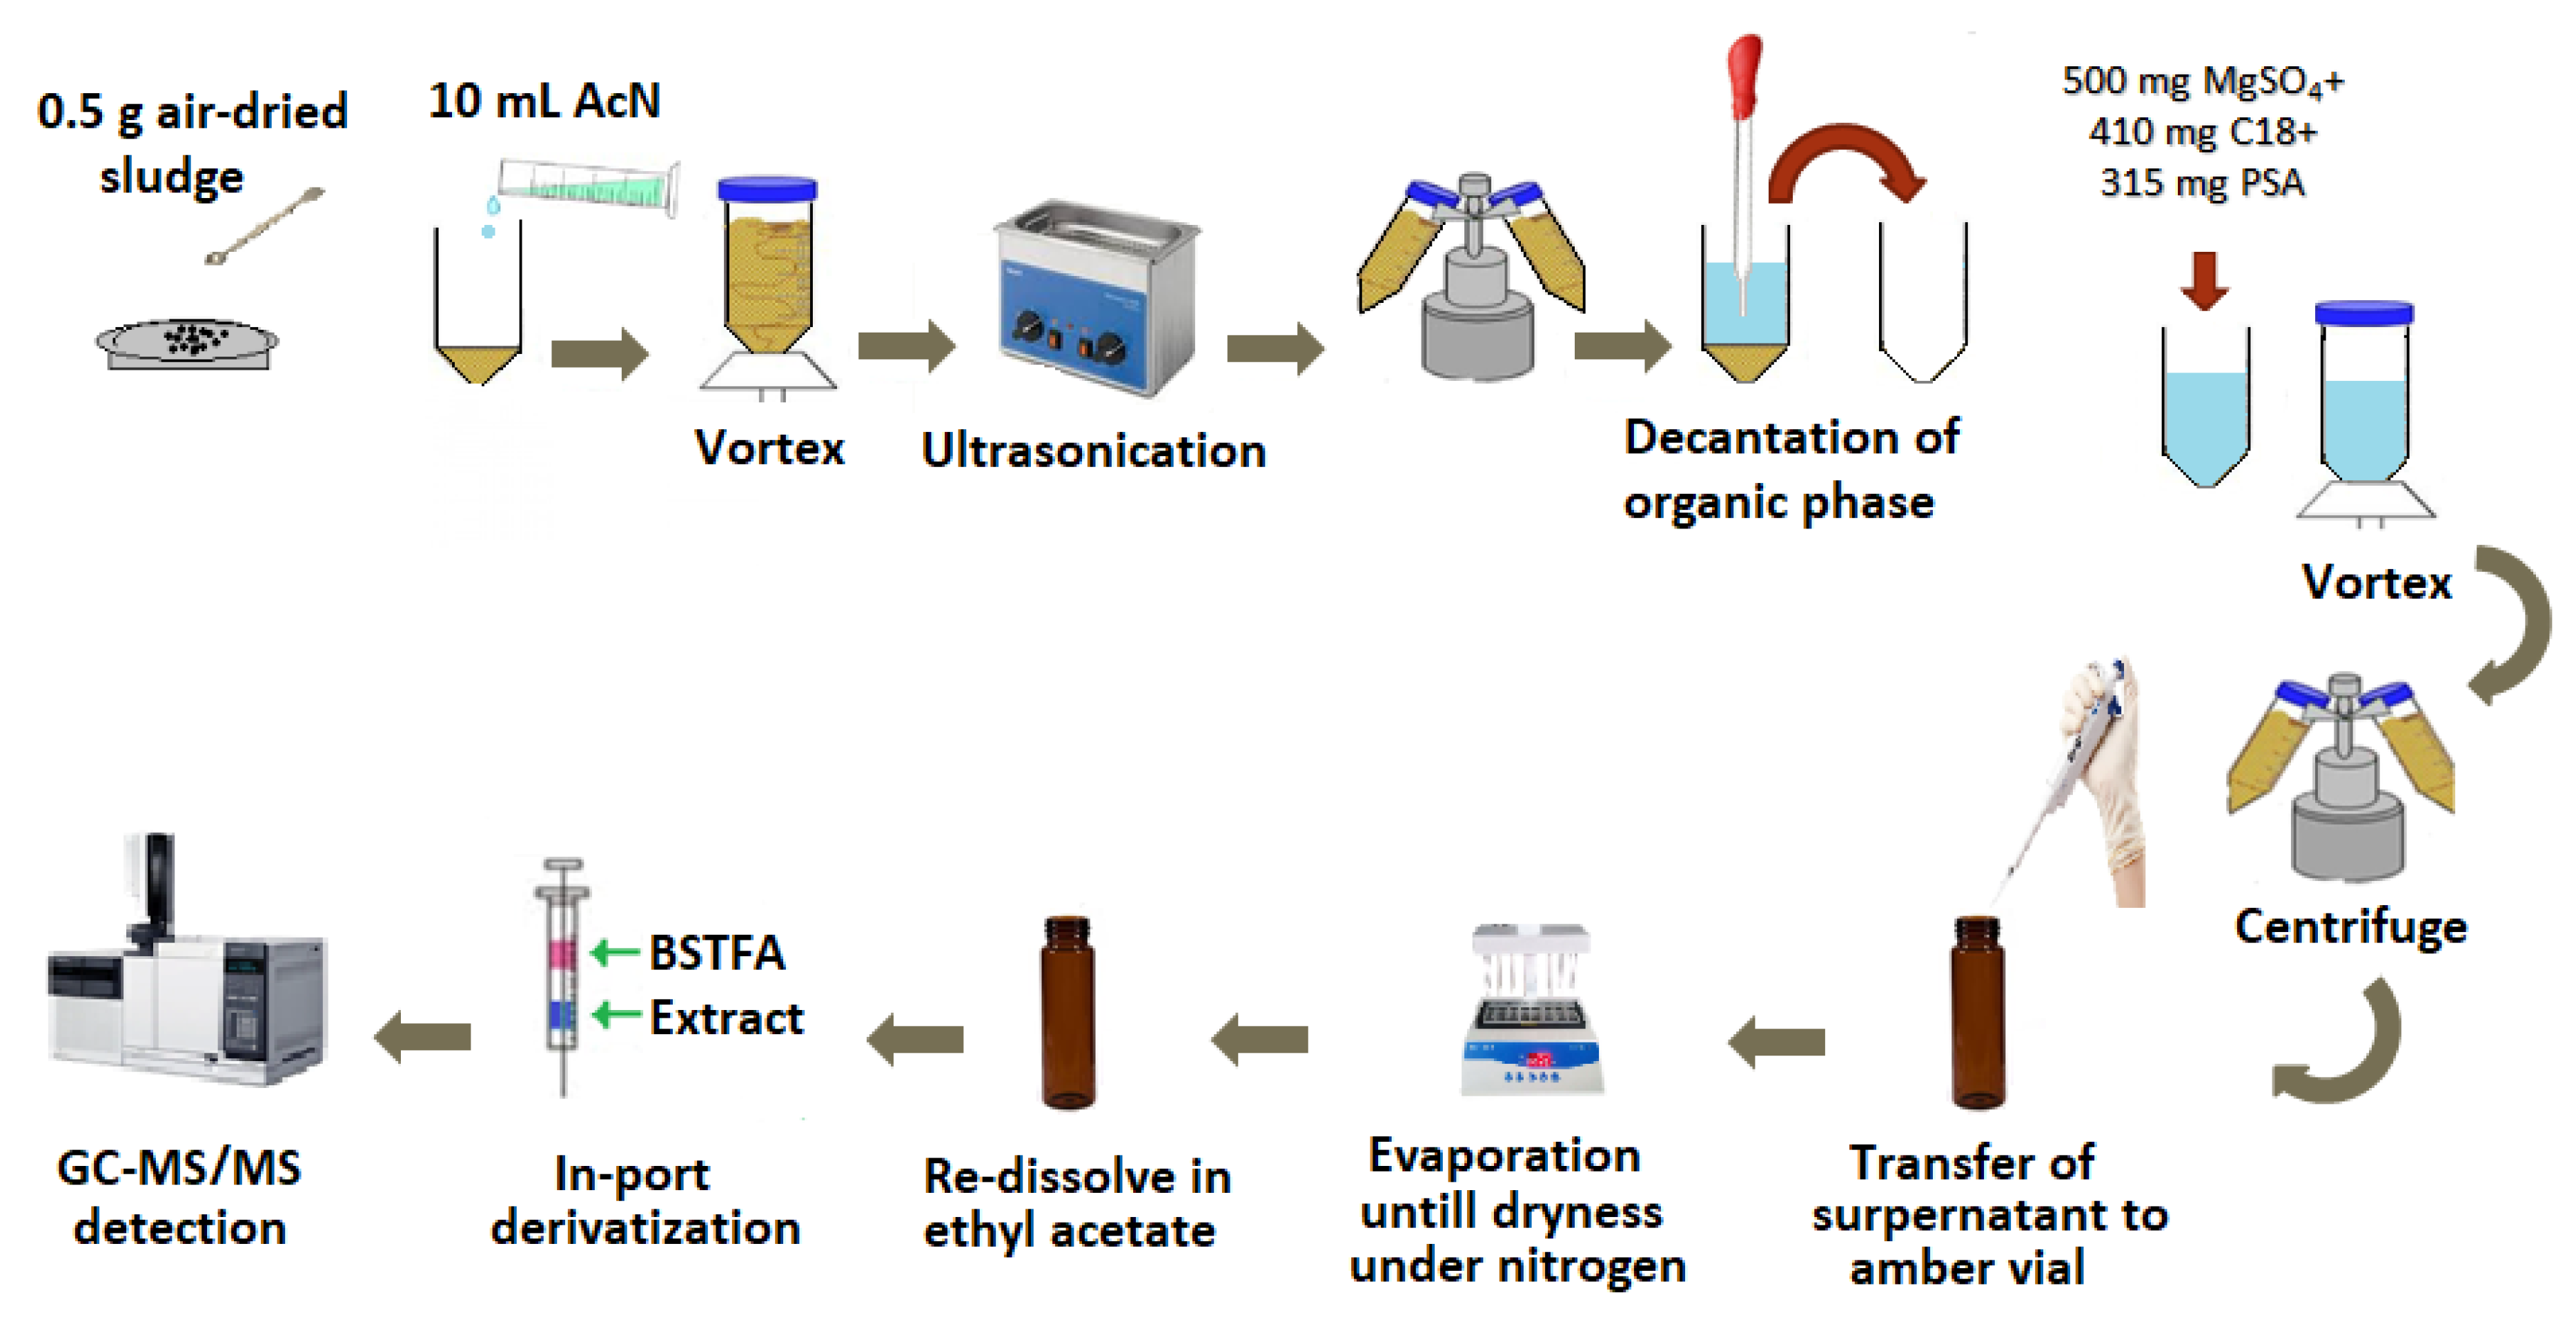
2.2. Sample Extraction

The procedure for extracting UVFs from sludge is a modified version of the method reported previously [16]. As shown in Figure 1, a 0.5 g sewage sludge sample was dried at room temperature and a spiked sample was transferred into a conical-bottom 15 mL polypropylene tube containing 10 mL of ACN, vortexed for 2.5 min, and then, left in an ultrasonic bath (J.P. Selecta, Barcelona, Spain) for 15 min. Then, the organic phase was separated via centrifugation at 3500 rpm for 15 min and transferred to a conical-bottom 15 mL polypropylene tube containing 500 mg MgSO4, 410 mg C18 and 315 mg PSA. The extract was then vortexed for 2.5 min and centrifuged for 15 min. After the supernatant was transferred to a 10 mL tube, it was evaporated to dryness under N2 gas. Then, the extract was dissolved in 1000 µL EtAC, instead of hexane as performed by Ramos et al. [16], for the in-port derivatization step as previously applied to a surface water sample by our research group [37]. The extract dissolved in EtAC was filtered through a 13 mm, 0.22 µm PTFE filter, and then, it was transferred to a 1.5 mL amber vial. Finally, 2 µL of BSTFA and 2 µL of extract were derivatized in the injection port using the sandwich technique. In this technique, two aliquots of 2 µL BSTFA and 2 µL extract in EtAc, separated with an air gap, are drawn into the microsyringe of a PAL autosampler, and then, injected to the GC–MS/MS system.

2.3. GC–MS/MS Analysis

GC–MS/MS analysis was performed using an Agilent 7890 B gas chromatograph coupled with a triple quadrupole mass spectrometer (MS 7000C) and a PAL autosampler (GC Sampler 80). For derivatization, the injection port temperature was held at 70 °C for 3 min, then, increased to 300 °C at a rate of 400 °C min−1 in splitless mode with a purge-off time of 4.5 min. The oven temperature started at 70 °C for 4 min, increased to 180 °C at 25 °C min−1, then, increased to 230 °C at a rate of 5 °C min−1 and to 300 °C at a rate of 25 °C min−1; it was held for 10 min at this temperature. The injector was operated using programmed temperature evaporation (PTV).
Separation was performed on 5% phenyl-arylene/95%-dimethylpolysiloxane HP-5MS (30 m × 0.25 mm i.d. 0.25 µm film thickness) supplied by Phenomenex (Torrance, CA, USA). Helium (99.999% purity) was used as the carrier gas at a constant flow of 1 mL min−1. In MS/MS analysis, the temperatures of the ion source and the transfer line were 280 and 300 °C, respectively. The multiple reaction monitoring (MRM) technique was applied, and electron ionization (EI) mode was used. The retention times (Rt) obtained, the optimized MRM transitions and the collision energies (CE) for each UVF are given in Table 2. The bold parent and product ions in the table show the quantification transitions.

2.4. Validation Studies

The matrix match method was used for the calibration curves. In this method, the curves were constructed by subtracting the peak area values of the real sludge sample from the spiked extract and plotting against the concentration of the UV filter added into the real sludge sample.
The linear range, intra-day and inter-day repeatability, Limit of Detection (LOD), Limit of Quantitation (LOQ) and recovery parameters were determined, and measurement uncertainties of the method applied for UVFs were calculated. For the linearity of UVFs, sludge samples were spiked with 40, 80, 200, 600 and 1200 ng g−1 UVF standards. The extracts were evaporated to dryness under nitrogen gas, and they were diluted to 1000 µL using ethyl acetate. The LOQ and LOD were calculated according to S/N = 10 and S/N = 3, respectively. Intra-day and inter-day repeatability studies were performed at low (80 ng g−1), medium (300 ng g−1), and high (600 ng g−1) concentrations, with 3 replicates.
The selected test material was analyzed repeatedly under different conditions such as on different days, using different analysts and different equipment, etc. The total variation in the whole cluster can be represented as the combination of variances (s2) between (Sbetween) and within groups (Sr). The repeatability (intra-day) and intermediate precision (inter-day) values were calculated via ANOVA [38]. The standard deviation of Sr was calculated by taking the square root of the within-group mean square term, as shown in Equation (1), and the contribution of the grouping factor to the total variation was obtained from Equation (2). In Equations (1) and (2), MSw is the within-group mean square term and MSb is the between-group mean square term.
Then, intermediate precision (SI) was calculated by combining the within-group and between-group variance components, as shown in Equation (3).
S r = M S w
s b e t w e e n = M S b M S w n
S I = S r 2 + S b e t w e e n 2
The intra-day (n = 3) and inter-day (n = 2) relative standard deviations (RSD%) of the QuEChERS followed by GC–MS/MS were obtained using spiked solutions of the analytes at different concentration levels. According to the 2015/1787 directive, if the RSD% value of the applied method is less than 25%, the precision of this method is acceptable for organic compounds.
Recovery studies to determine the accuracy of the method were carried out by adding the UVF standards to the sewage sludge samples at concentrations of 80, 300 and 600 ng g−1. The recovery percentages were calculated from Equation (4) where, C p r e E x t and C p o s t E x t are the concentrations of sludges in which analytes were added before and after extraction, respectively. C s a m p l e is the concentration of UVFs in sludges without the addition of the analyte.
R e c o v e r y   % = C p r e E x t C s a m p l e C p o s t E x t C s a m p l e × 100
The measurement uncertainty is a parameter that was included with the measured result and characterizes the distribution of values that can correspond to the measurand. Knowing the uncertainty means increased confidence in the accuracy of the measurement result. This value is very important in comparing the measurement results of two different methods and deciding whether the results are within the defined limits. Measurement uncertainty consists of many components. Some of these components are derived from the statistical distribution of the results of repeated measurement series to obtain the standard deviations. Combined standard uncertainty (u(c)) is the standard uncertainty that considers contributions from all important uncertainty sources by combining the relevant uncertainty components, and it was calculated as shown in Equation (5). The expanded uncertainty provides the range of an analyte concentration believed to be spread at a higher confidence level. The expanded uncertainty (U) is calculated by multiplying the combined standard uncertainty by “k”, which is equal to 2 at 95% confidence level [39]. In this study, the uncertainty sources were defined first; then, the uncertainty of each parameter was determined, and finally, the combined Uc(y) and expanded uncertainties (U) were calculated.
u ( c ) = u c a l i b r a t i o n 2 + u S I 2 + u R e c o v e r y 2

3. Results and Discussion

3.1. Optimization Studies

For the extraction of targeted UVFs from sludge samples, the QuEChERS methodology was adopted for the in-port derivatization and the extract obtained was dissolved in 1000 µL ethyl acetate (EtAc) instead of hexane. In a previous study carried out in this lab, in-port derivatization conditions were optimized for a wide range of UVFs extracted from surface water via vortex-assisted dispersive liquid–liquid microextraction based on the solidified floating organic droplet (VA-DLLME-SFOD) technique. It was determined that the injection temperature was a statistically significant factor and the optimal temperature was determined to be 260 °C [37]. The effect of injection temperature for the studied UVFs in sludge samples was further studied to see any deviation from the optimal conditions determined. The temperature varied between 260–320 °C, and the peak areas are given in Figure 2.
As can be deduced from the figure, even though the mean peak areas of the UVFs are not substantially different from each other for the studied injection temperatures, a slight decrease was observed for 300 °C. However, this injection temperature was chosen for further studies since the carry-over effect occurred in samples up to 290 °C. The sharp peaks in UVFs with injection port derivatization, after QuEChERS, of the spiked sludge sample were obtained, as shown in Figure 3.

3.2. Validation Studies

The linearity and linear range of a method should unequivocally be determined for any analytical method. It is a fact that the lowest concentration of the calibration curve should be very close to the LOQ value for the accurate analysis of analytes with known precision at an LOQ-level concentration. Table 3 depicts the linear equations for the working range of 40–1200 ng g−1 with correlation coefficients close to unity (R2 > 0.9970).
LOQ is defined as the lowest concentration that can be measured with acceptable precision (20% RSD) and accuracy [40,41,42,43,44,45]. Three different methods are used to determine the LOQ value. The most common approach for LOQ calculation in chromatographic analysis is the signal-to-noise ratio (S/N) [45]. This ratio can be defined as the difference between the height of the analyte peak (signal) and the highest and lowest points of the baseline (noise) in each area around the signal. For LOQ, S/N usually needs to be at least equal to 10. In the second method, a specific calibration curve should be studied using samples containing an analyte in the range of the LOQ. The residual standard deviation of a regression line or the standard deviation of the y-intercepts of regression lines may be used as the standard deviation [39]. The third approach is the concentration corresponding to a response 10 times greater than the SD of the analysis at the minimum concentration [37,41,45].
The LOD and LOQ values were calculated based on the S/N = 3 approach and S/N = 10, respectively. The LOQ values calculated using this method were found to be in agreement with previous studies on the analysis of UVFs in sludge [17,24,26]. In-port derivatization provides lower detection limits by converting polar analytes to more volatile compounds, as reported earlier [46,47,48]. For most of the compounds, the LOQ is close to or less than the lowest concentration level of the calibration curve. The RSD% values obtained in this study are below 25% as seen in Table 4.
The recoveries were in the range of 66%–23% as depicted in Table 5. Although, the recoveries are almost the same as the results obtained in other studies [17,24,26,31], our method provides certain advantages such as the lack of special apparatus and comparatively shorter analysis times.

3.3. Measurement Uncertainty

Here, the main uncertainty components such as ucalibration, uSI and uRecovery were calculated for the analysis of two different UVF concentrations, as given in Table 6. The uncertainty of the QuEChERS-GC–MS/MS method for UVFs is between 13.2–47.4% at a concentration of 300 ng g−1 and between 6.9–43.6% at a concentration of 600 ng g−1, which are quite satisfactory in such a complex matrix. Uncertainties regarding the recovery and calibration curve were the largest source contributing to measurement uncertainty.

3.4. Comparison with Other Methods

The recovery values obtained for all analytes are similar to those of studies with laborious and expensive techniques. In some studies, recovery values at a single concentration were determined [21,22,27,36], while in others, recovery values at different concentrations were investigated [16,19,23,33]. Our results indicated that for 4-MBC, only at a high concentration (600 ng g−1) was the recovery value lower than that of the reported ones. Fortunately, good recovery values were obtained at lower concentrations. In addition, to the best of our knowledge, method validation for the analysis of 3-BC, EHS, HMS and IAMC in sludge was attained successfully. Analytes (EHS, HMS, BP-3) were derivatized using the in-port derivatization technique, which is fast, reliable and eco-friendly without being affected by the complexity of the matrix.
The LOD values of the selected UVFs in the spiked sludge sample ranged from 8 ng g−1 to 12.1 ng g−1. These limits are quite successful when compared to other studies (Table 7). The LOD values obtained for UVFs were lower than previous studies for 4-MBC, EHMC [23,27], BP-3 [23,36] and EDP [16]. On the other hand, the LOD values for 4-MBC [21,22,33], EHMC [16,21,22], BP-3 [19,27,33] and EDP [23] were higher.
The developed method was applied to sludge samples collected from a domestic wastewater treatment plant. The concentrations of UV filters were found to be 66.9, 161.9, 54.5, <LOQ and 79.9 ng g−1 for EHS, HMS, BP-3, EDP and EHMC, respectively. These results indicate that even in domestic wastewater sludge, high concentrations of UVFs could be found, and the sludge used for soil conditioning or fertilization purposes could raise environmental concerns.

4. Conclusions

In this study, eight different UVFs were extracted from sludge samples using a well-established QuEChERS methodology, and then, in-port derivatization was applied for more polar and less volatile analytes. The method combining QuEChERS and in-port derivatization, which ensures extra sensitivity, was shown to be accurate, reproducible and sensitive. This method also provided substantially reduced analysis time and solvent or chemical consumption compared to off-line derivatization. Method validation resulted in high recovery of UVFs (66–123%), meaning good accuracy; moreover, low inter-day RSD% (10.1–25.6) indicates high precision, and low values of LOD (<2.1 ng g−1) and LOQ (<40 ng g−1) show the sensitivity of the analysis for a matrix as complex as waste sludge. This study can be extended to the analysis of UVF degradation metabolites in sludge samples using QuEChERS with in-port derivatization followed by GC–MS/MS.

Author Contributions

C.Y. carried out the experiments, evaluation of results and preparation of the manuscript. F.N.E. and I.K. guided the experiments, edited the manuscript and evaluated the results. H.E. designed the experiments and guided the analysis. Research Assistant S.C.T. contributed to the analysis and experiments. All authors have read and agreed to the published version of the manuscript.

Funding

This research was funded by Dokuz Eylül University Scientific Research Projects (BAP) Coordination Unit] grant number [2021.KB.FEN.008].

Institutional Review Board Statement

Not applicable.

Informed Consent Statement

Not applicable.

Data Availability Statement

Not applicable.

Acknowledgments

We would like to thank Dokuz Eylül University Scientific Research Projects Coordination Unit (project number 2021.KB.FEN.008) for their financial support.

Conflicts of Interest

The authors declare no conflict of interest.

References

  1. Sabsevari, N.; Qiblawi, S.; Norton, S.; Fivenson, D. Sunscreens: UV filters to protect us: Part 1: Changing regulations and choices for optimal sun protection. Int. J. Women’s Dermatol. 2021, 7, 28–44. [Google Scholar] [CrossRef] [PubMed]
  2. Carve, M.; Allinson, G.; Nugegoda, D.; Shimeta, J. Trends in environmental and toxicity research on organic ultraviolet filters: A scientometric review. Sci. Total Environ. 2021, 773, 145628. [Google Scholar] [CrossRef] [PubMed]
  3. Ramos, S.; Homem, V.; Alves, A.; Santos, L. Advances in analytical methods and occurrence of organic UV-filters in the environment—A review. Sci. Total Environ. 2015, 526, 278–311. [Google Scholar] [CrossRef] [PubMed] [Green Version]
  4. Lambropoulou, D.A.; Giokas, D.L.; Sakkas, V.A.; Albanis, T.A.; Karayannis, M.I. Gas chromatographic determination of 2-hydroxy-4-methoxybenzophenone and octyldimethyl-p-aminobenzoic acid sunscreen agents in swimming pool and bathing waters by solid-phase microextraction. J. Chromatography. A 2002, 967, 243–253.5. [Google Scholar] [CrossRef] [PubMed]
  5. Rodil, R.; Quintana, J.B.; López-Mahía, P.; Muniategui-Lorenzo, S.; Prada-Rodríguez, D. Multi-residue analytical method for the determination of emerging pollutants in water by solid-phase extraction and liquid chromatography–tandem mass spectrometry. J. Chromatogr. A 2009, 1216, 2958–2969. [Google Scholar] [CrossRef]
  6. Jeon, K.; Chung, Y.; Ryu, J.-C. Simultaneous determination of benzophenone-type UV filters in water and soil by gas chromatography–mass spectrometry. J. Chromatogr. A 2006, 1131, 192–202. [Google Scholar] [CrossRef]
  7. Votani, A.; Chisvert, A.; Giokas, D.L. On-line extraction coupled to liquid chromatographic analysis of hydrophobic organic compounds from complex solid samples—Application to the analysis of UV filters in soils and sediments. J. Chromatogr. A 2020, 1610, 460561. [Google Scholar] [CrossRef]
  8. Li, M.; Sun, Q.; Li, Y.; Lv, M.; Lin, L.; Wu, Y.; Ashfaq, M.; Yu, C.-P. Simultaneous analysis of 45 pharmaceuticals and personalcare products in sludge by matrix solid-phase dispersion and liquid chromatography tandem mass spectrometry. Anal. Bioanal. Chem. 2016, 408, 4953–4964. [Google Scholar] [CrossRef]
  9. Camino-Sanchez, F.J.; Zafra-Gomez, A.; Dorival-Garcia, N.; Juarez-Jimenez, B.; Vilchez, J.L. Determination of selected parabens, benzophenones, triclosan and triclocarban in agricultural soils after and before treatment with compost from sewage sludge: A lixiviation study. Talanta 2016, 150, 415–424. [Google Scholar] [CrossRef]
  10. Sun, Q.; Li, M.; Ma, C.; Chen, X.; Xie, X.; Yu, C.-P. Seasonal and spatial variations of PPCP occurrence, removal and mass loading in three wastewater treatment plants located in different urbanization areas in Xiamen, China. Environ. Pollut. 2016, 208, 371–381. [Google Scholar] [CrossRef]
  11. Schlumpf, M.; Cotton, B.; Conscience, M.; Haller, V.; Steinmann, B.; Lichtensteiger, W. In vitro and in vivo estrogenicity of UV screens. Environ. Health Perspect. 2001, 109, 239–244. [Google Scholar] [CrossRef]
  12. Díaz-Cruz, M.S.; Barceló, D. Chemical analysis and ecotoxicological effects of organic UV-absorbing compounds in aquatic ecosystems. Trends Anal. Chem. 2009, 28, 708–716. [Google Scholar] [CrossRef]
  13. Fivenson, D.; Sabsevari, N.; Qiblawi, S.; Blitz, J.; Norton, B.B.; Norton, S.A.; Fivenson, D. Sunscreens: UV filters to protect us: Part 2-Increasing awareness of UV filters and their potential toxicities to us and our environment. Int. J. Women’s Dermatol. 2021, 7, 45–69. [Google Scholar] [CrossRef]
  14. European Commission. DIRECTIVE 2008/105/EC OF THE EUROPEAN PARLIAMENT AND OF THE COUNCIL of 16 December 2008 on Environmental Quality Standards in the Field of Water Policy, Amending and Subsequently Repealing Council Directives 82/176/EEC, 83/513/EEC, 84/156/EEC, 84/491/EEC, 86/280/EEC and Amending Directive 2000/60/ EC of the European Parliament and of the Council. European Union: Brussels, Belgium, 2008. Available online: http://eur-lex.europa.eu/LexUriServ/LexUriServ.do?uri=OJ:L:2008:348:0084:0097:EN:PDF (accessed on 1 October 2022).
  15. Directive, C. Council Directive 98/83/EC of 3 November 1998 on the Quality of Water Intended for Human Consumption. Off. J. Eur. Communities 1998, 32–53. Available online: https://eur-lex.europa.eu/legal-content/EN/TXT/?uri=CELEX:31998L0083 (accessed on 13 September 2022).
  16. Ramos, S.; Homem, V.; Santos, L. Development and optimization of a QuEChERS-GC–MS/MS methodology to analyse ultraviolet-filters and synthetic musks in sewage sludge. Sci. Total Environ. 2019, 651, 2606–2614. [Google Scholar] [CrossRef]
  17. Chisvert, A.; Benedé, J.L.; Salvador, A. Current trends on the determination of organic UV filters in environmental water samples based on microextraction techniques-A review. Anal. Chim. Acta 2018, 1034, 22–38. [Google Scholar] [CrossRef]
  18. Cadena-Aizaga, M.I.; Montesdeoca-Esponda, S.; Torres-Padrón, M.E.; Sosa-Ferrera, Z.; Santana-Rodríguez, J.J. Organic UV filters in marine environments: An update of analytical methodologies, occurrence and distribution. Trends Environ. Anal. Chem. 2020, 25, e00079. [Google Scholar] [CrossRef]
  19. Zhang, Z.; Ren, R.; Li, Y.-F.; Kunisue, T.; Gao, D.; Kannan, K. Determination of benzotriazole and Benzophenone UV Filters in sediment and sewage sludge Environmental Science and Technology. Environ. Sci. Technol. 2011, 45, 3909–3916. [Google Scholar] [CrossRef]
  20. Zhao, X.; Zhang, L.; Xu, L.; Liu, Y.; Song, W.W.; Zhu, F.J.; Li, Y.F.; Ma, W.L. Occurrence and fate of benzotriazoles UV filters in a typical residential wastewater treatment plant in Harbin, China. Environ. Pollut. 2017, 227, 215–222. [Google Scholar] [CrossRef]
  21. Plagellat, C.; Kupper, T.; Furrer, R.; de Alencastro, L.F.; Grandjean, D.; Tarradellas, J. Concentrations and specific loads of UV filters in sewage sludge originating from a monitoring network in Switzerland. Chemosphere 2006, 62, 915–925. [Google Scholar] [CrossRef]
  22. Kupper, T.; Plagellat, C.; Brändli, R.C.; de Alencastro, L.F.; Grandjean, D.; Tarradellas, J. Fate and removal of polycyclic musks, UV filters and biocides during wastewater treatment. Water Res. 2006, 40, 2603–2612. [Google Scholar] [CrossRef] [PubMed]
  23. Negreira, N.; Rodríguez, I.; Rubí, E.; Cela, R. Optimization of pressurized liquid extraction and purification conditions for gas chromatography–mass spectrometry determination of UV filters in sludge. J. Chromatogr. A 2011, 1218, 211–217. [Google Scholar] [CrossRef] [PubMed]
  24. Liu, Y.S.; Ying, G.-G.; Shareef, A.; Kookana, R.S. Simultaneous determination of benzotriazoles and ultraviolet filters in ground water, effluent and biosolid samples using gas chromatography–tandem mass spectrometry. J. Chromatogr. A 2011, 1218, 5328–5335. [Google Scholar] [CrossRef] [PubMed]
  25. Liu, Y.S.; Ying, G.G.; Shareef, A.; Kookana, R.S. Occurrence and removal of benzotriazoles and ultraviolet filters in a municipal wastewater treatment plant. Environ. Pollut. 2012, 165, 225–232. [Google Scholar] [CrossRef] [PubMed]
  26. Badia-Fabregat, M.; Rodriguez-Rodriguez, C.E.; Gago-Ferrero, P.; Olivares, A.; Pina, B.; Diaz-Cruz, M.S.; Vicent, T.; Barcelo, D.; Caminal, G. Degradation of UV filters in sewage sludge and 4-MBC in liquid medium by the ligninolytic fungus Trametes versicolor. J. Environ. Manag. 2012, 104, 114–120. [Google Scholar] [CrossRef]
  27. Gago-Ferrero, P.; Diaz-Cruz, M.S.; Barcelo, D. Occurrence of multiclass UV filters in treated sewage sludge from wastewater treatment plants. Chemosphere 2011, 84, 1158–1165. [Google Scholar] [CrossRef]
  28. Rodil, R.; Schrader, S.; Moeder, M. Pressurised membrane-assisted liquid extraction of UV filters from sludge. J. Chromatogr. A 2009, 1216, 8851–8858. [Google Scholar] [CrossRef]
  29. Rodríguez-Rodrígueza, C.E.; Barónc, E.; Gago-Ferreroc, P.; Jeli, A.; Llorcac, M.; Farréc, M.; Díaz-Cruz, M.S.; Eljarrat, E.; Petrović, M.; Caminala, G.; et al. Removal of pharmaceuticals, polybrominated flame retardants and UV-filters from sludge by the fungus Trametes versicolor in bioslurry reactor. J. Hazard. Mater. 2012, 233, 235–243. [Google Scholar] [CrossRef]
  30. Langford, K.H.; Reid, M.J.; Fjeld, E.; Øxnevad, S.; Thomas, K.V. Environmental occurrence and risk of organic UV filters and stabilizers in multiple matrices in Norway. Environ. Int. 2015, 80, 1–7. [Google Scholar] [CrossRef]
  31. Vela-Soria, F.; Iribarne-Durán, L.M.; Mustieles, V.; Jiménez-Díaz, I.; Fernández, M.F.; Olea, N. QuEChERS and ultra-high performance liquid chromatography–tandem mass spectrometry method for the determination of parabens and ultraviolet filters in human milk samples. J. Chromatogr. A 2018, 1546, 1–9. [Google Scholar] [CrossRef]
  32. Picot Groz, M.; Martinez Bueno, M.J.; Rosain, D.; Fenet, H.; Casellas, C.; Pereira, C.; Maria, V.; Bebianno, M.J.; Gomez, E. Detection of emerging contaminants (UV filters, UV stabilizers and musks) in marine mussels from Portuguese coast by QuEChERS extraction and GC-MS/MS. Sci. Total Environ. 2014, 493, 162–169. [Google Scholar] [CrossRef]
  33. Cerqueira, M.B.R.; Guilherme, J.R.; Caldas, S.S.; Martins, M.L.; Zanella, R.Z.; Primel, E.G. Evaluation of the QuEChERS method for the extraction of pharmaceuticals and personal care products from drinking-water treatment sludge with determination by UPLC-ESI-MS/MS. Chemosphere 2014, 107, 74–82. [Google Scholar] [CrossRef]
  34. Herrero, P.; Borrull, F.; Pocurull, E.; Marcé, R.M. A quick, easy, cheap, effective, rugged and safe extraction method followed by liquid chromatography-(Orbitrap) high resolution mass spectrometry to determine benzotriazole, benzothiazole and benzenesulfonamide derivates in sewage sludge. J. Chromatogr. A 2014, 1339, 34–41. [Google Scholar] [CrossRef]
  35. Gago-Ferreroa, P.; Mastroiannia, N.; Díaz-Cruz, M.S.; Barceló, D. Fully automated determination of nine ultraviolet filters and transformation products in natural waters and wastewaters by on-line solid phase extraction–liquid chromatography–tandem mass spectrometry. J. Chromatogr. A 2013, 1294, 106–116. [Google Scholar] [CrossRef]
  36. Wick, A.; Fink, G.; Ternes, T.A. Comparison of electrospray ionization and atmospheric pressure chemical ionization for multi-residue analysis of biocides, UV-filters and benzothiazoles in aqueous matrices and activated sludge by liquid chromatography–tandem mass spectrometry. J. Chromatogr. A 2010, 1217, 2088–2103. [Google Scholar] [CrossRef]
  37. Yücel, C.; Ertaş, H.; Ertaş, F.N.; Karapinar, İ. Determination of UV Filters in Surface Water by VA-DLLME-SFOD Technique Coupled with GC–MS/MS. Clean–Soil Air Water 2022, 50, 2100246. [Google Scholar] [CrossRef]
  38. Peters, F.T.; Drummer, O.H.; Musshoff, F. Validation of new methods. Forensic Sci. Int. 2007, 165, 216–224. [Google Scholar] [CrossRef]
  39. EURACHEM / CITAC Guide CG 4 Quantifying Uncertainty in Analytical Measurement. 2012. Available online: https://www.eurachem.org/images/stories/Guides/pdf/QUAM2012_P1.pdf (accessed on 10 August 2022).
  40. Simões, N.G.; Cardoso, V.V.; Ferreira, E.; Benoliel, M.J.; Almeida, C.M.M. Experimental and statistical validation of SPME-GC–MS analysis of phenol and chlorophenols in raw and treated water. Chemosphere 2007, 68, 501–510. [Google Scholar] [CrossRef]
  41. Eurachem Guide. The Fitness for Purpose of Analytical Methods—A Laboratory Guide to Method Validation and Related Topics; Eurachem Guide: Zug, Switzerland, 2014. [Google Scholar]
  42. Shah, V.P.; Midha, K.K.; Dighe, S.; McGilveray, I.J.; Skelly, J.P.; Yacobi, A.; Layloff, T.; Viswanathan, C.T.; Cook, C.E.; McDowall, R.D.; et al. Analytical methods validation: Bioavailability, bioequivalence and pharmacokinetic studies. J. Pharm. Sci. 1992, 81, 588–592. [Google Scholar]
  43. Shah, V.P.; Midha, K.K.; Findlay, J.W.; Hill, H.M.; Hulse, J.D.; McGilveray, I.J.; McKay, G.; Miller, K.J.; Patnaik, R.N.; Powell, M.L.; et al. Bioanalytical method validation—A revisit with a decade of progress. Pharm. Res. 2000, 17, 1551–1557. [Google Scholar] [CrossRef]
  44. Food and Drug Administration, Q2B Validation of Analytical Procedures: Methodology. Available online: https://www.fda.gov/regulatory-information/search-fda-guidance-documents/q2b-validation-analytical-procedures-methodology (accessed on 25 September 2022).
  45. European Medicines Agency. ICH Topic Q 2 (R1) Validation of Analytical Procedures: Text and Methodology; CPMP/ICH/381/95; European Medicines Agency: London, UK, 1995.
  46. Pan, L.; Pawliszyn, J. Derivatization/Solid-Phase Microextraction: New, Approach to Polar Analytes. Anal. Chem. 1997, 69, 196–205. [Google Scholar] [CrossRef]
  47. Basheer, C.; Lee, K. Analysis of endocrine disrupting alkylphenols, chlorophenols and bisphenol-A using hollow fiber-protected liquid-phase microextraction coupled with injection port-derivatization gas chromatography–mass spectrometry. J. Chromatogr. A 2004, 1057, 163–169. [Google Scholar] [CrossRef] [PubMed]
  48. Bizkarguenaga, E.; Iparragirre, A.; Navarro, P.; Olivares, M.; Prieto, A.; Vallejo, A.; Zuloaga, O. In-port derivatization after sorptive extractions-Review. J. Chromatogr. A 2013, 1296, 36–46. [Google Scholar] [CrossRef] [PubMed]
Figure 1. Schematic illustration of the whole procedure.
Mps 05 00092 g001
Figure 2. The effect of injection temperature on peak areas of UVFs.
Mps 05 00092 g002
Figure 3. Chromatograms of the UV filters in sewage sludge spiked with UVFs at 300 ng g−1.
Mps 05 00092 g003
Table 1. Chemical Structures, IUPAC names and NOEC concentration of selected UVFs.
Mps 05 00092 i001
3-BC: 3-benzyline camphor
(3-benzylidene-1,7,7-trimethylbicyclo [2.2.1] heptan-2-one)
NOEC: 0.022 mg L−1
Mps 05 00092 i002
BP-3: benzophenone-3
(2-hydroxy-4-methoxy phenyl)-phenyl methanone
NOEC > 0.01 mg L−1
Mps 05 00092 i003
EDP: 2-ethyl hexyl-4-(dimethylamino) benzoate
NOEC: 0.012 mg L−1
Mps 05 00092 i004
EHMC: 2-ethyl-hexyl-4-trimethoxy cinnamate
NOEC: 0.003 mg L−1
Mps 05 00092 i005
EHS: 2-ethylhexyl 2-hydroxybenzoate (ethylhexylsalicylate)
NOEC: 0.008 mg L−1
Mps 05 00092 i006
HMS: 3,3,5-trimethylcyclohexyl 2-hydroxybenzoate (Homosalate)
NOEC: 0.005 mg L−1
Mps 05 00092 i007
IAMC: isoamyl p-methoxy cinnamate
(3-methylbutyl (2E)-3-(4-methoxyphenyl) acrylate)
NOEC: 0.013 mg L−1
Mps 05 00092 i008
4-MBC: 4-methylbenzylidene camphor
NOEC: 0.008 mg L−1
Table 2. Experimental GC–MS/MS parameters of UVFs.
UVFsRt
(min)
MW
(g mol−1)
Parent Ions
(m/z)
Product Ions
(m/z)
CE
(eV)
3-BC14.443240.35240.0149.2
225.1
92.10
5
9
12
EHS14.452250.34195.0177.0
159.0
75.00
15
25
30
HMS15.610262.36195.0177.0
159.0
75.00
15
25
27
IAMC15.737248.32178.1
161.0
161.1
133.0
15
10
4-MBC16.120254.37254.0239.0
105.0
15
25
BP-316.527228.25285.0242.025
EDP19.014277.41277.0
148.0
165.0
164.9
104.2
148.6
10
30
32
EHMC19.501290.41161.0
178.0
290.0
133.1
133.1
178.1
8
22
6
Table 3. Analytical merits of the GC–MS/MS method coupled with QuEChERS for UVF determination in sludge samples.
Analytea *b *R2LOD (ng g−1)LOQ (ng g−1)
3-BC30.154−591.40.999110.139.6
EHS888.02−23,9000.998710.033.3
HMS515.64−11,4240.99849.9033.0
IAMC170.2−285.30.99969.5031.8
4-MBC24.748−159.20.99978.0026.7
BP−3276.81−10,0990.99804.3014.1
EDP214.00−12900.999612.140.2
EHMC204.46−33670.99708.0026.8
* Y = ax + b.
Table 4. Intra-day (n = 3) and inter-day (n = 2) relative standard deviations (RSD%) calculated for the UVFs.
UVFsIntra-Day RSD% (n = 3)Inter-Day RSD% (n = 2)
80 ng g−1300 ng g−1600 ng g−180 ng g−1300 ng g−1600 ng g−1
3-BC4.38.73.210.89.17.1
EHS9.99.717.210.910.919.3
HMS13.112.121.919.813.725.6
IAMC5.28.23.415.117.919.8
4-MBC4.08.13.210.110.77.2
BP-316.211.613.617.713.715.5
EDP4.911.22.315.014.415.4
EHMC9.212.93.422.615.918.8
Table 5. Recoveries of UVFs from sludge samples spiked with different concentrations.
UVFs% Recovery ± RSD (n = 3)
80 ng g−1300 ng g−1600 ng g−1
3-BC115 ± 4.4993 ± 10.198 ± 4.03
EHS113 ± 6.8398 ± 10.296 ± 7.34
HMS87 ± 11.1109 ± 12.5104 ± 25.8
IAMC121 ± 2.70118 ± 8.80113 ± 4.70
4-MBC97 ± 2.3575 ± 9.1266 ± 3.05
BP-388 ± 18.187 ± 14.966 ± 14.7
EDP106 ± 2.25103 ± 12.1103 ± 3.21
EHMC123 ± 7.49108 ± 14.4107 ± 4.43
Table 6. Expanded uncertainties of QuEChERS followed by the in-port derivatization method for studied UVFs.
UV FilterDescriptionValue (ng g−1)xStandard Uncertainty u(x)Relative Standard
Uncertainty u(x)
300600300600300600
EHSRepeatability110.05590.08600.05590.0860
Bias (recovery)0.87000.99480.03360.05820.03850.0585
Calibration30060014.85515.0750.04950.0251
u(c) 0.08410.1070
Expanded U(x) 0.16810.2139
HMSRepeatability110.06960.12670.06960.12673
Bias (recovery)0.83670.91830.17190.09390.20540.1022
Calibration30060016.82617.07570.05610.0284
u(c) 0.22410.1653
Expanded U(x) 0.44810.3306
3-BCRepeatability110.05020.01820.05020.0182
Bias (recovery)0.90640.92940.03610.02680.03980.0288
Calibration30060012.63412.8220.04210.0214
u(c) 0.07670.0403
Expanded U(x) 0.15340.0805
IAMCRepeatability110.04730.01980.04730.0198
Bias (recovery)0.96530.95270.06770.07560.07020.0793
Calibration3006008.29348.29340.02760.0138
u(c) 0.08900.0829
Expanded U(x) 0.17800.1658
4-MBCRepeatability1.000010.04650.01850.04650.0185
Bias (recovery)0.64230.62570.02620.01670.04080.0266
Calibration3006006.68346.78250.02230.0113
u(c) 0.06570.0343
Expanded U(x) 0.13150.0687
BP-3Repeatability110.06700.07840.06700.0784
Bias (recovery)0.84260.64350.05070.03420.06020.0531
Calibration30060018.704918.98210.06230.0316
u(c) 0.10960.0998
Expanded U(x) 0.21910.1997
EDPRepeatability110.06450.01350.06450.0135
Bias (recovery)0.86900.90330.04770.05050.05480.0559
Calibration30060014.164114.37410.04720.0240
u(c) 0.09700.0623
Expanded U(x) 0.19390.1246
EHMCRepeatability110.07470.01930.07470.0193
Bias (recovery)0.755256,8470.15891.21190.21040.2132
Calibration30060023.979224.33410.07990.0406
u(c) 0.23710.2179
Expanded U(x) 0.47430.4357
Table 7. Comparison of QuEChERS method with previous microextraction studies in sludge samples.
UV FiltersExtraction MethodInstrumental MethodLOD
(ng g−1)
Recovery (%)RSD%References
4-MBC
OC
EHMC
ODP
BP-3
BP-1
4HB
4DHB
PLEUPLC-MS/MS12
18
19
0.2
1.0
60
5.0
5.0
102
70
90
85
70
30
95
96
16–10
4–9
5–10
7
5–9
9–14
4–11
3–6
[27]
EHS
HMS
IAMC
BP-3
4-MBC
EDP
EHMC
OC
PLE + SPEGC–MS17 *
34 *
34 *
61 *
26 *
22 *
24 *
33 *
95–101
78–96
80–107
89–106
79–86
88–93
73–90
84–85
7
5–6
4–6
6–11
4–5
6–7
5
5–12
[23]
BP-1
BP-2
BP-3,
BP-4
PBSA
PLELC-MS/MS2.5 *
2.5 *
25 *
5 *
5 *
74 ± 9
99 ± 11
104 ± 14
114 ± 28
118 ± 19
9
11
14
28
19
[36]
BP-1,
BP-2
BP-3
BP-8
1H-BT
5Me-1H-BT
TBHPBT
4-OH-HB
LLE + SPELC-MS/MS0.41
0.67
0.67
0.41
0.67
0.67
0.1
0.41
38.3–1163.14–13.8[19]
4-MBC
EHMC
OC
LLE-SPEGC-MS4
3
6
94.6
101.2
87.5
13.1
10.5
7.5
[21]
4-MBC
EHMC
OC
LLE-SPEGC–MS4
3
6
95
101
87
2
13
7
[22]
BP
BP-3
4-MBC
QuEChERSUPLC-MS/MS0.3
0.3
0.6
63–82
60–86
86–95
0.1–1.0
0.2–0.5
0.1–6.0
[33]
BP
4-MBC
EDP
EHMC
OC
QuEChERSGC-MS/MS26
59
31
5
6
92–101
85–88
82–86
113–125
81–94
2–6
2–7
1–2
1–5
3–5
[16]
3-BC
EHS
HMS
IAMC
4-MBC
BP3
EDP
EHMC
QuEChERSGC–MS/MS10.1
10.0
9.90
9.5
8.00
4.30
12.1
8.00
93–115
96–113
87–109
113–121
66–97
66–88
103–106
107–123
3.2–10.8
9.7–19.3
12.1–25.6
3.4–19.8
3.2–10.7
13.6–16.2
2.3–15.4
3.4–22.6
This study
1H-BT: 1H-benzotriazole, 5Me-1H-BT: 5-methyl-1H-benzotriazole, TBHPBT: 2-(5-t-butyl-2-hydroxyphenyl) benzotriazole, 4-OH-HB: 4-hydroxy benzophenone. * LOQ values.
Publisher’s Note: MDPI stays neutral with regard to jurisdictional claims in published maps and institutional affiliations.

