Synthesis of Quenchbodies for One-Pot Detection of Stimulant Drug Methamphetamine


Abstract
:
1. Introduction
2. Experimental Design
2.1. Materials
- KOD-Plus-Neo DNA polymerase (Toyobo, Osaka, Japan; Cat. No.: TOKOD-401)
- Midori Green advance nucleic acid staining solution (Nippon Genetics, Tokyo, Japan; Cat. No.: MG04)
- In-Fusion HD cloning kit (Toyobo, Osaka, Japan; Cat. No.: 639650)
- Restriction enzymes (NdeI-HF, and BamHI-HF) (NEB, Tokyo, Japan; Cat. Nos.: R3131, R3136)
- Bacto Tryptone (BD Difco, NJ, USA; Cat. No.: 211705)
- Bacto Yeast Extract (BD Difco, NJ, USA; Cat. No.: 212750)
- Sodium Chloride (Wako, Osaka, Japan; Cat. No.: 191-01665)
- LB Agar (BD Difco, NJ, USA; Cat. No.: 214010)
- Ampicillin sodium (Wako, Osaka, Japan; Cat. No.: 014-23302)
- Sodium phosphate dibasic anhydrous (Wako, Osaka, Japan; Cat. No.: 194-02875)
- Sodium phosphate monobasic dihydrate (Wako, Osaka, Japan; Cat. No.: 199-02825)
- Imidazole (Wako, Osaka, Japan; Cat. No.: 095-00015)
- Potassium chloride (Wako, Osaka, Japan; Cat. No.: 160-03555)
- Plasmid Miniprep kit (Promega, Tokyo, Japan; Cat. No.: A1223)
- SHuffle T7 Express LysY Competent Cells (New England Biolabs, Tokyo, Japan; Cat. No.: C3030)
- Isopropyl β-D-1-thiogalactopyranoside (Wako, Osaka, Japan; Cat. No.: 090-05146)
- Centrifugal filter tube Ultra-4, MWCO 3 k (Millipore, Tokyo, Japan; Cat. No.: UFC800396)
- Immobilized Tris(2-carboxyethyl)-phosphine (TCEP) disulfide-reducing gel (Pierce Biotechnology, Thermo Fisher Scientific, Rockford, IL, USA; Cat. No.: 77712)
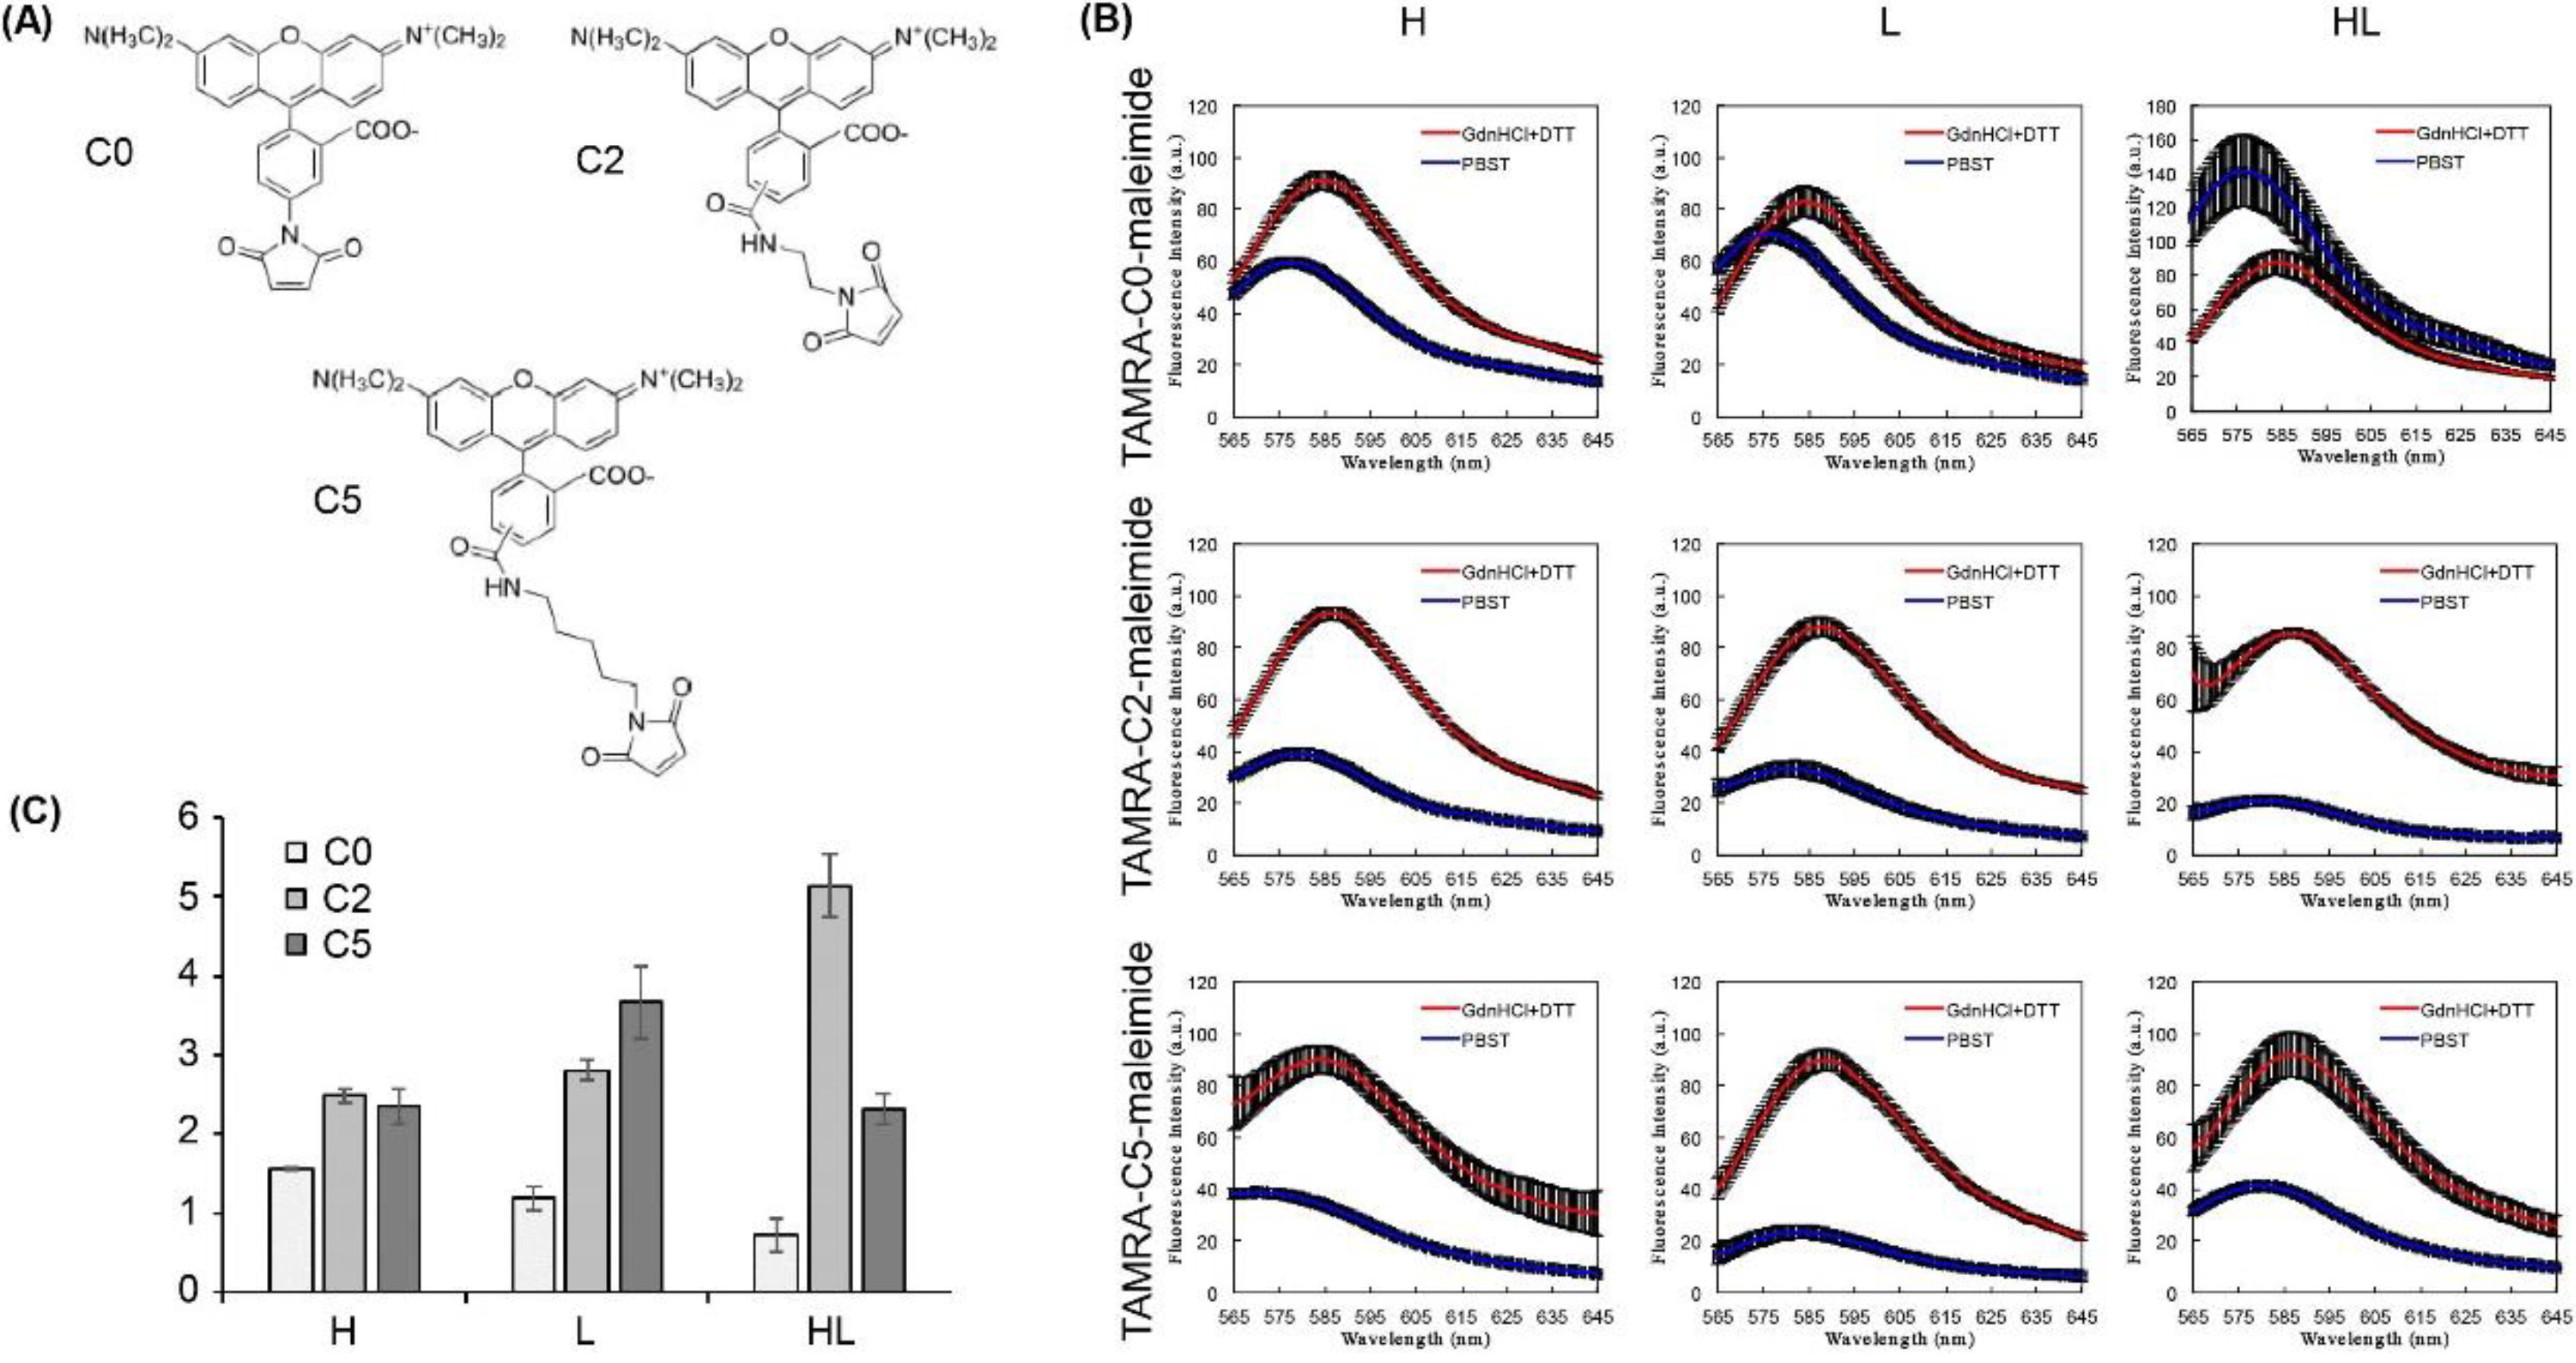
- TAMRA-C0-maleimide (AnaSpec, Fremont, CA, USA; Cat. No..: AS-81445)
- TAMRA-C2-maleimide (AnaSpec, Fremont, CA, USA; Cat. No.: AS-81441-5)
- TAMRA-C5-maleimide (Biotium, Hayward, CA, USA; Cat. No.: 91040)
- Ni Sepharose High Performance IMAC resin (GE Healthcare, Piscataway, NJ, USA; Cat. No.: 17526801)
- Empty gravity flow column (Bio-Rad, Hercules, CA, USA; Cat. No.: 7321010)
- Empty spin columns (Bio-Rad, Hercules, CA, USA; Cat. No.: 7326204)
- Anti DYKDDDDK-tag antibody beads (Wako, Osaka, Japan; Cat. No.: 012-22781)
- DYKDDDDK peptide (Wako, Osaka, Japan; Cat. No.: 040-30953)
- Bovine serum albumins (Sigma-Aldrich, Tokyo, Japan; Cat. No.: A2153)
- Unstained protein standards (Bio-Rad, Hercules, CA, USA; Cat. No.: 1610396)
- Dual color protein standards (Bio-Rad, Hercules, CA, USA; Cat. No.: 1610374)
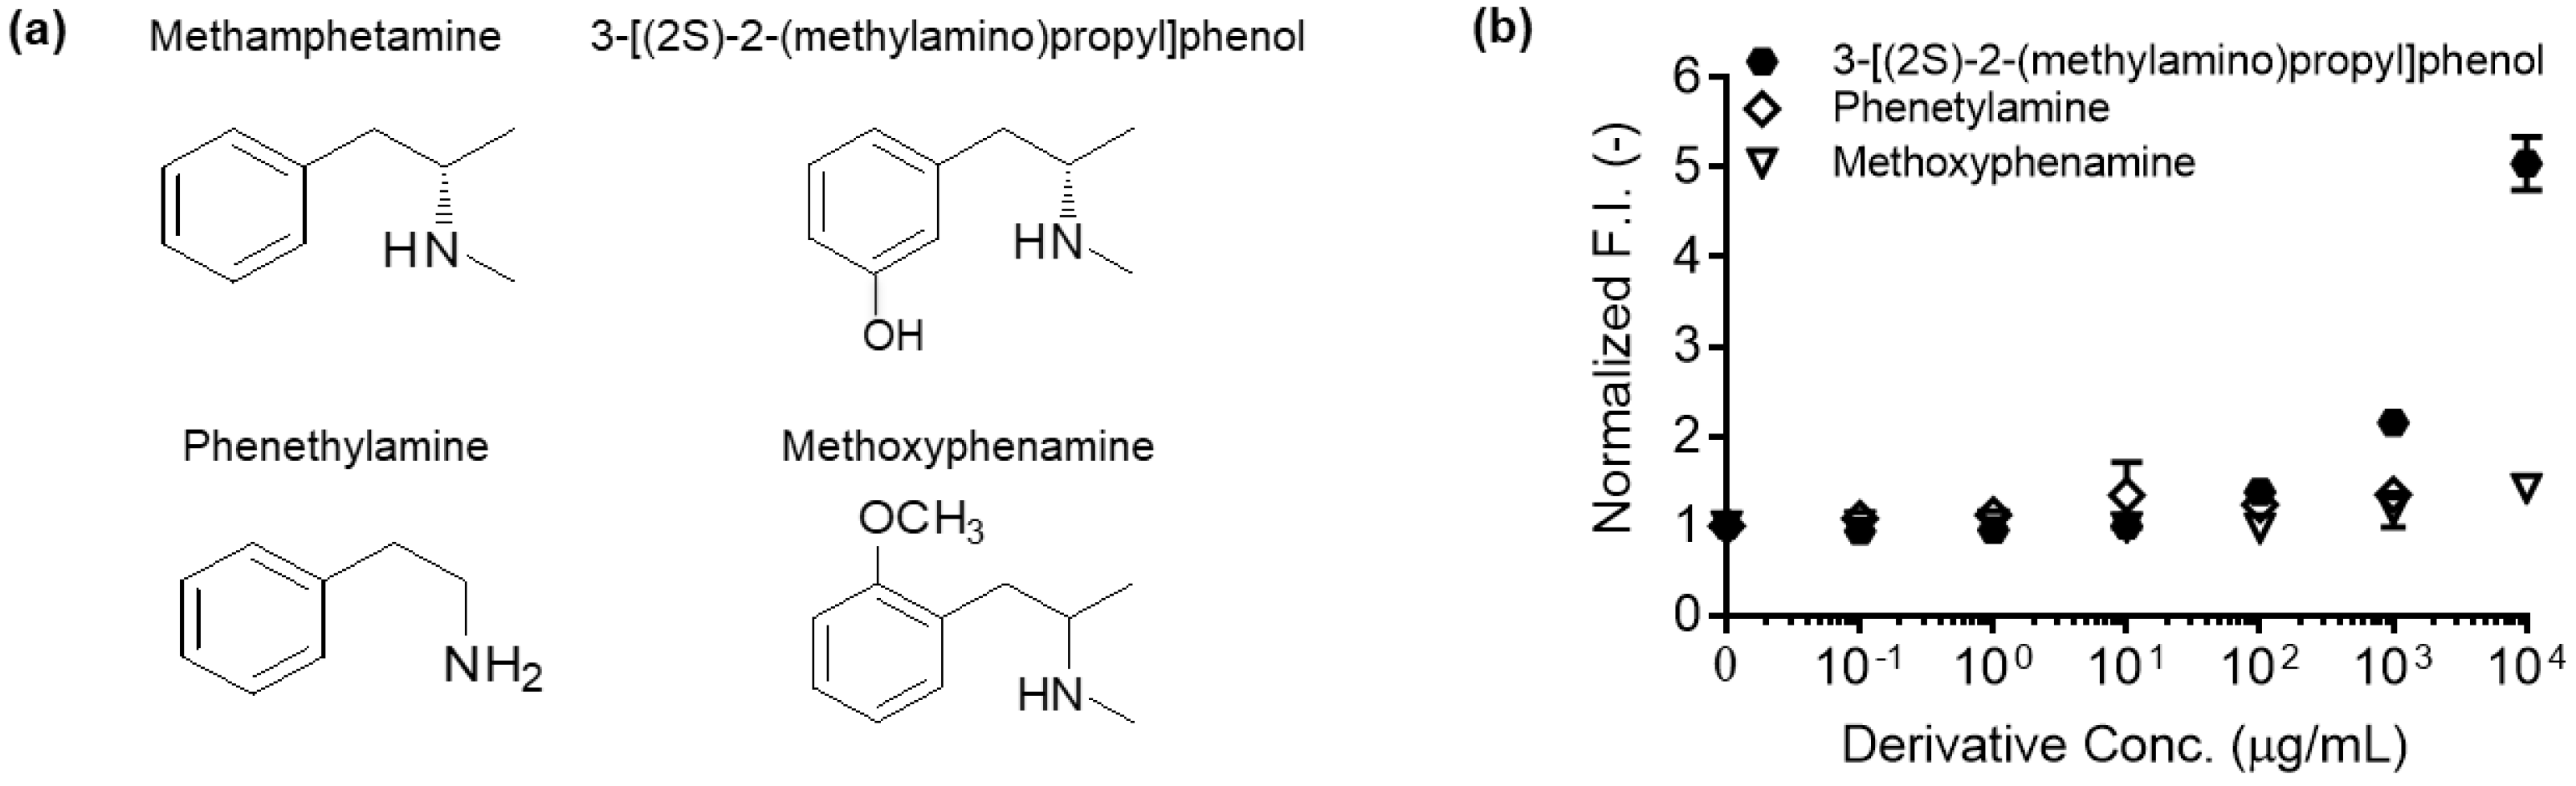
- 3-[(2S)-2-(methylamino)propyl]phenol (NetChem, New Brunswick, NJ).
- Phenethylamine (Sigma-Aldrich, Tokyo, Japan; Cat. No.: 128945)
- Methoxyphenamine (Sigma-Aldrich, Tokyo, Japan; Cat. No.: M1641)
2.2. Equipment
- Gel electrophoresis (GELmieru) (Wako, Osaka, Japan; Cat. No.: 290-33891)
- Thermal cyclers for PCR (T100 Thermal Cycler) (Bio-Rad, Hercules, CA, USA; Cat. No.: 1861096)
- Nanodrop (Optizen NanoQ Lite) (KLab, Daejeon, Korea; Cat. No.: S23-3269-031)
- Shaking incubator (Shaking Incubator) (Haneul Techpia; Seoul, Korea; Cat. No.: SI-600R)
- Sonicator (VC750 Ultrasonic Processor) (Sonics&Materials, Newtown, CT, USA; Cat. No.: CV-750)
- Centrifuge with a swinging-bucket rotor (Centrifuge: Combi 514R, Swing rotor: S750T-4B) (Hanil Science, Daejeon, Korea; Cat. No: Combi-514R)
- UV-visible spectrophotometer (Vis Spectrophotometer) (Human Corporation, Seoul, Korea; Cat. No.: X-MA1200V)
- Water bath (High precision Water-Bath) (Changshin Science, Seoul, Korea; Cat. No.: C-AWBP)
- Fluorescence spectrophotometer (FP-8500) (JASCO, Tokyo, Japan; Cat. No.: FP-8500DS)
3. Procedure
3.1. DNA Cloning (Time for Completion: 14 Days)
3.1.1. Construction of H1L0-Type Anti-MA Q-body Expression Gene
- Prepare 10 µM diluted DNA primer solutions by mixing 10 µL of 100 µM primer stock with 90 µL ultrapure water. The primer sequences for inserting the anti-MA Fab DNA sequences with the N-terminal Cys-tag into a pUQ1H is Fw-primer for the H chain of Fab (Fd): ProxNdeBack (AAGGAGATATACAtATGTCTAAACAAATCGAAG), Rv-primer for Fd: CH1ForOverlap (ATATCTCCTTCTAGATTATTACTTGTCATCGTCG), Fw-primer for Lch: OverlapProxBack (TCTAGAAGGAGATATCACATGTCTAAACAAATCGAAG), and Rv-primer for Lch: CLforBamHI (CTTGTAGTCGGATCCTTATTAATGATGATGATGATGATGAG)
- Prepare reaction mix in ice as follows for amplifying H chain of MeM9: 5 µL of dNTPs, 1 µL of 10 µM Fw-primer for Fd, 1 µL of 10 µM Rv-primer for Fd, 50 ng DNA template (tgcHchain) (Table 1), 3 µL of MgSO4, 5 µL of Enzyme buffer, 1 µL of KOD-Plus Neo enzyme, and ultrapure water up to 50 µL.
- Prepare reaction mix in ice as follows for amplifying L chain of MeM9: 5 µL of dNTPs, 1 µL of 10 µM ProxNdeBack, 1 µL of 10 µM CLforBamHI, 50 ng DNA template (tttLchain) (Table 1) 3 µL of MgSO4, 5 µL of Enzyme buffer, 1 µL of KOD-Plus Neo enzyme, and ultrapure water up to 50 µL.
- Combine each mixture in ice in 0.2 mL PCR tube, mix gently and centrifuge briefly (1 s, RT).
![Mps 03 00043 i001]() CRITICAL STEP It is important to use DNA polymerase with proofreading activity to minimize DNA amplification error.
CRITICAL STEP It is important to use DNA polymerase with proofreading activity to minimize DNA amplification error. - Use the following conditions to amplify the DNA fragments: 94 °C for 2 min, [98 °C for 10 s, Tm for 30 s, 68 °C for 30 s] × 35, hold at 25 °C.
- Prepare a 1.5% (wt/vol) agarose gel in TAE buffer (40 mM Tris, 20 mM acetic acid and 1 mM EDTA) with Midori Green DNA Gel Stain diluted 1:20,000 (5 µL of dye in 100 mL of TAE).
- Mix 3 µL of the PCR product with 0.6 µL of 5× gel loading dye and separate by running the gel at 15 V/cm for 30 min. Load 3 µL of 1 kb Plus DNA ladder on the same gel. Then, visualize the DNA fragments using a gel imaging system. The expected PCR product size for H chain is 800 bp and for L chain is 777 bp.
- Use a NucleoSpin PCR Clean-Up kit according to the manufacturer’s instructions to purify the PCR products.
- Measure the DNA concentration using UV absorbance on a spectrophotometer (Nanodrop)
- Prepare reaction mix in ice as follows for combine H chain and L chain: 5 µL of dNTPs, 1 µL of 10 µM Fw-primer for Fd, 1 µL of 10 µM Rv-primer for Lch, 50 ng purified H chain 50 ng purified L chain, 3 µL of MgSO4, 5 µL of Enzyme buffer, 1 µL of KOD-Plus Neo enzyme, and ultrapure water up to 50 µL.
- To ligate the combined Fab fragment into the pUQ1H vector, digest the pUQ0H1L(DON)[15] with NdeI and BamHI restriction enzymes using the following mixture: 1 µg DNA, 5 µL NEB CutSmart Buffer (10×), 1 µL of NdeI-HF (20 U), 1 µL of BamHI-HF (20 U), and ultrapure water up to 50 µL. After that, incubate the digestion mixture at 37 °C for 1 h. Cool the mixture to 4 °C.
- Separate the digested pUQ1H DNA vector using a 0.7% (wt/vol) agarose gel at 15 V/cm for 30 min. The expected DNA size for pUQ1H vector is 5404 bp.
- Extract the desired band and purify it using a NucleoSpin Gel Clean-Up Kit according to the manufacturer’s instructions.
- Measure the DNA concentration using UV absorbance.
- Clone the Fab DNA into the pUQ1H vector by setting up the following ligation reaction: 2 µL of Infusion enzyme, 10 ng of insert DNA (Fab), and 10 ng of vector DNA (pUQ1H).
- Gently mix the reactions and incubate at 50 °C for 150 min. Then, chill the mixture on ice.
- Transfect the ligation reaction into DH5a chemically competent cells by first thawing the cells (100 µL per vial for each transfection) on ice. Add 10 µL of the ligated mixture from Step 14 to the cells and incubate the mixture for 30 min on ice. After that, incubate the cells for 45 s at 42 °C, and then immediately chill the cells on ice. Add 500 µL of LB medium (10 g Tryptone, 5 g Yeast Extract, 10 g NaCl and ultrapure water up to 1 L) to the cells and incubate them for 1 h at 37 °C with vigorous shaking (200 rpm). Spin it at 10,000 g for 10 min at room temperature in a microcentrifuge and remove 400 µL of the supernatant. After pipetting, spread the cells on pre-warmed LB plate (10 g Tryptone, 5 g Yeast Extract, 10 g NaCl, 15 g Agar and ultrapure water up to 1L) containing 100 µg/mL ampicillin, and then, incubate the plate overnight at 37 °C. Inspect the LB plate for colony formation. Normally, tens of colonies of Fab DNA inserted into pUQ1H is expected on a cloning plate.
- Use a sterile pipette tip to inoculate five single colonies into five tubes each containing 4 mL of LB medium supplemented with 100 µg/mL ampicillin. Incubate the culture tubes at 37 °C with vigorous shaking (200 rpm) overnight.
- Use a plasmid DNA purification kit to isolate plasmid DNA from the 4 mL of bacterial culture.
![Mps 03 00043 i002]() PAUSE STEP Plasmid DNA can be stored for several years at −20 °C.
PAUSE STEP Plasmid DNA can be stored for several years at −20 °C. - Confirm the presence of Fab DNA by Sanger sequencing using T7 promoter-Fw (TAATACGACTCACTATAGGG) and T7 terminater-Rv (GCTAGTTATTGCTCAGCGG) primers.

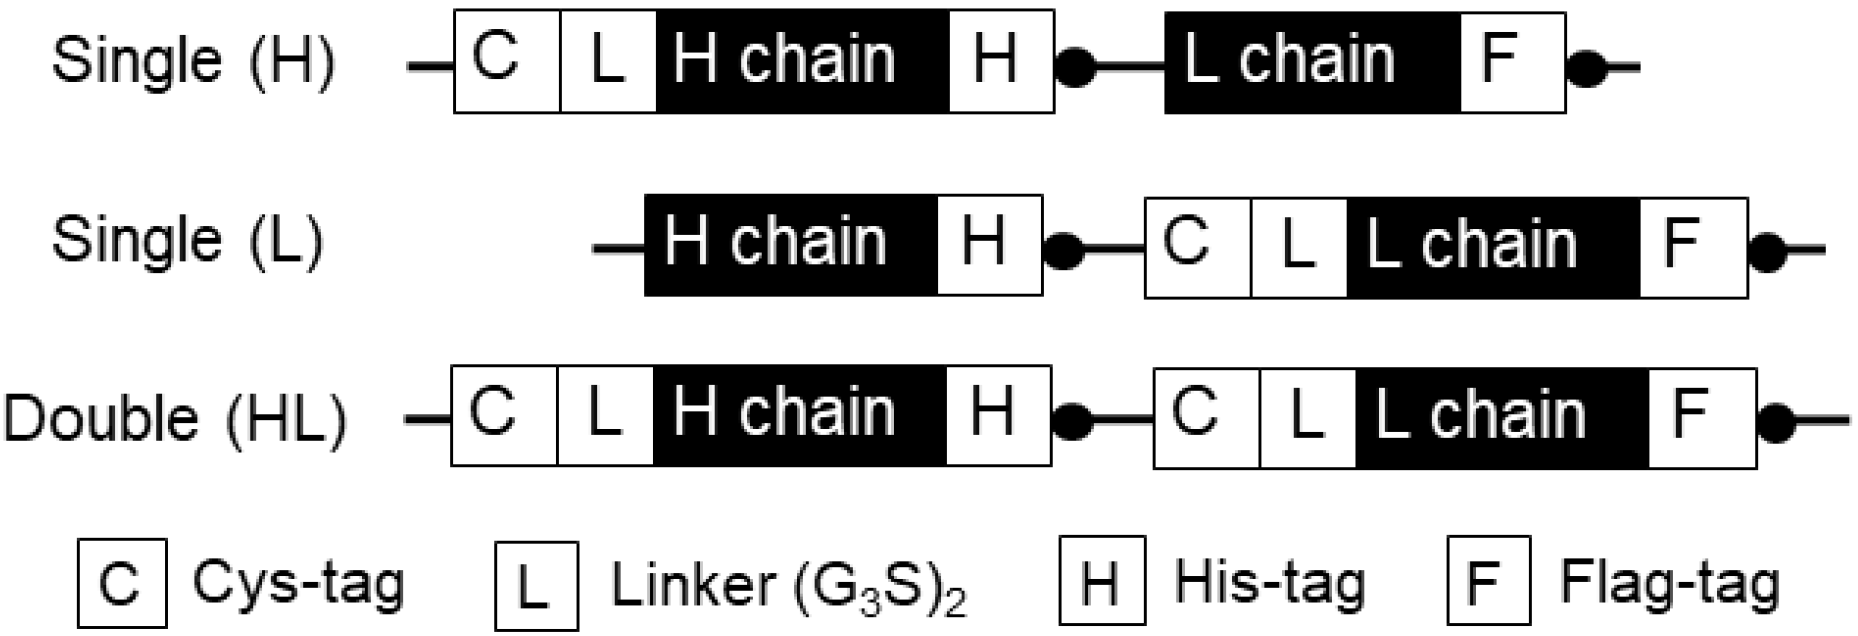
3.1.2. Construction of H0L1-Type Anti-MA Q-body Expression Gene
3.1.3. Construction of H1L1-Type Anti-MA Q-body Expression Gene
3.2. Fab Expression in E. coli (Time for Completion: 4 Days)
 CRITICAL STEP All steps in this section must be carried out in a sterile environment.
- 1.
- Transform pUQ1H, pUQ1L, or PUQ2 plasmid vector containing anti-MeM9 Fab, Cys-tag(s) at the N-terminal of H and/or L chain, His-tag at the C-terminal of H chain, and Flag-tag at the C-terminal of L chain into SHuffle T7 LysY competent cells. Add 5 µL of plasmid to 100 µL of competent cells and incubate the mixture for 30 min on ice. Incubate the cells for 45 s at 42 °C, and then immediately chill the cells on ice. Add 500 µL of LB medium to the cells and incubate them for 1 h at 37 °C with vigorous shaking (200 rpm). Spin it at 10,000 g for 10 min at room temperature in a microcentrifuge and remove 1 mL of the supernatant. After pipetting, spread the cells on pre-warmed LB plate containing 100 µg/mL ampicillin, and then incubate the plate for 16 h at 37 °C.
![Mps 03 00043 i001]() CRITICAL STEP Do not overgrow the colonies. This can result in local breakdown of the ampicillin, and formation and survival of satellite colonies that lack the plasmid.
CRITICAL STEP Do not overgrow the colonies. This can result in local breakdown of the ampicillin, and formation and survival of satellite colonies that lack the plasmid.![Mps 03 00043 i002]() PAUSE STEP The plates can be removed from the incubator, sealed in Parafilm, and stored upside down at 4 °C for up to 2 weeks.
PAUSE STEP The plates can be removed from the incubator, sealed in Parafilm, and stored upside down at 4 °C for up to 2 weeks. - 2.
- Add 4 µL of 100 mg/mL ampicillin stock to 4 mL culture tube containing 4 mL of LB medium. Pick a single colony and inoculate it in the culture tube.
- 3.
- Incubate the culture tube in a tabletop shaker at 200 rpm at 37 °C. Monitor growth using a UV-visible light spectrophotometer measuring absorbance at 600 nm. Grow the colonies until the optical density (OD) 600 value reaches 0.9 (typically 16–18 h).
![Mps 03 00043 i001]() CRITICAL STEP Growth rates will be dependent upon the protein of interest. For each protein, it is recommended to experimentally determine the ideal expression time for optimal expression. Overgrowth will deplete the ampicillin, resulting in the growth of cells lacking the plasmid.
CRITICAL STEP Growth rates will be dependent upon the protein of interest. For each protein, it is recommended to experimentally determine the ideal expression time for optimal expression. Overgrowth will deplete the ampicillin, resulting in the growth of cells lacking the plasmid. - 4.
- Add 200 µL of ampicillin stock to 1 L flasks containing either 200 mL of LB medium.
- 5.
- Inoculate the medium with 2 mL of confluent 4 mL culture from Step 4 (1 mL per 100 mL of culture). Incubate the culture flask in a shaker at 200 rpm at 37 °C.
- 6.
- Monitor growth using a UV-visible light spectrophotometer measuring absorbance at 600 nm. Grow the colonies until the OD600 value reaches 0.6. Troubleshooting: If the OD600 value is higher than 0.6, dilute the sample until the value reaches 0.3 and re-incubate the sample until its OD600 value reaches 0.6.
- 7.
- Induce the cells with 80 µL of 1 M IPTG in ultrapure water (0.4 mM final concentration) and incubate the culture flasks in a shaker for 16 h at 200 rpm at 16 °C.
- 8.
- Transfer the sample to 50 mL centrifuge tubes and pellet the cells by spinning down them at 4000 rpm for 30 min at 4 °C in a centrifuge. Decant the supernatant without disturbing the pellet.
![Mps 03 00043 i002]() PAUSE STEP The pellets can be stored at 4 °C for at least 1 week or −20 °C for at least 4 weeks.
PAUSE STEP The pellets can be stored at 4 °C for at least 1 week or −20 °C for at least 4 weeks.
3.3. Antibody Purification (Time for Completion: 1 Day)
- Take the cell pellets from the refrigerator or freezer and allow them to thaw on ice. Add 10 mL of His-binding buffer [50.8 mM Disodium hydrogen phosphate, 18.5 mM Sodium dihydrogen phosphate, 300 mM Sodium chloride (NaCl), pH 7.4] per original 100 mL culture. Mix gently by swirling the buffer by using pipet aid.
- Lyse the cells by sonicating the pellet on ice with the tapered probe for 10 min of operation time with a 50% duty cycle. Place the end of the tip at about the point where the tube tapers. Adjust the probe setting so that the probe has a low growl sound, rather than a high-pitched whine.
![Mps 03 00043 i001]() CRITICAL STEP It is important to maintain a low temperature (4 °C) during sonication. Therefore, the samples must be sonicated on ice with pulse intervals short enough to prevent overheating the sample when lysing the cells.
CRITICAL STEP It is important to maintain a low temperature (4 °C) during sonication. Therefore, the samples must be sonicated on ice with pulse intervals short enough to prevent overheating the sample when lysing the cells. - Transfer the sample to a 50 mL centrifuge tube and spin it at 4000 rpm for 30 min at 4 °C in a centrifuge to pellet the cellular debris.
- Prepare the His-binding column by packing 200 µL of His-beads into empty gravity column followed by applying 5 column volume (CV) of phosphate-buffered saline (PBS, 145 mM NaCl, 15.5 mM Disodium hydrogen phosphate, 1.7 mM Sodium dihydrogen phosphate, pH 7.4).
- Apply the supernatant from Step 3 to the column, close the cap of the column, and allow it bind to the beads for 2 h at 25 °C by gently stirring it with a rotator. Note: His-tagged Fab and H chain should be retained on the column.
- Pass through the column by gravity flow and wash the beads by applying 5 CV of His-washing buffer [50.8 mM Disodium hydrogen phosphate, 18.5 mM Sodium dihydrogen phosphate, 300 mM NaCl, 5 mM Imidazole, pH 7.4) to the column. Drain the buffer. Repeat this step three times.
- Stop the flow and close the cap of column. Apply 1.5 CV of His-elution buffer [50.8 mM Disodium hydrogen phosphate, 18.5 mM Sodium dihydrogen phosphate, 300 mM NaCl, 500 mM Imidazole, pH 7.4). Agitate the resin by gently stirring it for 1 h at 25 °C. Start the flow and collect the elution.
- Confirm that Fab is in the elution by running an SDS-PAGE and staining with Coomassie blue. (SDS-PAGE gel: 12% Separating gel; 2 mL 30% Acrylamide, 1.25 mL 1.5 M Tris (pH 8.8), 1.65 mL ultrapure water, 25 µL 10% SDS, 50 µL 10% APS, 2 µL TEMED. Staking gel; 165 µL 30% Acrylamide, 125 µL 0.5 M Tris (pH 6.8), 0.7 mL ultrapure water, 10 µL 10% SDS, 10 µL 10% APS, 2 µL TEMED)
![Mps 03 00043 i001]() CRITICAL STEP We recommend running the eluted sample and the flow-through sample from Step 6 on the same gel for comparison. In the case that the protein of Fab and/or H chain is found in the flow-through sample and not in the elution, re-initialize the His-binding column (Step 4). Repeat Steps 5–7, starting with reapplication of the flow-through that contains the remaining Fab and/or H chain.
CRITICAL STEP We recommend running the eluted sample and the flow-through sample from Step 6 on the same gel for comparison. In the case that the protein of Fab and/or H chain is found in the flow-through sample and not in the elution, re-initialize the His-binding column (Step 4). Repeat Steps 5–7, starting with reapplication of the flow-through that contains the remaining Fab and/or H chain. - Exchange the buffer of eluted sample to PBS using a 3 k MWCO Amicon centrifugal ultrafilter. Add the eluted sample in the top part of the filter and centrifuge at 4000 rpm until the volume of the sample is 0.2 mL.
- Loading 5 mL of PBS and centrifuge at 4000 rpm until 0.2 mL of the sample remains. Repeat this step three times.
![Mps 03 00043 i001]() CRITICAL STEP Do not let the volume reduce below 0.2 mL. This can cause aggregation of the protein.
CRITICAL STEP Do not let the volume reduce below 0.2 mL. This can cause aggregation of the protein.![Mps 03 00043 i001]() CRITICAL STEP Do not let the filters dry out. This may result in poor recovery.
CRITICAL STEP Do not let the filters dry out. This may result in poor recovery. - Recover the buffer exchanged protein from the membrane, use a 200 µL pipette tip, and insert the tip in the bottom of the filter unit.
![Mps 03 00043 i001]() CRITICAL STEP Withdraw the sample in several aliquots; be careful not to puncture the membrane.
CRITICAL STEP Withdraw the sample in several aliquots; be careful not to puncture the membrane.![Mps 03 00043 i001]() CRITICAL STEP Recover the buffer exchanged sample from the filter immediately after final centrifugation to maximize recovery yield.
CRITICAL STEP Recover the buffer exchanged sample from the filter immediately after final centrifugation to maximize recovery yield. - Check the protein expression and protein purity with 10 µL of sample by running an SDS-PAGE. Determine the protein concentration by generating a standard curve of bovine serum albumin (BSA) [16]. Prepare serial dilution, ranging from 0.31 to 1 mg/mL, from a stock solution of 10 mg/mL BSA. Load the purified protein of unknown concentration, molecular mass markers, and multiple BSA samples to each well of gel. Following sample preparation and separation by electrophoresis, the proteins are stained with Coomassie blue. The gel is de-stained to eliminate background, dried between two sheets of cellophane, and scanned with a common desktop scanner, and the resulting image is imported into the freeware program ImageJ (NIH) for analytical analysis. Troubleshooting: If you find protein degradation, try to perform the purification steps at 4 °C and/or add protease inhibitors to the cell lysis buffer and purification buffer to prevent degradation.
- Dilute the dialyzed protein to 1 mg/mL using PBS with 15% glycerol. Prepare aliquots of the samples, freeze them on dry ice, and lyophilize. Store the samples at −80 °C.
![Mps 03 00043 i002]() PAUSE STEP Lyophilized protein has been stored for several years at −80 °C with no observable effects on protein function or structure upon re-solubilization.
PAUSE STEP Lyophilized protein has been stored for several years at −80 °C with no observable effects on protein function or structure upon re-solubilization.
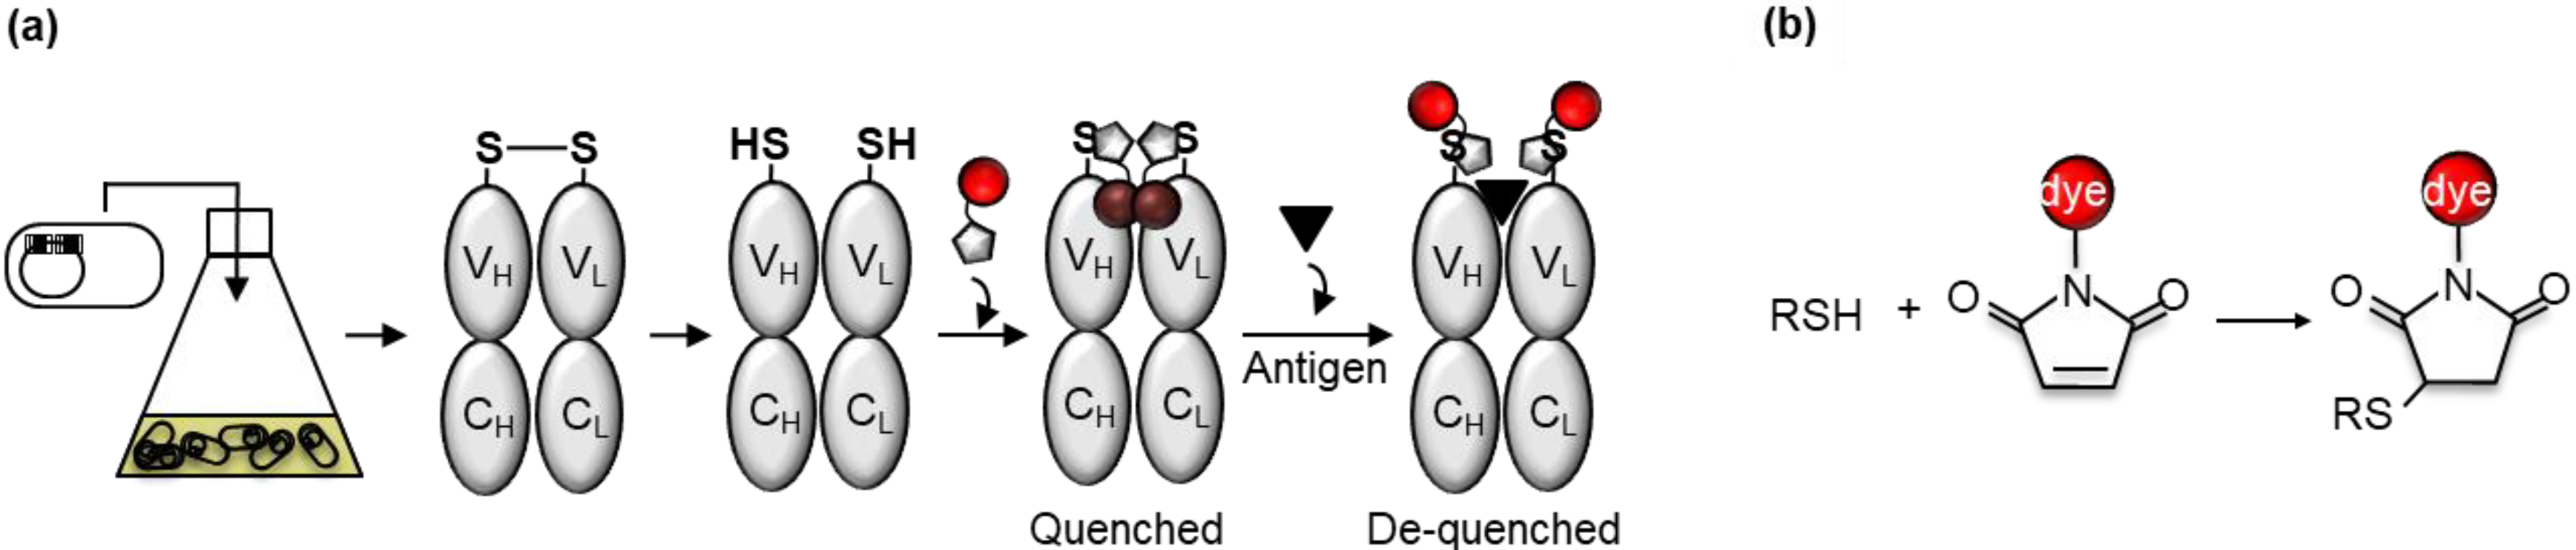
3.4. Labeling Fab with Maleimide-Conjugated Fluorescent Dye (Time for Completion: 1 Day)
- Add 100 µL of TCEP reducing gel slurry to a spin-cup column placed in a microcentrifuge tube.Centrifuge at 1000 rpm in a microcentrifuge for 30 s. Remove and discard the supernatant.
- Apply 100 µL of purified protein to the top of the gel in the tube. Gently vortex or mix the sample and gel, and incubate sample by placing the tube on a rotating wheel to keep the gel in suspension for 1 h (Sample concentration: incubation time, <0.1 mg/mL: 15 min; 0.1–0.5 mg/mL: 30 min; 0.5–0.9 mg/mL: 45 min; >1 mg/mL: 1 h). Note: The rotating speed must be sufficient to maintain the gels in suspension. Adjust the rotating speed to not settle the gels and to perfectly mix the gels to proteins.
- Place an empty spin column in a new tube. Apply the sample with gel, and centrifuge at 1000 rpm for 1 min. Note: The collected flow-through is the reduced protein.
- Prepare a 10 mM TAMRA-maleimide dye stock solution using 10% DMSO.
- Add a volume of dye stock solution to result in a molar ratio of 20 dyes per Fab. Incubate the reaction solution at RT for 2 h or at 4 °C for 16 h.
![Mps 03 00043 i001]() CRITICAL STEP the sample needs protection from light.
CRITICAL STEP the sample needs protection from light.
3.5. Purification of Q-body (Time for Completion: 1–2 Days)
- Note: Use anti-Flag tag (DYKDDDDK) antibody immobilization beads to purify DYKDDDDK tagged Q-bodies by the competitive elution of DYKDDDDK peptide. Prepare 20 µL (beads net volume 10 µL) of bead slurry to a tube and centrifuge at 5000× g for 1 min.
- After removing the supernatant, prewash the beads three times by using 500 µL of PBS.
- Add fluorescent dye-labeled Fab sample into a tube of prewashed beads and mix by rotator at 4 °C for 16 h.
- Centrifuge the beads at 5000× g for 1 min and remove the supernatant.
- Add 500 µL of PBS, centrifuge the beads at 5000× g for 1 min, and remove the supernatant. Repeat this step three times. Troubleshooting: If there is a loss of beads while removing the supernatant, use an empty spin column, which was used for step 3.4.
- Add 100 µL of 150 µg/mL DYKDDDDK peptide solution in PBS into a tube of step 6, and mix by rotator at 4 °C for 1 h.
- Centrifuge the beads at 5000× g for 1 min and transfer the supernatant into a new tube. Store the recovered supernatant at 4 °C.
- Prepare the His-binding column by packing 50 µL of His-beads into empty spin column followed by applying 5 CV of PBS.
- Apply the sample from Step 7 to the column, close the cap of the column, and allow it to bind to the beads for 1 h at 25 °C by gently stirring it with a rotator.
- Pass through the column by gravity flow and wash the beads by applying 5 CV of His-washing buffer to the column. Drain the buffer. Repeat this step three times.
- Stop the flow and add apply 1.5 CV of His-elution buffer. Agitate the resin by gently stirring it for 1 h at 25 °C. Start the flow and collect the elution.
- Exchange the buffer to PBS using a 3 k MWCO Centricon centrifugal ultrafilter. Add the eluted sample in the top part of the filter. Centrifuge at 10,000 rpm until the volume of sample is 0.1 mL.
- Loading 0.5 mL of PBS and centrifuge at 10,000 rpm until the 0.1 mL of sample are remaining. Repeat this step three times.
- Recover the buffer exchanged protein from the membrane, use a 200 µL pipette tip, and insert the tip in the bottom of the filter unit.
![Mps 03 00043 i001]() CRITICAL STEP Failure to wash the unreacted free dye may result in high background fluorescence.
CRITICAL STEP Failure to wash the unreacted free dye may result in high background fluorescence. - Check the labeling efficiency and purity with 10 µL of sample by running an SDS-PAGE followed by scanning the gel using a fluorescence scanner.
- Dilute the dialyzed protein to 1 mg/mL using PBS with 15% glycerol. Prepare aliquots of the samples, freeze them on dry ice, and lyophilize. Store the samples at −80 °C.
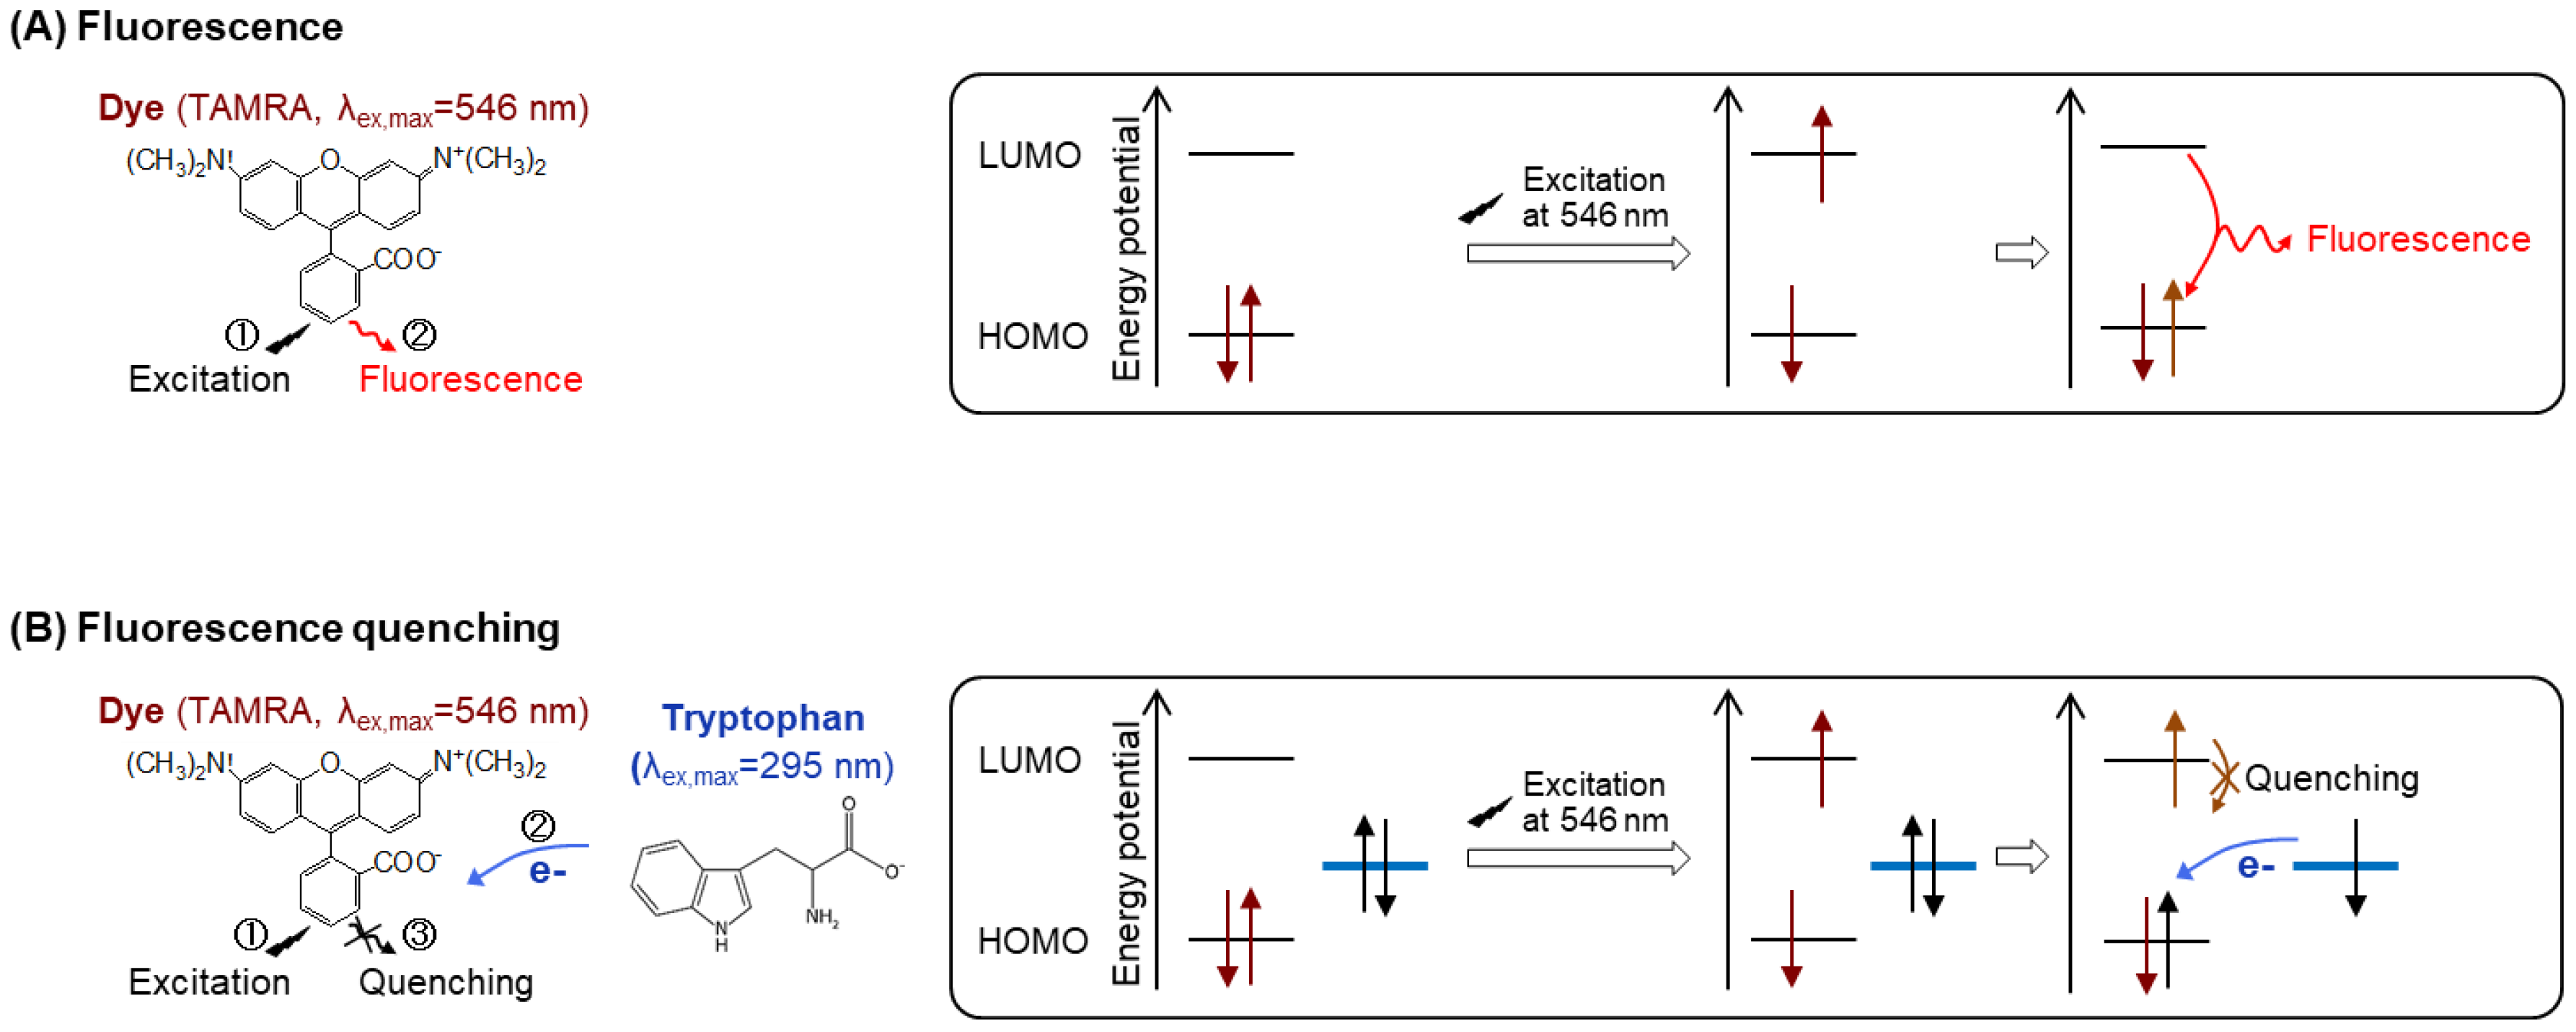
3.6. Fluorescence Measurements (Time for Completion: 1 Day)
- To evaluate the quenching capacity, mix 2 nM Q-body and 250 µL of PBST or denaturant (7 M GdnHCl and 100 mM DTT) in quartz microcuvette.
- Measure the emission intensity with excitation at 546 nm using an FP-8500 spectrofluorometer.
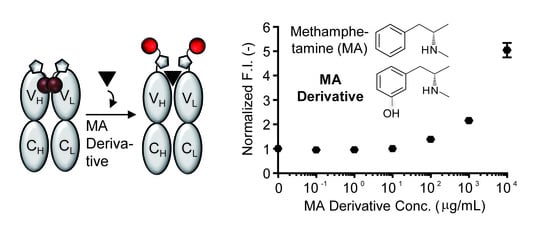
- To measure the antigen-dependent fluorescence response of Q-body, mix 2 nM Q-body and 250 µL of PBST in a cuvette, and add various concentrations of 3-[(2S)-2-(methylamino)propyl]phenol, phenethylamine, or methoxyphenamine in 2 µL of PBST for titration to give final concentrations of 0 to 104 µg/mL. As a control, add the same volume of PBST to normalize the signal.
- Measure the emission intensity with excitation at 546 nm using an FP-8500 spectrofluorometer.
- Draw fluorescence titration curves at the emission maxima of each spectrum using KaleidaGraph 4.5 (Synergy Software, Reading, PA, USA).
4. Results and Discussion
Author Contributions
Funding
Acknowledgments
Conflicts of Interest
References
- Barr, A.M.; Panenka, W.J.; MacEwan, G.W.; Thornton, A.E.; Lang, D.J.; Honer, W.G.; LeComte, T. The need for speed: An update on methamphetamine addiction. J. Psychiatry Neurosci. 2006, 31, 301–313. [Google Scholar]
- E Albertson, T.; Derlet, R.W.; E Van Hoozen, B. Methamphetamine and the expanding complications of amphetamines. West. J. Med. 1999, 170, 214–219. [Google Scholar]
- Harper, L.; Powell, J.; Pijl, E.M. An overview of forensic drug testing methods and their suitability for harm reduction point-of-care services. Harm Reduct. J. 2017, 14, 52. [Google Scholar] [CrossRef] [PubMed] [Green Version]
- Xiong, Y.; Chen, X.; Chen, Y. Development of a colloidal gold immuno-chromatography assay to detect methamphetamine. Wei sheng yan jiu = J. Hyg. Res. 2010, 39, 120–122. [Google Scholar]
- Miyaguchi, H.; Iwata, Y.T.; Kanamori, T.; Tsujikawa, K.; Kuwayama, K.; Inoue, H. Rapid identification and quantification of methamphetamine and amphetamine in hair by gas chromatography/mass spectrometry coupled with micropulverized extraction, aqueous acetylation and microextraction by packed sorbent. J. Chromatogr. A 2009, 1216, 4063–4070. [Google Scholar] [CrossRef] [PubMed]
- Yang, C.-A.; Liu, H.-C.; Lin, D.-L.; Hsieh, Y.-Z.; Wu, S.-P. Simultaneous Quantitation of Methamphetamine, Ketamine, Opiates and their Metabolites in Urine by SPE and LC–MS-MS. J. Anal. Toxicol. 2017, 41, 679–687. [Google Scholar] [CrossRef] [PubMed] [Green Version]
- Choi, J.; Choi, M.J.; Kim, C.; Cho, Y.S.; Chin, J.; Jo, Y.-A. The optimization of ELISA for methamphetamine determination: the effect of immunogen, tracer and antibody purification method on the sensitivity. Arch. Pharmacal Res. 1997, 20, 46–52. [Google Scholar] [CrossRef] [PubMed]
- Abe, R.; Jeong, H.-J.; Arakawa, D.; Dong, J.; Ohashi, H.; Kaigome, R.; Saiki, F.; Yamane, K.; Takagi, H.; Ueda, H. Ultra Q-bodies: quench-based antibody probes that utilize dye-dye interactions with enhanced antigen-dependent fluorescence. Sci. Rep. 2014, 4, 4640. [Google Scholar] [CrossRef] [PubMed] [Green Version]
- Abe, R.; Ohashi, H.; Iijima, I.; Ihara, M.; Takagi, H.; Hohsaka, T.; Ueda, H. “Quenchbodies”: Quench-Based Antibody Probes That Show Antigen-Dependent Fluorescence. J. Am. Chem. Soc. 2011, 133, 17386–17394. [Google Scholar] [CrossRef] [PubMed]
- Schäfer, G.; Müller, M.; Häfner, B.; Habl, G.; Nolte, O.; Marmé, N.; Knemeyer, J.-P. Self-quenching DNA probes based on aggregation of fluorescent dyes. Genet. Eng. Opt. Probes Biomed. Appl. III 2005, 5704, 30–40. [Google Scholar] [CrossRef]
- Shiba, A.; Kinoshita-Kikuta, E.; Kinoshita, E.; Koike, T. TAMRA/TAMRA Fluorescence Quenching Systems for the Activity Assay of Alkaline Phosphatase. Sensors 2017, 17, 1877. [Google Scholar] [CrossRef] [PubMed] [Green Version]
- Ogawa, M.; Kosaka, N.; Choyke, P.L.; Kobayashi, H. H-Type Dimer Formation of Fluorophores: A Mechanism for Activatable, in Vivo Optical Molecular Imaging. ACS Chem. Boil. 2009, 4, 535–546. [Google Scholar] [CrossRef] [PubMed] [Green Version]
- Jeong, H.-J.; Kawamura, T.; Iida, M.; Kawahigashi, Y.; Takigawa, M.; Ohmuro-Matsuyama, Y.; Chung, C.-I.; Dong, J.; Kondoh, M.; Ueda, H. Development of a Quenchbody for the Detection and Imaging of the Cancer-Related Tight-Junction-Associated Membrane Protein Claudin. Anal. Chem. 2017, 89, 10783–10789. [Google Scholar] [CrossRef] [PubMed]
- Dong, J.; Oka, Y.; Jeong, H.; Ohmuro-Matsuyama, Y.; Ueda, H. Detection and destruction of HER2-positive cancer cells by Ultra Quenchbody-siRNA complex. Biotechnol. Bioeng. 2020, 117, 1259–1269. [Google Scholar] [CrossRef] [PubMed]
- Yoshinari, T.; Ohashi, H.; Abe, R.; Kaigome, R.; Ohkawa, H.; Sugita-Konishi, Y. Development of a rapid method for the quantitative determination of deoxynivalenol using Quenchbody. Anal. Chim. Acta 2015, 888, 126–130. [Google Scholar] [CrossRef] [PubMed]
- Carter, J.; Petersen, B.P.; Printz, S.A.; Sorey, T.L.; Kroll, T.T. Quantitative Application for SDS–PAGE in a Biochemistry Lab. J. Chem. Educ. 2013, 90, 1255–1256. [Google Scholar] [CrossRef]
- Harvey, B.R.; Shanafelt, A.B.; Baburina, I.; Hui, R.; Vitone, S.; Iverson, B.L.; Georgiou, G. Engineering of recombinant antibody fragments to methamphetamine by anchored periplasmic expression. J. Immunol. Methods 2006, 308, 43–52. [Google Scholar] [CrossRef] [PubMed]


| Template Name | Sequence |
|---|---|
| tgcHchain | atgtctaaacaaatcgaagtaaacTGCtctaatgagaccggtggcggttcaggcggcggatcacaggtccagctgcagcagtctggacctgagctggtgaagcctggggcttcagtgaaggtatcctgcaaggcttctggttacccatccactcgcttctacatctactgggtgaagcagagccacggaaagagccttgagtggattggaaatattgatccttacaatggtggtactacctacaaccagaagttcaagggcaaggccacattgactattgacaagtcctccaccacagcctacgtgcatctcaacagcctgacatctgaggactctgcagtctattactgtgcaggatttcattactccggccagttggataccgatgtctggggcgcagggaccaaggtcaccgtttcctcggccaaaacgacacccccatctgtctatccactggcccctggatctgctgcccaaactaactccatggtgaccctgggatgcctggtcaagggctatttccctgagccagtgacagtgacctggaactctggatccctgtccagcggtgtgcacaccttcccagctgtcctgcagtctgacctctacactctgagcagctcagtgactgtcccctccagcacctggcccagcgagaccgtcacctgcaacgttgcccacccggccagcagcaccaaggtggacaagaaaattgtgcccagggattgtggggggggttctgactacaaggacgacgatgacaagtaataa |
| tttHchain | atgtctaaacaaatcgaagtaaacTTTtctaatgagaccggtggcggttcaggcggcggatcacaggtccagctgcagcagtctggacctgagctggtgaagcctggggcttcagtgaaggtatcctgcaaggcttctggttacccatccactcgcttctacatctactgggtgaagcagagccacggaaagagccttgagtggattggaaatattgatccttacaatggtggtactacctacaaccagaagttcaagggcaaggccacattgactattgacaagtcctccaccacagcctacgtgcatctcaacagcctgacatctgaggactctgcagtctattactgtgcaggatttcattactccggccagttggataccgatgtctggggcgcagggaccaaggtcaccgtttcctcggccaaaacgacacccccatctgtctatccactggcccctggatctgctgcccaaactaactccatggtgaccctgggatgcctggtcaagggctatttccctgagccagtgacagtgacctggaactctggatccctgtccagcggtgtgcacaccttcccagctgtcctgcagtctgacctctacactctgagcagctcagtgactgtcccctccagcacctggcccagcgagaccgtcacctgcaacgttgcccacccggccagcagcaccaaggtggacaagaaaattgtgcccagggattgtggggggggttctgactacaaggacgacgatgacaagtaataa |
| tgcLchain | atgtctaaacaaatcgaagtaaacTGCtctaatgagaccggtggcggttcaggcggcggatcagatattgttatgacccagtctccagcattcatgtctgcatctcctggggagaaggtcaccttgacctgcagtgccagctcaagtgtaagttccaccttcttgtactggtaccagcagaagccaggatcctcccccaaactctggatttatagcacatccaacctggcttctggagtcccttctcgcttcagtggcagtgggtctgggacctcttactctctcacaatcaacagcatggaggctgaagatgctgcctcttatttctgccatcagtggagtaattacccattcacgttcggaagtgggaccaagctggaaatcaaacgtgctgatgctgcaccaactgtatccatcttcccaccatccagtgagcagttaacatctggaggtgcctcagtcgtgtgcttcttgaacaacttctaccccaaagacatcaatgtcaagtggaagattgatggcagtgaacgacaaaatggcgtcctgaacagttggactgatcaggacagcaaagacagcacctacagcatgagcagcaccctcacgttgaccaaggacgagtatgaacgacataacagctatacctgtgaggccactcacaagacatcaacttcacccattgtcaagagcttcaacaggaatgagtgtggggggggttctcatcatcatcatcatcattaa |
| tttLchain | atgtctaaacaaatcgaagtaaacTTTtctaatgagaccggtggcggttcaggcggcggatcagatattgttatgacccagtctccagcattcatgtctgcatctcctggggagaaggtcaccttgacctgcagtgccagctcaagtgtaagttccaccttcttgtactggtaccagcagaagccaggatcctcccccaaactctggatttatagcacatccaacctggcttctggagtcccttctcgcttcagtggcagtgggtctgggacctcttactctctcacaatcaacagcatggaggctgaagatgctgcctcttatttctgccatcagtggagtaattacccattcacgttcggaagtgggaccaagctggaaatcaaacgtgctgatgctgcaccaactgtatccatcttcccaccatccagtgagcagttaacatctggaggtgcctcagtcgtgtgcttcttgaacaacttctaccccaaagacatcaatgtcaagtggaagattgatggcagtgaacgacaaaatggcgtcctgaacagttggactgatcaggacagcaaagacagcacctacagcatgagcagcaccctcacgttgaccaaggacgagtatgaacgacataacagctatacctgtgaggccactcacaagacatcaacttcacccattgtcaagagcttcaacaggaatgagtgtggggggggttctcatcatcatcatcatcattaa |
© 2020 by the authors. Licensee MDPI, Basel, Switzerland. This article is an open access article distributed under the terms and conditions of the Creative Commons Attribution (CC BY) license (http://creativecommons.org/licenses/by/4.0/).
Share and Cite
Jeong, H.-J.; Dong, J.; Yeom, C.-H.; Ueda, H. Synthesis of Quenchbodies for One-Pot Detection of Stimulant Drug Methamphetamine. Methods Protoc. 2020, 3, 43. https://doi.org/10.3390/mps3020043
Jeong H-J, Dong J, Yeom C-H, Ueda H. Synthesis of Quenchbodies for One-Pot Detection of Stimulant Drug Methamphetamine. Methods and Protocols. 2020; 3(2):43. https://doi.org/10.3390/mps3020043
Chicago/Turabian StyleJeong, Hee-Jin, Jinhua Dong, Chang-Hun Yeom, and Hiroshi Ueda. 2020. "Synthesis of Quenchbodies for One-Pot Detection of Stimulant Drug Methamphetamine" Methods and Protocols 3, no. 2: 43. https://doi.org/10.3390/mps3020043