
Identification of Bone Mineral Density Deficit Using L1 Trabecular Attenuation by Opportunistic Multidetector CT Scan in Adult Patients


Abstract
:
1. Introduction
2. Materials and Methods
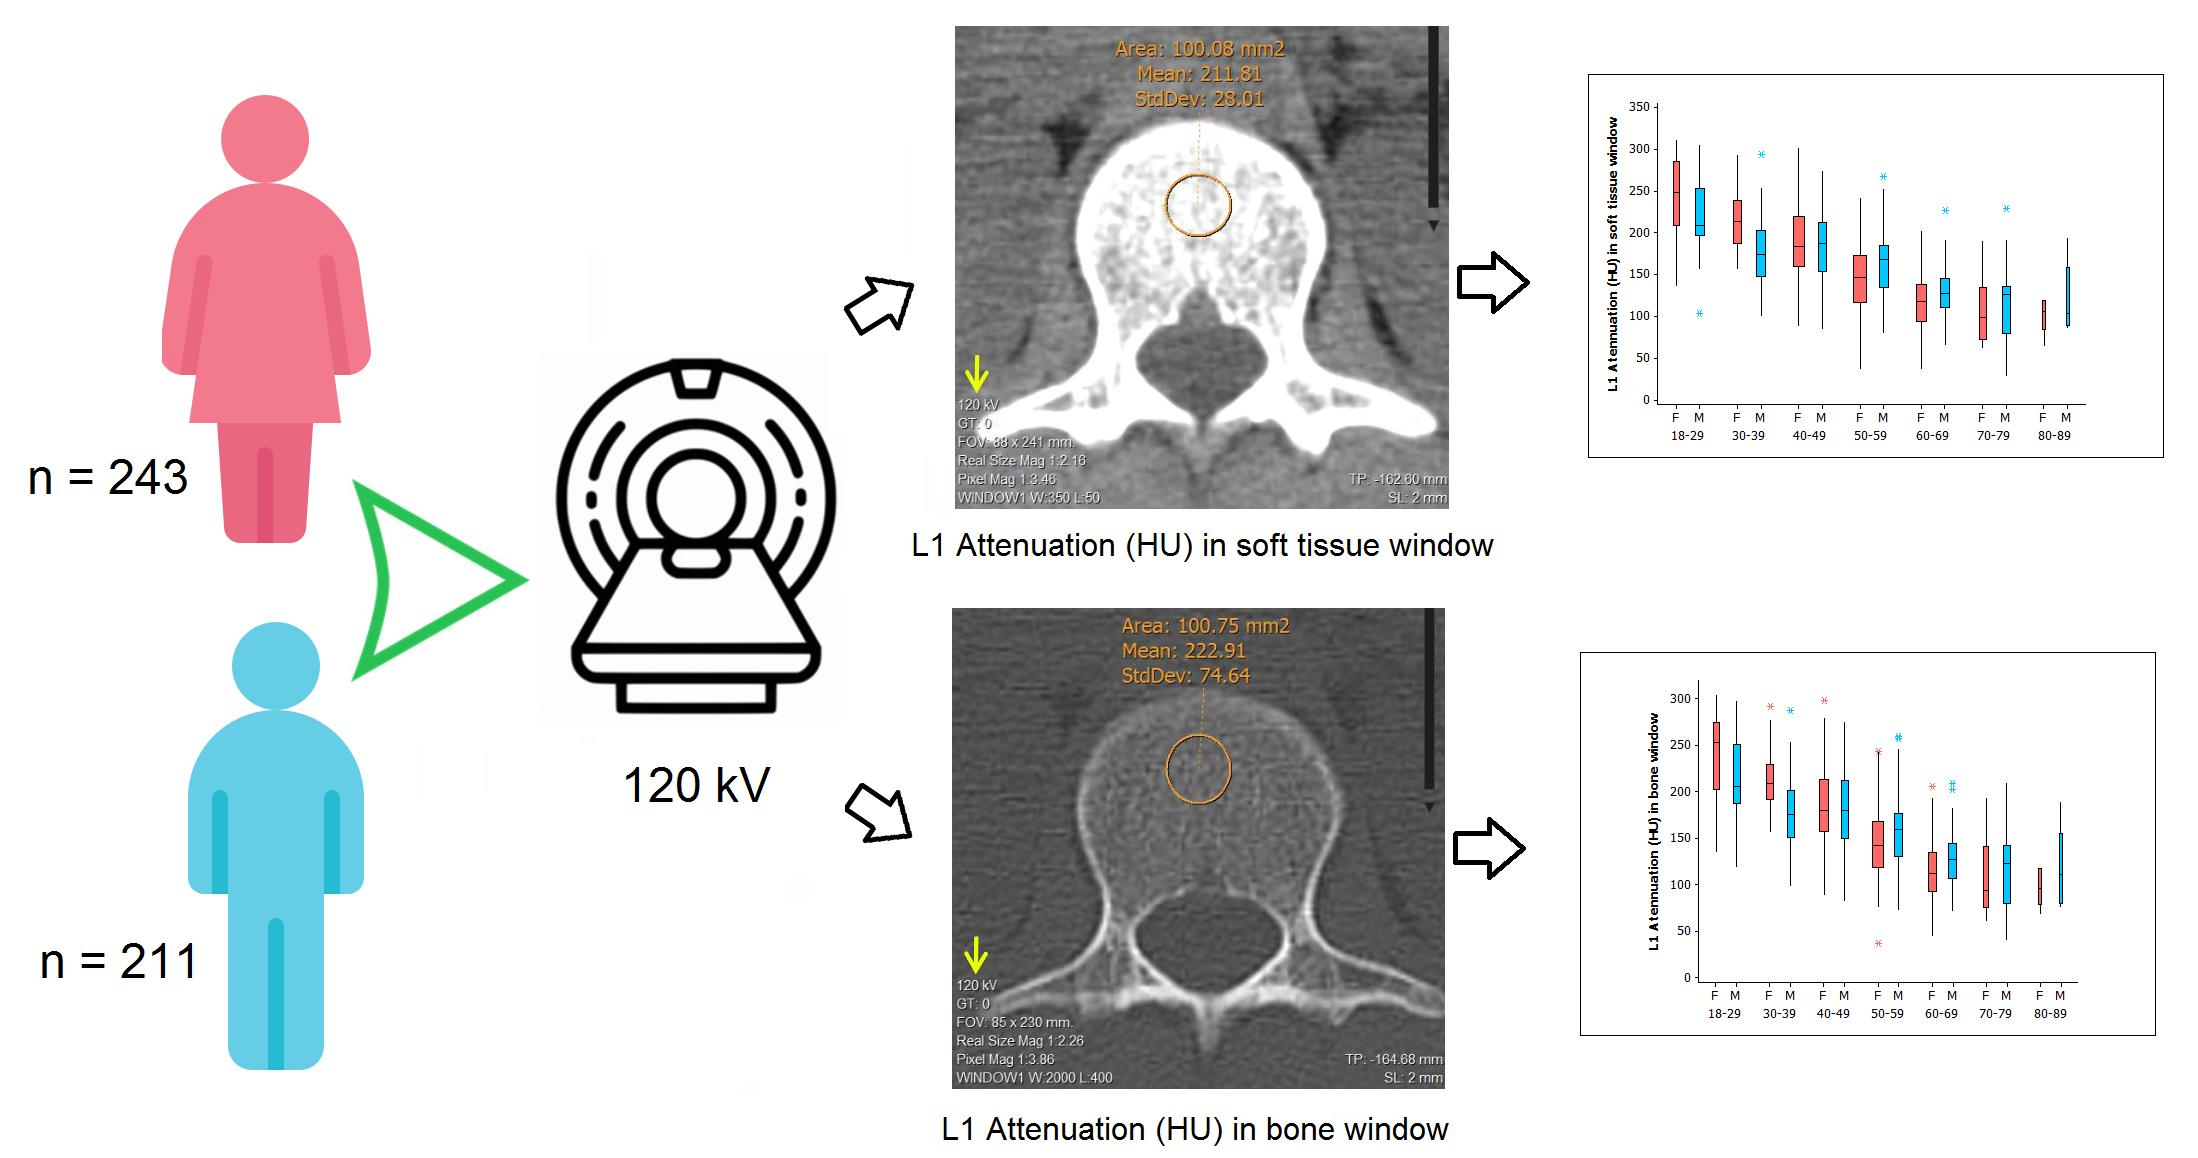
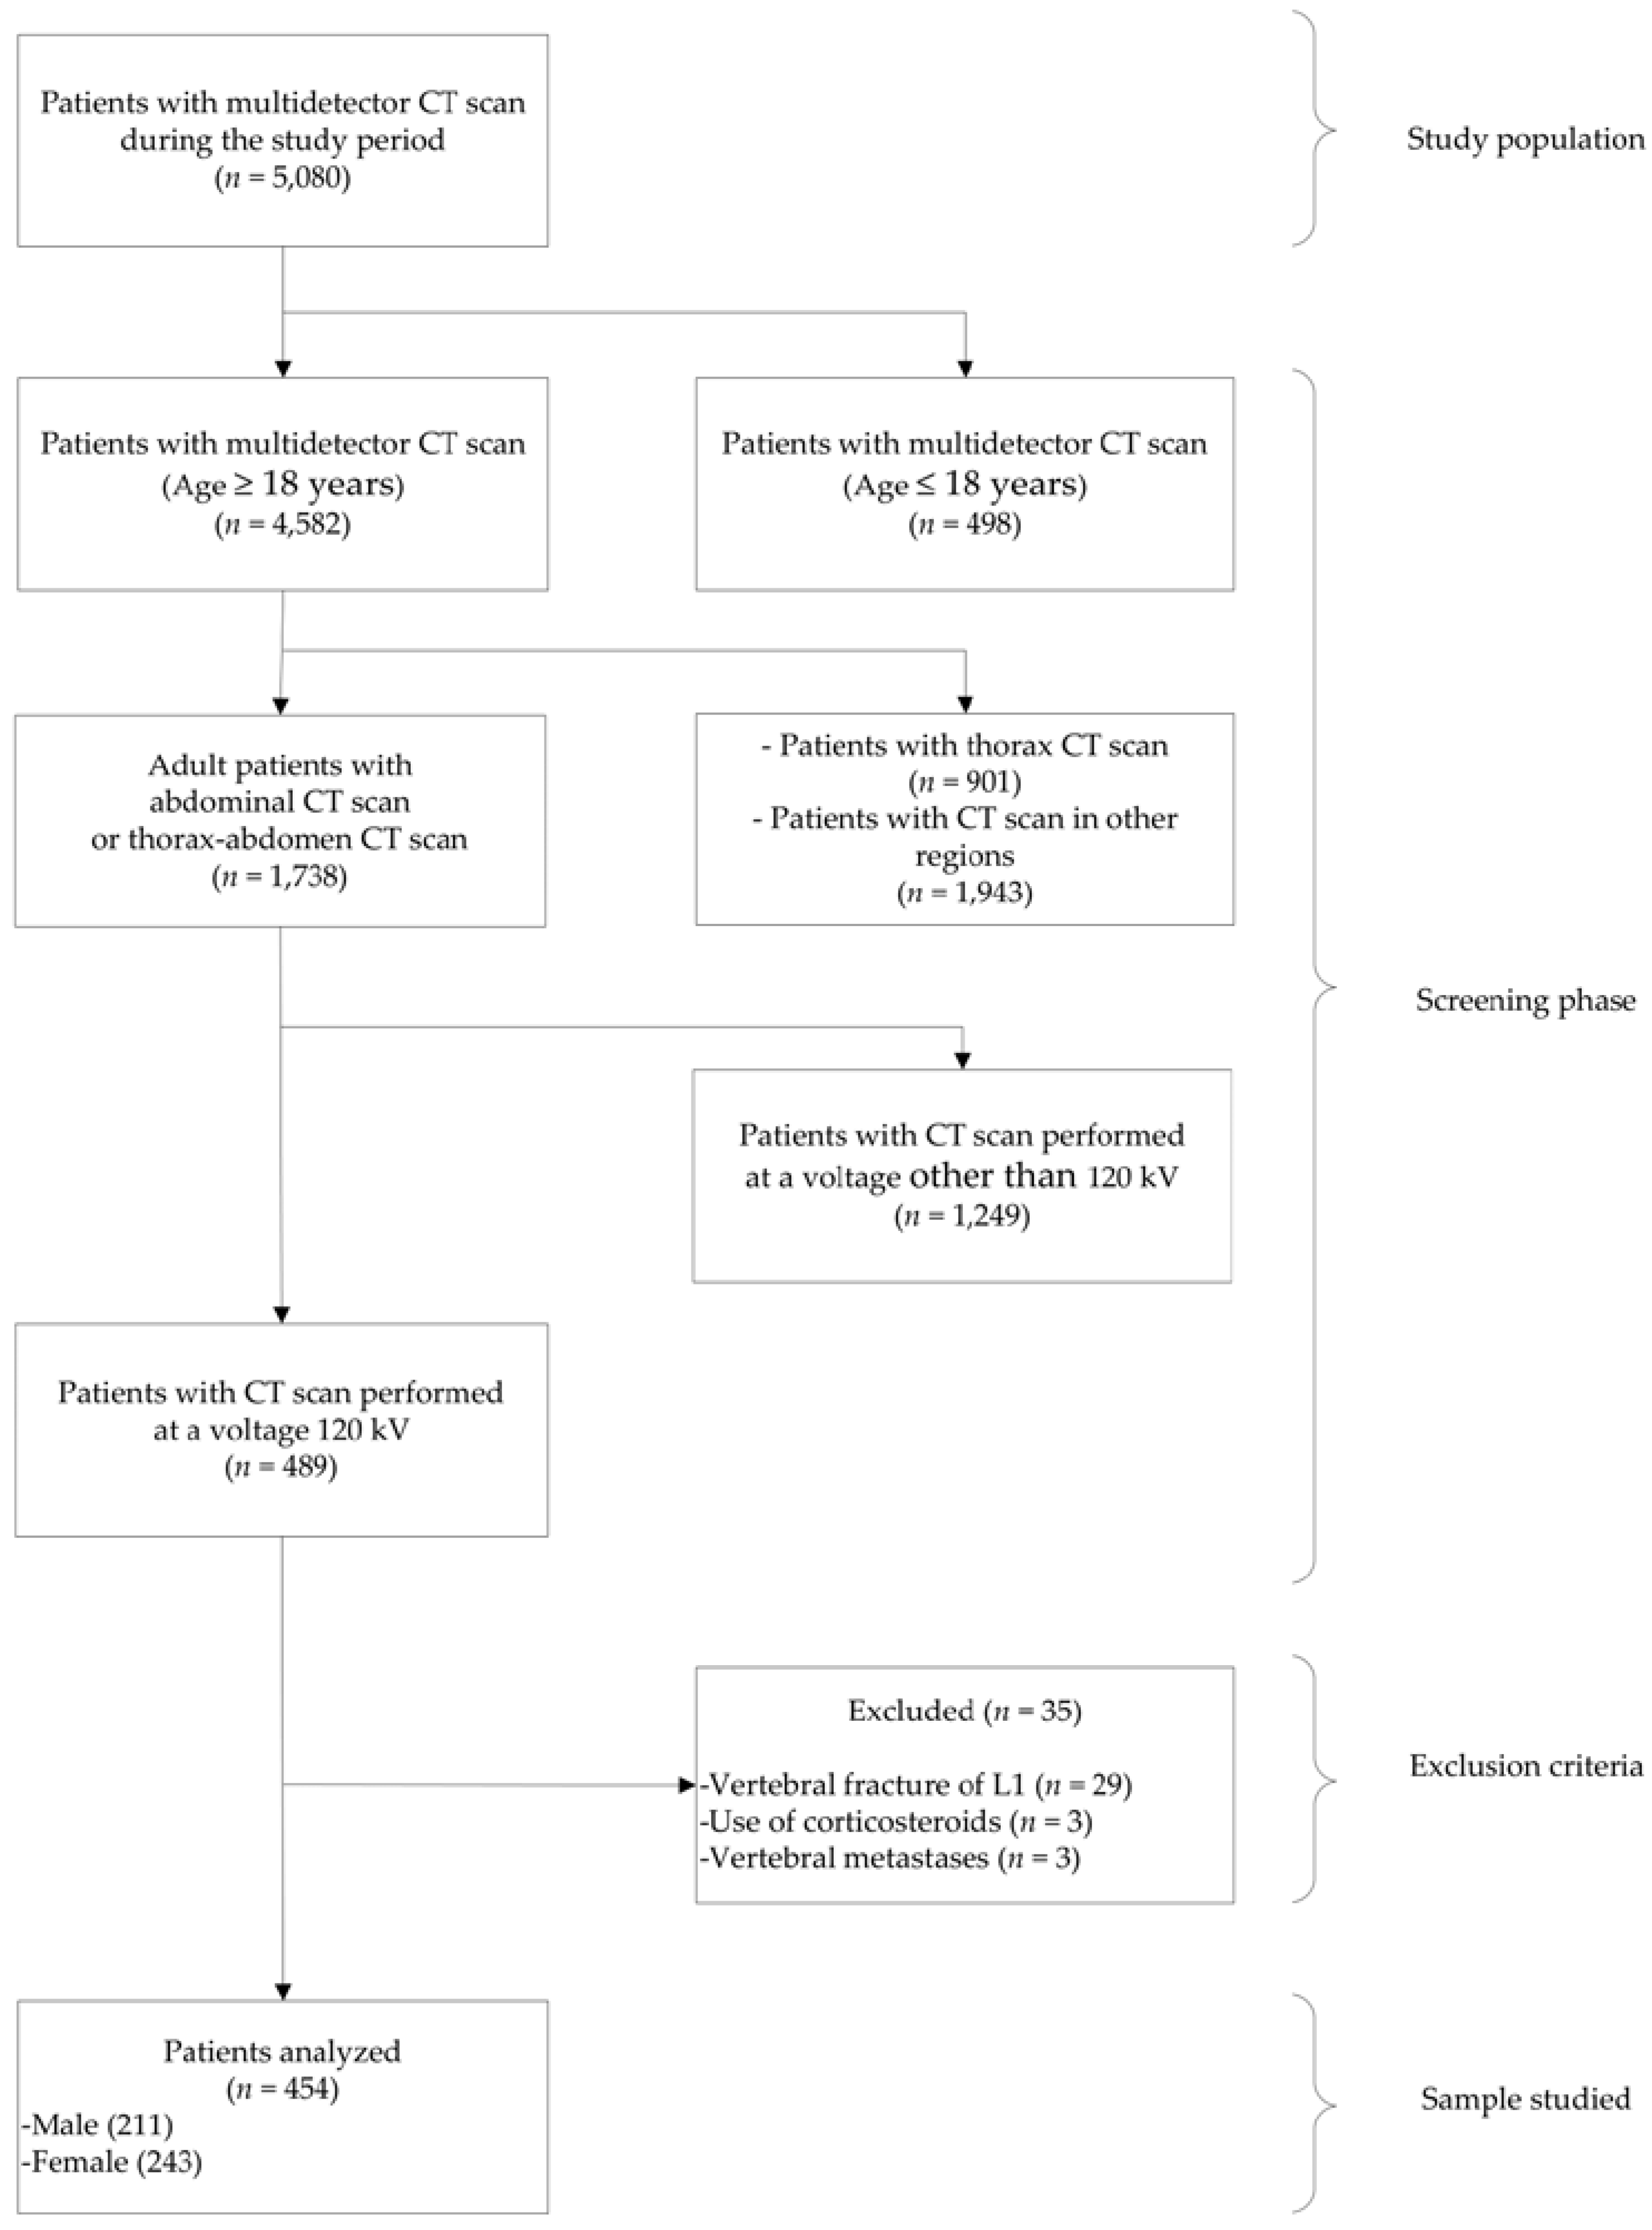
2.1. Patients
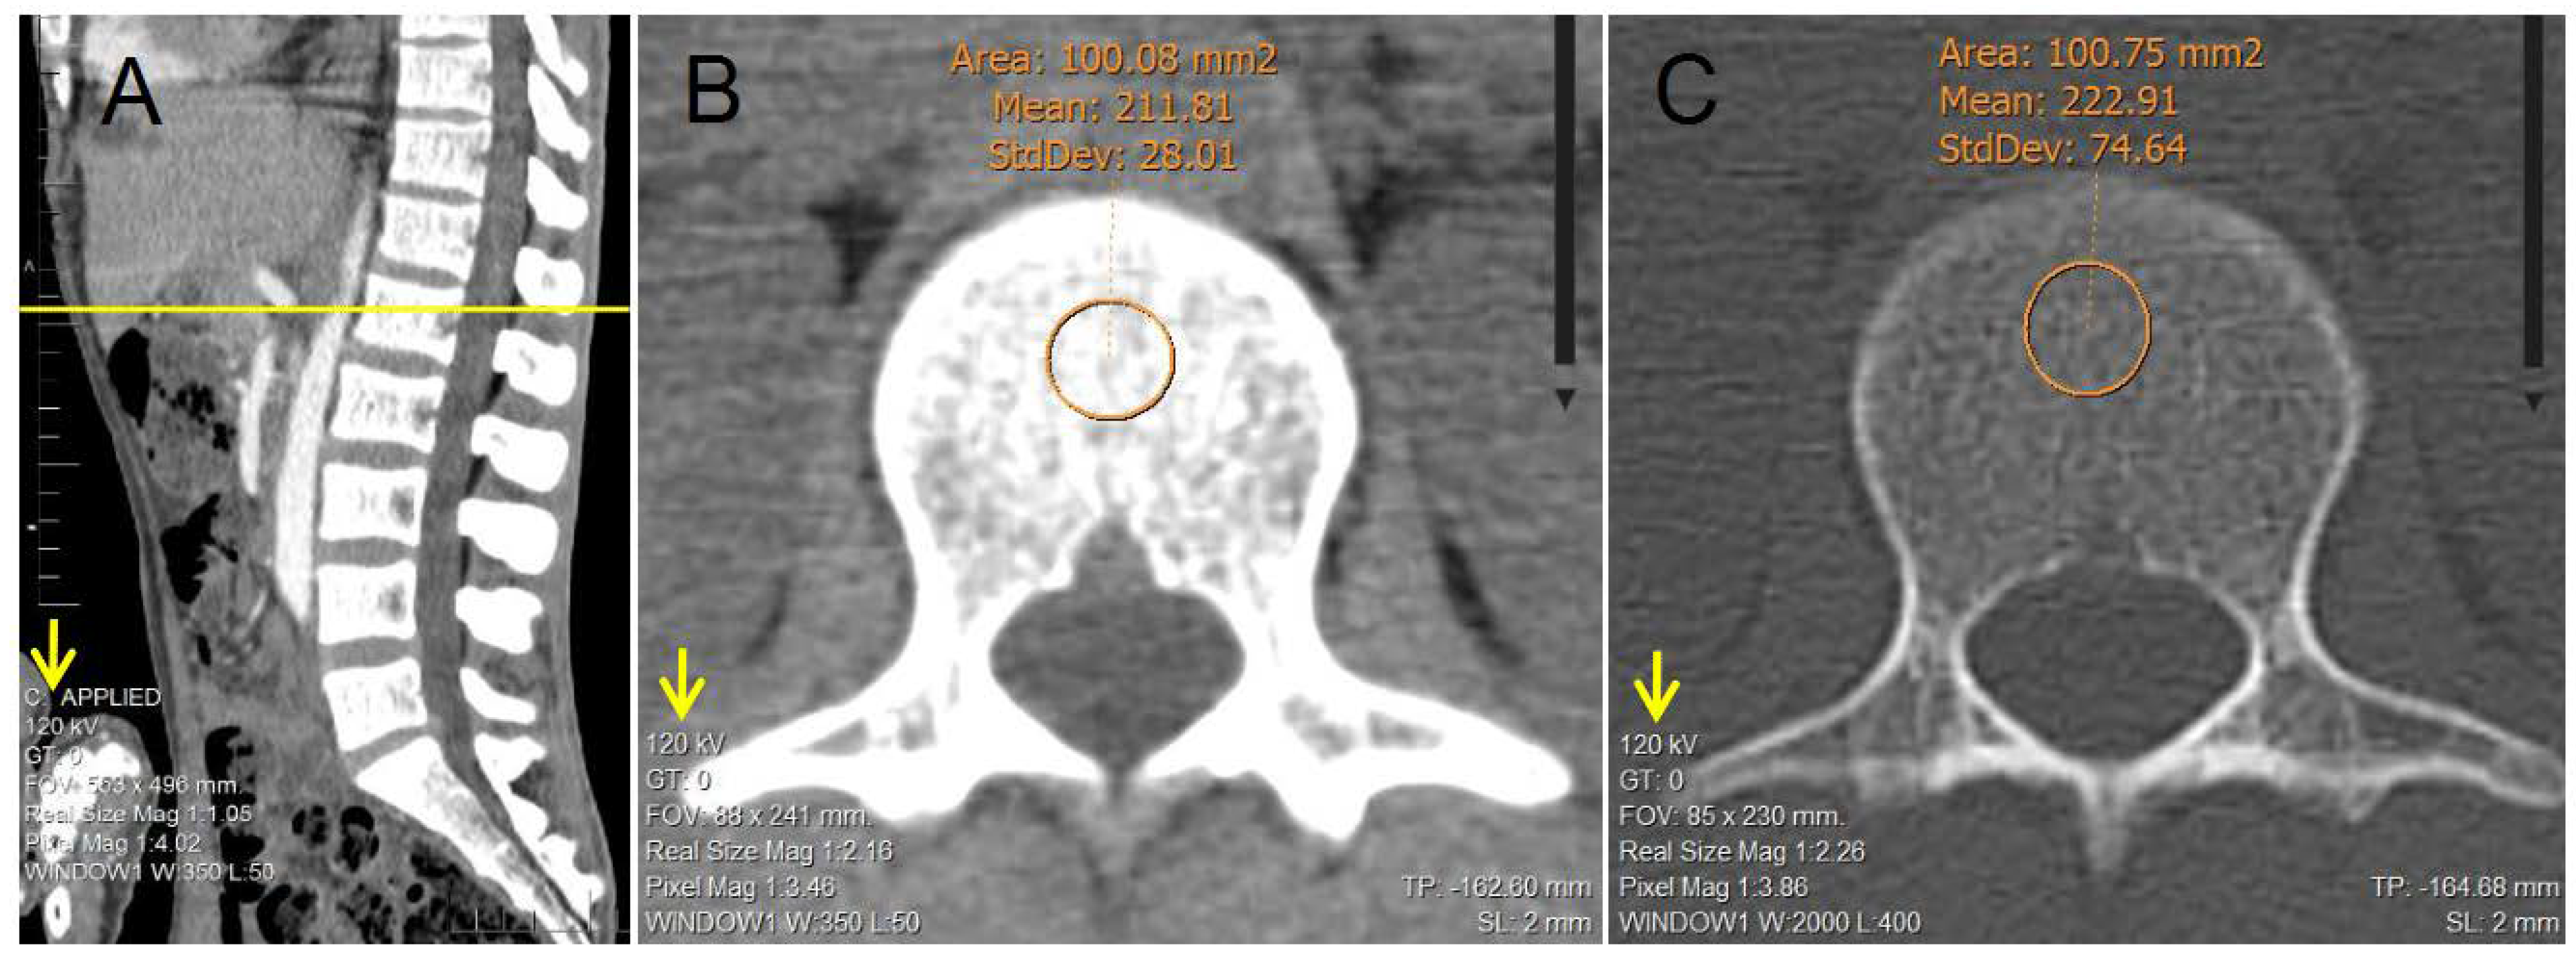
2.2. Image Analysis
2.3. Statistical Analysis
3. Results
4. Discussion
5. Conclusions
Author Contributions
Funding
Institutional Review Board Statement
Informed Consent Statement
Data Availability Statement
Acknowledgments
Conflicts of Interest
References
- Franquet, T.; Giménez, A.; Hidalgo, A. Imaging of opportunistic fungal infections in immunocompromised patient. Eur. J. Radiol. 2004, 51, 130–138. [Google Scholar] [CrossRef] [PubMed]
- Pickhardt, P.J. Value-added Opportunistic CT Screening: State of the Art. Radiology 2022, 303, 241–254. [Google Scholar] [CrossRef] [PubMed]
- Boutin, R.D.; Lenchik, L. Value-added opportunistic CT: Insights into osteoporosis and sarcopenia. Am. J. Roentgenol. 2020, 215, 582–594. [Google Scholar] [CrossRef] [PubMed]
- Chang, C.Y.; Rosenthal, D.I.; Mitchell, D.M.; Handa, A.; Kattapuram, S.V.; Huang, A.J. Imaging findings of metabolic bone disease. Radiographics 2016, 36, 1871–1887. [Google Scholar] [CrossRef] [PubMed]
- Poundarik, A.A.; Boskey, A.; Gundberg, C.; Vashishth, D. Biomolecular regulation, composition and nanoarchitecture of bone mineral. Sci. Rep. 2018, 8, 1191. [Google Scholar] [CrossRef] [Green Version]
- Griffith, J.F.; Engelke, K.; Genant, H.K. Looking beyond bone mineral density: Imaging assessment of bone quality. Ann. N. Y. Acad. Sci. 2010, 1192, 45–56. [Google Scholar] [CrossRef]
- Link, T.M. Osteoporosis imaging: State of the art and advanced imaging. Radiology 2012, 263, 3–17. [Google Scholar] [CrossRef] [Green Version]
- Wagner, S.; Stäbler, A.; Sittek, H.; Bonel, H.; Laeverenz, G.; Reiser, M.F.; Baur-Melnyk, A. Diagnosis of osteoporosis: Visual assessment on conventional versus digital radiographs. Osteoporos. Int. 2005, 16, 1815–1822. [Google Scholar] [CrossRef]
- Glüer, C.C. A new quality of bone ultrasound research. IEEE Trans. Ultrason. Ferroelectr. Freq. Control 2008, 55, 1524–1528. [Google Scholar] [CrossRef]
- Guglielmi, G.; Lang, T.F. Quantitative Computed Tomography. In Semin Musculoskelet Radiol; Thieme Medical Publishers, Inc.: New York, NY, USA, 2002; pp. 219–228. [Google Scholar]
- Burghardt, A.J.; Link, T.M.; Majumdar, S. High-resolution computed tomography for clinical imaging of bone microarchitecture. Clin. Orthop. Relat. Res. 2011, 469, 2179–2193. [Google Scholar] [CrossRef]
- Link, T.M.; Majumdar, S.; Lin, J.C.; Newitt, D.; Augat, P.; Ouyang, X.; Mathur, A.; Genant, H.K. A comparative study of trabecular bone properties in the spine and femur using high resolution, MRI and, CT. J. Bone Miner. Res. 1998, 13, 122–132. [Google Scholar] [CrossRef]
- Raju, S.; Ghosh, S.; Mehta, A.C. Chest CT Signs in Pulmonary Disease: A Pictorial Review. Chest 2017, 151, 1356–1374. [Google Scholar] [CrossRef]
- Coursey, C.A.; Nelson, R.C.; Boll, D.T.; Paulson, E.K.; Ho, L.M.; Neville, A.M.; Marin, D.; Gupta, R.T.; Schindera, S.T. Dual-energy multidetector CT: How does it work, what can it tell us, and when can we use it in abdominopelvic imaging? Radiographics 2010, 30, 1037–1052. [Google Scholar] [CrossRef] [PubMed]
- Rubin, G.D. Computed tomography: Revolutionizing the practice of medicine for 40 years. Radiology 2014, 273, S45–S74. [Google Scholar] [CrossRef] [PubMed]
- Liguori, C.; Frauenfelder, G.; Massaroni, C.; Saccomandi, P.; Giurazza, F.; Pitocco, F.; Marano, R.; Schena, E. Emerging clinical applications of computed tomography. Med. Devices Evid. Res. 2015, 8, 265–278. [Google Scholar] [CrossRef] [Green Version]
- Romano, S.; Romano, L. Utilization Patterns of Multidetector Computed Tomography in Elective and Emergency Conditions: Indications, Exposure Risk, and Diagnostic Gain. Semin. Ultrasound CT MRI 2010, 31, 53–56. [Google Scholar] [CrossRef]
- Al-Katib, S.; Shetty, M.; Jafri, S.M.A.; Jafri, S.Z.H. Radiologic assessment of native renal vasculature: A multimodality review. Radiographics 2017, 37, 136–156. [Google Scholar] [CrossRef] [Green Version]
- Berdahl, C.T.; Vermeulen, M.J.; Larson, D.B.; Schull, M.J. Emergency department computed tomography utilization in the United States and Canada. Ann. Emerg. Med. 2013, 62, 486–494.e3. [Google Scholar] [CrossRef]
- Mettler, F.A.; Bhargavan, M.; Faulkner, K.; Gilley, D.B.; Gray, J.E.; Ibbott, G.S.; Lipoti, J.A.; Mahesh, M.; McCrohan, J.L.; Stabin, M.G.; et al. Radiologic and nuclear medicine studies in the United States and worldwide: Frequency, radiation dose, and comparison with other radiation sources—1950–2007. Radiology 2009, 253, 520–531. [Google Scholar] [CrossRef] [PubMed]
- Link, T.M.; Koppers, B.B.; Licht, T.; Bauer, J.; Lu, Y.; Rummeny, E.J. In vitro and in vivo spiral CT to determine bone mineral density: Initial experience in patients at risk for osteoporosis. Radiology 2004, 231, 805–811. [Google Scholar] [CrossRef]
- Jang, S.; Graffy, P.M.; Ziemlewicz, T.J.; Lee, S.J.; Summers, R.M.; Pickhardt, P.J. Opportunistic osteoporosis screening at routine abdominal and Thoracic CT: Normative L1 trabecular attenuation values in more than 20,000 adults. Radiology 2019, 291, 360–367. [Google Scholar] [CrossRef]
- Pickhardt, P.J.; Pooler, B.D.; Lauder, T.; del Rio, A.M.; Bruce, R.J.; Binkley, N. Opportunistic screening for osteoporosis using abdominal computed tomography scans obtained for other indications. Ann. Intern. Med. 2013, 158, 588–595. [Google Scholar] [CrossRef] [Green Version]
- Perrier-Cornet, J.; Omorou, A.Y.; Fauny, M.; Loeuille, D.; Chary-Valckenaere, I. Opportunistic screening for osteoporosis using thoraco-abdomino-pelvic CT-scan assessing the vertebral density in rheumatoid arthritis patients. Osteoporos. Int. 2019, 30, 1215–1222. [Google Scholar] [CrossRef] [PubMed]
- Abbouchie, H.; Raju, N.; Lamanna, A.; Chiang, C.; Kutaiba, N. Screening for osteoporosis using L1 vertebral density on abdominal CT in an Australian population. Clin Radiol. R. Coll. Radiol. 2022, 77, e540–e548. [Google Scholar] [CrossRef]
- Cohen, A.; Foldes, A.J.; Hiller, N.; Simanovsky, N.; Szalat, A. Opportunistic screening for osteoporosis and osteopenia by routine computed tomography scan: A heterogeneous, multiethnic, middle-eastern population validation study. Eur. J. Radiol. 2021, 136, 109568. [Google Scholar] [CrossRef]
- World Medical Association. World Medical Association Declaration of Helsinki: Ethical principles for medical research involving human subjects. JAMA 2013, 310, 2191–2194. [Google Scholar] [CrossRef] [PubMed] [Green Version]
- Mexican Gobernation Secretary. General Health Law. Official Gazzete of the Federation. 1984. Available online: https://www.diputados.gob.mx/LeyesBiblio/pdf/LGS.pdf (accessed on 20 June 2022).
- R Core Team. R: A Language and Environment for Statistical Computing; R Foundation for Statistical Computing: Vienna, Austria, 2019; Available online: https://www.r-project.org (accessed on 1 April 2022).
- Alacreu, E.; Moratal, D.; Arana, E. Opportunistic screening for osteoporosis by routine CT in Southern Europe. Osteoporos. Int. 2017, 28, 983–990. [Google Scholar] [CrossRef]
- Li, Y.L.; Wong, K.H.; Law, M.W.M.; Fang, B.X.H.; Lau, V.W.H.; Vardhanabuti, V.V.; Lee, V.K.H.; Cheng, A.K.C.; Ho, W.Y.; Lam, W.W.M. Opportunistic screening for osteoporosis in abdominal computed tomography for Chinese population. Arch. Osteoporos. 2018, 13, 76. [Google Scholar] [CrossRef] [PubMed]
- Hopper, K.D.; Wang, M.P.; Kunselman, A.R. The use of clinical CT for baseline bone density assessment. J. Comput. Assist. Tomogr. 2000, 24, 896–899. [Google Scholar] [CrossRef] [PubMed]
- Lewiecki, E.M.; Gordon, C.M.; Baim, S.; Leonard, M.B.; Bishop, N.J.; Bianchi, M.L.; Kalkwarf, H.J.; Langman, C.B.; Plotkin, H.; Rauch, F.; et al. International Society for Clinical Densitometry 2007 Adult and Pediatric Official Positions. Bone 2008, 43, 1115–1121. [Google Scholar] [CrossRef]
- Lee, S.J.; Binkley, N.; Lubner, M.G.; Bruce, R.J.; Ziemlewicz, T.J.; Pickhardt, P.J. Opportunistic screening for osteoporosis using the sagittal reconstruction from routine abdominal CT for combined assessment of vertebral fractures and density. Osteoporos. Int. 2016, 27, 1131–1136. [Google Scholar] [CrossRef] [PubMed]


| Variable | n = 454 |
|---|---|
| Age (years) | 51.30 (15.89) |
| 18 ≤ Age < 30, n (%) | 55 (12.11%) |
| 30 ≤ Age < 40, n (%) | 61 (13.44%) |
| 40 ≤ Age < 50, n (%) | 85 (18.72%) |
| 50 ≤ Age < 60, n (%) | 115 (25.33%) |
| 60 ≤ Age < 70, n (%) | 80 (17.62%) |
| 70 ≤ Age < 80, n (%) | 48 (10.57%) |
| 80 ≤ Age < 90, n (%) | 10 (2.20%) |
| Sex | |
| Male, n (%) | 211 (46.48%) |
| Female, n (%) | 243 (53.52%) |
| Weight (kg) | 74.57 (15.69) |
| Height (m) | 1.62 (0.09) |
| BMI (kg/m2) | 28.43 (5.21) |
| Underweight (BMI < 18.5), n (%) | 7 (1.54%) |
| Normal weight (18.5 ≤ BMI < 25), n (%) | 112 (24.67%) |
| Overweight (25 ≤ BMI < 30), n (%) | 174 (38.33%) |
| Obese (BMI ≥ 30), n (%) | 161 (35.46%) |
| Type 2 diabetes mellitus | |
| Yes, n (%) | 55 (12.11%) |
| No, n (%) | 399 (87.89%) |
| Hypertension | |
| Yes, n (%) | 87 (19.16%) |
| No, n (%) | 367 (80.84%) |
| Smoking | |
| Yes, n (%) | 69 (15.20%) |
| No, n (%) | 385 (84.80%) |
| Alcohol consumption | |
| Yes, n (%) | 55 (12.11%) |
| No, n (%) | 399 (87.89%) |
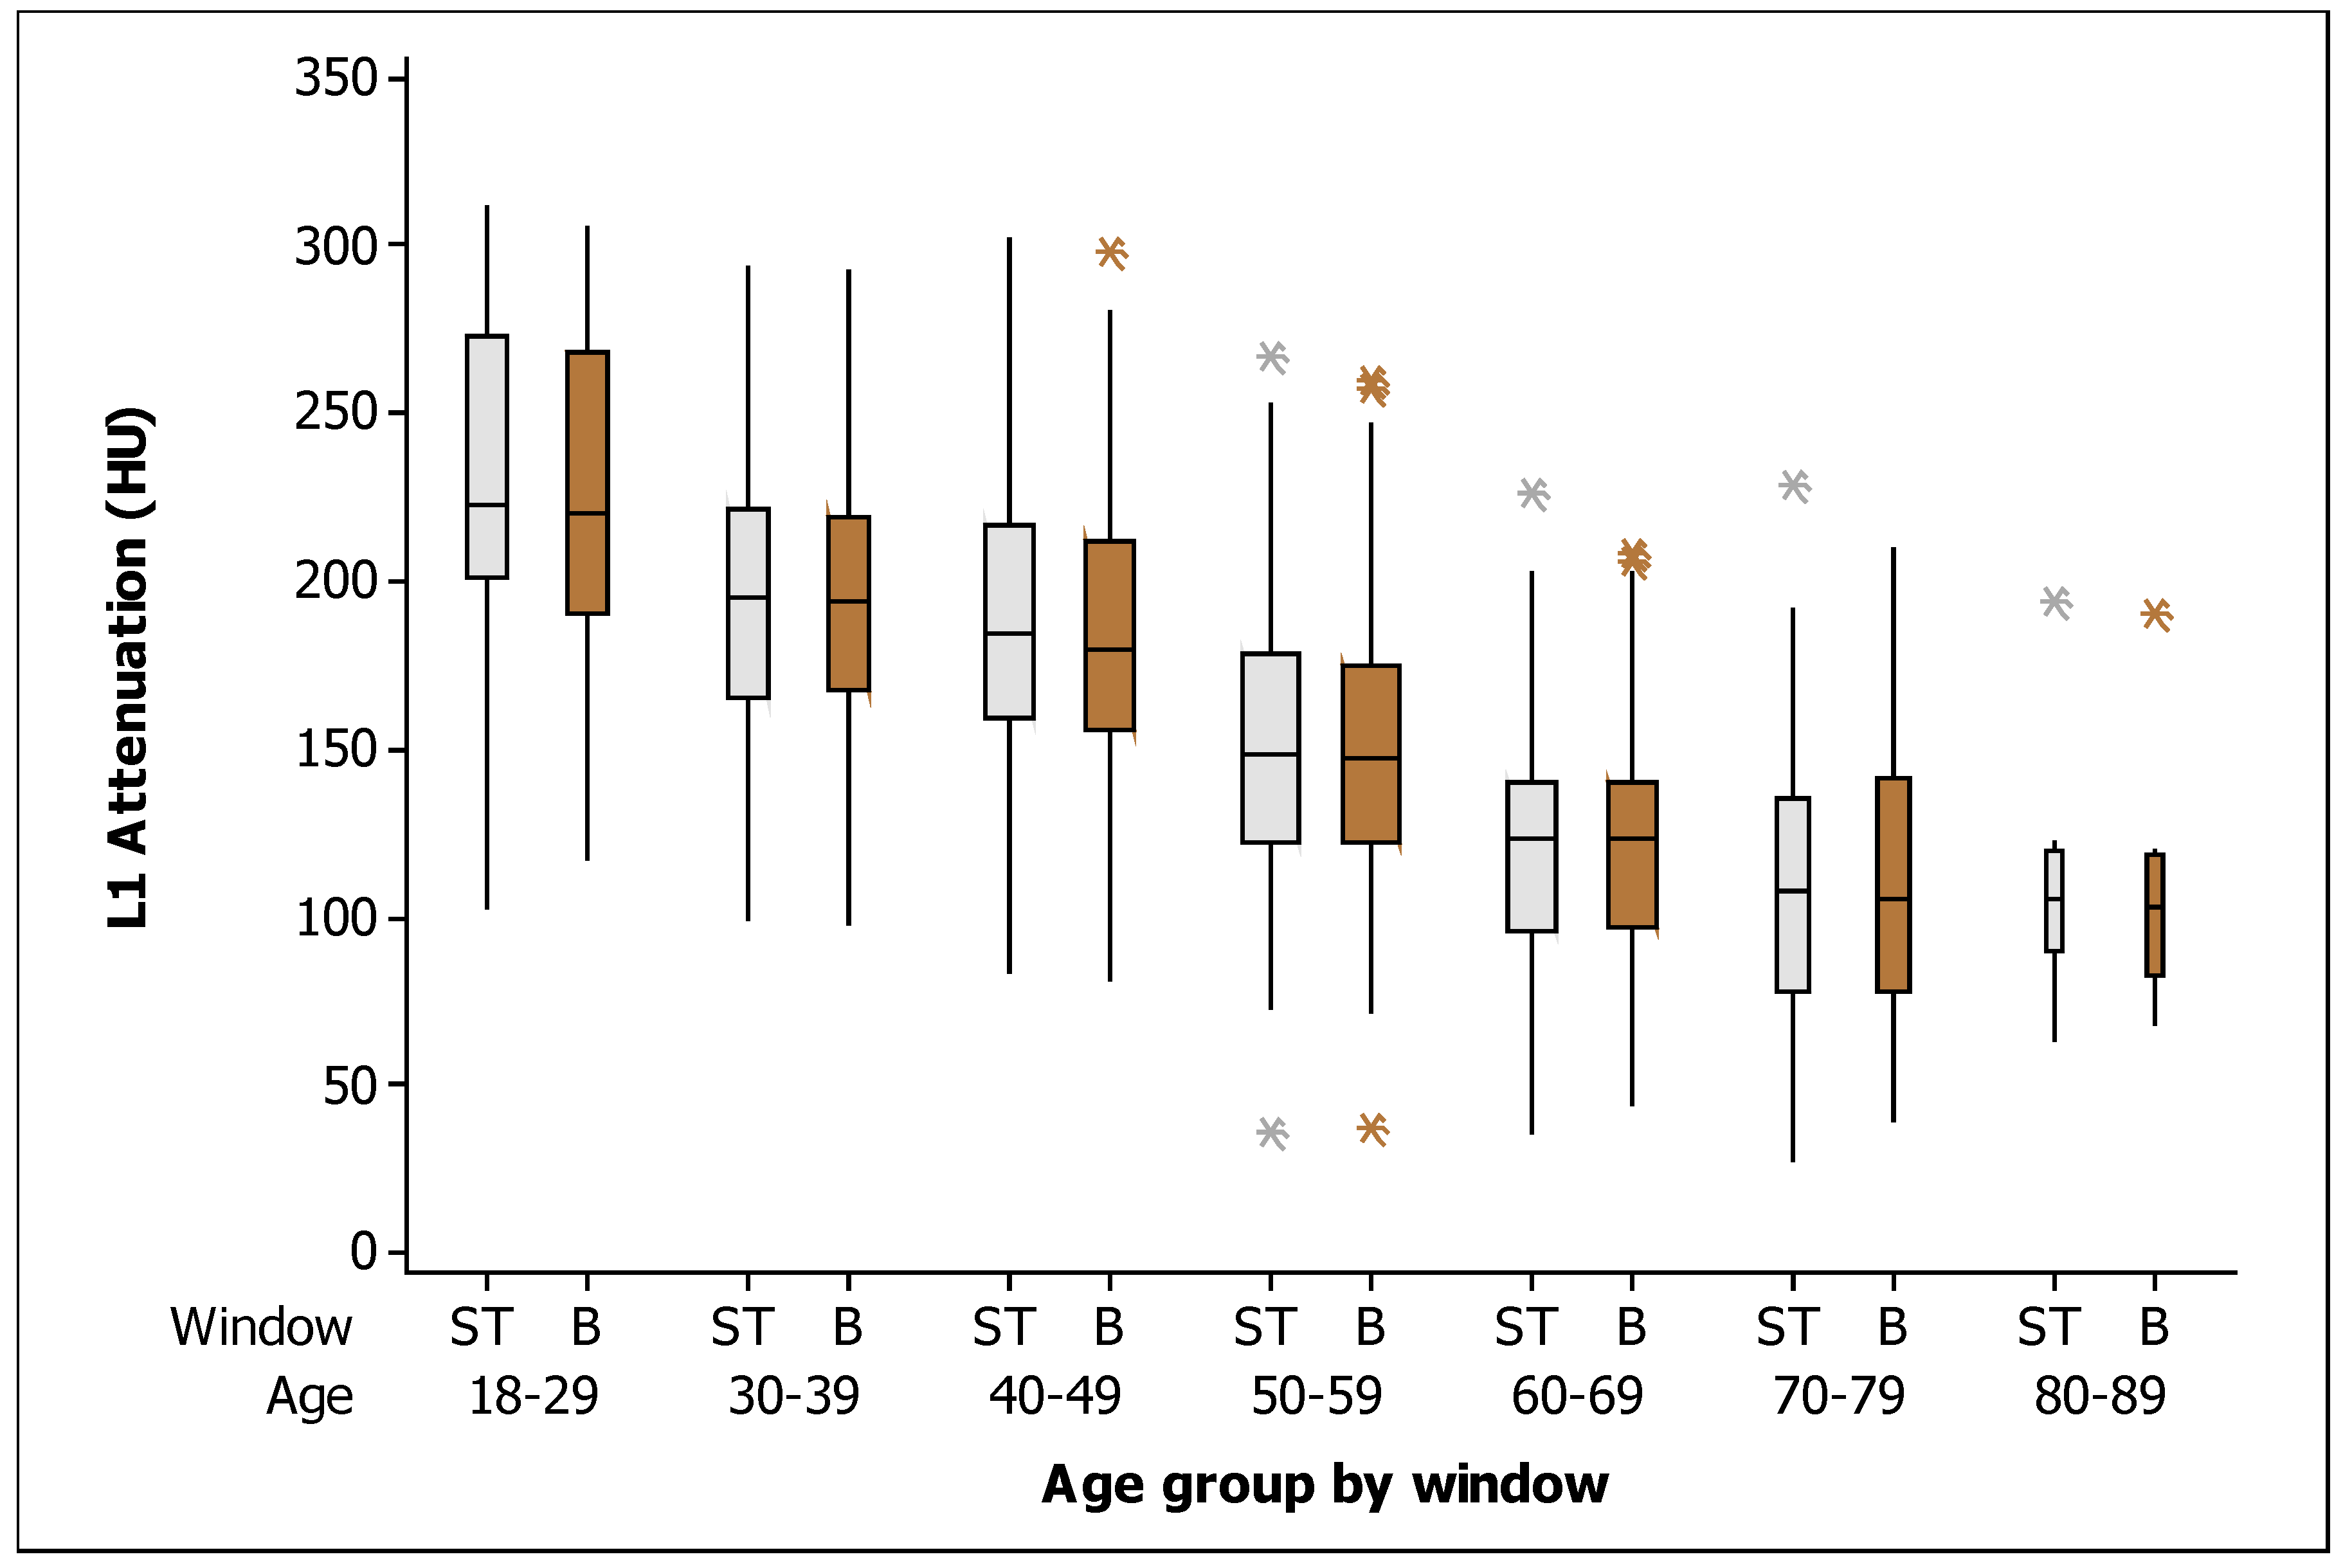
| BMD in soft tissue window (HU) | 163.90 (57.13) |
| BMD in bone window (HU) | 161.86 (55.80) |
| Soft Tissue Window | ||||||
|---|---|---|---|---|---|---|
| Age | Mean | SD | Q1 | Median | Q3 | n |
| 18–29 | 229.27 | 47.29 | 201.00 | 223.00 | 273.00 | 55 |
| 30–39 | 196.13 | 44.90 | 166.00 | 195.00 | 222.00 | 61 |
| 40–49 | 187.11 | 46.53 | 159.50 | 185.00 | 217.00 | 85 |
| 50–59 | 152.90 | 43.14 | 122.00 | 149.00 | 179.00 | 115 |
| 60–69 | 124.08 | 35.59 | 96.50 | 123.00 | 140.00 | 80 |
| 70–79 | 110.68 | 42.00 | 77.50 | 107.50 | 135.75 | 48 |
| 80–89 | 110.90 | 34.17 | 90.25 | 105.50 | 119.75 | 10 |
| Bone window | ||||||
| Age | Mean | SD | Q1 | Median | Q3 | n |
| 18–29 | 225.61 | 46.93 | 190.00 | 220.00 | 268.00 | 55 |
| 30–39 | 193.56 | 42.19 | 168.00 | 194.00 | 219.00 | 61 |
| 40–49 | 184.45 | 45.86 | 155.50 | 180.00 | 212.00 | 85 |
| 50–59 | 150.46 | 42.09 | 122.00 | 148.00 | 175.00 | 115 |
| 60–69 | 122.76 | 34.84 | 97.25 | 123.50 | 139.75 | 80 |
| 70–79 | 112.45 | 42.95 | 78.00 | 106.00 | 142.00 | 48 |
| 80–89 | 106.90 | 34.50 | 82.50 | 103.50 | 118.50 | 10 |
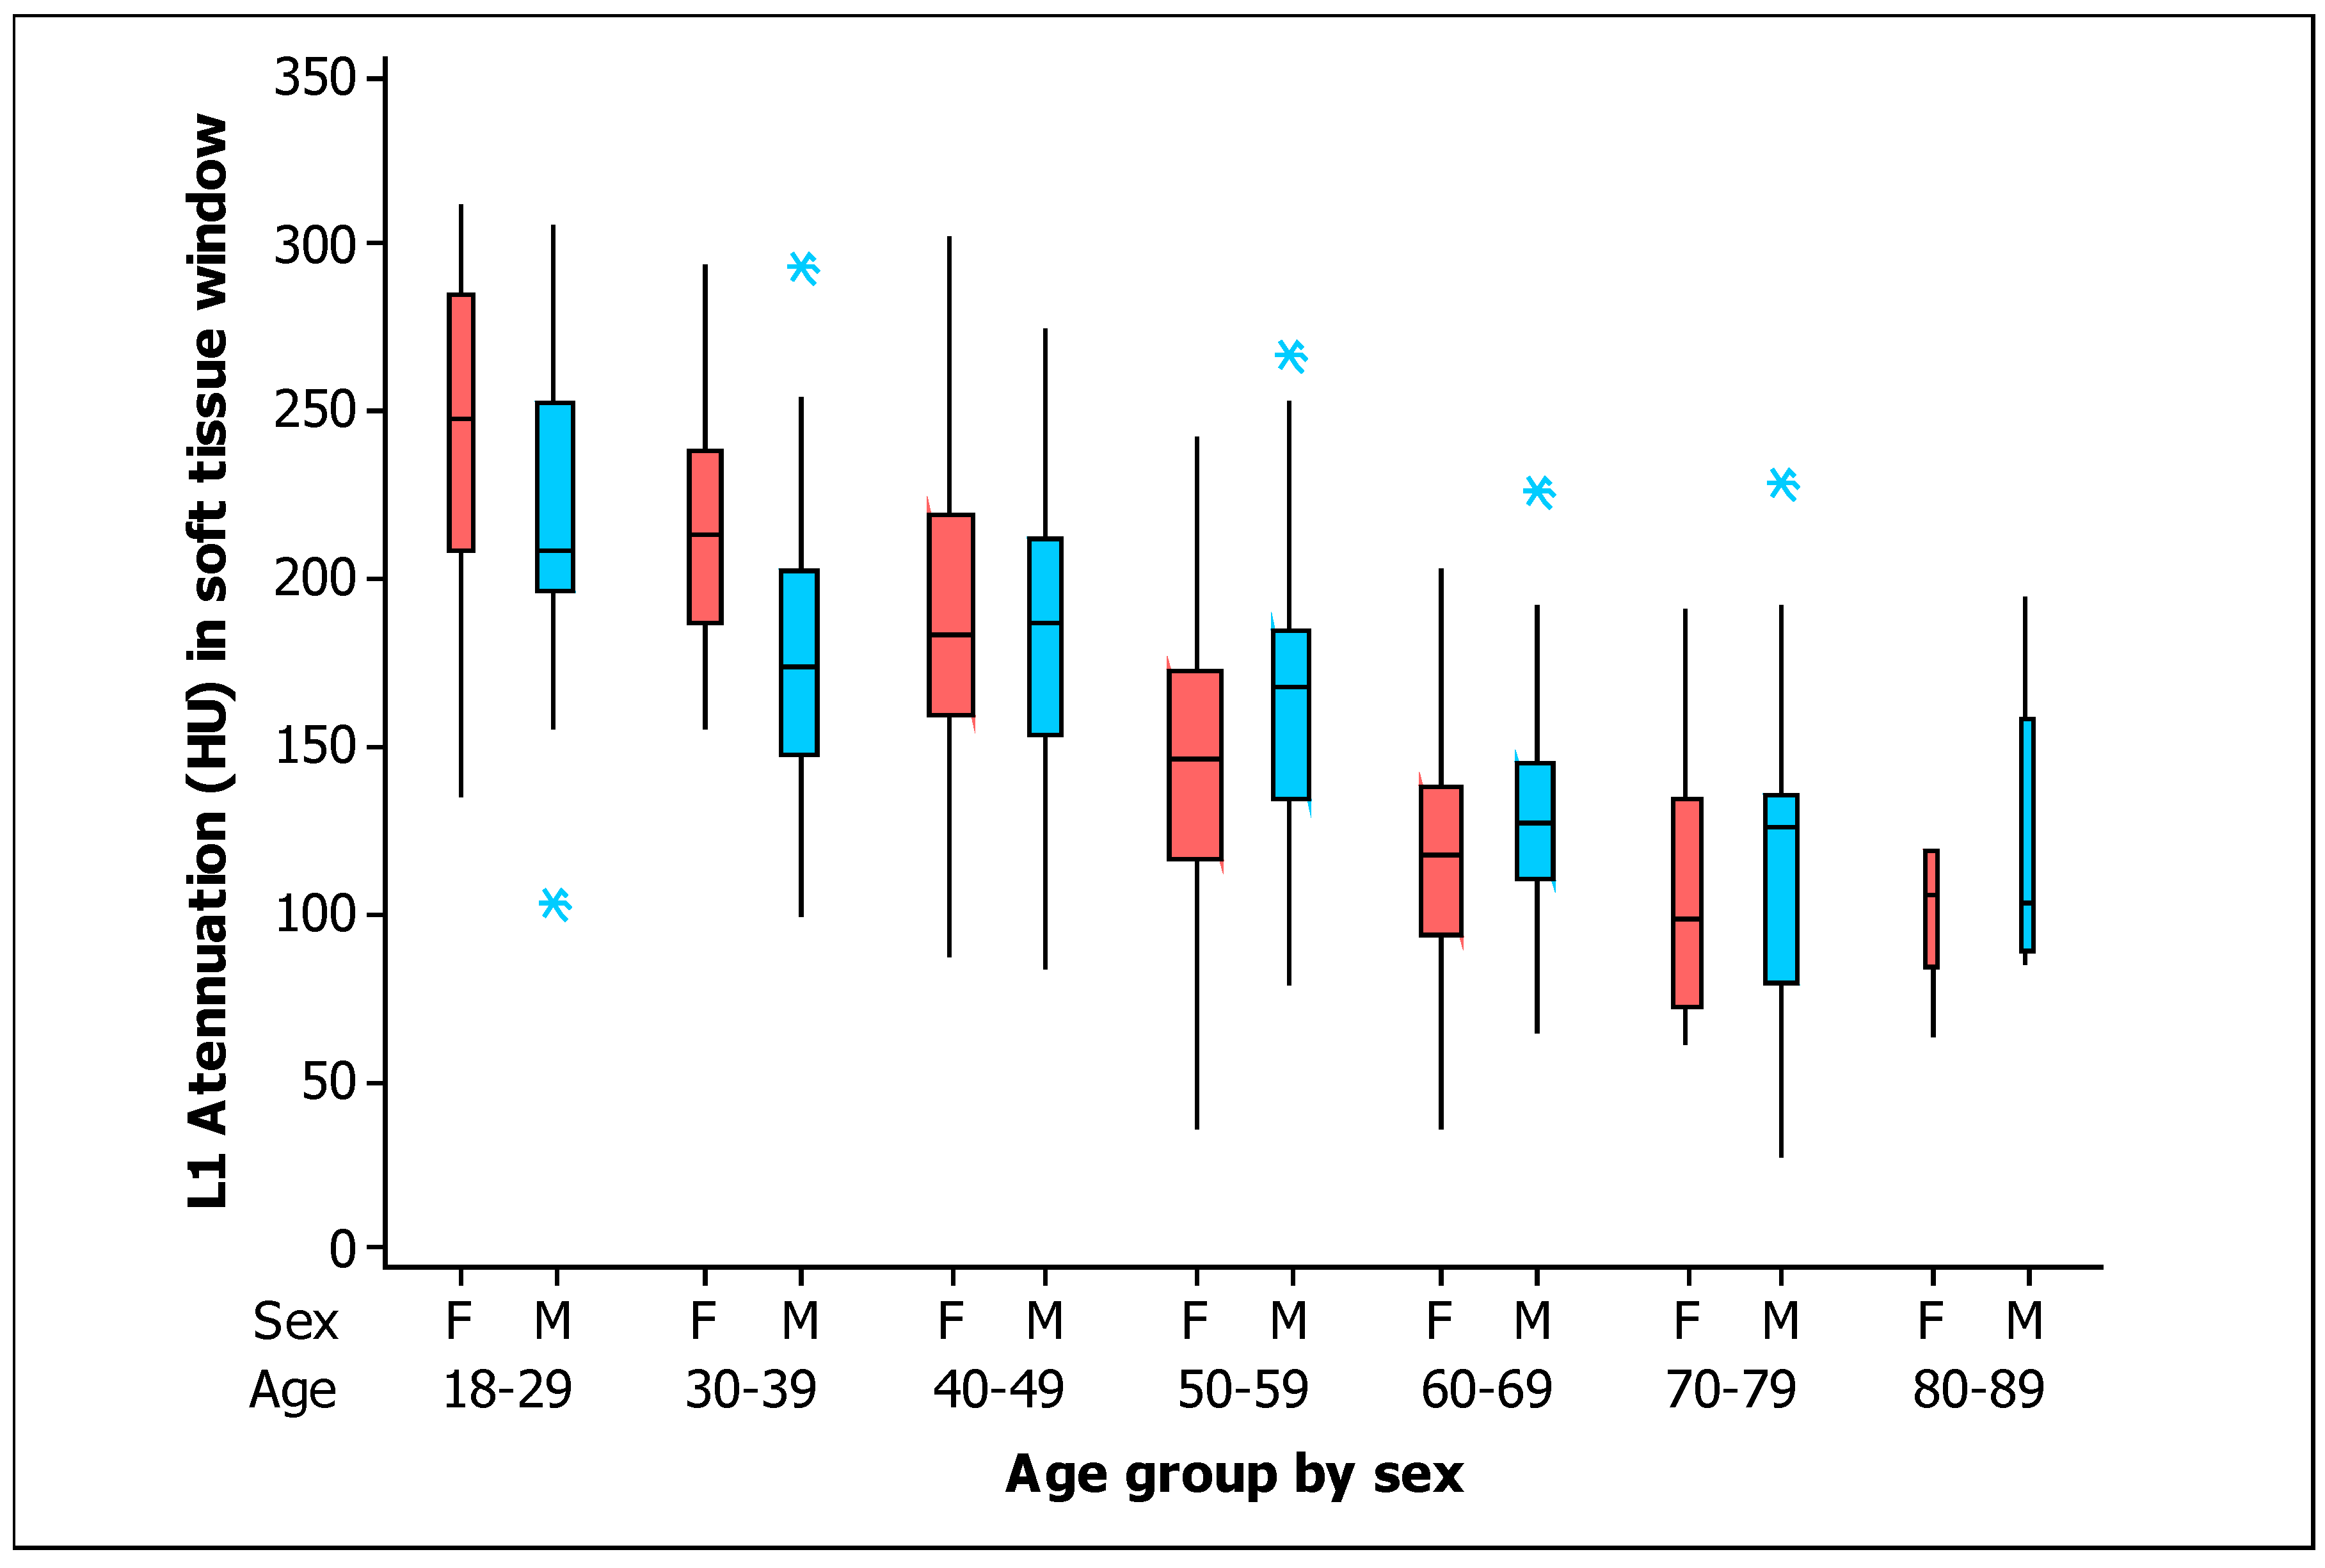
| Men | ||||||
|---|---|---|---|---|---|---|
| Age | Mean | SD | Q1 | Median | Q3 | n |
| 18–29 | 219.79 | 44.80 | 198.00 | 208.50 | 244.00 | 34 |
| 30–39 | 179.50 | 43.11 | 147.25 | 173.50 | 199.50 | 34 |
| 40–49 | 185.26 | 46.01 | 157.50 | 187.00 | 212.00 | 31 |
| 50–59 | 166.08 | 45.18 | 135.50 | 168.00 | 183.00 | 40 |
| 60–69 | 129.72 | 33.40 | 110.00 | 127.00 | 144.50 | 39 |
| 70–79 | 113.68 | 44.12 | 81.25 | 126.00 | 136.00 | 28 |
| 80–89 | 119.20 | 44.09 | 92.00 | 103.00 | 122.00 | 5 |
| Women | ||||||
| Age | Mean | SD | Q1 | Median | Q3 | n |
| 18–29 | 244.62 | 48.23 | 213.00 | 248.00 | 279.00 | 21 |
| 30–39 | 217.07 | 38.43 | 190.50 | 213.00 | 235.50 | 27 |
| 40–49 | 188.19 | 47.23 | 160.25 | 183.50 | 217.75 | 54 |
| 50–59 | 145.87 | 40.59 | 116.50 | 146.00 | 172.00 | 75 |
| 60–69 | 118.71 | 37.16 | 94.00 | 118.00 | 137.00 | 41 |
| 70–79 | 106.50 | 39.57 | 72.00 | 99.00 | 132.75 | 20 |
| 80–89 | 102.60 | 22.61 | 105.00 | 106.00 | 119.00 | 5 |
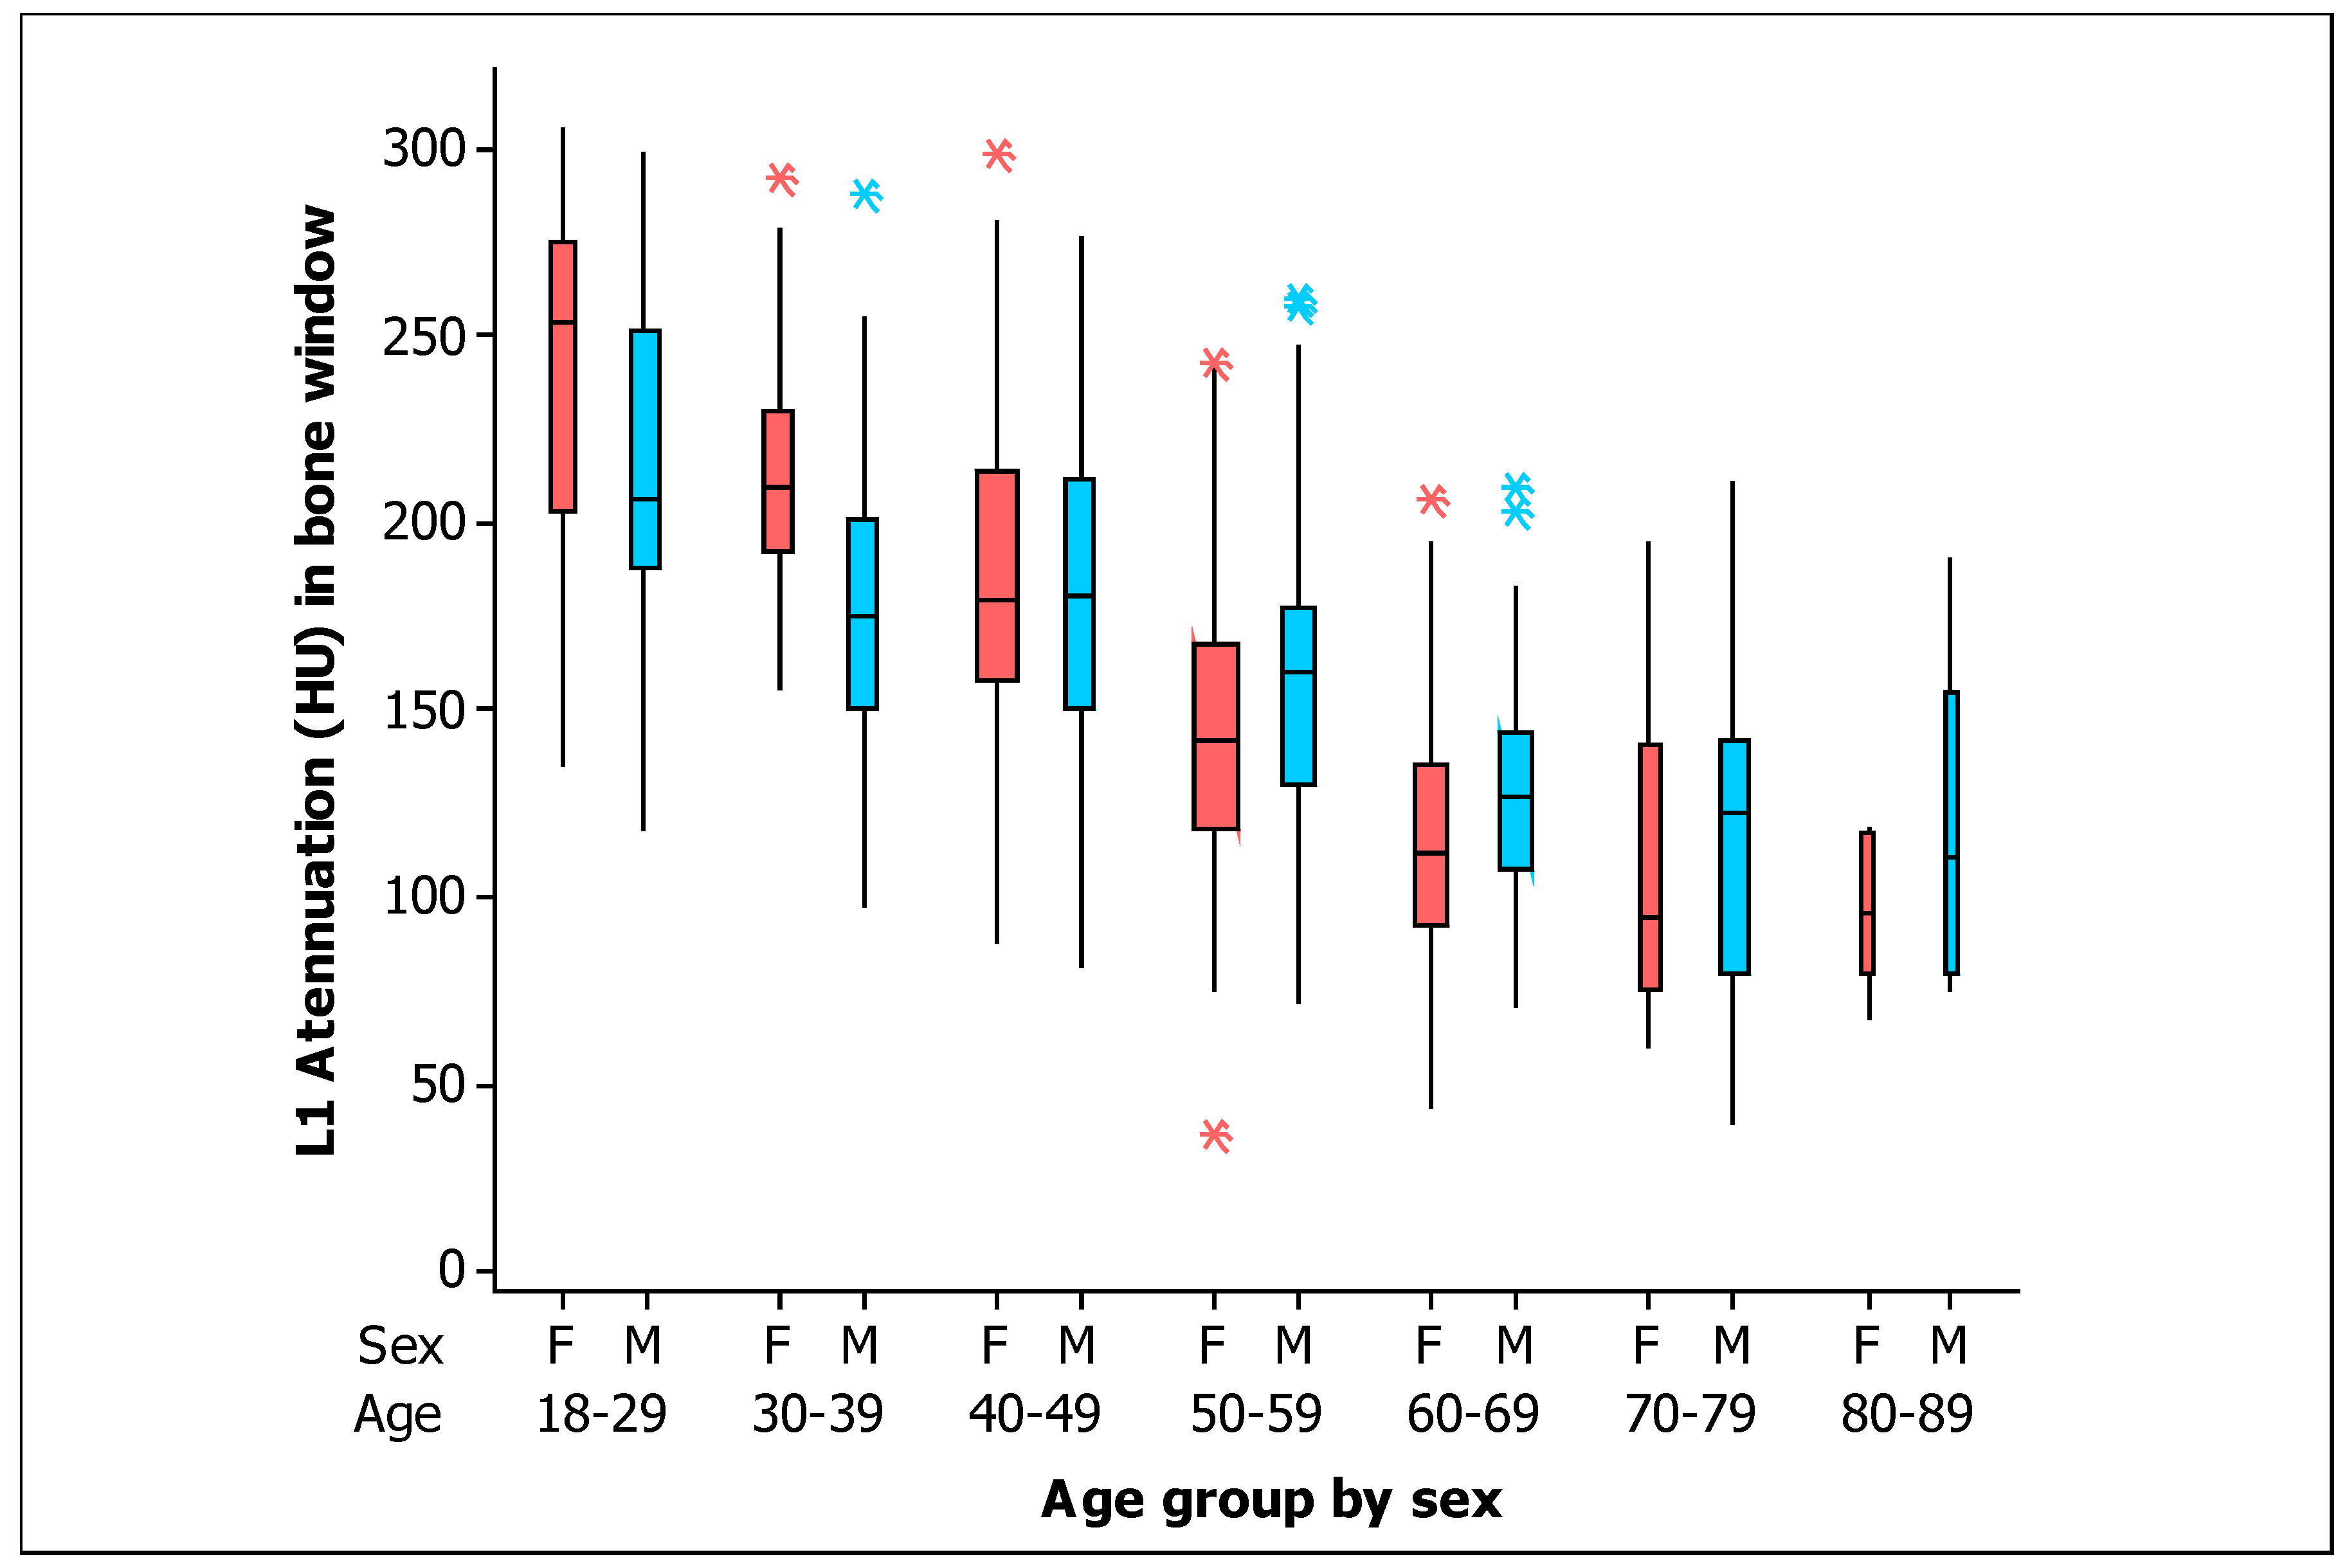
| Men | ||||||
|---|---|---|---|---|---|---|
| Age | Mean | SD | Q1 | Median | Q3 | n |
| 18–29 | 216.41 | 44.65 | 188.50 | 206.00 | 246.75 | 34 |
| 30–39 | 177.59 | 40.98 | 151.25 | 175.50 | 198.00 | 34 |
| 40–49 | 182.74 | 46.60 | 152.50 | 180.00 | 212.00 | 31 |
| 50–59 | 163.10 | 44.02 | 130.75 | 160.00 | 175.75 | 40 |
| 60–69 | 128.90 | 32.08 | 108.00 | 127.00 | 142.00 | 39 |
| 70–79 | 115.89 | 44.54 | 82.50 | 122.50 | 142.00 | 28 |
| 80–89 | 116.20 | 45.16 | 85.00 | 111.00 | 120.00 | 5 |
| Women | ||||||
| Age | Mean | SD | Q1 | Median | Q3 | n |
| 18–29 | 240.52 | 47.74 | 205.00 | 253.00 | 270.00 | 21 |
| 30–39 | 213.67 | 34.96 | 193.00 | 209.00 | 227.50 | 27 |
| 40–49 | 185.43 | 45.84 | 158.00 | 179.50 | 210.75 | 54 |
| 50–59 | 143.72 | 39.70 | 118.50 | 142.00 | 166.50 | 75 |
| 60–69 | 116.93 | 36.71 | 95.00 | 112.00 | 134.00 | 41 |
| 70–79 | 107.65 | 41.27 | 77.00 | 94.00 | 137.00 | 20 |
| 80–89 | 97.60 | 20.56 | 90.00 | 96.00 | 116.00 | 5 |
Disclaimer/Publisher’s Note: The statements, opinions and data contained in all publications are solely those of the individual author(s) and contributor(s) and not of MDPI and/or the editor(s). MDPI and/or the editor(s) disclaim responsibility for any injury to people or property resulting from any ideas, methods, instructions or products referred to in the content. |
© 2023 by the authors. Licensee MDPI, Basel, Switzerland. This article is an open access article distributed under the terms and conditions of the Creative Commons Attribution (CC BY) license (https://creativecommons.org/licenses/by/4.0/).
Share and Cite
Castillo-López, J.A.; Bravo-Ontiveros, F.; Rodea-Montero, E.R. Identification of Bone Mineral Density Deficit Using L1 Trabecular Attenuation by Opportunistic Multidetector CT Scan in Adult Patients. Tomography 2023, 9, 150-161. https://doi.org/10.3390/tomography9010013
Castillo-López JA, Bravo-Ontiveros F, Rodea-Montero ER. Identification of Bone Mineral Density Deficit Using L1 Trabecular Attenuation by Opportunistic Multidetector CT Scan in Adult Patients. Tomography. 2023; 9(1):150-161. https://doi.org/10.3390/tomography9010013
Chicago/Turabian StyleCastillo-López, Juan Andrés, Fernando Bravo-Ontiveros, and Edel Rafael Rodea-Montero. 2023. "Identification of Bone Mineral Density Deficit Using L1 Trabecular Attenuation by Opportunistic Multidetector CT Scan in Adult Patients" Tomography 9, no. 1: 150-161. https://doi.org/10.3390/tomography9010013