
Evaluating the Image Quality of Neck Structures Scanned on Chest CT with Low-Concentration-Iodine Contrast Media


Abstract
:1. Introduction
2. Material and Methods
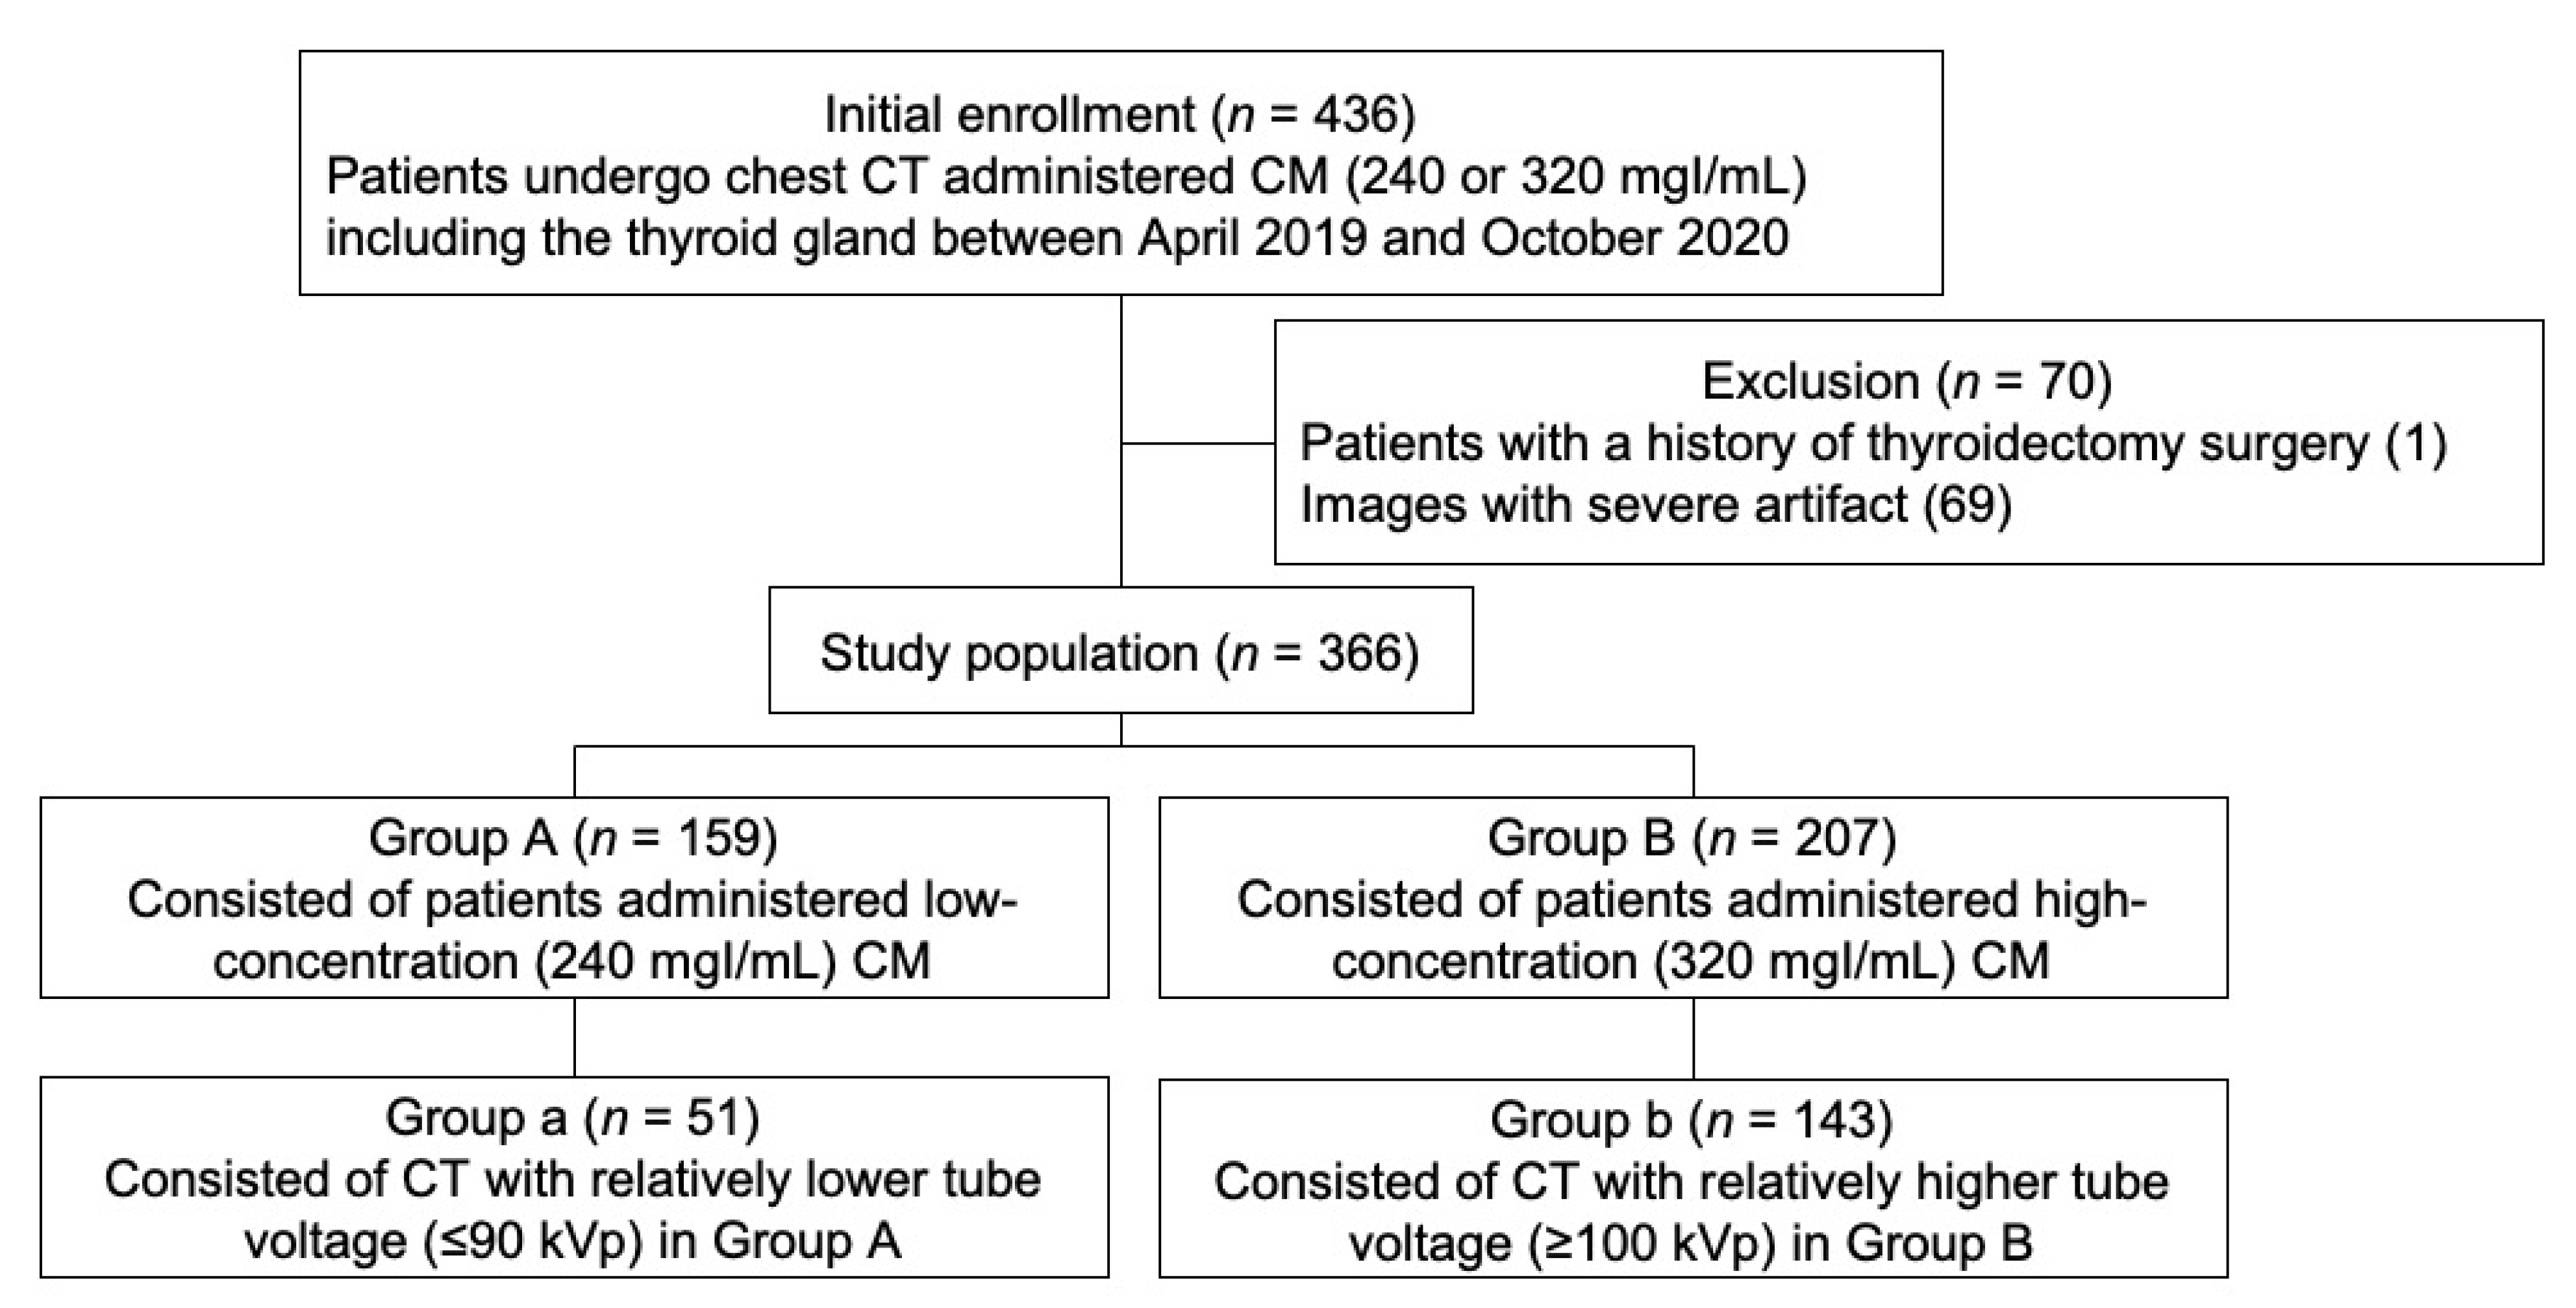
2.1. Study Population
2.2. CT Protocol
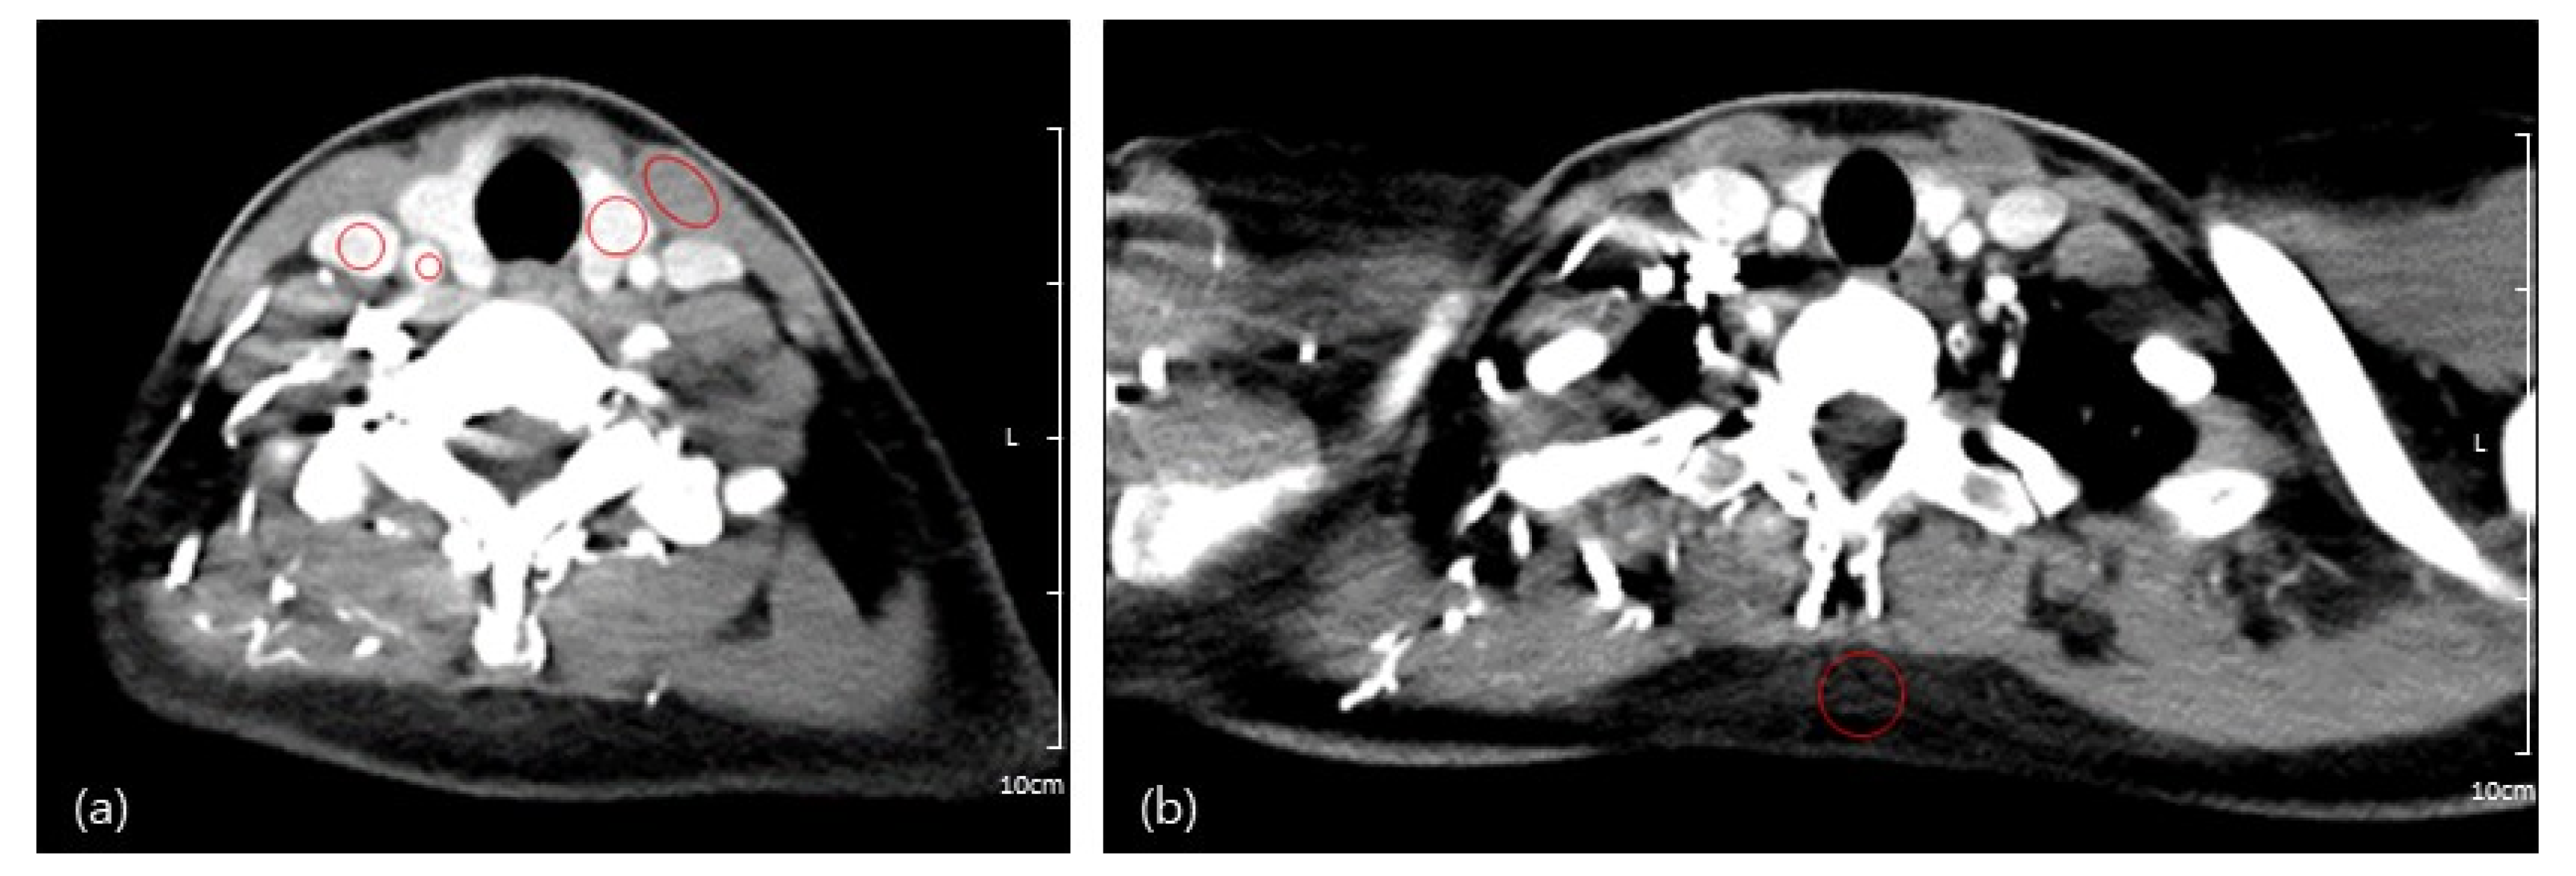
2.3. Image Analyses
2.4. Radiation Dose
2.5. Statistical Analysis
3. Results
3.1. Demographics
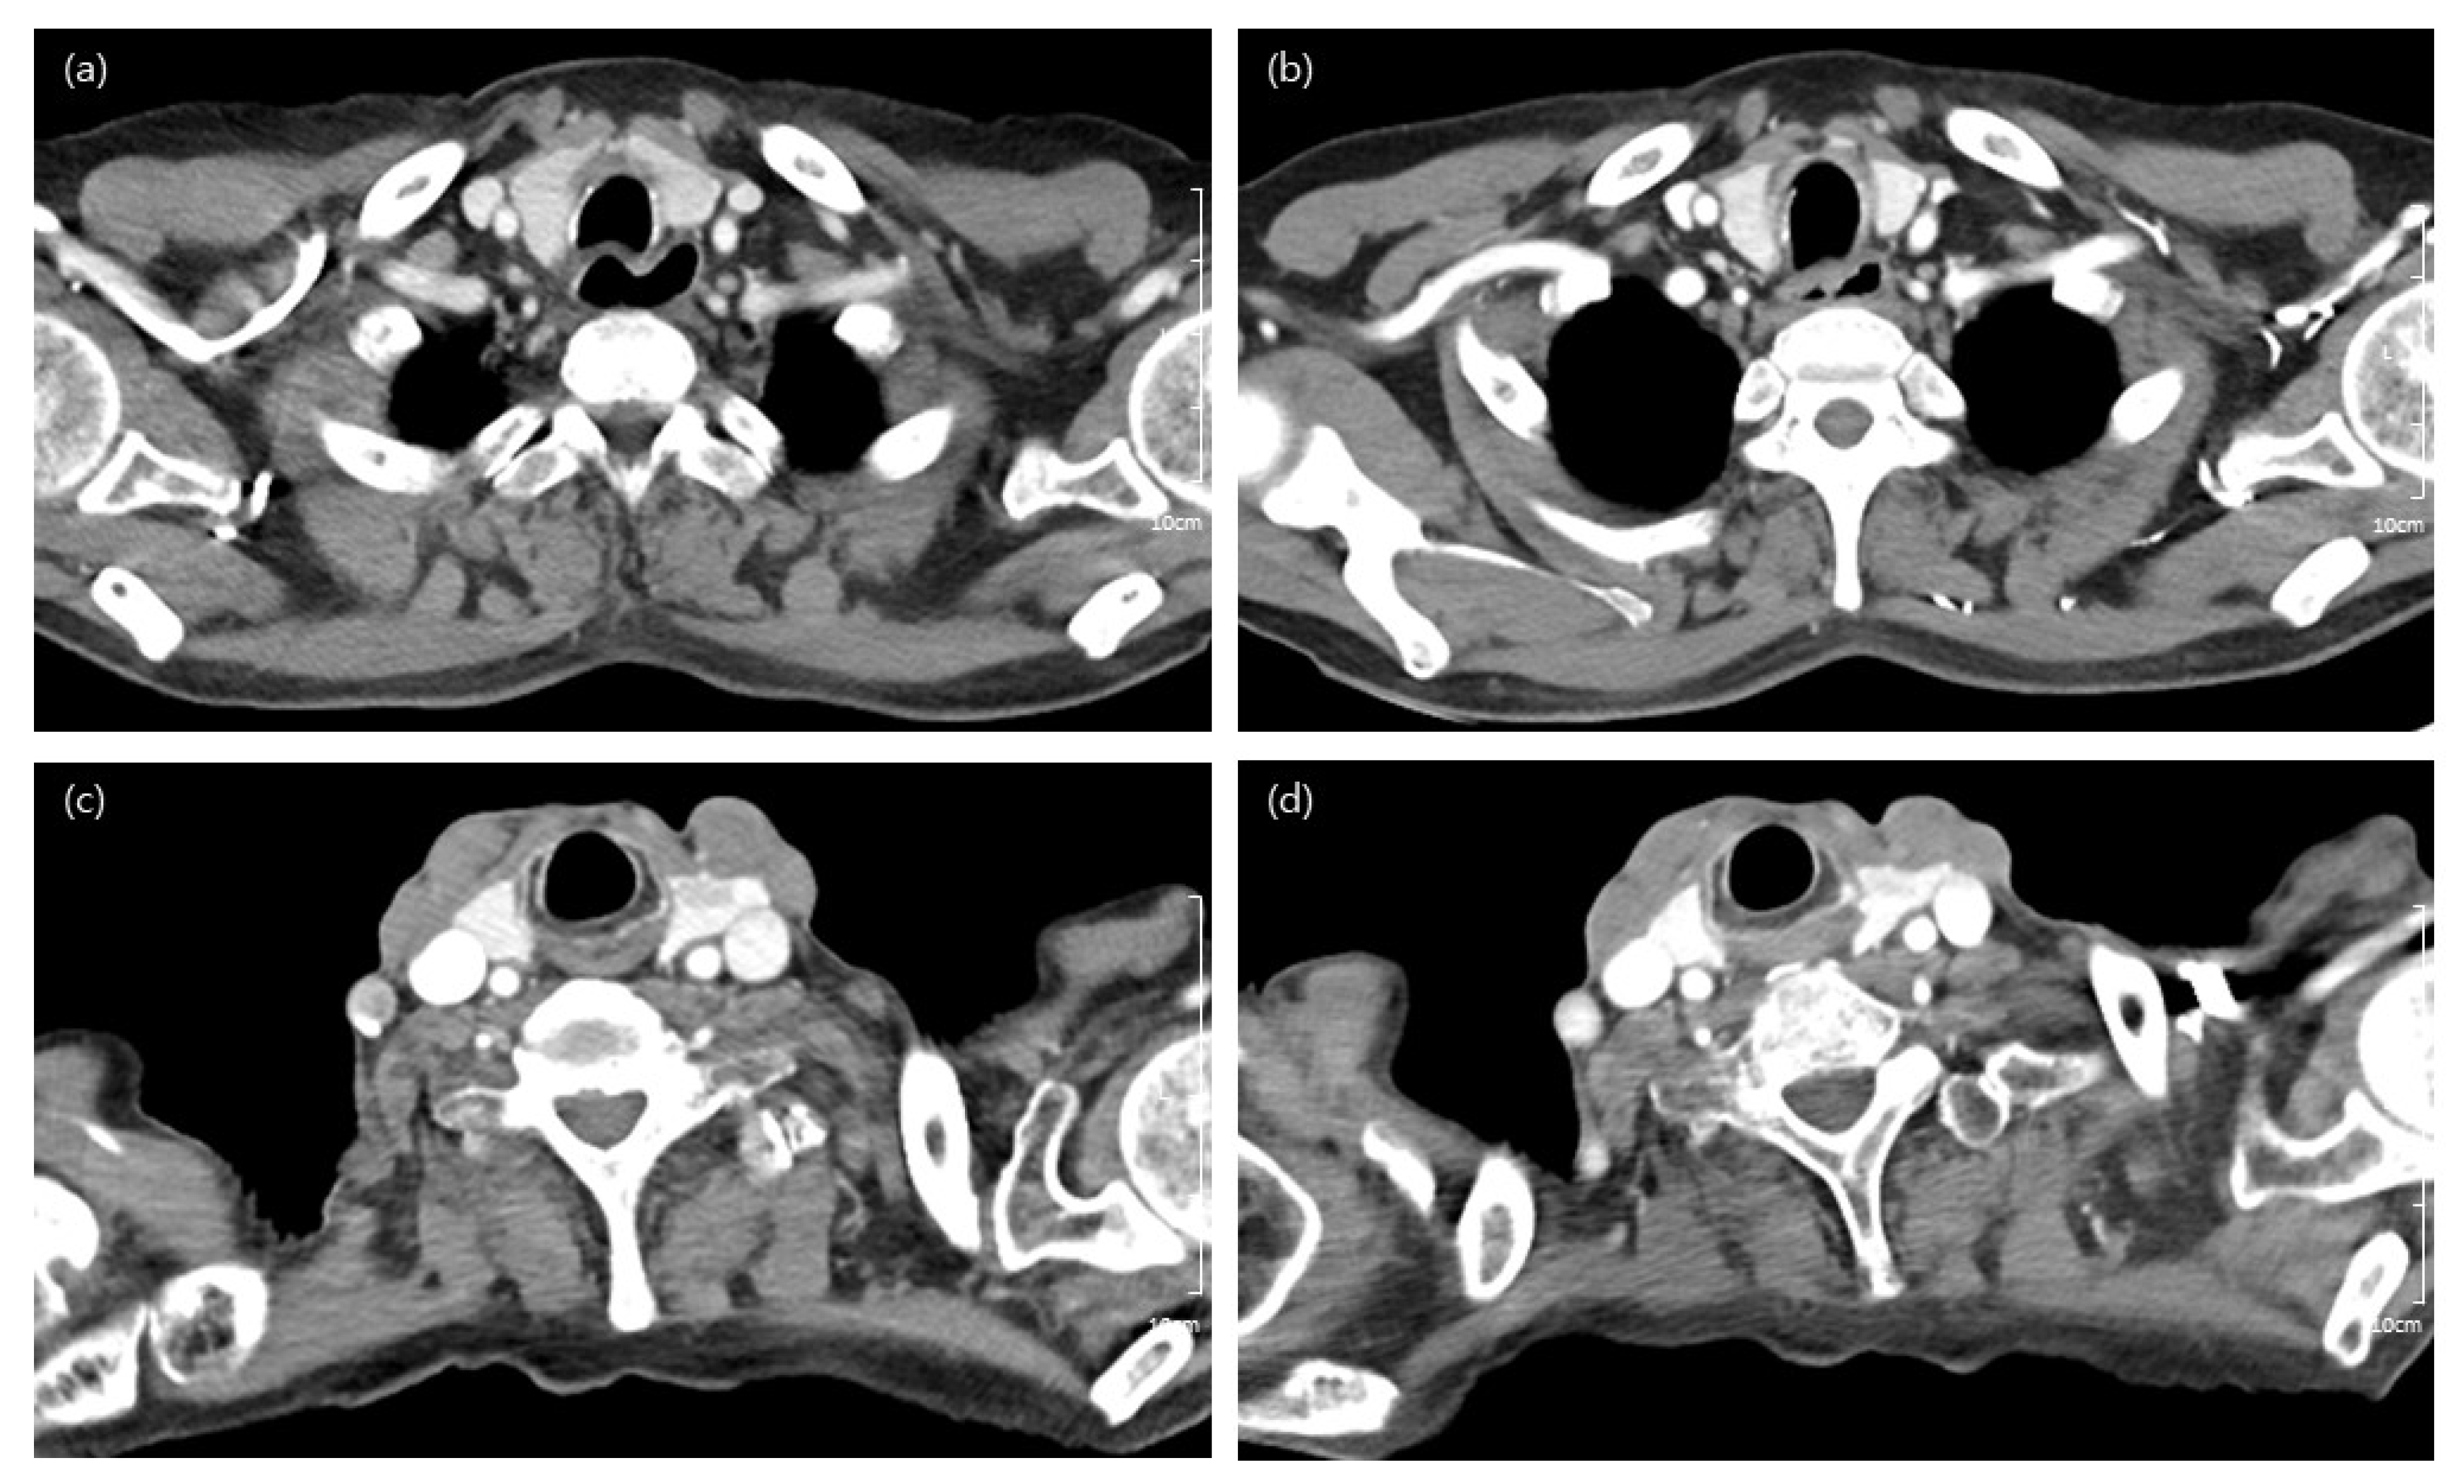
3.2. Qualitative Image Analyses
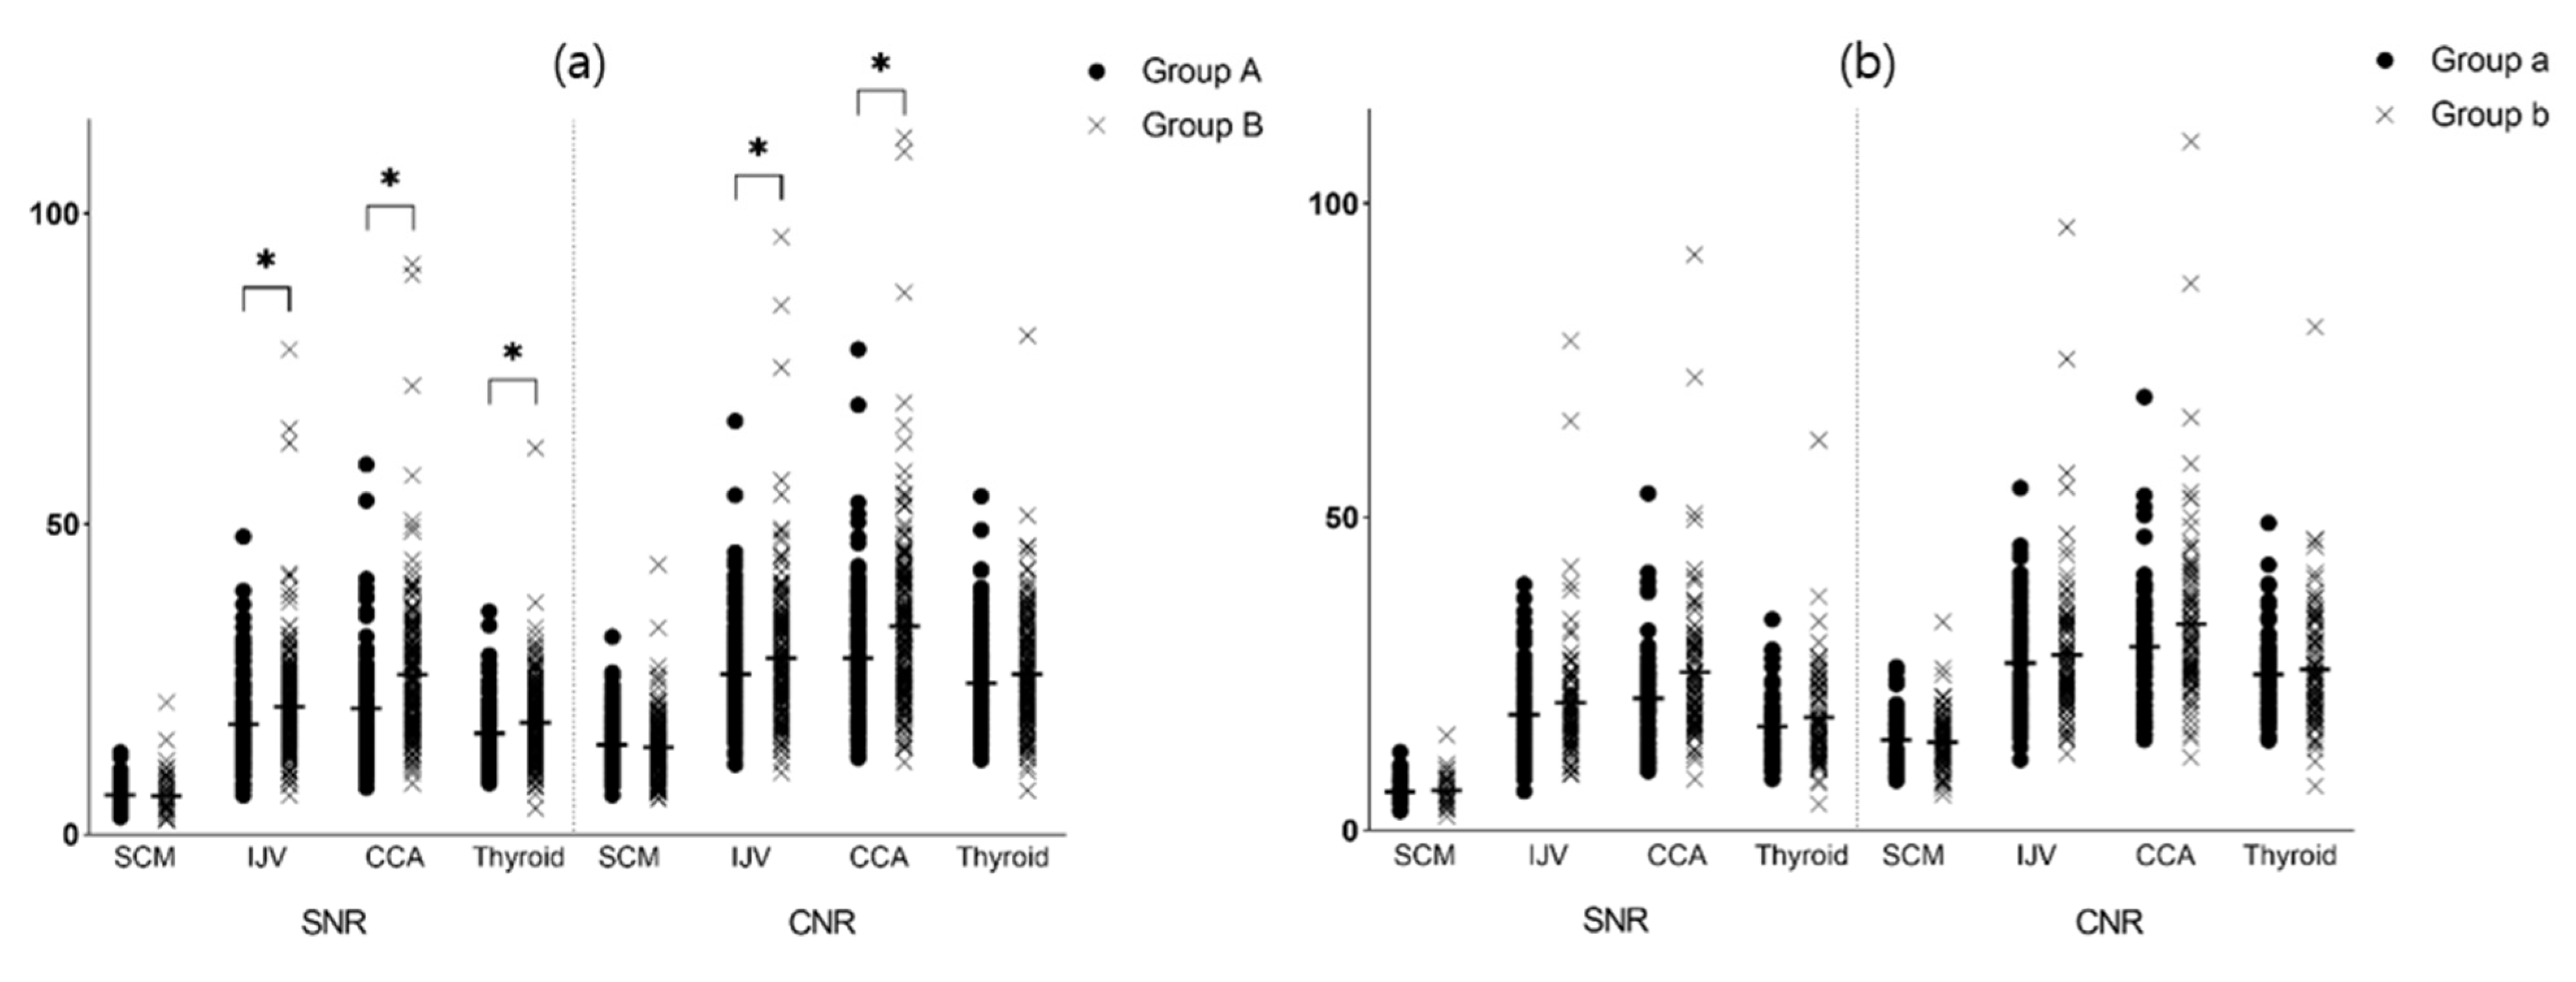
3.3. Quantitative Image Analyses
3.4. Estimation of Radiation Dose
4. Discussion
5. Conclusions
Supplementary Materials
Author Contributions
Funding
Institutional Review Board Statement
Informed Consent Statement
Data Availability Statement
Acknowledgments
Conflicts of Interest
References
- Kodzwa, R. ACR Manual on Contrast Media: 2018 Updates. Radiol. Technol. 2019, 91, 97–100. [Google Scholar]
- Dammann, F.; Bootz, F.; Cohnen, M.; Hassfeld, S.; Tatagiba, M.; Kosling, S. Diagnostic imaging modalities in head and neck disease. Dtsch. Arztebl. Int. 2014, 111, 417–423. [Google Scholar] [CrossRef] [Green Version]
- Bin Saeedan, M.; Aljohani, I.M.; Khushaim, A.O.; Bukhari, S.Q.; Elnaas, S.T. Thyroid computed tomography imaging: Pictorial review of variable pathologies. Insights Imaging 2016, 7, 601–617. [Google Scholar] [CrossRef] [Green Version]
- Di Martino, E.; Nowak, B.; Hassan, H.A.; Hausmann, R.; Adam, G.; Buell, U.; Westhofen, M. Diagnosis and staging of head and neck cancer: A comparison of modern imaging modalities (positron emission tomography, computed tomography, color-coded duplex sonography) with panendoscopic and histopathologic findings. Arch. Otolaryngol. Head Neck Surg. 2000, 126, 1457–1461. [Google Scholar] [CrossRef] [Green Version]
- Wang, C.L.; Cohan, R.H.; Ellis, J.H.; Caoili, E.M.; Wang, G.; Francis, I.R. Frequency, outcome, and appropriateness of treatment of nonionic iodinated contrast media reactions. AJR Am. J. Roentgenol. 2008, 191, 409–415. [Google Scholar] [CrossRef]
- Christiansen, C. X-ray contrast media--an overview. Toxicology 2005, 209, 185–187. [Google Scholar] [CrossRef]
- Brockow, K. Contrast media hypersensitivity--scope of the problem. Toxicology 2005, 209, 189–192. [Google Scholar] [CrossRef]
- Brenner, D.J.; Hall, E.J. Computed tomography--an increasing source of radiation exposure. N. Engl. J. Med. 2007, 357, 2277–2284. [Google Scholar] [CrossRef] [Green Version]
- Alzen, G.; Benz-Bohm, G. Radiation protection in pediatric radiology. Dtsch. Arztebl. Int. 2011, 108, 407–414. [Google Scholar] [CrossRef]
- Caro, J.J.; Trindade, E.; McGregor, M. The risks of death and of severe nonfatal reactions with high- vs low-osmolality contrast media: A meta-analysis. AJR Am. J. Roentgenol. 1991, 156, 825–832. [Google Scholar] [CrossRef] [Green Version]
- McCullough, P.A.; Wolyn, R.; Rocher, L.L.; Levin, R.N.; O’Neill, W.W. Acute renal failure after coronary intervention: Incidence, risk factors, and relationship to mortality. Am. J. Med. 1997, 103, 368–375. [Google Scholar] [CrossRef]
- Dangas, G.; Iakovou, I.; Nikolsky, E.; Aymong, E.D.; Mintz, G.S.; Kipshidze, N.N.; Lansky, A.J.; Moussa, I.; Stone, G.W.; Moses, J.W.; et al. Contrast-induced nephropathy after percutaneous coronary interventions in relation to chronic kidney disease and hemodynamic variables. Am. J. Cardiol. 2005, 95, 13–19. [Google Scholar] [CrossRef] [PubMed]
- Perrin, T.; Descombes, E.; Cook, S. Contrast-induced nephropathy in invasive cardiology. Swiss Med. Wkly. 2012, 142, w13608. [Google Scholar] [CrossRef] [PubMed] [Green Version]
- Leung, A.M.; Braverman, L.E. Iodine-induced thyroid dysfunction. Curr. Opin. Endocrinol. Diabetes Obes. 2012, 19, 414–419. [Google Scholar] [CrossRef] [PubMed] [Green Version]
- Leung, A.M.; Braverman, L.E. Consequences of excess iodine. Nat. Rev. Endocrinol. 2014, 10, 136–142. [Google Scholar] [CrossRef] [PubMed] [Green Version]
- Morcos, S.K. Contrast-induced nephropathy: Are there differences between low osmolar and iso-osmolar iodinated contrast media? Clin. Radiol. 2009, 64, 468–472. [Google Scholar] [CrossRef]
- Stacul, F.; van der Molen, A.J.; Reimer, P.; Webb, J.A.W.; Thomsen, H.S.; Morcos, S.K.; Almén, T.; Aspelin, P.; Bellin, M.-F.; Clement, O.; et al. Contrast induced nephropathy: Updated ESUR Contrast Media Safety Committee guidelines. Eur. Radiol. 2011, 21, 2527–2541. [Google Scholar] [CrossRef]
- Isaka, Y.; Hayashi, H.; Aonuma, K.; Horio, M.; Terada, Y.; Doi, K.; Fujigaki, Y.; Yasuda, H.; Sato, T.; Fujikura, T.; et al. Guideline on the use of iodinated contrast media in patients with kidney disease 2018. Clin. Exp. Nephrol. 2020, 38, 3–46. [Google Scholar] [CrossRef] [Green Version]
- Stern, S. Nationwide evaluation of x-ray trends (NEXT): Tabulation and graphical summary of 2000 survey of computed tomography. In Proceedings of the Frankfort: Conference of Radiation Control Program Directors, Frankfort, IL, USA, 28 August 2000; CRCPD Publication: Frankfort, IL, USA, 2007. [Google Scholar]
- Goldman, L.W. Principles of CT: Radiation dose and image quality. J. Nucl. Med. Technol. 2007, 35, 213–225. [Google Scholar] [CrossRef] [Green Version]
- Kim, S.Y.; Cho, J.Y.; Lee, J.; Hwang, S.I.; Moon, M.H.; Lee, E.J.; Hong, S.S.; Kim, C.K.; Kim, K.A.; Park, S.B.; et al. Low-Tube-Voltage CT Urography Using Low-Concentration-Iodine Contrast Media and Iterative Reconstruction: A Multi-Institutional Randomized Controlled Trial for Comparison with Conventional CT Urography. Korean J. Radiol. 2018, 19, 1119–1129. [Google Scholar] [CrossRef]
- Yeom, J.A.; Roh, J.; Jeong, Y.J.; Lee, J.C.; Kim, H.Y.; Suh, Y.J.; Baik, S.K. Ultra-Low-Dose Neck CT With Low-Dose Contrast Material for Preoperative Staging of Thyroid Cancer: Image Quality and Diagnostic Performance. AJR Am. J. Roentgenol. 2019, 212, 748–754. [Google Scholar] [CrossRef]
- Cha, M.J.; Kim, S.M.; Ahn, T.R.; Choe, Y.H. Comparing feasibility of low-tube-voltage protocol with low-iodine-concentration contrast and high-tube-voltage protocol with high-iodine-concentration contrast in coronary computed tomography angiography. PLoS ONE 2020, 15, e0236108. [Google Scholar] [CrossRef]
- Farr, R.; Allisy-Roberts, P. Radiation physics. Phys. Med. Imaging. Lond. Engl. Elsevier Sci. 2002, 19, 22. [Google Scholar]
- Aschoff, A.J.; Catalano, C.; Kirchin, M.A.; Krix, M.; Albrecht, T. Low radiation dose in computed tomography: The role of iodine. Br. J. Radiol. 2017, 90, 20170079. [Google Scholar] [CrossRef]
- Nakayama, Y.; Awai, K.; Funama, Y.; Hatemura, M.; Imuta, M.; Nakaura, T.; Ryu, D.; Morishita, S.; Sultana, S.; Sato, N.; et al. Abdominal CT with low tube voltage: Preliminary observations about radiation dose, contrast enhancement, image quality, and noise. Radiology 2005, 237, 945–951. [Google Scholar] [CrossRef]
- Gnannt, R.; Winklehner, A.; Goetti, R.; Schmidt, B.; Kollias, S.; Alkadhi, H. Low kilovoltage CT of the neck with 70 kVp: Comparison with a standard protocol. AJNR Am. J. Neuroradiol. 2012, 33, 1014–1019. [Google Scholar] [CrossRef] [Green Version]
- Chhetri, S.; Pendem, S.; Bharath, J.L.; Priyanka. Low kilovoltage and low contrast volume neck CT protocol using iterative reconstruction techniques: A comparison with standard dose protocol. Radiat. Phys. Chem. 2022, 193, 109935. [Google Scholar] [CrossRef]
- Choi, M.H.; Lee, Y.J.; Jung, S.E. The Image Quality and Diagnostic Performance of CT with Low-Concentration Iodine Contrast (240 mg Iodine/mL) for the Abdominal Organs. Diagnostics 2022, 12, 752. [Google Scholar] [CrossRef]
- McCollough, C.H.; Bushberg, J.T.; Fletcher, J.G.; Eckel, L.J. Answers to Common Questions About the Use and Safety of CT Scans. Mayo Clin. Proc. 2015, 90, 1380–1392. [Google Scholar] [CrossRef] [Green Version]
- Marcus, R.P.; Koerner, E.; Aydin, R.C.; Zinsser, D.; Finke, T.; Cyron, C.J.; Bamberg, F.; Nikolaou, K.; Notohamiprodjo, M. The evolution of radiation dose over time: Measurement of a patient cohort undergoing whole-body examinations on three computer tomography generations. Eur. J. Radiol. 2017, 86, 63–69. [Google Scholar] [CrossRef] [Green Version]
- Wortman, J.R.; Shyu, J.Y.; Dileo, J.; Uyeda, J.W.; Sodickson, A.D. Dual-energy CT for routine imaging of the abdomen and pelvis: Radiation dose and image quality. Emerg. Radiol. 2020, 27, 45–50. [Google Scholar] [CrossRef] [PubMed]
- Johnson, T.R.; Krauss, B.; Sedlmair, M.; Grasruck, M.; Bruder, H.; Morhard, D.; Fink, C.; Weckbach, S.; Lenhard, M.; Schmidt, B.; et al. Material differentiation by dual energy CT: Initial experience. Eur. Radiol. 2007, 17, 1510–1517. [Google Scholar] [CrossRef] [PubMed]
- Primak, A.N.; Ramirez Giraldo, J.C.; Liu, X.; Yu, L.; McCollough, C.H. Improved dual-energy material discrimination for dual-source CT by means of additional spectral filtration. Med. Phys. 2009, 36, 1359–1369. [Google Scholar] [CrossRef] [Green Version]
- Primak, A.N.; Giraldo, J.C.; Eusemann, C.D.; Schmidt, B.; Kantor, B.; Fletcher, J.G.; McCollough, C.H. Dual-source dual-energy CT with additional tin filtration: Dose and image quality evaluation in phantoms and in vivo. AJR Am. J. Roentgenol. 2010, 195, 1164–1174. [Google Scholar] [CrossRef] [Green Version]
- Scholtz, J.E.; Kaup, M.; Kraft, J.; Noske, E.M.; Scheerer, F.; Schulz, B.; Burck, I.; Wagenblast, J.; Kerl, J.M.; Bauer, R.W.; et al. Objective and subjective image quality of primary and recurrent squamous cell carcinoma on head and neck low-tube-voltage 80-kVp computed tomography. Neuroradiology 2015, 57, 645–651. [Google Scholar] [CrossRef] [PubMed]


| Score | Sharpness | Artifact | Overall Image Quality |
|---|---|---|---|
| 1 | Blurred contour | Interfering structure | Poor |
| 2 | Average | No interfering structure | Suboptimal |
| 3 | Sharp contour | No artifact | Acceptable |
| 4 | Good | ||
| 5 | Excellent |
| Group A(n = 159) | Group B(n = 207) | p-Value | Group a (n = 51) | Group b(n = 143) | p-Value | |
|---|---|---|---|---|---|---|
| Age (y) | 66.96 | 66.16 | 0.688 | 67.24 | 65.66 | 0.358 |
| Sex (M:F) | 92:67 | 105:102 | 0.175 | 21:30 | 88:55 | 0.204 |
| Weight (kg) | 60.00 | 59.19 | 0.348 | 54.49 | 61.94 | 0.914 |
| Height (cm) | 161.31 | 160.44 | 0.577 | 157.61 | 162.32 | 0.873 |
| Body mass index(kg/m2) | 22.85 | 22.70 | 0.169 | 22.01 | 23.26 | 0.433 |
| Tube voltage (kVp) | 97.67 | 97.53 | 0.959 | 88.04 | 102.45 | <0.001 * |
| CT machine (machine A:B) | 77:82 | 107:100 | 0.537 | 17:34 | 78:65 | 0.917 |
| Iodine amount (g) | 21.57 | 29.42 | <0.001 * | 24.77 | 30.21 | <0.001 * |
| Group A | Group B | p-Value | Group a | Group b | p-Value | Machine A | Machine B | p-Value | |
|---|---|---|---|---|---|---|---|---|---|
| Sharpness | 2.91 | 2.96 | 0.052 | 2.93 | 2.96 | 0.214 | 2.93 | 2.94 | 0.297 |
| Noise | 2.26 | 2.26 | 0.916 | 2.30 | 2.23 | 0.340 | 2.20 | 2.33 | 0.006 * |
| Overall image quality | 3.21 | 3.22 | 0.885 | 3.25 | 3.20 | 0.428 | 3.16 | 3.28 | 0.014 * |
| k * | |
|---|---|
| Sharpness | 0.658 |
| Noise | 0.586 |
| Overall image quality | 0.718 |
| Group A | Group B | p-Value | Group a | Group b | p-Value | ||
|---|---|---|---|---|---|---|---|
| Attenuation | Fat | −93.58 | −94.23 | 0.427 | −96.73 | −93.30 | 0.216 |
| SCM | 73.59 | 76.16 | 0.028 * | 70.10 | 75.47 | 0.324 | |
| IJV | 204.01 | 252.98 | <0.001 * | 217.53 | 236.60 | 0.439 | |
| CCA | 234.14 | 312.49 | <0.001 * | 253.36 | 297.90 | 0.185 | |
| Thyroid | 188.67 | 220.31 | <0.001 * | 194.49 | 214.45 | 0.087 | |
| SNR | SCM | 6.34 | 6.21 | 0.467 | 6.09 | 6.14 | 0.492 |
| IJV | 17.74 | 20.58 | <0.001 * | 19.07 | 19.27 | 0.788 | |
| CCA | 20.29 | 25.73 | <0.001 * | 22.10 | 24.45 | 0.509 | |
| Thyroid | 16.28 | 17.99 | 0.008 * | 16.84 | 17.52 | 0.384 | |
| CNR | SCM | 14.42 | 13.99 | 0.256 | 14.53 | 13.84 | 0.592 |
| IJV | 25.81 | 28.36 | 0.024 * | 27.50 | 26.97 | 0.867 | |
| CCA | 28.37 | 33.51 | <0.001 * | 30.54 | 32.16 | 0.616 | |
| Thyroid | 24.36 | 25.77 | 0.167 | 70.10 | 75.47 | 0.570 |
| Group a | Group b | p-Value | |
|---|---|---|---|
| CTDIvol (mGy) | 5.39 ± 1.58 | 6.14 ± 2.13 | 0.020 * |
| DLP (mGy × cm) | 195.66 ± 56.59 | 244.18 ± 90.67 | <0.001 * |
| Effective dose (mSv) | 2.93 ± 0.85 | 3.67 ± 1.36 | <0.001 * |
| Dose reduction (%) | −19.9 |
Publisher’s Note: MDPI stays neutral with regard to jurisdictional claims in published maps and institutional affiliations. |
© 2022 by the authors. Licensee MDPI, Basel, Switzerland. This article is an open access article distributed under the terms and conditions of the Creative Commons Attribution (CC BY) license (https://creativecommons.org/licenses/by/4.0/).
Share and Cite
Kim, J.; Kim, J.-Y.; Oh, S.-W.; Kim, H.-G. Evaluating the Image Quality of Neck Structures Scanned on Chest CT with Low-Concentration-Iodine Contrast Media. Tomography 2022, 8, 2854-2863. https://doi.org/10.3390/tomography8060239
Kim J, Kim J-Y, Oh S-W, Kim H-G. Evaluating the Image Quality of Neck Structures Scanned on Chest CT with Low-Concentration-Iodine Contrast Media. Tomography. 2022; 8(6):2854-2863. https://doi.org/10.3390/tomography8060239
Chicago/Turabian StyleKim, Jimin, Jee-Young Kim, Se-Won Oh, and Hyun-Gi Kim. 2022. "Evaluating the Image Quality of Neck Structures Scanned on Chest CT with Low-Concentration-Iodine Contrast Media" Tomography 8, no. 6: 2854-2863. https://doi.org/10.3390/tomography8060239