
Pancreatic Steatosis Evaluated by Automated Volumetric CT Fat Fraction of the Pancreas: Association with Severity in COVID-19 Pneumonia
 ,
,  ,
,
Abstract
:1. Introduction
2. Materials and Methods
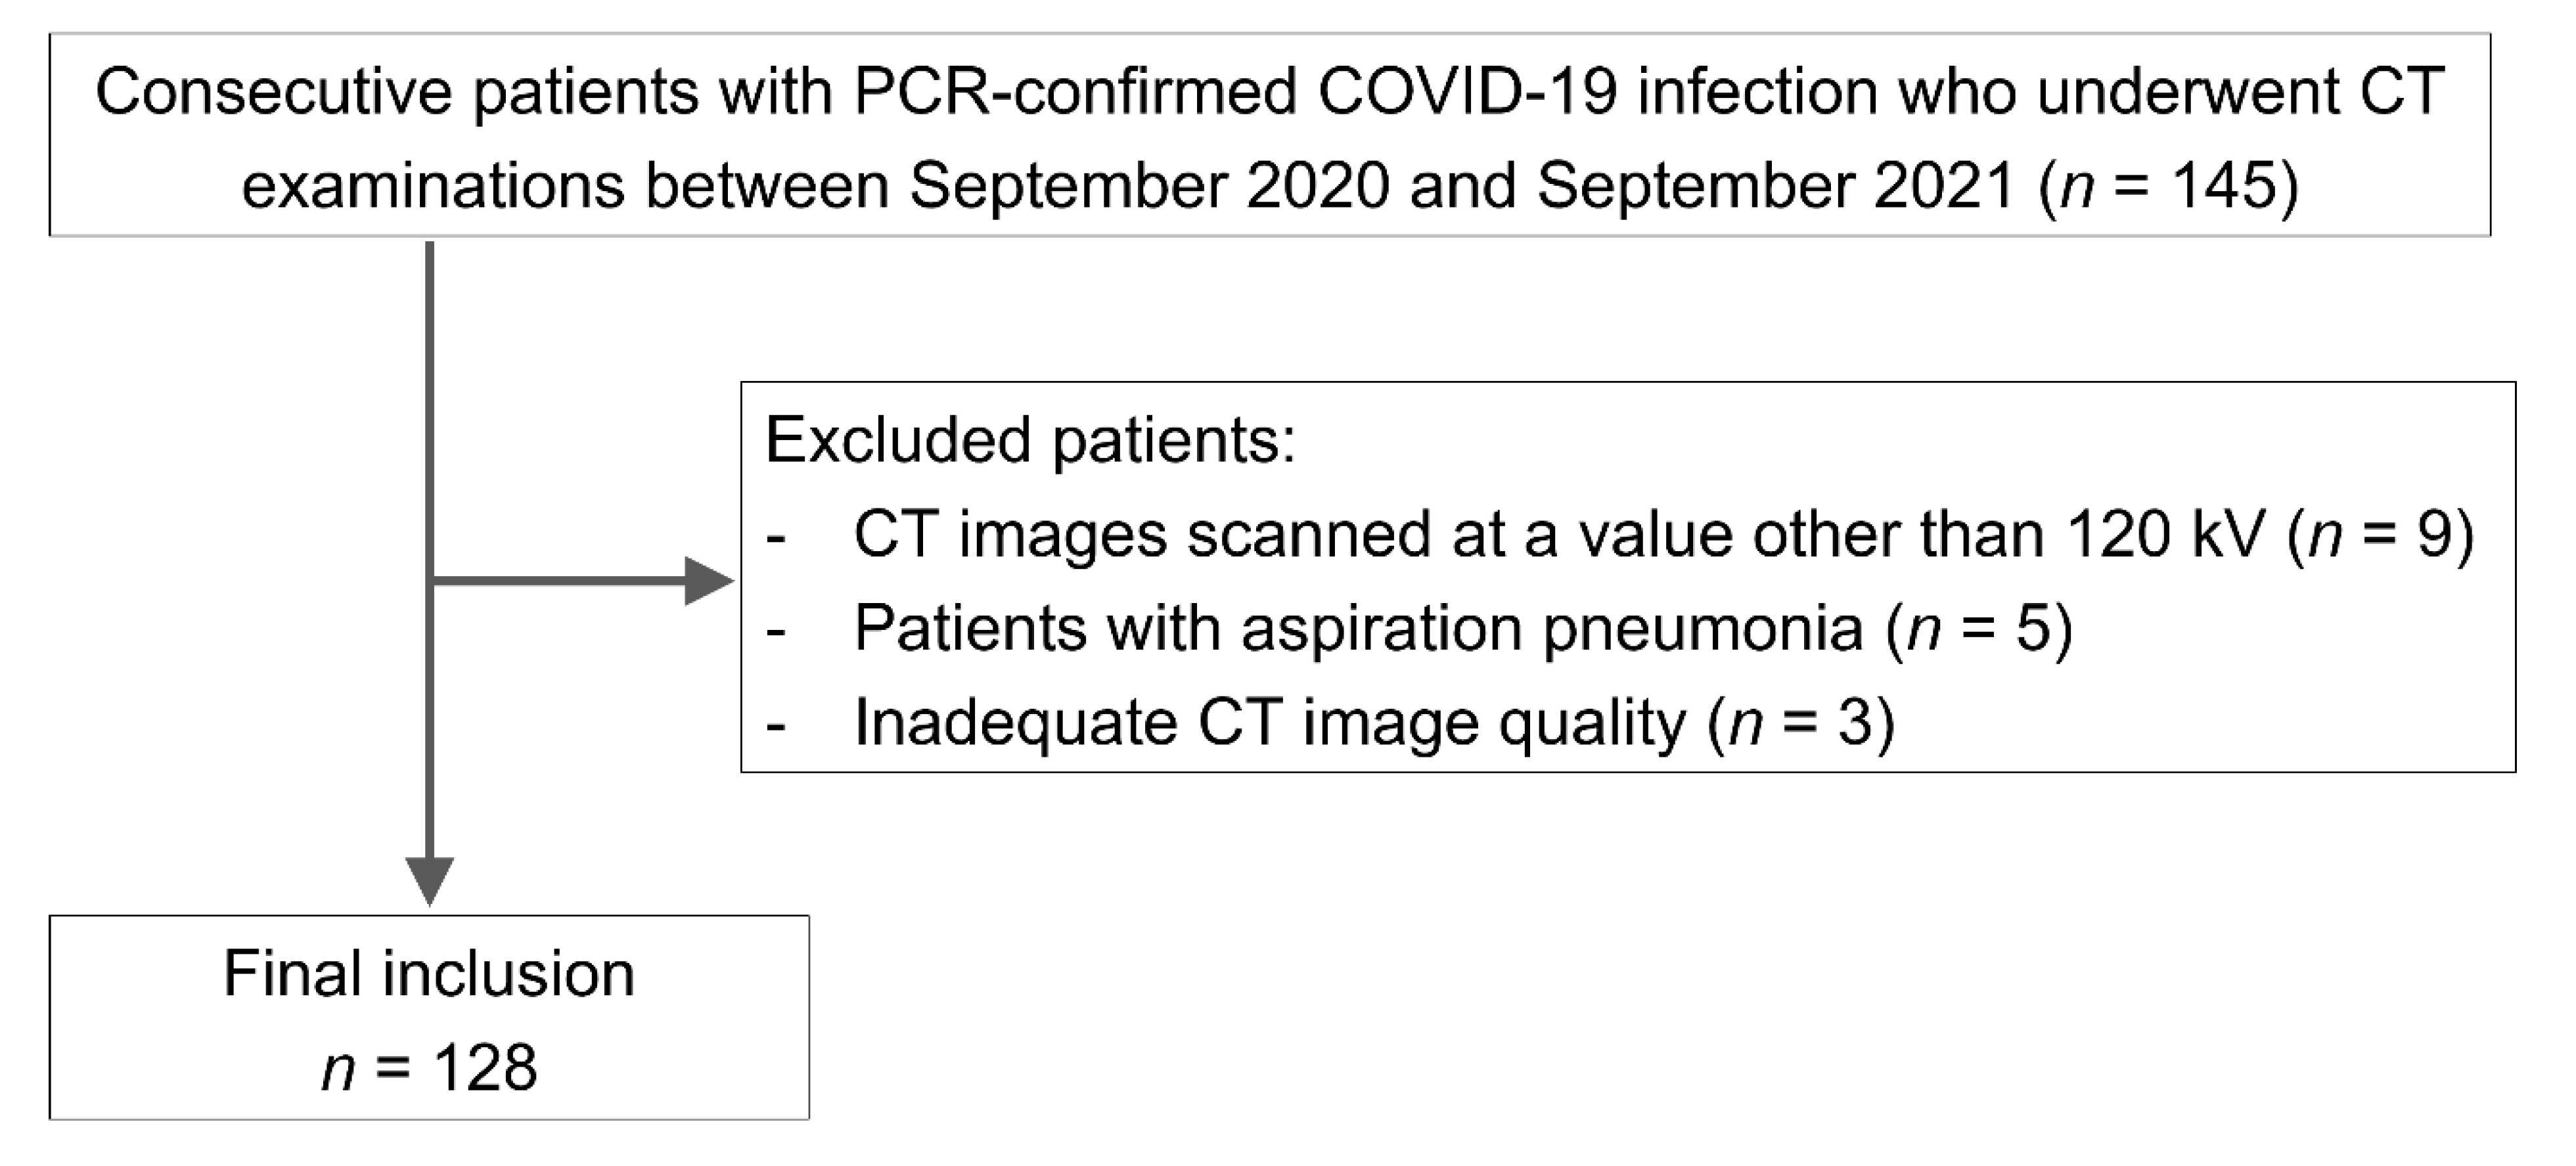
2.1. Study Population
2.2. CT
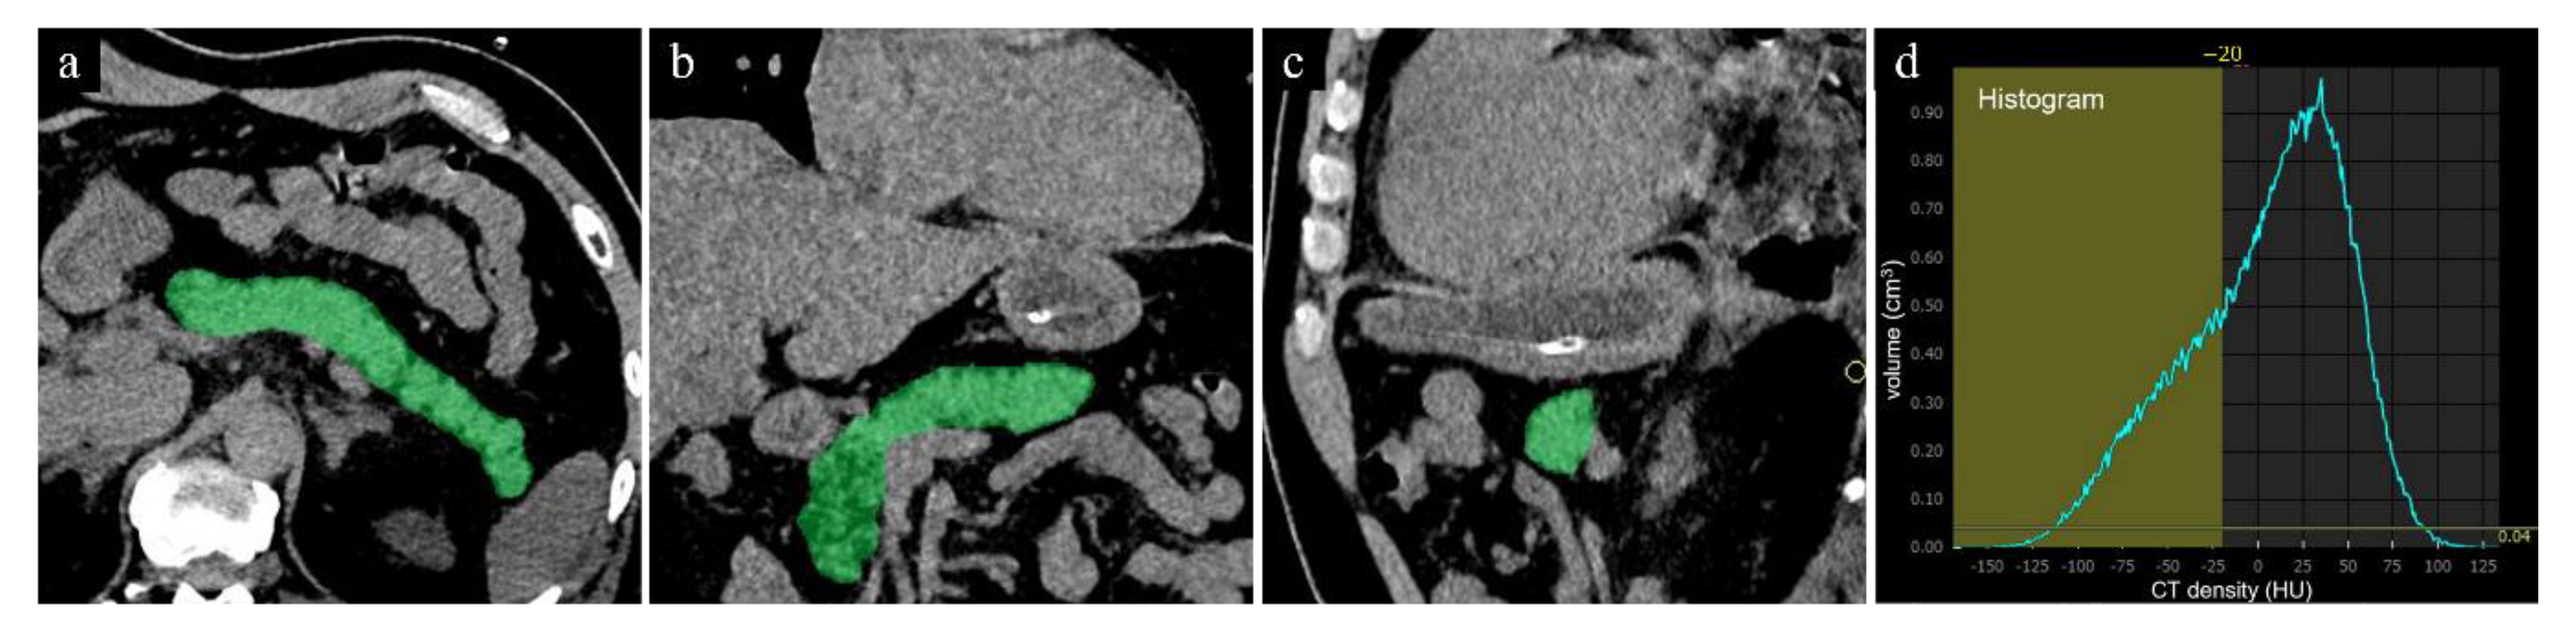
2.3. Image Analyses
2.4. Statistical Analyses
3. Results
4. Discussion
5. Conclusions
Author Contributions
Funding
Institutional Review Board Statement
Informed Consent Statement
Data Availability Statement
Conflicts of Interest
Abbreviations
| ACE2 | angiotensin-converting enzyme 2 |
| AUC | area under the curve |
| COVID-19 | coronavirus disease 2019 |
| DM | diabetes mellitus |
| FVF | fat volume fraction |
| IQR | interquartile range |
| PACS | picture archiving and communication system |
| PCR | polymerase chain reaction |
| ROI | region of interest |
| 3D | three-dimensional |
References
- Chung, M.; Bernheim, A.; Mei, X.; Zhang, N.; Huang, M.; Zeng, X.; Cui, J.; Xu, W.; Yang, Y.; Fayad, Z.A.; et al. CT Imaging Features of 2019 Novel Coronavirus (2019-nCoV). Radiology 2020, 295, 202–207. [Google Scholar] [CrossRef] [PubMed] [Green Version]
- Yang, W.; Sirajuddin, A.; Zhang, X.; Liu, G.; Teng, Z.; Zhao, S.; Lu, M. The role of imaging in 2019 novel coronavirus pneumonia (COVID-19). Eur. Radiol. 2020, 30, 4874–4882. [Google Scholar] [CrossRef] [PubMed] [Green Version]
- Ji, D.; Qin, E.; Xu, J.; Zhang, D.; Cheng, G.; Wang, Y.; Lau, G. Non-alcoholic fatty liver diseases in patients with COVID-19: A retrospective study. J. Hepatol. 2020, 73, 451–453. [Google Scholar] [CrossRef] [PubMed]
- Parlak, S.; Civgin, E.; Besler, M.S.; Kayipmaz, A.E. The effect of hepatic steatosis on COVID-19 severity: Chest computed tomography findings. Saudi J. Gastroenterol. 2021, 27, 105–110. [Google Scholar] [PubMed]
- Pan, Y.; Guan, H.; Zhou, S.; Wang, Y.; Li, Q.; Zhu, T.; Hu, Q.; Xia, L. Initial CT findings and temporal changes in patients with the novel coronavirus pneumonia (2019-nCoV): A study of 63 patients in Wuhan, China. Eur. Radiol. 2020, 30, 3306–3309. [Google Scholar] [CrossRef] [Green Version]
- Ziaee, A.; Azarkar, G.; Ziaee, M. Role of fatty liver in coronavirus disease 2019 patients’ disease severity and hospitalization length: A case-control study. Eur. J. Med. Res. 2021, 26, 115. [Google Scholar] [CrossRef]
- Prins, G.H.; Olinga, P. Potential implications of COVID-19 in non-alcoholic fatty liver disease. Liver Int. Off. J. Int. Assoc. Study Liver 2020, 40, 2568. [Google Scholar] [CrossRef] [Green Version]
- Lee, J.S.; Kim, S.H.; Jun, D.W.; Han, J.H.; Jang, E.C.; Park, J.Y.; Son, B.K.; Kim, S.H.; Jo, Y.J.; Park, Y.S.; et al. Clinical implications of fatty pancreas: Correlations between fatty pancreas and metabolic syndrome. World J. Gastroenterol. 2009, 15, 1869–1875. [Google Scholar] [CrossRef]
- Kazakou, P.; Lambadiari, V.; Ikonomidis, I.; Kountouri, A.; Panagopoulos, G.; Athanasopoulos, S.; Korompoki, E.; Kalomenidis, I.; Dimopoulos, M.A.; Mitrakou, A. Diabetes and COVID-19; A Bidi-rectional Interplay. Front. Endocrinol. 2022, 13, 780663. [Google Scholar] [CrossRef]
- Kim, S.Y.; Kim, H.; Cho, J.Y.; Lim, S.; Cha, K.; Lee, K.H.; Kim, Y.H.; Kim, J.H.; Yoon, Y.S.; Han, H.S.; et al. Quantitative assessment of pancreatic fat by using unenhanced CT: Pathologic correlation and clinical implications. Radiology 2014, 271, 104–112. [Google Scholar] [CrossRef]
- Guneyli, S.; Dogan, H.; Esengur, O.T.; Hassoy, H. Computed tomography evaluation of pancreatic steatosis: Correlation with COVID-19 prognosis. Future Virol. 2022, 17, 231–237. [Google Scholar] [CrossRef] [PubMed]
- Lim, S.; Bae, J.H.; Chun, E.J.; Kim, H.; Kim, S.Y.; Kim, K.M.; Choi, S.H.; Park, K.S.; Florez, J.C.; Jang, H.C. Differences in pancreatic volume, fat content, and fat density measured by multidetector-row computed tomography according to the duration of diabetes. Acta Diabetol. 2014, 51, 739–748. [Google Scholar] [CrossRef] [PubMed]
- Bellos, I.; Tavernaraki, K.; Stefanidis, K.; Michalopoulou, O.; Lourida, G.; Korompoki, E.; Thanou, I.; Thanos, L.; Pefanis, A.; Argyraki, A. Chest CT severity score and radiological patterns as predictors of disease severity, ICU admission, and viral positivity in COVID-19 patients. Respir. Investig. 2021, 59, 436–445. [Google Scholar] [CrossRef] [PubMed]
- Youden, W.J. Index for rating diagnostic tests. Cancer 1950, 3, 32–35. [Google Scholar] [CrossRef] [PubMed]
- Corapli, M.; Cil, E.; Oktay, C.; Kacmaz, H.; Corapli, G.; Bulut, H.T. Role of hepatosteatosis in the prognosis of COVID 19 disease. Clin. Imaging 2021, 80, 1–5. [Google Scholar] [CrossRef] [PubMed]
- Cai, Q.; Chen, F.; Wang, T.; Luo, F.; Liu, X.; Wu, Q.; He, Q.; Wang, Z.; Liu, Y.; Liu, L.; et al. Obesity and COVID-19 Severity in a Designated Hospital in Shenzhen, China. Diabetes Care 2020, 43, 1392–1398. [Google Scholar] [CrossRef] [PubMed]
- Guo, W.; Li, M.; Dong, Y.; Zhou, H.; Zhang, Z.; Tian, C.; Qin, R.; Wang, H.; Shen, Y.; Du, K.; et al. Diabetes is a risk factor for the progression and prognosis of COVID-19. Diabetes/Metab. Res. Rev. 2020, 36, e3319. [Google Scholar] [CrossRef] [PubMed] [Green Version]
- Lavie, C.J.; Sanchis-Gomar, F.; Henry, B.M.; Lippi, G. COVID-19 and obesity: Links and risks. Expert Rev. Endocrinol. Metab. 2020, 15, 215–216. [Google Scholar] [CrossRef] [PubMed]
- Medeiros, A.K.; Barbisan, C.C.; Cruz, I.R.; de Araujo, E.M.; Libanio, B.B.; Albuquerque, K.S.; Torres, U.S. Higher frequency of hepatic steatosis at CT among COVID-19-positive patients. Abdom. Radiol. 2020, 45, 2748–2754. [Google Scholar] [CrossRef] [PubMed]
- Yamazaki, H.; Tsuboya, T.; Katanuma, A.; Kodama, Y.; Tauchi, S.; Dohke, M.; Maguchi, H. Lack of Independent Association Between Fatty Pancreas and Incidence of Type 2 Diabetes: 5-Year Japanese Cohort Study. Diabetes Care 2016, 39, 1677–1683. [Google Scholar] [CrossRef] [PubMed]
- Katz, D.S.; Hines, J.; Math, K.R.; Nardi, P.M.; Mindelzun, R.E.; Lane, M.J. Using CT to reveal fat-containing abnormalities of the pancreas. AJR Am. J. Roentgenol. 1999, 172, 393–396. [Google Scholar] [CrossRef] [PubMed]
- Shah, N.; Rocha, J.P.; Bhutiani, N.; Endashaw, O. Nonalcoholic Fatty Pancreas Disease. Nutr. Clin. Pract. 2019, 34 (Suppl. S1), S49–S56. [Google Scholar] [CrossRef] [PubMed]


| Severe Pneumonia Group (n = 33; Male = 24, Female = 9) | Non-Severe Pneumonia Group (n = 95; Male = 56, Female = 39) | p-Value | |
|---|---|---|---|
| CT-FVF (%) of the pancreas | 21.7 (15.5) | 7.8 (11.8) | <0.01 |
| Male | 21.4 (12.0) | 9.4 (9.1) | <0.01 |
| Female | 24.4 (49.3) | 5.7 (12.3) | <0.01 |
| CT attenuation value (HU) of the liver | 53.4 (14.2) | 59.9 (12.9) | 0.01 |
| Male | 51.1 (19.1) | 54.9 (23.2) | 0.09 |
| Female | 57.6 (7.8) | 61.2 (9.2) | 0.16 |
Publisher’s Note: MDPI stays neutral with regard to jurisdictional claims in published maps and institutional affiliations. |
© 2022 by the authors. Licensee MDPI, Basel, Switzerland. This article is an open access article distributed under the terms and conditions of the Creative Commons Attribution (CC BY) license (https://creativecommons.org/licenses/by/4.0/).
Share and Cite
Tanabe, M.; Kunihiro, Y.; Higashi, M.; Ihara, K.; Tanabe, M.; Yagi, T.; Kobayashi, T.; Ueda, T.; Ito, K. Pancreatic Steatosis Evaluated by Automated Volumetric CT Fat Fraction of the Pancreas: Association with Severity in COVID-19 Pneumonia. Tomography 2022, 8, 2806-2814. https://doi.org/10.3390/tomography8060234
Tanabe M, Kunihiro Y, Higashi M, Ihara K, Tanabe M, Yagi T, Kobayashi T, Ueda T, Ito K. Pancreatic Steatosis Evaluated by Automated Volumetric CT Fat Fraction of the Pancreas: Association with Severity in COVID-19 Pneumonia. Tomography. 2022; 8(6):2806-2814. https://doi.org/10.3390/tomography8060234
Chicago/Turabian StyleTanabe, Masahiro, Yoshie Kunihiro, Mayumi Higashi, Kenichiro Ihara, Masaya Tanabe, Takeshi Yagi, Taiga Kobayashi, Takaaki Ueda, and Katsuyoshi Ito. 2022. "Pancreatic Steatosis Evaluated by Automated Volumetric CT Fat Fraction of the Pancreas: Association with Severity in COVID-19 Pneumonia" Tomography 8, no. 6: 2806-2814. https://doi.org/10.3390/tomography8060234