
Identification of the Benignity and Malignancy of BI-RADS 4 Breast Lesions Based on a Combined Quantitative Model of Dynamic Contrast-Enhanced MRI and Intravoxel Incoherent Motion

Abstract
:1. Introduction
2. Materials and Methods
2.1. Patient Selection
2.2. MRI Image Acquisition
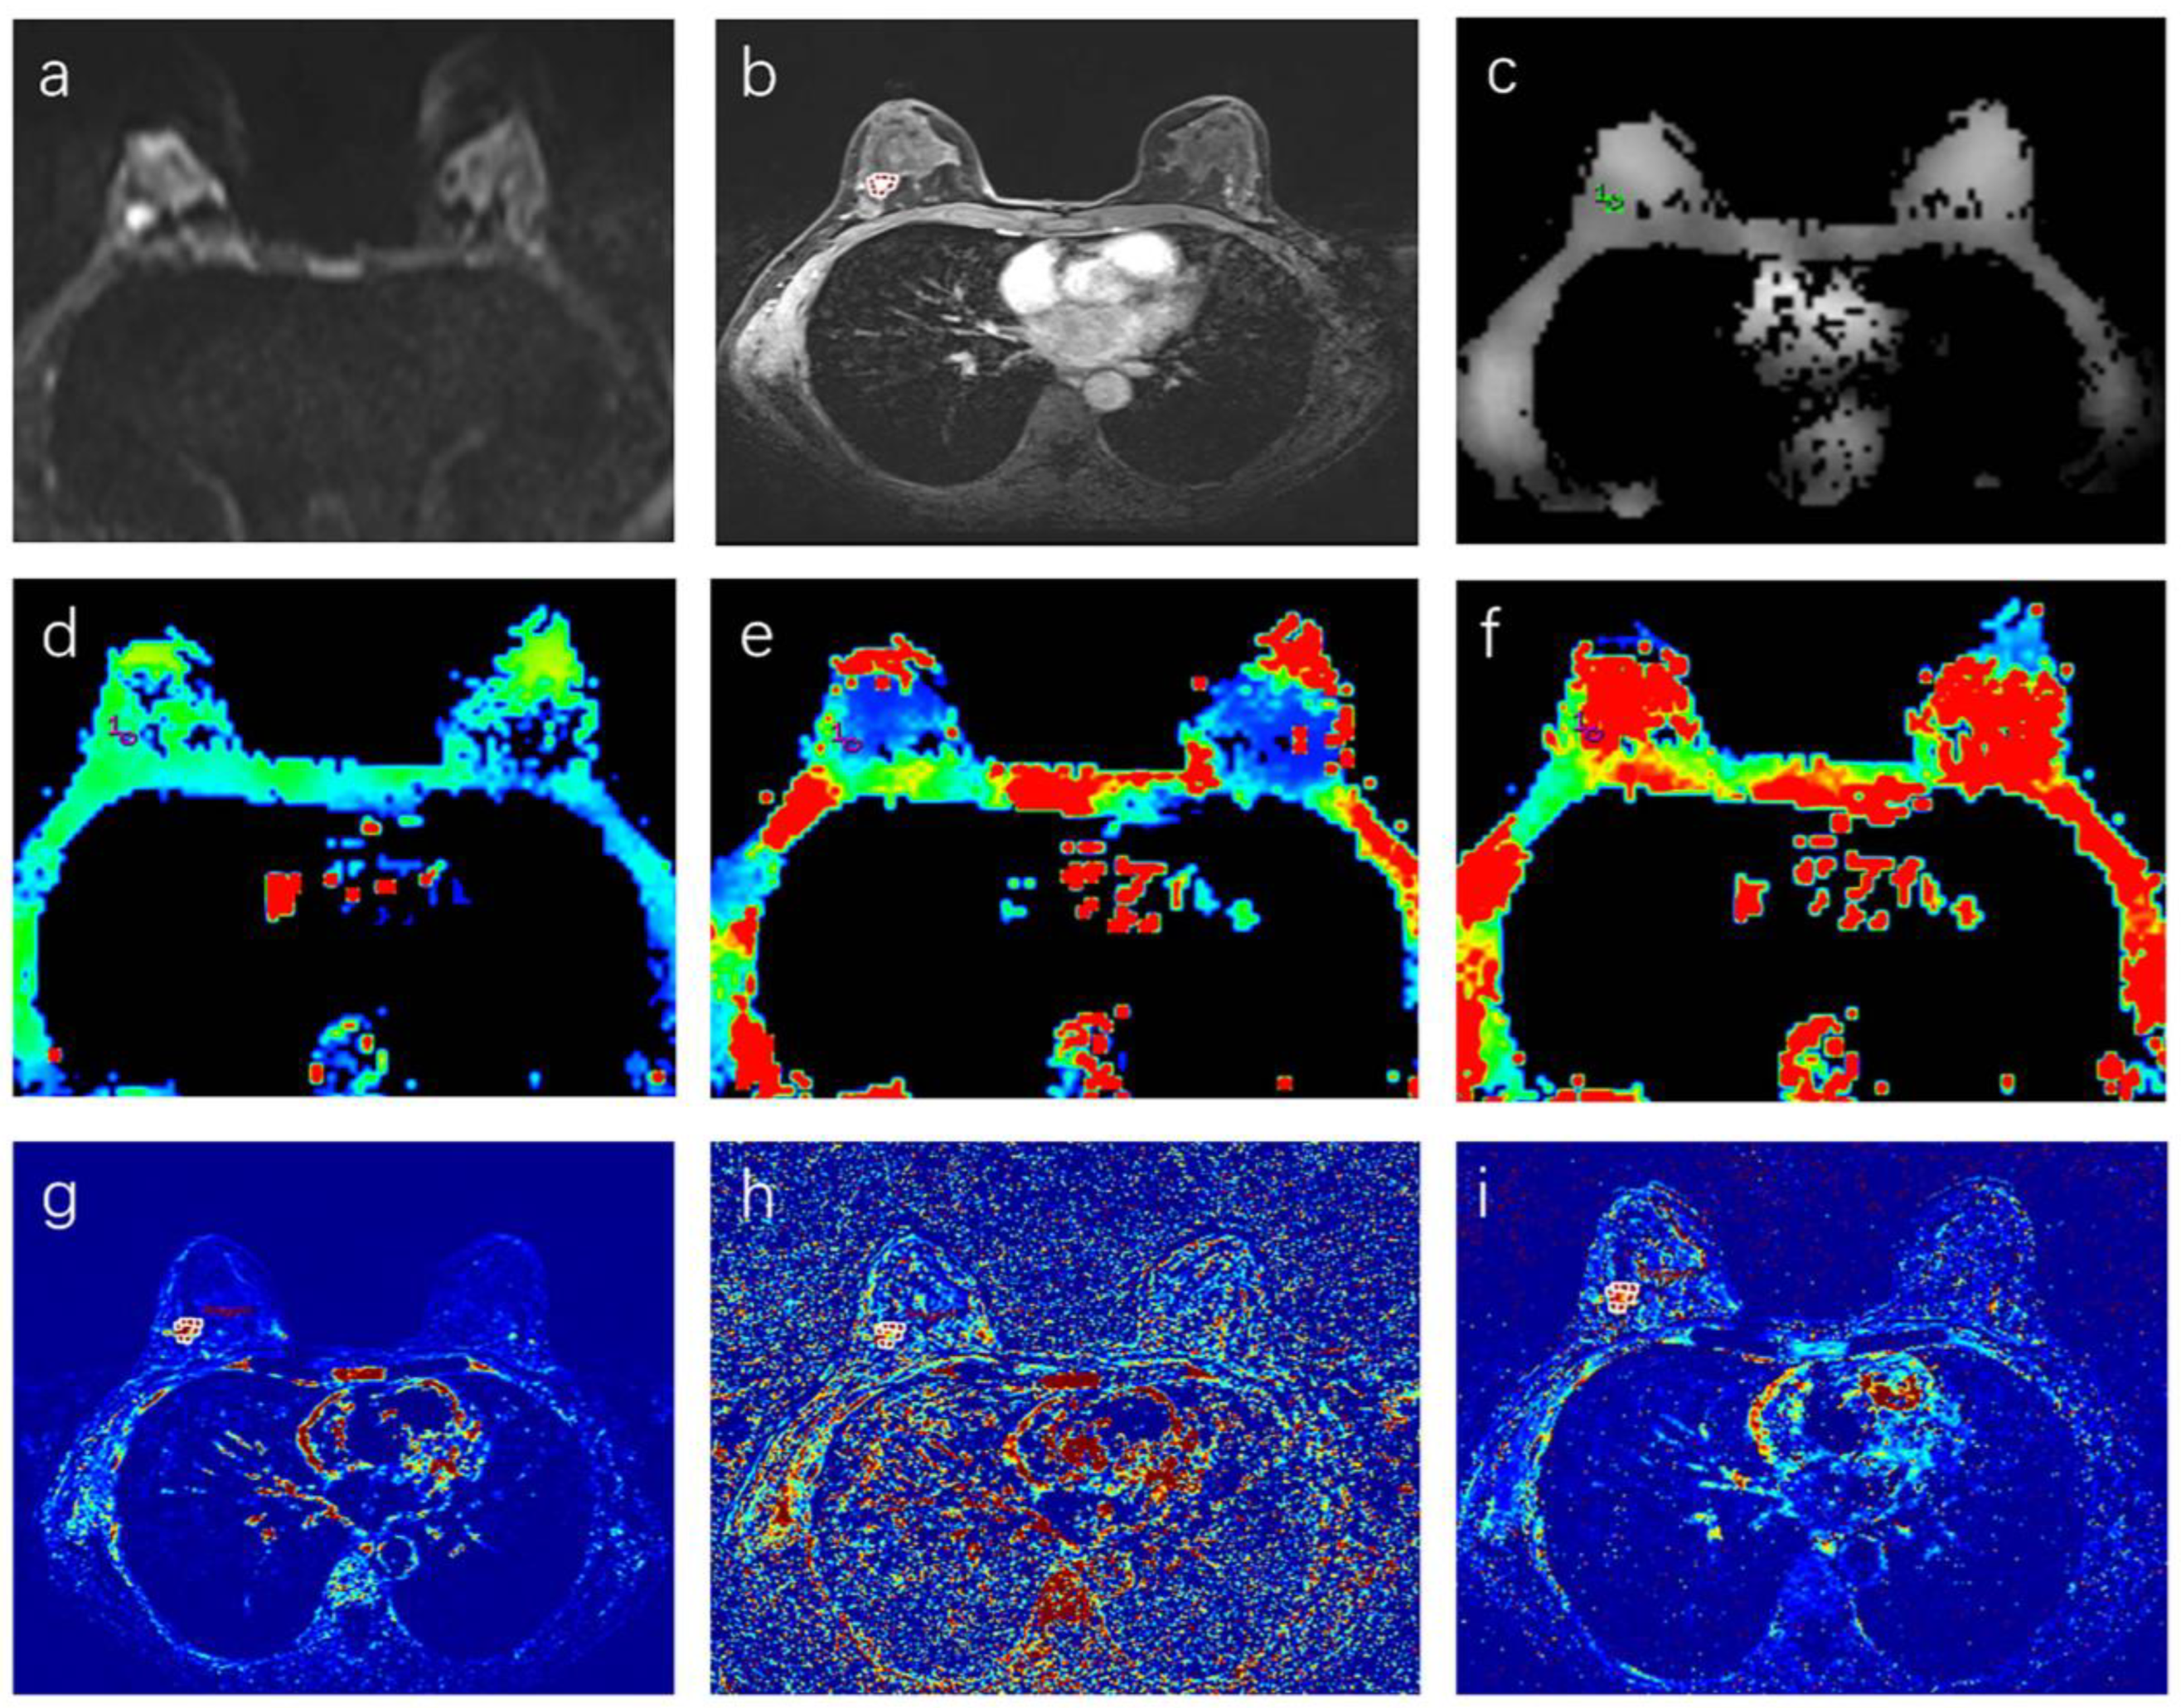
2.3. Image Analysis
2.4. Statistical Analysis
3. Results
3.1. Patient Characteristics
3.2. Consistency Test
3.3. DWI and DCE–MRI Quantitative Parameters in Benign and Malignant Breast Lesions
4. Discussion
5. Conclusions
Author Contributions
Funding
Institutional Review Board Statement
Informed Consent Statement
Conflicts of Interest
References
- Sung, H.; Ferlay, J.; Siegel, R.L.; Laversanne, M.; Soerjomataram, I.; Jemal, A.; Bray, F. Global Cancer Statistics 2020: GLOBOCAN Estimates of Incidence and Mortality Worldwide for 36 Cancers in 185 Countries. CA Cancer. J. Clin. 2021, 71, 209–249. [Google Scholar] [CrossRef] [PubMed]
- American College of Radiology ACR BI-RADS Ultrasound. ACR Breast Imaging Reporting and Data System, Breast Imaging Atlas, 5th ed.; American College of Radiology: Reston, VA, USA, 2013; pp. 123–132. [Google Scholar]
- Bennani-Baiti, B.; Dietzel, M.; Baltzer, P.A. MRI for the Assessment of Malignancy in BI-RADS 4 Mammographic Microcalcifications. PLoS ONE 2017, 12, e0188679. [Google Scholar] [CrossRef] [Green Version]
- Duffy, S.W.; Smith, R.A.; Gabe, R.; Tabár, L.; Yen, A.M.F.; Chen, T.H.H. Screening for Breast Cancer. Surg. Oncol. Clin. N. Am. 2005, 14, 671–697. [Google Scholar] [CrossRef] [PubMed]
- Weinstein, S.P.; Hanna, L.G.; Gatsonis, C.; Schnall, M.D.; Rosen, M.A.; Lehman, C.D. Frequency of Malignancy Seen in Probably Benign Lesions at Contrast-Enhanced Breast MR Imaging: Findings from ACRIN 6667. Radiology 2010, 255, 731–737. [Google Scholar] [CrossRef] [PubMed] [Green Version]
- Eby, P.R.; DeMartini, W.B.; Gutierrez, R.L.; Lehman, C.D. Probably Benign Lesions Detected on Breast MR Imaging. Magn. Reson. Imaging. Clin. N. Am. 2010, 18, 309–321. [Google Scholar] [CrossRef]
- Li, L.; Wang, K.; Sun, X.; Wang, K.; Sun, Y.; Zhang, G.; Shen, B. Parameters of Dynamic Contrast-Enhanced MRI as Imaging Markers for Angiogenesis and Proliferation in Human Breast Cancer. Med. Sci. Monit. 2015, 21, 376–382. [Google Scholar] [CrossRef] [Green Version]
- Rahbar, H.; Partridge, S.C. Multiparametric MR Imaging of Breast Cancer. Magn. Reson. Imaging. Clin. N. Am. 2016, 24, 223–238. [Google Scholar] [CrossRef] [Green Version]
- Mann, R.M.; Hooley, R.; Barr, R.G.; Moy, L. Novel Approaches to Screening for Breast Cancer. Radiology 2020, 297, 266–285. [Google Scholar] [CrossRef]
- Mazaheri, Y.; Afaq, A.; Rowe, D.B.; Lu, Y.; Shukla-Dave, A.; Grover, J. Diffusion-Weighted Magnetic Resonance Imaging of the Prostate: Improved Robustness with Stretched Exponential Modeling. J. Comput. Assist. Tomogr. 2012, 36, 695–703. [Google Scholar] [CrossRef] [Green Version]
- Le Bihan, D.; Breton, E.; Lallemand, D.; Grenier, P.; Cabanis, E.; Laval-Jeantet, M. MR Imaging of Intravoxel Incoherent Motions: Application to Diffusion and Perfusion in Neurologic Disorders. Radiology 1986, 161, 401–407. [Google Scholar] [CrossRef]
- Ei Khouli, R.H.; Jacobs, M.A.; Mezban, S.D.; Huang, P.; Kamel, I.R.; Macura, K.J.; Bluemke, D.A. Diffusion-Weighted Imaging Improves the Diagnostic Accuracy of Conventional 3.0-T Breast MR Imaging. Radiology 2010, 256, 64–73. [Google Scholar] [CrossRef] [PubMed]
- Mao, X.; Zou, X.; Yu, N.; Jiang, X.; Du, J. Quantitative Evaluation of Intravoxel Incoherent Motion Diffusion-Weighted Imaging (IVIM) for Differential Diagnosis and Grading Prediction of Benign and Malignant Breast Lesions. Medicine 2018, 97, e11109. [Google Scholar] [CrossRef] [PubMed]
- Xiao, Z.; Tang, Z.; Qiang, J.; Wang, S.; Qian, W.; Zhong, Y.; Wang, R.; Wang, J.; Wu, L.; Tang, W.; et al. Intravoxel Incoherent Motion MR Imaging in the Differentiation of Benign and Malignant Sinonasal Lesions: Comparison with Conventional Diffusion-Weighted MR Imaging. AJNR Am. J. Neuroradiol. 2018, 39, 538–546. [Google Scholar] [CrossRef] [PubMed]
- Ma, W.; Mao, J.; Wang, T.; Huang, Y.; Zhao, Z.H. Distinguishing between Benign and Malignant Breast Lesions Using Diffusion Weighted Imaging and Intravoxel Incoherent Motion: A Systematic Review and Meta-Analysis. Eur. J. Radiol. 2021, 141, 109809. [Google Scholar] [CrossRef] [PubMed]
- Sharma, U.; Sah, R.G.; Agarwal, K.; Parshad, R.; Seenu, V.; Mathur, S.R.; Hari, S.; Jagannathan, N.R. Potential of Diffusion-Weighted Imaging in the Characterization of Malignant, Benign, and Healthy Breast Tissues and Molecular Subtypes of Breast Cancer. Front. Oncol. 2016, 6, 126. [Google Scholar] [CrossRef] [PubMed] [Green Version]
- Liu, C.; Liang, C.; Liu, Z.; Zhang, S.; Huang, B. Intravoxel Incoherent Motion (IVIM) in Evaluation of Breast Lesions: Comparison with Conventional DWI. Eur. J. Radiol. 2013, 82, e782–e789. [Google Scholar] [CrossRef]
- Tan, P.H.; Ellis, I.; Allison, K.; Brogi, E.; Fox, S.B.; Lakhani, S.; Lazar, A.J.; Morris, E.A.; Sahin, A.; Salgado, R.; et al. The 2019 World Health Organization Classification of Tumours of the Breast. Histopathology 2020, 77, 181–185. [Google Scholar] [CrossRef] [Green Version]
- Le Bihan, D.; Turner, R.; MacFall, J.R. Effects of Intravoxel Incoherent Motions (IVIM) in Steady-State Free Precession (SSFP) Imaging: Application to Molecular Diffusion Imaging. Magn. Reson. Med. 1989, 10, 324–337. [Google Scholar] [CrossRef]
- Bakker, M.F.; de Lange, S.V.; Pijnappel, R.M.; Mann, R.M.; Peeters, P.H.M.; Monninkhof, E.M.; Emaus, M.J.; Loo, C.E.; Bisschops, R.H.C.; Lobbes, M.B.I.; et al. Supplemental MRI Screening for Women with Extremely Dense Breast Tissue. N. Engl. J. Med. 2019, 381, 2091–2102. [Google Scholar] [CrossRef]
- Liu, Z.; Wang, S.; Dong, D.; Wei, J.; Fang, C.; Zhou, X.; Sun, K.; Li, L.; Li, B.; Wang, M.; et al. The Applications of Radiomics in Precision Diagnosis and Treatment of Oncology: Opportunities and Challenges. Theranostics 2019, 9, 1303–1322. [Google Scholar] [CrossRef]
- Thibault, G.; Fertil, B.; Navarro, C.; Pereira, S.; Cau, P.; Levy, N.; Sequeira, J.; Mari, J.-L. Shape and Texture Indexes Application to Cell Nuclei Classification. Int. J. Pattern Recogn. Artif. Intell. 2013, 27, 1357002. [Google Scholar] [CrossRef]
- Thibault, G.; Angulo, J.; Meyer, F. Advanced Statistical Matrices for Texture Characterization: Application to Cell Classification. IEEE. Trans. Biomed. Eng. 2014, 61, 630–637. [Google Scholar] [CrossRef] [PubMed]
- Hall-Beyer, M. GLCM Texture: A Tutorial v. 3.0 March 2017; University of Calgary Press: Calgary, AB, Canada, 2017. [Google Scholar] [CrossRef]
- Jiang, Y.; Edwards, A.V.; Newstead, G.M. Artificial Intelligence Applied to Breast MRI for Improved Diagnosis. Radiology 2021, 298, 38–46. [Google Scholar] [CrossRef]
- Partridge, S.C.; Nissan, N.; Rahbar, H.; Kitsch, A.E.; Sigmund, E.E. Diffusion-Weighted Breast MRI: Clinical Applications and Emerging Techniques. J. Magn. Reson. Imaging 2017, 45, 337–355. [Google Scholar] [CrossRef] [PubMed] [Green Version]
- Sun, S.Y.; Ding, Y.; Li, Z.; Nie, L.; Liao, C.; Liu, Y.; Zhang, J.; Zhang, D. Multiparameter MRI Model With DCE-MRI, DWI, and Synthetic MRI Improves the Diagnostic Performance of BI-RADS 4 Lesions. Front. Oncol. 2021, 11, 699127. [Google Scholar] [CrossRef] [PubMed]
- Zhang, L.; Tang, M.; Min, Z.; Lu, J.; Lei, X.; Zhang, X. Accuracy of Combined Dynamic Contrast-Enhanced Magnetic Resonance Imaging and Diffusion-Weighted Imaging for Breast Cancer Detection: A Meta-Analysis. Acta. Radiol. 2016, 57, 651–660. [Google Scholar] [CrossRef] [PubMed]
- Ma, Y.; Shan, D.; Wei, J.; Chen, A. Application of Intravoxel Incoherent Motion Diffusion-Weighted Imaging in Differential Diagnosis and Molecular Subtype Analysis of Breast Cancer. Am. J. Transl. Res. 2021, 13, 3034–3043. [Google Scholar]
- Meng, N.; Wang, X.-J.; Sun, J.; Huang, L.; Wang, Z.; Wang, K.-Y.; Wang, J.; Han, D.-M.; Wang, M.-Y. Comparative Study of Amide Proton Transfer-Weighted Imaging and Intravoxel Incoherent Motion Imaging in Breast Cancer Diagnosis and Evaluation. J. Magn. Reson. Imaging 2020, 52, 1175–1186. [Google Scholar] [CrossRef]
- Liang, J.; Zeng, S.; Li, Z.; Kong, Y.; Meng, T.; Zhou, C.; Chen, J.; Wu, Y.; He, N. Intravoxel Incoherent Motion Diffusion-Weighted Imaging for Quantitative Differentiation of Breast Tumors: A Meta-Analysis. Front. Oncol. 2020, 10, 585486. [Google Scholar] [CrossRef]
- Wang, Q.; Wang, D.; Zhang, J.; Huang, M.; Guo, Y.; Wang, Z. Influence of age and menstrual statuses on breast intravoxel incoherent motion imaging. Chin. J. Clin. 2015, 17, 3238–3243. [Google Scholar] [CrossRef]
- Kim, S.H.; Lee, H.S.; Kang, B.J.; Song, B.J.; Kim, H.-B.; Lee, H.; Jin, M.-S.; Lee, A. Dynamic Contrast-Enhanced MRI Perfusion Parameters as Imaging Biomarkers of Angiogenesis. PLoS ONE 2016, 11, e0168632. [Google Scholar] [CrossRef] [PubMed] [Green Version]
- El Khouli, R.H.; Macura, K.J.; Kamel, I.R.; Jacobs, M.A.; Bluemke, D.A. 3-T Dynamic Contrast-Enhanced MRI of the Breast: Pharmacokinetic Parameters versus Conventional Kinetic Curve Analysis. Am. J. Roentgenol. 2011, 197, 1498–1505. [Google Scholar] [CrossRef] [Green Version]
- Yao, W.W.; Zhang, H.; Ding, B.; Fu, T.; Jia, H.; Pang, L.; Song, L.; Xu, W.; Song, Q.; Chen, K.; et al. Rectal Cancer: 3D Dynamic Contrast-Enhanced MRI.; Correlation with Microvascular Density and Clinicopathological Features. Radiol. Med. 2011, 116, 366–374. [Google Scholar] [CrossRef] [PubMed]
- Li, S.P.; Padhani, A.R.; Taylor, N.J.; Beresford, M.J.; Ah-See, M.-L.W.; Stirling, J.J.; d’Arcy, J.A.; Collins, D.J.; Makris, A. Vascular Characterisation of Triple Negative Breast Carcinomas Using Dynamic MRI. Eur. Radiol. 2011, 21, 1364–1373. [Google Scholar] [CrossRef] [PubMed]
- Iima, M.; Kataoka, M.; Kanao, S.; Onishi, N.; Kawai, M.; Ohashi, A.; Sakaguchi, R.; Toi, M.; Togashi, K. Intravoxel Incoherent Motion and Quantitative Non-Gaussian Diffusion MR Imaging: Evaluation of the Diagnostic and Prognostic Value of Several Markers of Malignant and Benign Breast Lesions. Radiology 2018, 287, 432–441. [Google Scholar] [CrossRef] [PubMed] [Green Version]
- Baxter, G.C.; Graves, M.J.; Gilbert, F.J.; Patterson, A.J. A Meta-Analysis of the Diagnostic Performance of Diffusion MRI for Breast Lesion Characterization. Radiology 2019, 291, 632–641. [Google Scholar] [CrossRef] [Green Version]
- Li, K.; Machireddy, A.; Tudorica, A.; Moloney, B.; Oh, K.Y.; Jafarian, N.; Partridge, S.C.; Li, X.; Huang, W. Discrimination of Malignant and Benign Breast Lesions Using Quantitative Multiparametric MRI: A Preliminary Study. Tomography 2020, 6, 148–159. [Google Scholar] [CrossRef]


| Parameter | Number of Patients |
|---|---|
| Benign leasions | 20 |
| Mean age (years) | 40.8 (26–61) |
| Histological restult | |
| Fibroadenoma | 9 |
| Granulomatous mastitis | 3 |
| Adenomatosis | 3 |
| Phyllodes tumor (benign) | 3 |
| Fibrocystic change | 2 |
| Malignant leasions | 80 |
| Mean age (years) | 49.0 (29–73) |
| Histological restult | |
| Ductal carcinoma in situ | 8 |
| Invasive ductal carcinoma | 62 |
| Invasive lobular carcinoma | 5 |
| Mucinous carcinoma | 3 |
| Paget’s disease | 1 |
| Metaplastic carcinoma | 1 |
| Parameter | ICC | Parameter | ICC | Parameter | ICC |
|---|---|---|---|---|---|
| Ktrans_min | 0.875 | Ve_min | 0.844 | D*_min | 0.419 |
| Ktrans_max | 0.865 | Ve_max | 0.876 | D*_max | 0.867 |
| Ktrans_median | 0.951 | Ve_median | 0.991 | f_mean | 0.913 |
| Ktrans_mean | 0.960 | Ve_mean | 0.981 | f_min | 0.865 |
| Kep_min | 0.701 | D_mean | 0.913 | f_max | 0.821 |
| Kep_max | 0.946 | D_min | 0.911 | ADC_mean | 0.999 |
| Kep_median | 0.906 | D_max | 0.916 | ADC_min | 0.997 |
| Kep_mean | 0.919 | D*_mean | 0.954 | ADC_max | 0.997 |
| Parameter | Benign Lesions (n = 20) | Malignant Lesions (n = 80) | p Value |
|---|---|---|---|
| D_mean (×10−3 mm2/s) | 1.41 ± 0.27 | 1.07 ± 0.26 | <0.001 # |
| D_min (×10−3 mm2/s) | 1.21 (1.02,1.60) | 0.93 (0.74,1.11) | <0.001 |
| D_max (×10−3 mm2/s) | 1.51 ± 0.25 | 1.18 ± 0.26 | <0.001 # |
| D*_mean (×10−3 mm2/s) | 27.05 (10.98,78.65) | 15.20 (8.37,28.05) | 0.032 |
| D*_min (×10−3 mm2/s) | 9.88 (5.70,31.33) | 7.97 (4.87,13.38) | 0.289 |
| D*_max (×10−3 mm2/s) | 44.65 (21.05,29.38) | 22.50 (13.20,46.30) | 0.025 |
| f_mean (%) | 11.00 (5.17,15.48) | 13.70 (11.20,19.70) | 0.035 |
| f_min (%) | 7.44 (2.89,11.20) | 10.25 (7.94,12.55) | 0.009 |
| f_max (%) | 16.90 (9.59,24.48) | 17.60 (14.53,29.15) | 0.252 |
| ADC_mean (×10−3 mm2/s) | 1.52 ± 0.25 | 1.28 ± 0.25 | 0.001 # |
| ADC_min (×10−3 mm2/s) | 1.46 ± 0.26 | 1.22 ± 0.25 | 0.001 # |
| ADC_max (×10−3 mm2/s) | 1.58 ± 0.25 | 1.35 ± 0.25 | 0.001 # |
| Ktrans_min (min−1) | 0.06 (0.03,0.09) | 0.06 (0.03,0.18) | 0.558 |
| Ktrans_max (min−1) | 0.42 (0.15,1.71) | 1.02 (0.46,2.38) | 0.011 |
| Ktrans_median (min−1) | 0.19 (0.09,0.60) | 0.35 (0.15,0.75) | 0.095 |
| Ktrans_mean (min−1) | 0.20 (0.09,0.66) | 0.39 (0.16,0.83) | 0.064 |
| Kep_min (min−1) | 0.01 (0.00,0.06) | 0.000 (0.00,0.12) | 0.571 |
| Kep_max (min−1) | 0.75 (0.46,0.97) | 1.80 (1.15,3.07) | <0.001 |
| Kep_median (min−1) | 0.28 (0.19,0.49) | 0.52 (0.37,0.75) | 0.001 |
| Kep_mean (min−1) | 0.31 (0.19,0.50) | 0.61 (0.39,0.82) | <0.001 |
| Ve_min | 0.11 (0.00,0.32) | 0.00 (0.00,0.28) | 0.222 |
| Ve_max | 1.00 (1.00,1.00) | 1.00 (1.00,1.00) | 0.964 |
| Ve_median | 0.75 (0.38,1.00) | 0.68 (0.33,0.98) | 0.632 |
| Ve_mean | 0.73 (0.41,0.93) | 0.68 (0.38,0.87) | 0.477 |
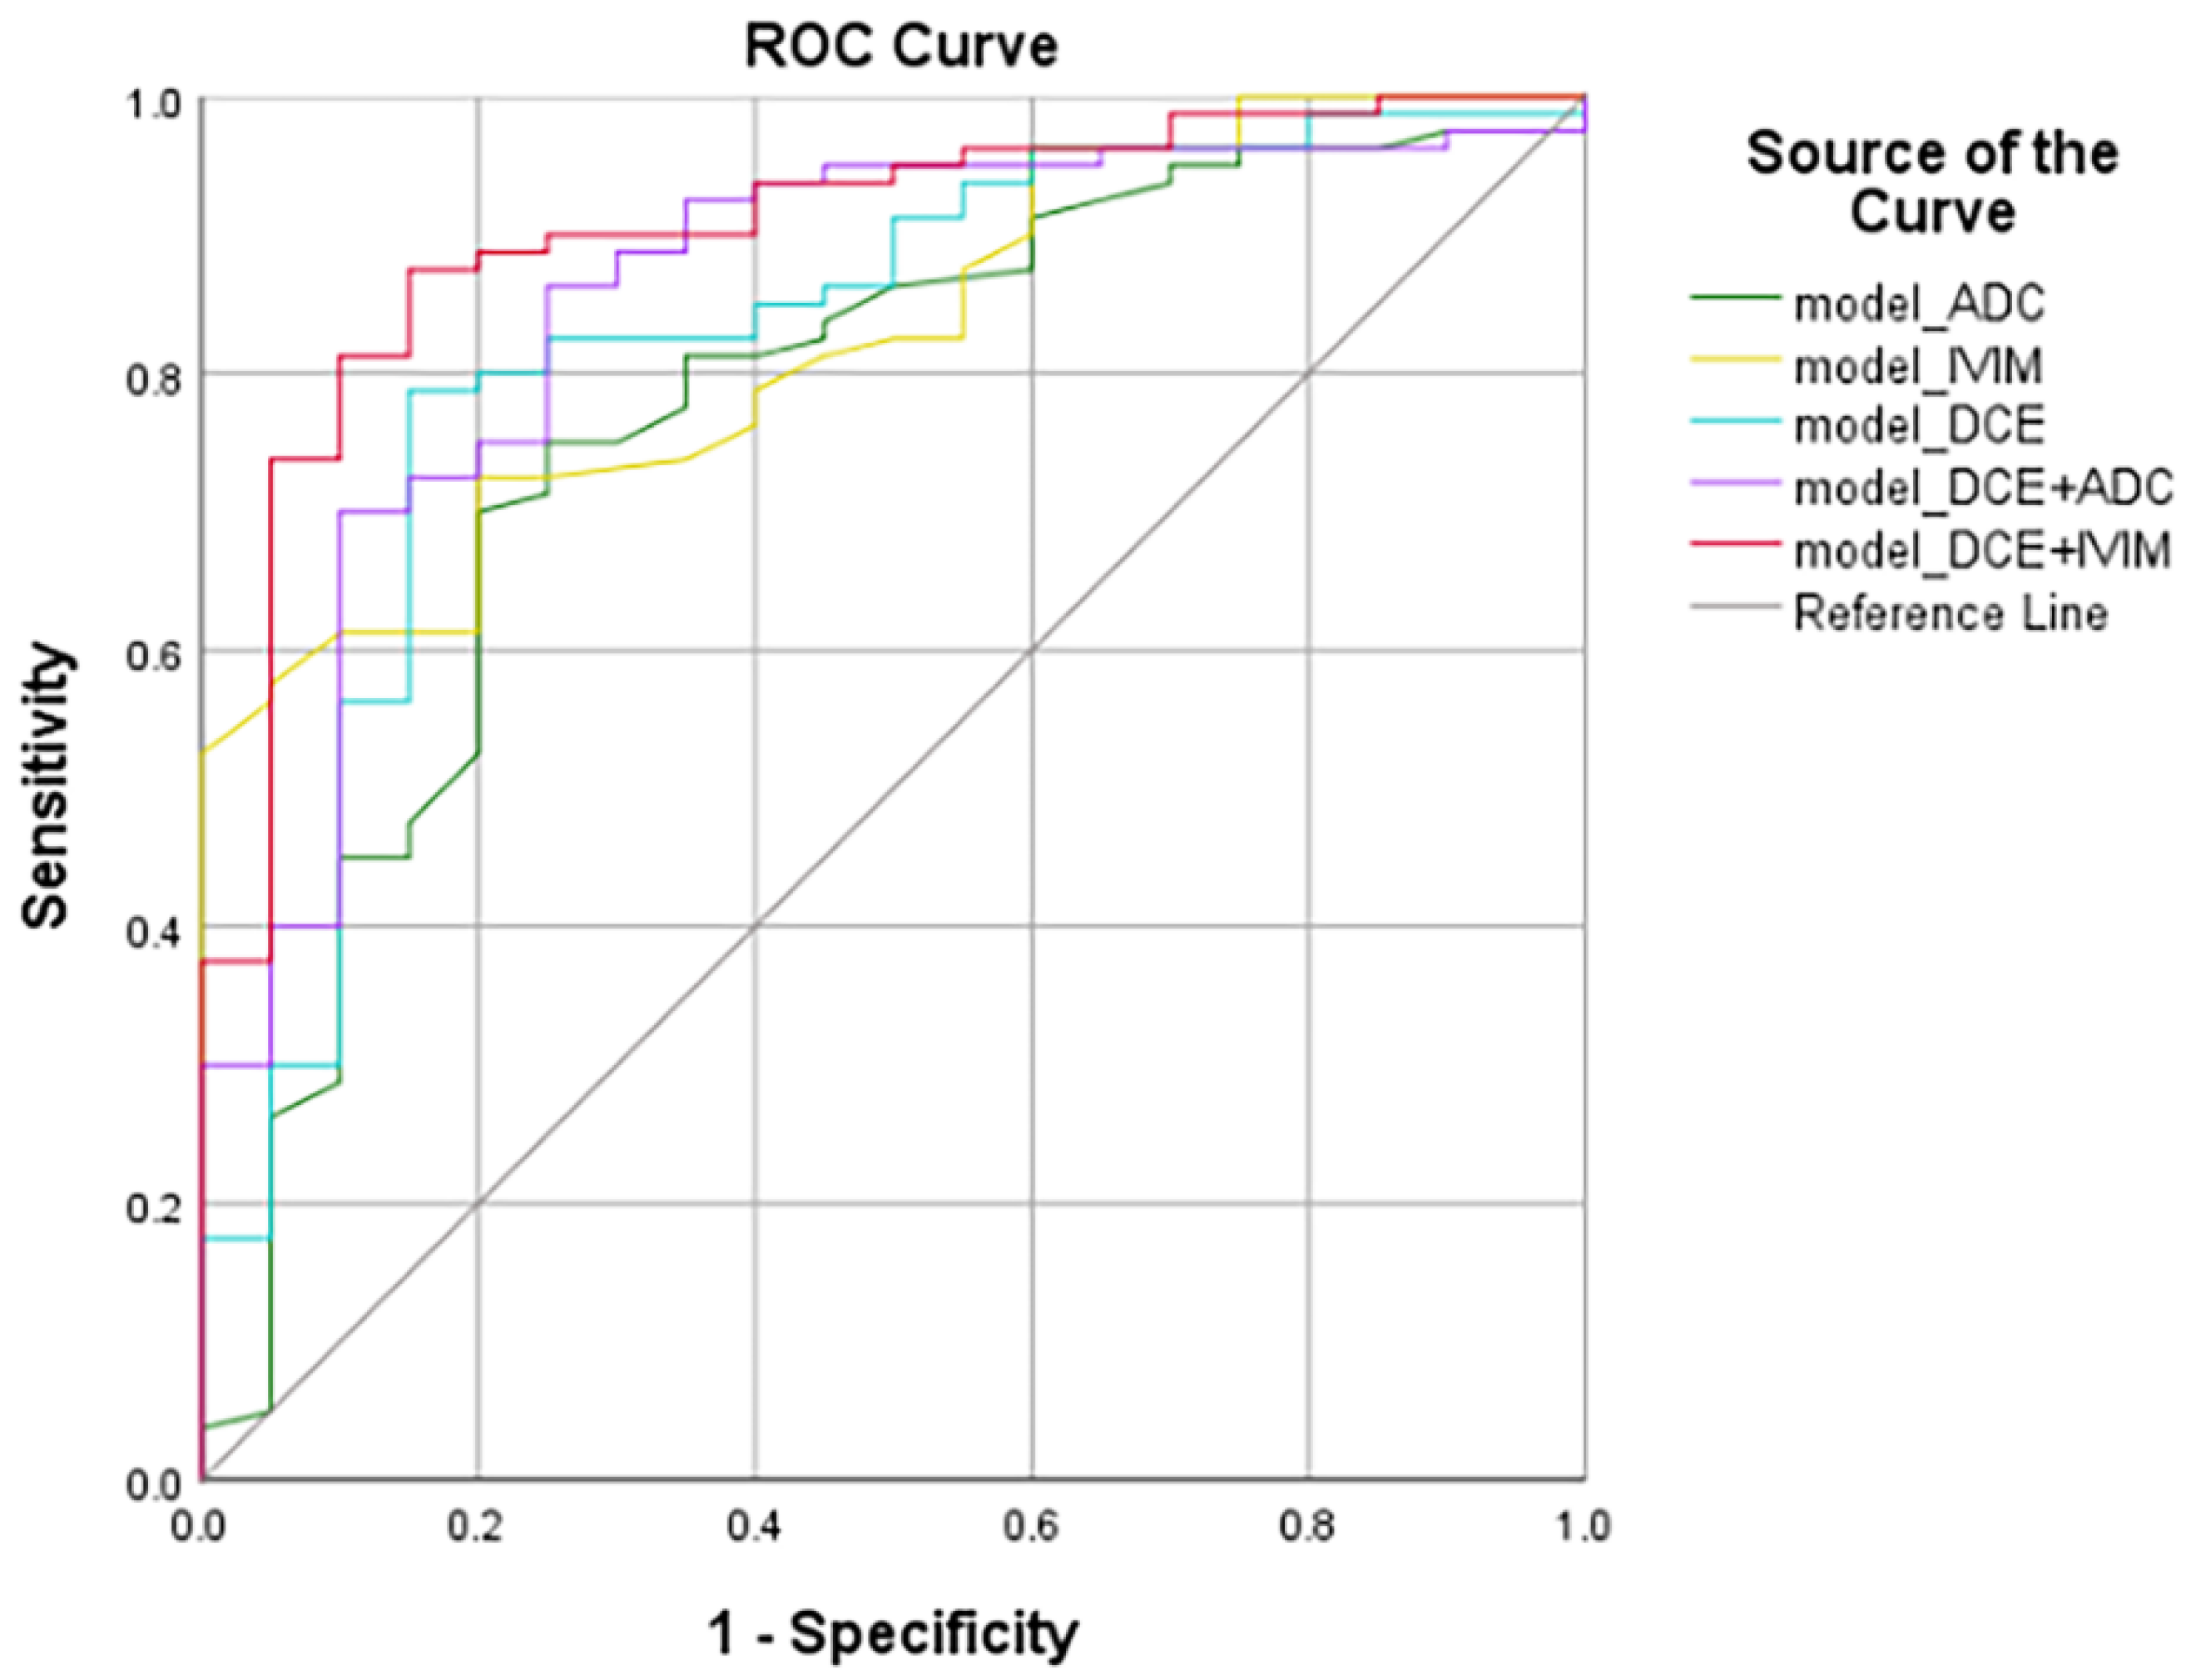
| Model | Variables | AUC | Standard Error | 95% Confidence Interval | Accuracy (%) | Sensitivity (%) | Specificity (%) | |
|---|---|---|---|---|---|---|---|---|
| Lower Bound | Upper Bound | |||||||
| model_ADC | ADC_min | 0.768 | 0.063 | 0.672 | 0.846 | 0.789 | 75.00 | 75.00 |
| model_IVIM | D_mean | 0.826 | 0.044 | 0.737 | 0.894 | 0.820 | 72.50 | 80.00 |
| model_DCE | Kep_max | 0.823 | 0.056 | 0.734 | 0.892 | 0.793 | 78.75 | 85.00 |
| model_DCE+ADC | Kep_max, ADC_min | 0.852 | 0.049 | 0.768 | 0.915 | 0.789 | 86.25 | 75.00 |
| model_DCE+IVIM | Kep_max, D_mean | 0.903 | 0.037 | 0.828 | 0.953 | 0.789 | 87.50 | 85.00 |
| Model | Standard Error | p Value |
|---|---|---|
| model_DCE+IVIM vs. model_IVIM | 0.036 | 0.033 |
| model_DCE+IVIM vs. model_ADC | 0.055 | 0.014 |
Publisher’s Note: MDPI stays neutral with regard to jurisdictional claims in published maps and institutional affiliations. |
© 2022 by the authors. Licensee MDPI, Basel, Switzerland. This article is an open access article distributed under the terms and conditions of the Creative Commons Attribution (CC BY) license (https://creativecommons.org/licenses/by/4.0/).
Share and Cite
Xu, W.; Zheng, B.; Li, H. Identification of the Benignity and Malignancy of BI-RADS 4 Breast Lesions Based on a Combined Quantitative Model of Dynamic Contrast-Enhanced MRI and Intravoxel Incoherent Motion. Tomography 2022, 8, 2676-2686. https://doi.org/10.3390/tomography8060223
Xu W, Zheng B, Li H. Identification of the Benignity and Malignancy of BI-RADS 4 Breast Lesions Based on a Combined Quantitative Model of Dynamic Contrast-Enhanced MRI and Intravoxel Incoherent Motion. Tomography. 2022; 8(6):2676-2686. https://doi.org/10.3390/tomography8060223
Chicago/Turabian StyleXu, Wenjuan, Bingjie Zheng, and Hailiang Li. 2022. "Identification of the Benignity and Malignancy of BI-RADS 4 Breast Lesions Based on a Combined Quantitative Model of Dynamic Contrast-Enhanced MRI and Intravoxel Incoherent Motion" Tomography 8, no. 6: 2676-2686. https://doi.org/10.3390/tomography8060223