
Supine versus Prone 3D Abus Accuracy in Breast Tumor Size Evaluation

 , , , , , and
Abstract
:1. Introduction
2. Materials and Methods
2.1. Imaging Protocols
2.1.1. Hand-Held Ultrasound (HHUS)
2.1.2. Supine and Prone 3D ABUS
2.1.3. Contrast-Enhanced Magnetic Resonance Imaging (CE-MRI)
2.2. Image Analysis
- Group A (size less than 10 mm);
- Group B (size between 10 mm and 20 mm);
- Group C (size more than 20 mm).
2.3. Statistical Analysis
3. Results
3.1. Imaging Analysis
3.1.1. Assessment of Tumor Size with HHUS, 3D ABUS and Histology
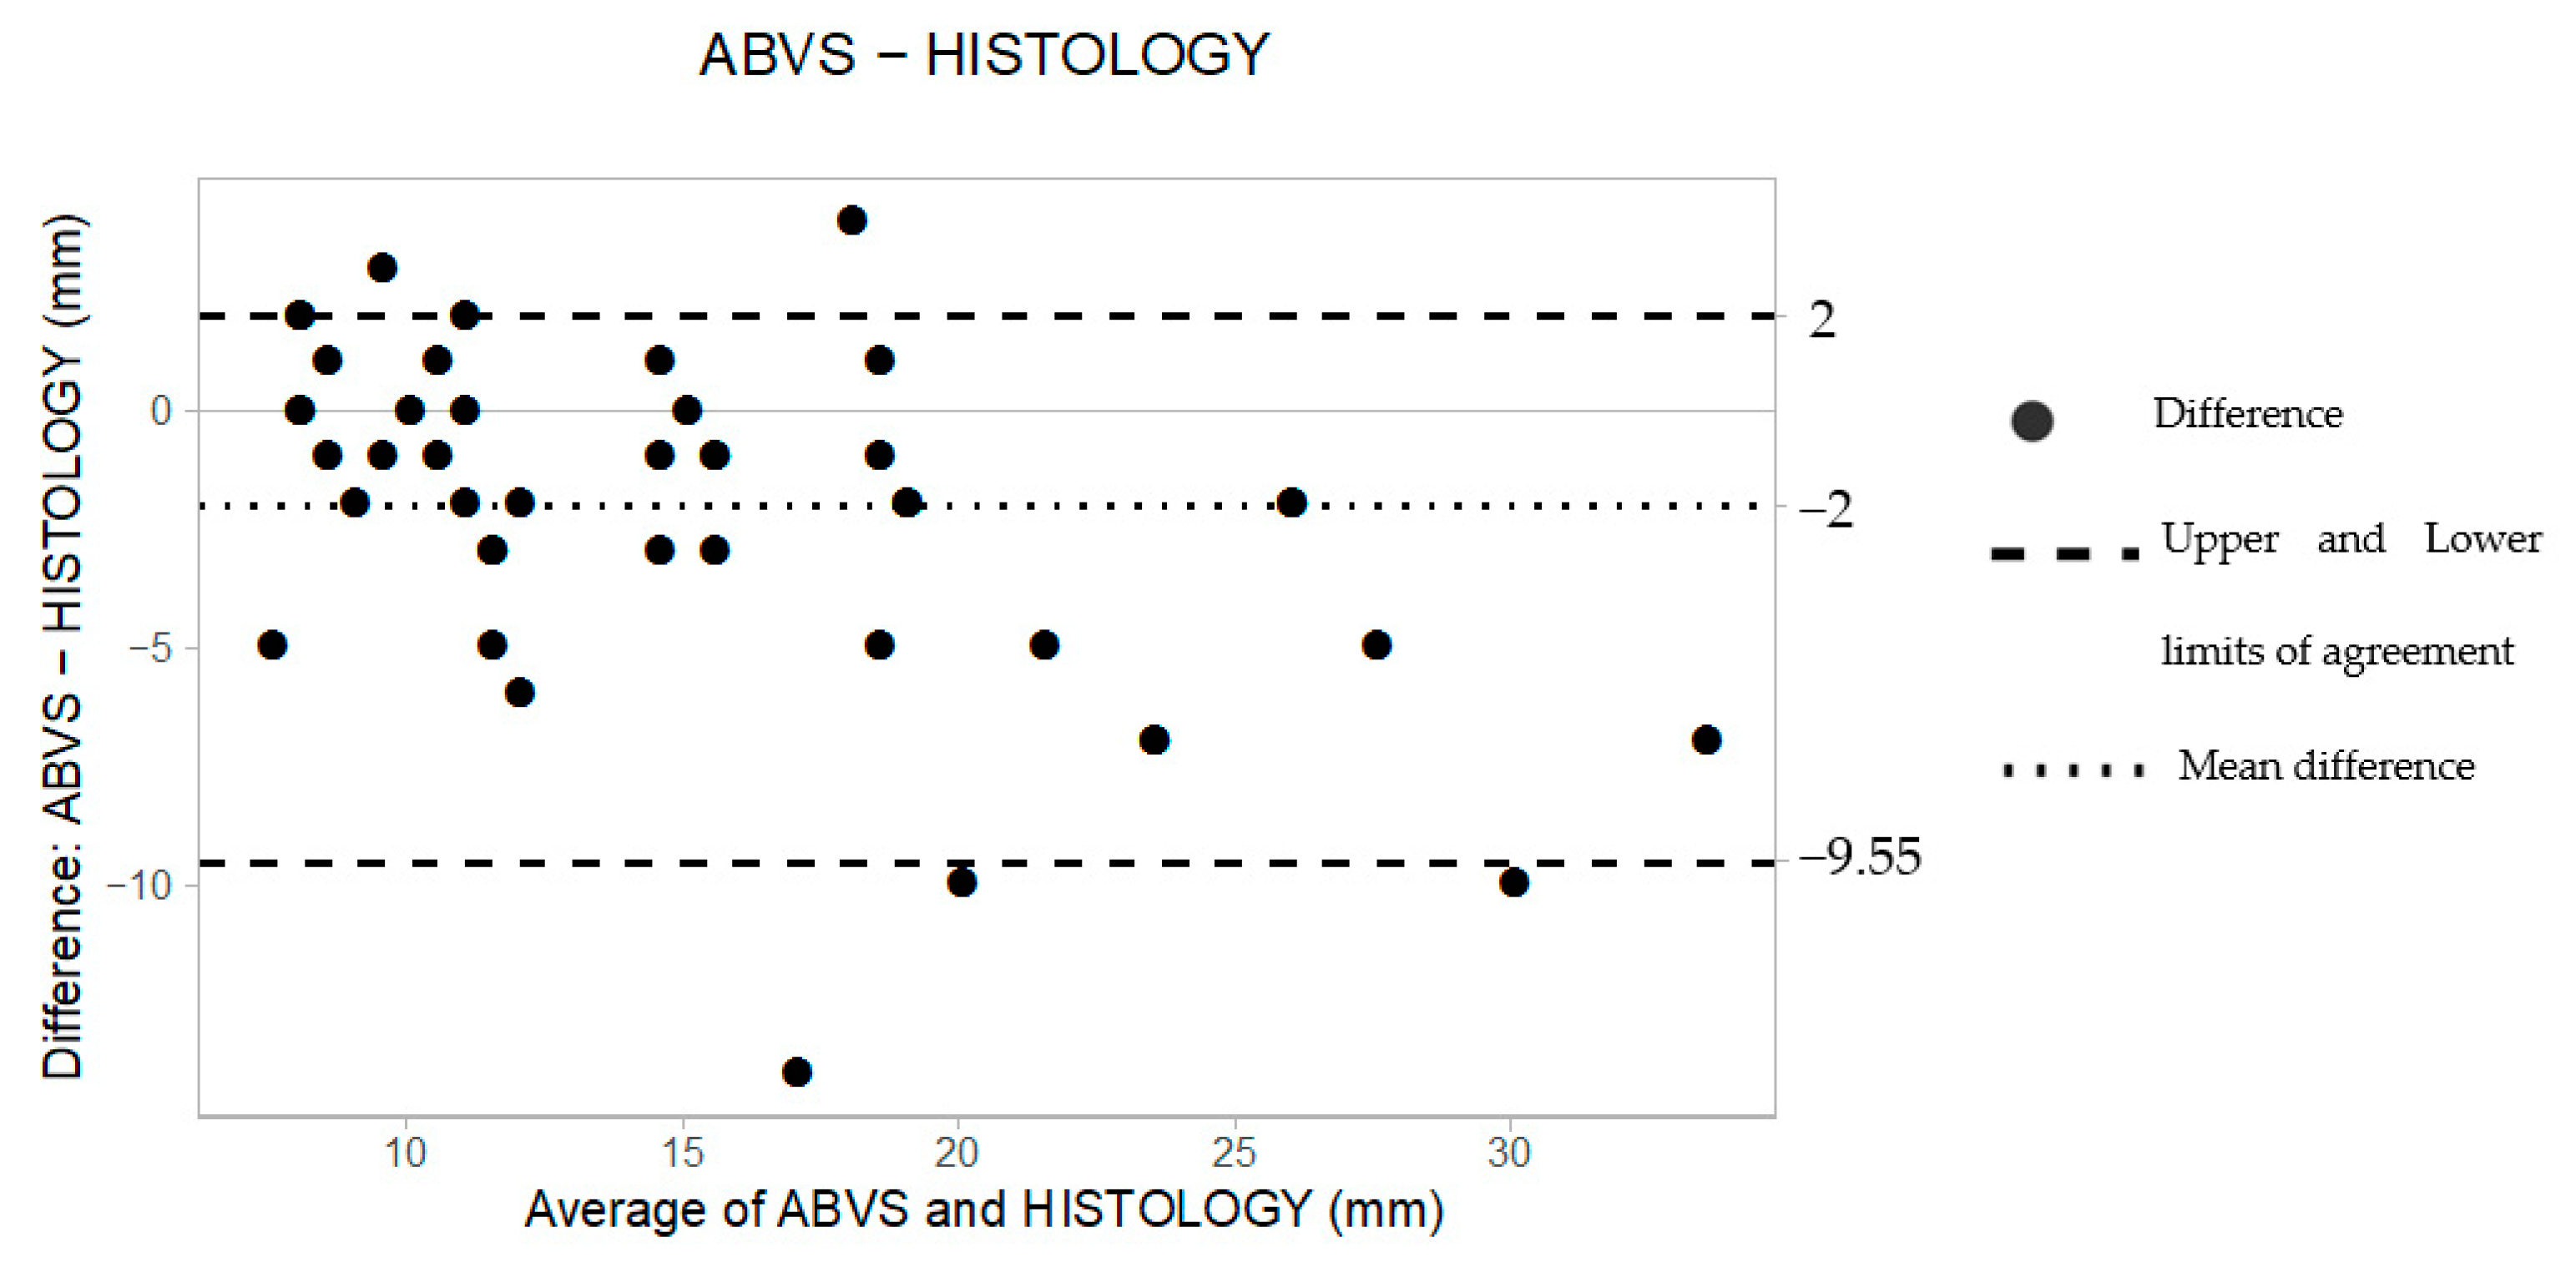
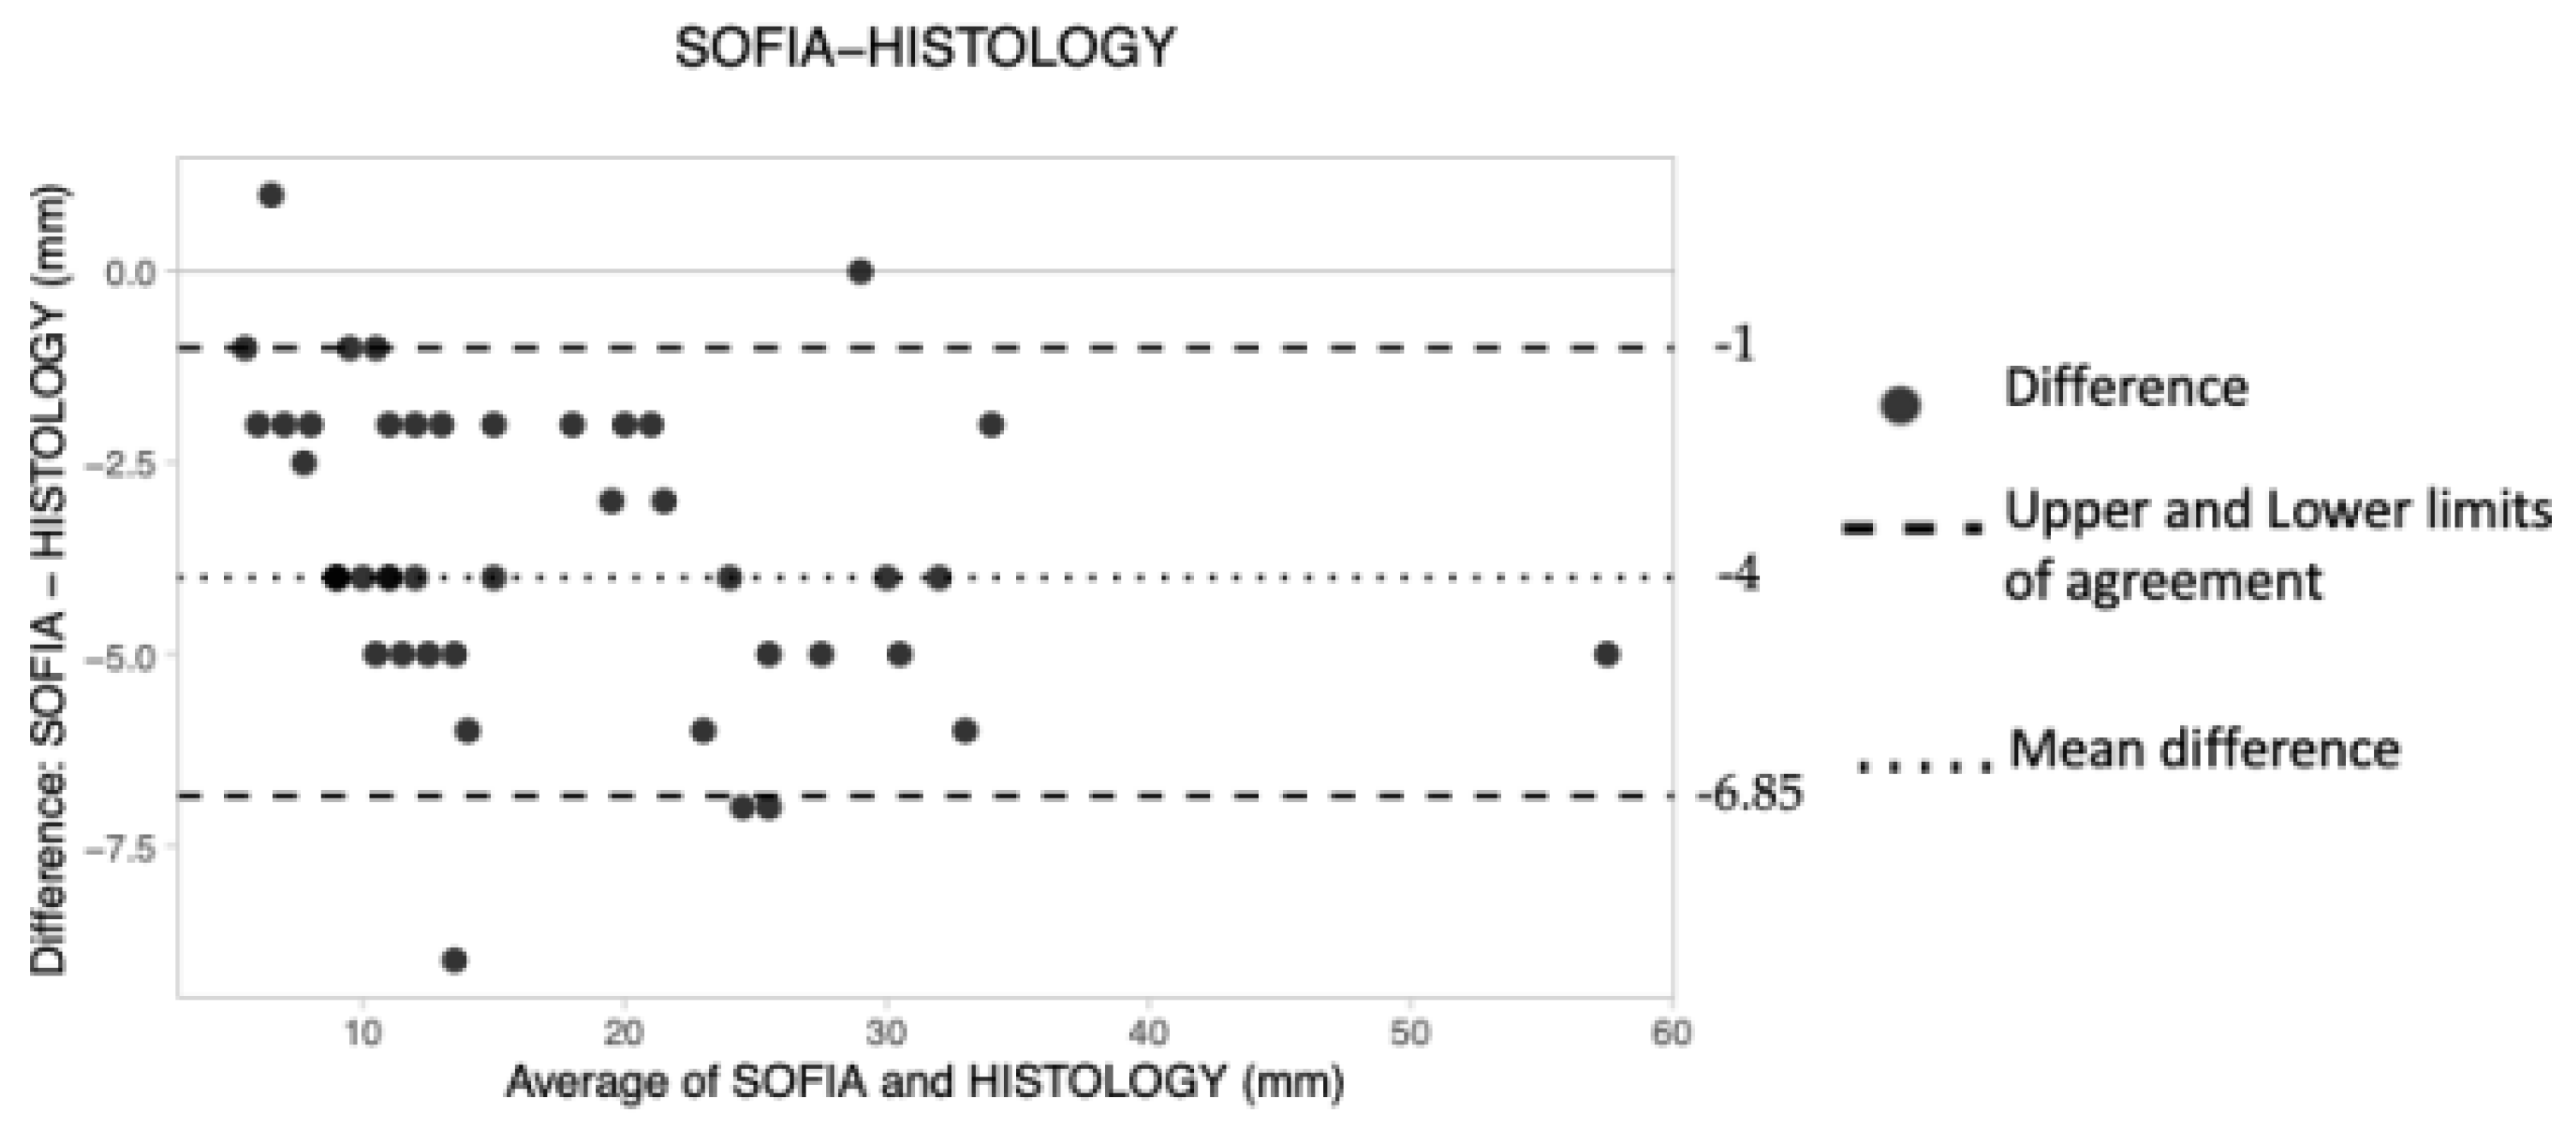
3.1.2. Analysis of Agreement between Each Modality and Histology
Supine 3D ABUS
Prone 3D ABUS
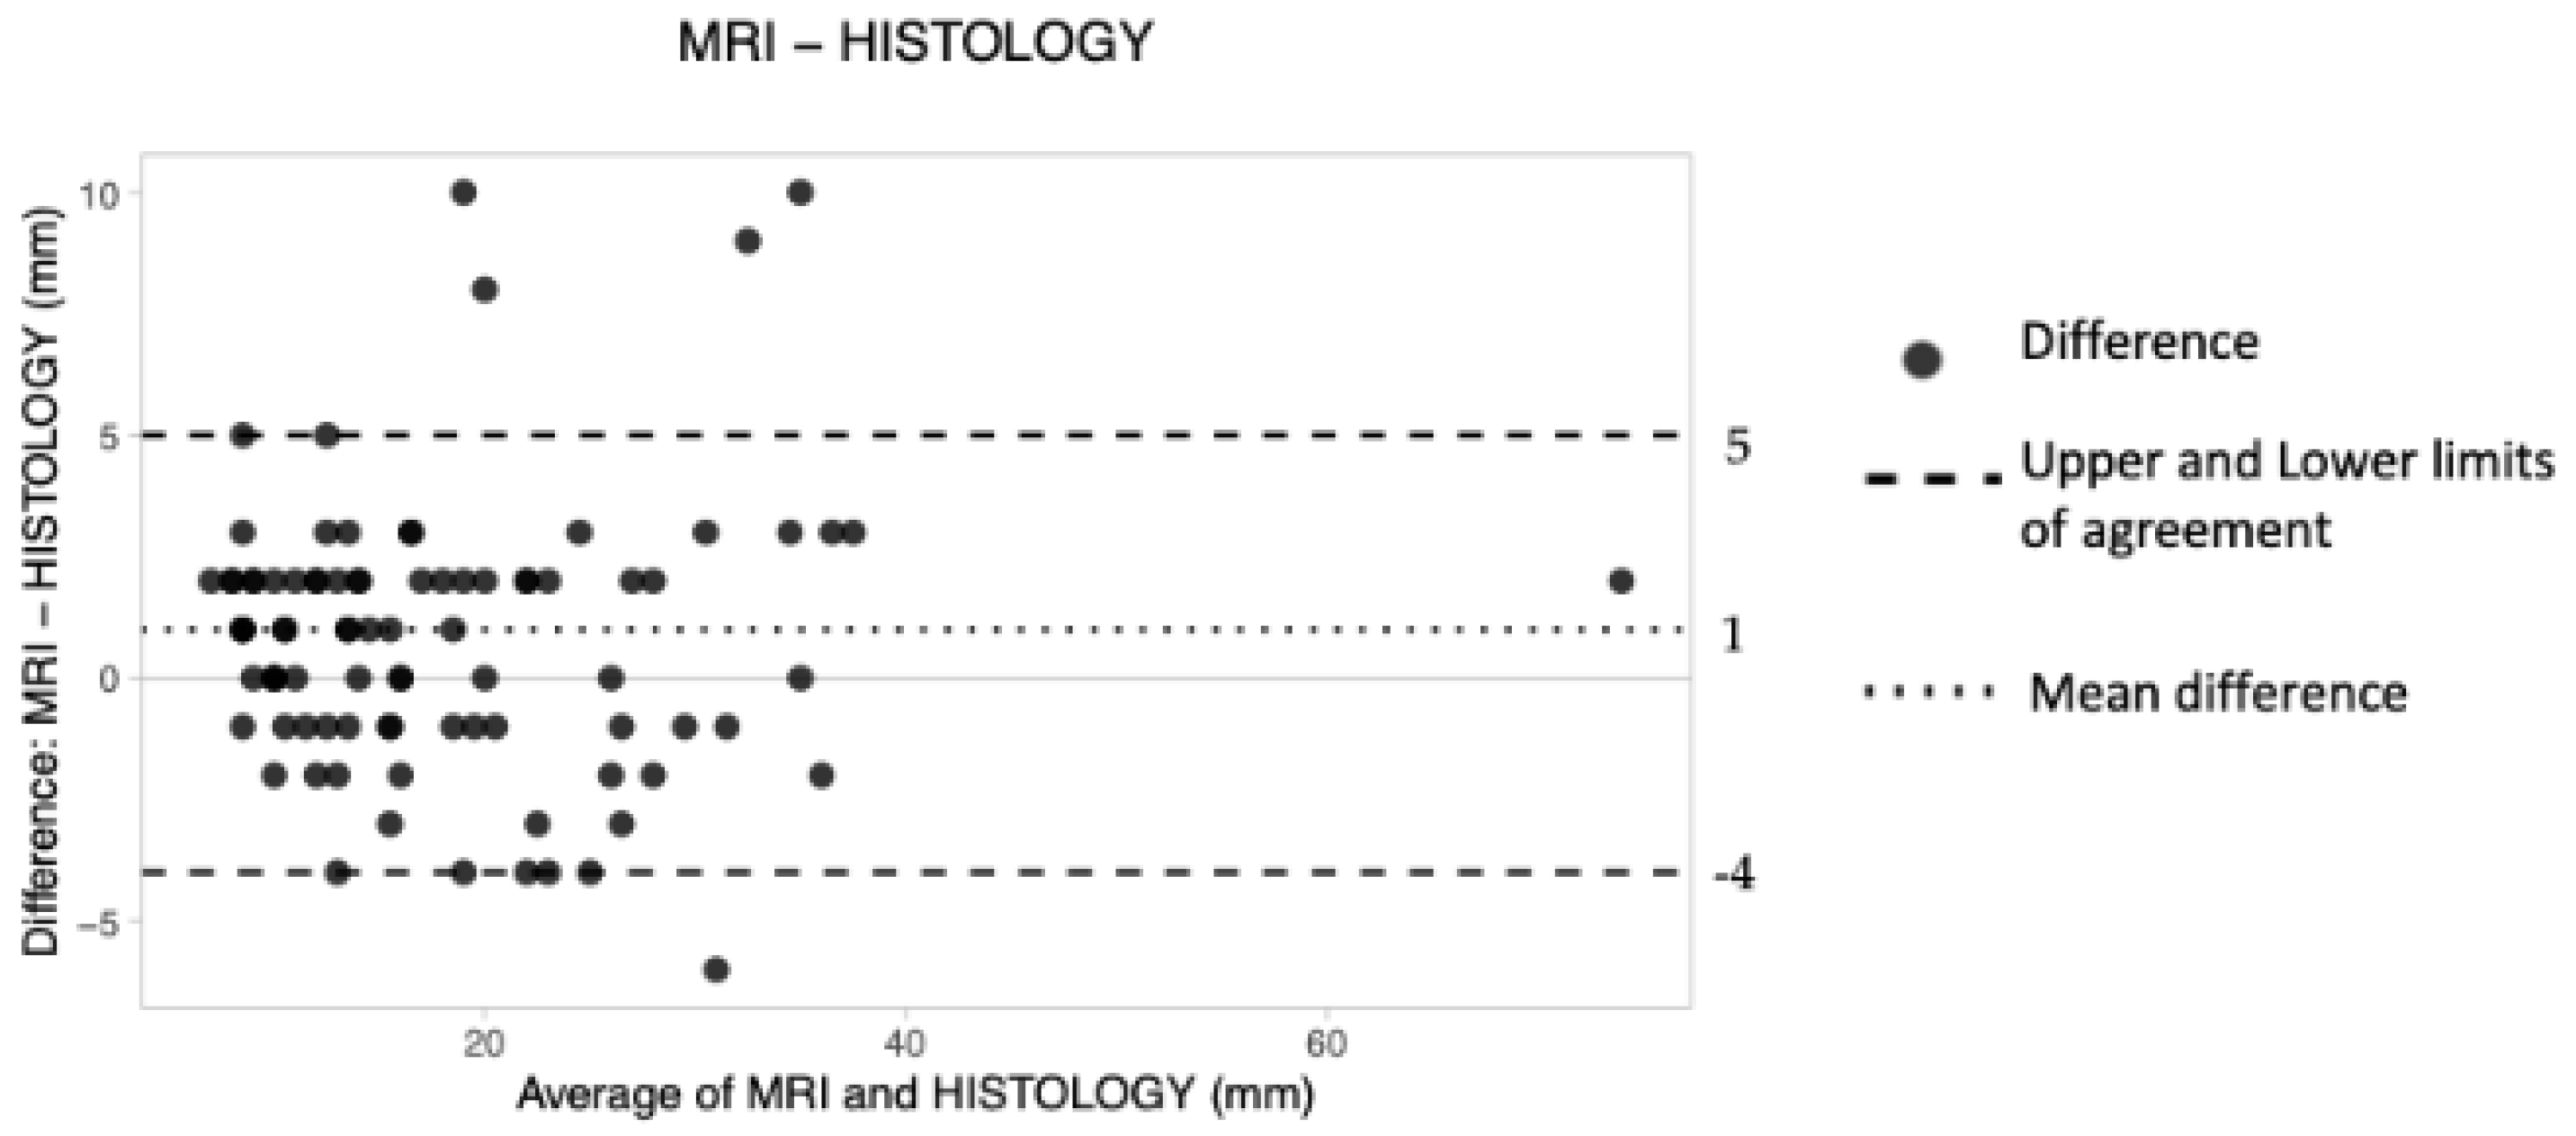
Magnetic Resonance Imaging (MRI)
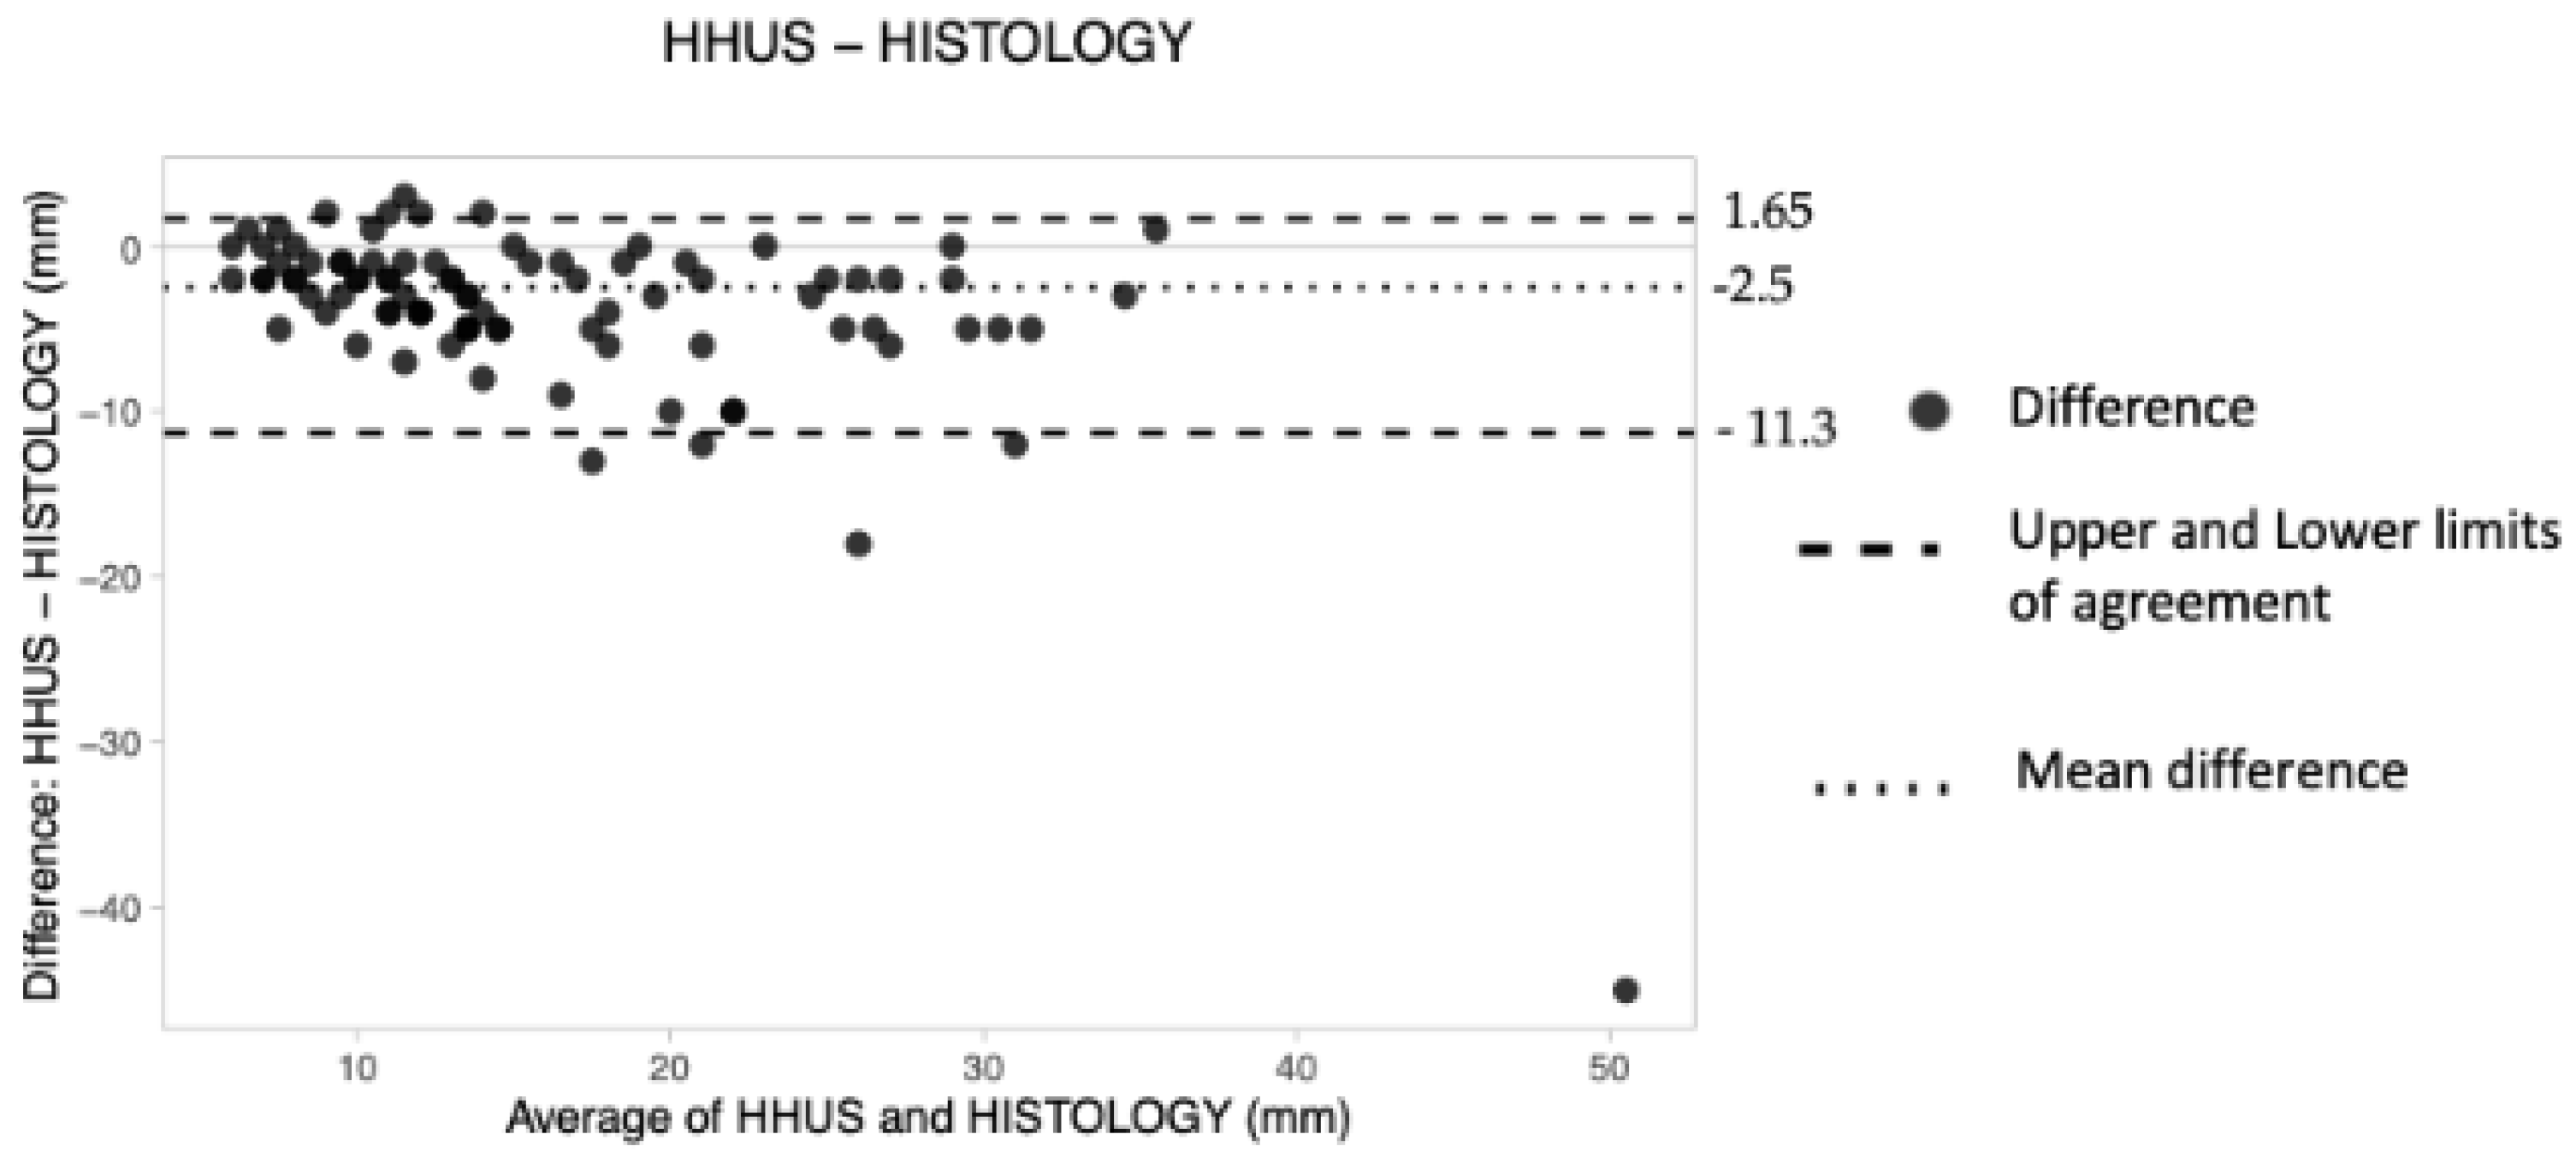
Hand-Held Ultrasound (HHUS)
4. Discussion
5. Conclusions
Author Contributions
Funding
Institutional Review Board Statement
Informed Consent Statement
Data Availability Statement
Conflicts of Interest
References
- Van Zelst, J.C.; Platel, B.; Karssemeijer, N.; Mann, R.M. Multiplanar reconstruction of 3D automated breast ultrasound improve lesion differentiation by radiologists. Acad. Radiol. 2015, 22, 1489–1496. [Google Scholar] [CrossRef] [PubMed]
- Kim, S.H. Image quality and artifacts in automated breast ultrasonography. Ultrasonography 2019, 38, 83–91. [Google Scholar] [CrossRef] [PubMed]
- Schmachtenberg, C.; Fischer, T.; Hamm, B.; Bick, U. Diagnostic performance of automated breast volume scanning (ABVS) compared to handheld ultrasonography with breast MRI as the gold standard. Acad. Radiol. 2017, 24, 954–961. [Google Scholar] [CrossRef]
- Burkett, B.J.; Hanemann, C.W. A Review of Supplemental Screening Ultrasound for Breast Cancer: Certain Populations of Women with Dense Breast Tissue May Benefit. Acad. Radiol. 2016, 23, 1604–1609. [Google Scholar] [CrossRef] [PubMed]
- Brem, R.F.; Tabar, L.; Duffy, S.W.; Inciardi, M.F.; GuinGrich, J.A.; Hashimoto, B.E.; Lander, M.R.; Lapidus, R.L.; Peterson, M.K.; Rapelyea, J.A.; et al. Assessing improvement in detection of breast cancer with Three-dimensional Automated breast US in women with dense breast tissue: The SomoInsight Study. Radiology 2015, 274, 663–673. [Google Scholar] [CrossRef]
- Mundinger, A. 3D Supine automated ultrasound (SAUS, ABUS, ABVS) for supplemental screening women with dense breasts. J. Breast Health 2016, 12, 52–55. [Google Scholar] [CrossRef]
- Urban, L. Automated breast ultrasound: Are we ready to put it into practice in Brazil? Radiol. Bras. 2020, 53, VII–VIII. [Google Scholar] [CrossRef]
- Amy, D. Automatic breast ultrasound scanning. In Lobar Approach to Breast Ultrasound; Springer: Cham, Switzerland, 2018; pp. 325–335. [Google Scholar] [CrossRef]
- Rella, R.; Belli, P.; Giuliani, M.; Bufi, E.; Carlino, G.; Rinaldi, P.; Manfredi, R. Automated Breast Ultrasonography (ABUS) in the Screening and Diagnostic Setting: Indications and Practical Use. Acad. Radiol. 2018, 25, 1457–1470. [Google Scholar] [CrossRef]
- Moran, M.S.; Schnitt, S.J.; Giuliano, A.E.; Harris, J.R.; Khan, S.A.; Horton, J.; Klimberg, S.; Chavez-MacGregor, M.; Freedman, G.; Houssami, N.; et al. SSO-ASTRO Consensus Guideline on Margins for Breast-Conserving Surgery with Whole Breast Irradiation in Stage I and II Invasive Breast Cancer. Int. J. Radiat. Oncol. Biol. Phys. 2014, 88, 553–564. [Google Scholar] [CrossRef]
- Wilczek, B.; Wilczek, H.E.; Rasouliyan, L.; Leifland, K. Adding 3D automated breast ultrasound to mammography screening in women with heterogeneously and extremely dense breasts: Report from a hospital-based, high-volume, single-center breast cancer screening program. Eur. J. Radiol. 2016, 85, 1554–1563. [Google Scholar] [CrossRef]
- Veronesi, U.; Volterrani, F.; Luini, A.; Saccozzi, R.; Del Vecchio, M.; Zucali, R.; Galimberti, V.; Rasponi, A.; Di Re, E.; Squicciarini, P.; et al. Quadrantectomy versus Lumpectomy for Small Size Breast Cancer. Eur. J. Cancer 1990, 2, 671–673. [Google Scholar] [CrossRef]
- Veronesi, U.; Cascinelli, N.; Mariani, L.; Greco, M.; Saccozzi, R.; Luini, A.; Aguilar, M.; Marubini, E. Twenty-year follow-up of a randomized study comparing breast-conserving surgery with radical mastectomy for early breast cancer. Engl. J. Med. 2002, 347, 16. [Google Scholar] [CrossRef] [PubMed]
- Seo, N.; Kim, H.H.; Shin, H.J.; Cha, J.H.; Moon, J.H.; Gong, G.; Ahn, S.H.; Son, B.H. Digital breast tomosynthesis versus full-field digital mammography: Comparison of the accuracy of lesion measurement and characterization using specimens. Acta Radiol. 2014, 55, 661–667. [Google Scholar] [CrossRef] [PubMed]
- Amin, M.B.; Greene, F.L.; Edge, S.B.; Compton, C.C.; Gershenwald, J.E.; Brookland, R.K.; Meyer, L.; Gress, D.M.; Byrd, D.R.; Winchester, D.P. The Eighth Edition AJCC Cancer Staging Manual: Continuing to build a bridge from a population-based to a more “personalized” approach to cancer staging. CA Cancer J. Clin. 2017, 67, 93–99. [Google Scholar] [CrossRef] [PubMed]
- Mann, R.M. European Society of Breast Imaging (EUSOBI), with language review by Europa Donna–The European Breast Cancer Coalition. Breast MRI: EUSOBI recommendations for women’s information. Eur. Radiol. 2015, 25, 3669–3678. [Google Scholar] [CrossRef] [PubMed]
- Houssami, N.; Turner, R.M.; Morrow, M. Meta-analysis of pre-operative magnetic resonance imaging (MRI) and surgical treatment for breast cancer. Breast Cancer Res. Treat. 2017, 165, 273–283. [Google Scholar] [CrossRef] [PubMed]
- Sardanelli, F.; Trimboli, R.M.; Houssami, N.; Gilbert, F.J.; Helbich, T.H.; Alvarez Benito, M.; Balleyguier, C.; Bazzocchi, M.; Bult, P.; Calabrese, M.; et al. Solving the preoperative breast MRI conundrum: Design and protocol of the MIPA study. Eur. Radiol. 2020, 30, 5427–5436. [Google Scholar] [CrossRef]
- Mariscotti, G.; Nehmat, H.; Durando, M.; Bergamasco, L.; Campanino, P.P.; Ruggieri, C.; Regini, E.; Luparia, A.; Bussone, R.; Sapino, A.; et al. Accuracy of Mammography, Digital Breast Tomosynthesis, Ultrasound and MR Imaging in Preoperative Assessment of Breast Cancer. Anticancer Res. 2014, 34, 1219–1226. [Google Scholar]
- Cardoso, F.; Kyriakides, S.; Ohno, S.; Penault-Llorca, F.; Poortmans, P.; Rubio, I.T.; Zackrisson, S.; Senkus, E.; ESMO Guidelines Committee. Early breast cancer: ESMO Clinical Practice Guidelines for diagnosis, treatment and follow-up. Ann. Oncol. 2019, 30, 1194–1220. [Google Scholar] [CrossRef]
- Sardu, C.; Gatta, G.; Pieretti, G.; Viola, L.; Sacra, C.; Di Grezia, G. Pre-Menopausal Breast Fat Density Might Predict MACE During 10 Years of Follow-Up: The BRECARD Study. JACC Cardiovasc. Imaging 2021, 14, 426–438. [Google Scholar] [CrossRef]
- Di Grezia, G.; Prisco, V.; Iannaccone, T.; Grassi, R.; Serra, N.; Gatta, G. Personality disorder and temperamental traits in patients with breast disease: Preliminary results. Minerva Psichiatr. 2016, 57, 85–92. [Google Scholar]
- Xiao, Y.; Wang, Z.; Chen, Z. Automated breast volume scanner (ABVS) in breast cancer—A review. Eur. J. Gynaecol. Oncol. 2017, 38, 184–186. [Google Scholar] [PubMed]
- Girometti, R.; Tomkova, L.; Cereser, L.; Zuiani, C. Breast cancer staging: Combined Digital breast tomosynthesis and Automated breast ultrasound versus Magnetic resonance imaging. Eur. J. Radiol. 2018, 107, 188–195. [Google Scholar] [CrossRef] [PubMed]
- Choi, W.J.; Cha, J.H.; Kim, H.H.; Shin, H.J.; Kim, H.; Chae, E.Y.; Hong, M.J. Comparison of automated breast volume scanning and hand-held ultrasound in the detection of breast cancer: An analysis of 5566 patient evaluations. Asian Pac. J. Cancer Prev. 2014, 15, 9101–9105. [Google Scholar] [CrossRef]
- La Forgia, D.; Fausto, A.; Gatta, G.; Di Grezia, G.; Faggian, A.; Fanizzi, A.; Cutrignelli, D.; Dentamaro, R.; Didonna, V.; Lorusso, V.; et al. Elite VABB 13G: A new ultrasound-guided wireless biopsy system for breast lesions. Technical characteristics and comparison with respect to traditional core-biopsy 14–16 G systems. Diagnostics 2020, 10, 291. [Google Scholar] [CrossRef]
- Di Grezia, G.; Somma, F.; Serra, N.; Reginelli, A.; Cappabianca, S.; Grassi, R.; Gatta, G. Reducing Costs of Breast Examination: Ultrasound Performance and Inter-Observer Variability of Expert Radiologists Versus Residents. Cancer Investig. 2016, 34, 355–360. [Google Scholar] [CrossRef]
- Li, N.; Jiang, Y.X.; Zhu, Q.L.; Zhang, J.; Dai, Q.; Liu, H.; Yang, Q.; Wang, H.-Y.; Lai, X.-J.; Sun, Q. Accuracy of an Automated Breast Volume Ultrasound System for Assessment of the Pre-operative Extent of Pure Ductal Carcinoma In Situ: Comparison with a Conventional Handheld Ultrasound Examination. Ultrasound Med. Biol. 2013, 39, 2255–2263. [Google Scholar] [CrossRef]
- Gruber, I.V.; Rueckert, M.; Kagan, K.O.; Staebler, A.; Siegmann, K.C.; Hartkopf, A.; Wallwiener, D.; Hahn, M. Measurement of tumour size with mammography, sonography and magnetic resonance imaging as compared to histological tumour size in primary breast cancer. BMC Cancer 2013, 13, 328. [Google Scholar] [CrossRef]
- Marinovich, M.L.; Macaskill, P.; Irwig, L.; Sardanelli, F.; von Minckwitz, G.; Mamounas, E.; Brennan, M.; Ciatto, S.; Houssami, N. Meta-analysis of agreement between MRI and pathologic breast tumour size after neoadjuvant chemotherapy. Br. J. Cancer 2013, 109, 1528–1536. [Google Scholar] [CrossRef]


| Group | Group 1 | Group 2 | p-Value (Student’s t-Test) |
|---|---|---|---|
| Nb patients | 44 | 44 | - |
| Mean age (years) | 56.2 (SD 10.9) | 60.5 (SD 10.7) | 0.06659 |
| Type of surgery | |||
| BCS | 40 | 37 | - |
| Mastectomy | 4 | 7 | - |
| Histological type | |||
| IDC | 33 | 36 | - |
| ILC | 10 | 2 | - |
| NST | 0 | 6 | - |
| DCIS | 1 | 0 | - |
| Molecular subtype | |||
| Luminal A-like | 10 | 10 | - |
| Luminal B-like HER2+ | 11 | 4 | - |
| Luminal B-like HER2− | 18 | 24 | - |
| HER2-positive | 2 | 3 | - |
| Triple-negative | 3 | 3 | - |
| Mean size at the histology of the surgical specimen (mm) | 16.4 ± SD 7.7 (7–37) | 19.5 ± SD 11.9 (6–73) | 0.124347 |
| Group | n | HHUS (mm) | 3D ABUS (mm) | CE-MRI (mm) | HE (mm) |
|---|---|---|---|---|---|
| Group 1 | 44 | 12.4 ± SD 4.9 (5–25) | 14.1 ± SD 5.8 (5–30) | 16.5 ± SD 6.9 (9–35) | 16.4 ± SD 7.7 (7–37) |
| Group 2 | 44 | 16.3 ± SD 8.5 (5–36) | 15.6 ± SD 10.1 (5–55) | 21.2 ± SD 12.4 (8–75) | 19.5 ± SD 11.9 (6–73) |
| Patient | ABVS (mm) | HE (mm) | Mean | Difference |
|---|---|---|---|---|
| 1 | 9 | 7 | 8 | 2 |
| 2 | 10 | 10 | 10 | 0 |
| 3 | 11 | 8 | 9.5 | 3 |
| 4 | 9 | 14 | 11.5 | −5 |
| 5 | 25 | 27 | 26 | −2 |
| 6 | 11 | 11 | 11 | 0 |
| 7 | 30 | 37 | 33.5 | −7 |
| 8 | 20 | 27 | 23.5 | −7 |
| 9 | 13 | 16 | 14.5 | −3 |
| 10 | 25 | 35 | 30 | −10 |
| 11 | 19 | 24 | 21.5 | −5 |
| 12 | 15 | 15 | 15 | 0 |
| 13 | 25 | 27 | 26 | −2 |
| 14 | 5 | 10 | 7.5 | −5 |
| 15 | 11 | 13 | 12 | −2 |
| 16 | 20 | 27 | 23.5 | −7 |
| 17 | 8 | 10 | 9 | −2 |
| 18 | 12 | 10 | 11 | 2 |
| 19 | 19 | 18 | 18.5 | 1 |
| 20 | 15 | 25 | 20 | −10 |
| 21 | 10 | 13 | 11.5 | −3 |
| 22 | 15 | 16 | 15.5 | −1 |
| 23 | 20 | 16 | 18 | 4 |
| 24 | 10 | 24 | 17 | −14 |
| 25 | 9 | 8 | 8.5 | 1 |
| 26 | 15 | 14 | 14.5 | 1 |
| 27 | 9 | 15 | 12 | −6 |
| 28 | 10 | 12 | 11 | −2 |
| 29 | 25 | 30 | 27.5 | −5 |
| 30 | 14 | 17 | 15.5 | −3 |
| 31 | 18 | 19 | 18.5 | −1 |
| 32 | 15 | 16 | 15.5 | −1 |
| 33 | 8 | 9 | 8.5 | −1 |
| 34 | 9 | 7 | 8 | 2 |
| 35 | 9 | 10 | 9.5 | −1 |
| 36 | 8 | 8 | 8 | 0 |
| 37 | 10 | 13 | 11.5 | −3 |
| 38 | 8 | 8 | 8 | 0 |
| 39 | 16 | 21 | 18.5 | −5 |
| 40 | 11 | 10 | 10.5 | 1 |
| 41 | 18 | 20 | 19 | −2 |
| 42 | 14 | 15 | 14.5 | −1 |
| 43 | 18 | 20 | 19 | −2 |
| 44 | 10 | 11 | 10.5 | −1 |
| Mean (d) | −2 | |||
| SD | 3 |
| Supine 3D US (ABVS) vs. HE | Value (mm) | 95% CI Lower Limit | 95% CI Upper Limit |
|---|---|---|---|
| Difference (d) | −2 | −3 | −1 |
| Upper LoA | 2 | 1 | 3.85 |
| Lower LoA | −9.55 | −13.4 | −5.85 |
| Prone 3D US (SOFIA) vs. HE | |||
| Difference (d) | −4.00 | −4.00 | −2.5 |
| Upper LoA | −1.00 | −2.00 | 0.85 |
| Lower LoA | −6.85 | −8.70 | −5.00 |
| MRI vs. HE | |||
| Difference (d) | 1 | 0 | 2 |
| Upper LoA | 5 | 3 | 9.65 |
| Lower LoA | −4 | −4 | −2 |
| HHUS vs. HE | |||
| Difference (d) | −2.5 | −4 | −2 |
| Upper LoA | 1.65 | 0 | 2 |
| Lower LoA | −11.3 | −16.25 | −7.65 |
| Patient | SOFIA (mm) | HE (mm) | Mean | Difference |
|---|---|---|---|---|
| 1 | 30 | 36 | 33 | −6 |
| 2 | 10 | 11 | 10.5 | −1 |
| 3 | 7 | 11 | 9 | −4 |
| 4 | 12 | 14 | 13 | −2 |
| 5 | 7 | 9 | 8 | −2 |
| 6 | 7 | 6 | 6.5 | 1 |
| 7 | 10 | 12 | 11 | −2 |
| 8 | 9 | 14 | 11.5 | −5 |
| 9 | 14 | 16 | 15 | −2 |
| 10 | 10 | 15 | 12.5 | −5 |
| 11 | 13 | 17 | 15 | −4 |
| 12 | 11 | 17 | 14 | −6 |
| 13 | 29 | 29 | 29 | 0 |
| 14 | 5 | 7 | 6 | −2 |
| 15 | 28 | 32 | 30 | −4 |
| 16 | 23 | 28 | 25.5 | −5 |
| 17 | 11 | 16 | 13.5 | −5 |
| 18 | 28 | 33 | 30.5 | −5 |
| 19 | 6 | 8 | 7 | −2 |
| 20 | 17 | 19 | 18 | −2 |
| 21 | 10 | 14 | 12 | −4 |
| 22 | 25 | 30 | 27.5 | −5 |
| 23 | 20 | 23 | 21.5 | −3 |
| 24 | 30 | 34 | 32 | −4 |
| 25 | 20 | 22 | 21 | −2 |
| 26 | 8 | 13 | 10.5 | −5 |
| 27 | 8 | 12 | 10 | −4 |
| 28 | 9 | 10 | 9.5 | −1 |
| 29 | 19 | 21 | 20 | −2 |
| 30 | 9 | 13 | 11 | −4 |
| 31 | 7 | 11 | 9 | −4 |
| 32 | 33 | 35 | 34 | −2 |
| 33 | 9 | 13 | 11 | −4 |
| 34 | 5 | 6 | 5.5 | −1 |
| 35 | 22 | 29 | 25.5 | −7 |
| 36 | 20 | 26 | 23 | −6 |
| 37 | 55 | 60 | 57.5 | −5 |
| 38 | 22 | 26 | 24 | −4 |
| 39 | 21 | 28 | 24.5 | −7 |
| 40 | 7 | 11 | 9 | −4 |
| 41 | 18 | 21 | 19.5 | −3 |
| 42 | 9 | 18 | 13.5 | −9 |
| 43 | 6,5 | 9 | 7.75 | −2.5 |
| 44 | 11 | 21 | 16 | −10 |
| Mean (d) | −4 | |||
| SD | 2 |
Publisher’s Note: MDPI stays neutral with regard to jurisdictional claims in published maps and institutional affiliations. |
© 2022 by the authors. Licensee MDPI, Basel, Switzerland. This article is an open access article distributed under the terms and conditions of the Creative Commons Attribution (CC BY) license (https://creativecommons.org/licenses/by/4.0/).
Share and Cite
D’Angelo, A.; Gatta, G.; Di Grezia, G.; Mercogliano, S.; Ferrara, F.; Trombadori, C.M.L.; Franco, A.; Cina, A.; Belli, P.; Manfredi, R. Supine versus Prone 3D Abus Accuracy in Breast Tumor Size Evaluation. Tomography 2022, 8, 1997-2009. https://doi.org/10.3390/tomography8040167
D’Angelo A, Gatta G, Di Grezia G, Mercogliano S, Ferrara F, Trombadori CML, Franco A, Cina A, Belli P, Manfredi R. Supine versus Prone 3D Abus Accuracy in Breast Tumor Size Evaluation. Tomography. 2022; 8(4):1997-2009. https://doi.org/10.3390/tomography8040167
Chicago/Turabian StyleD’Angelo, Anna, Gianluca Gatta, Graziella Di Grezia, Sara Mercogliano, Francesca Ferrara, Charlotte Marguerite Lucille Trombadori, Antonio Franco, Alessandro Cina, Paolo Belli, and Riccardo Manfredi. 2022. "Supine versus Prone 3D Abus Accuracy in Breast Tumor Size Evaluation" Tomography 8, no. 4: 1997-2009. https://doi.org/10.3390/tomography8040167