


Metaheuristic-Based Feature Selection Methods for Diagnosing Sarcopenia with Machine Learning Algorithms

Abstract
:1. Introduction
1.1. Background and Purpose of Study
1.2. Related Work and Contributions of the Study
2. Materials and Methods
2.1. Diagnosing Sarcopenia
2.2. Feature Selection
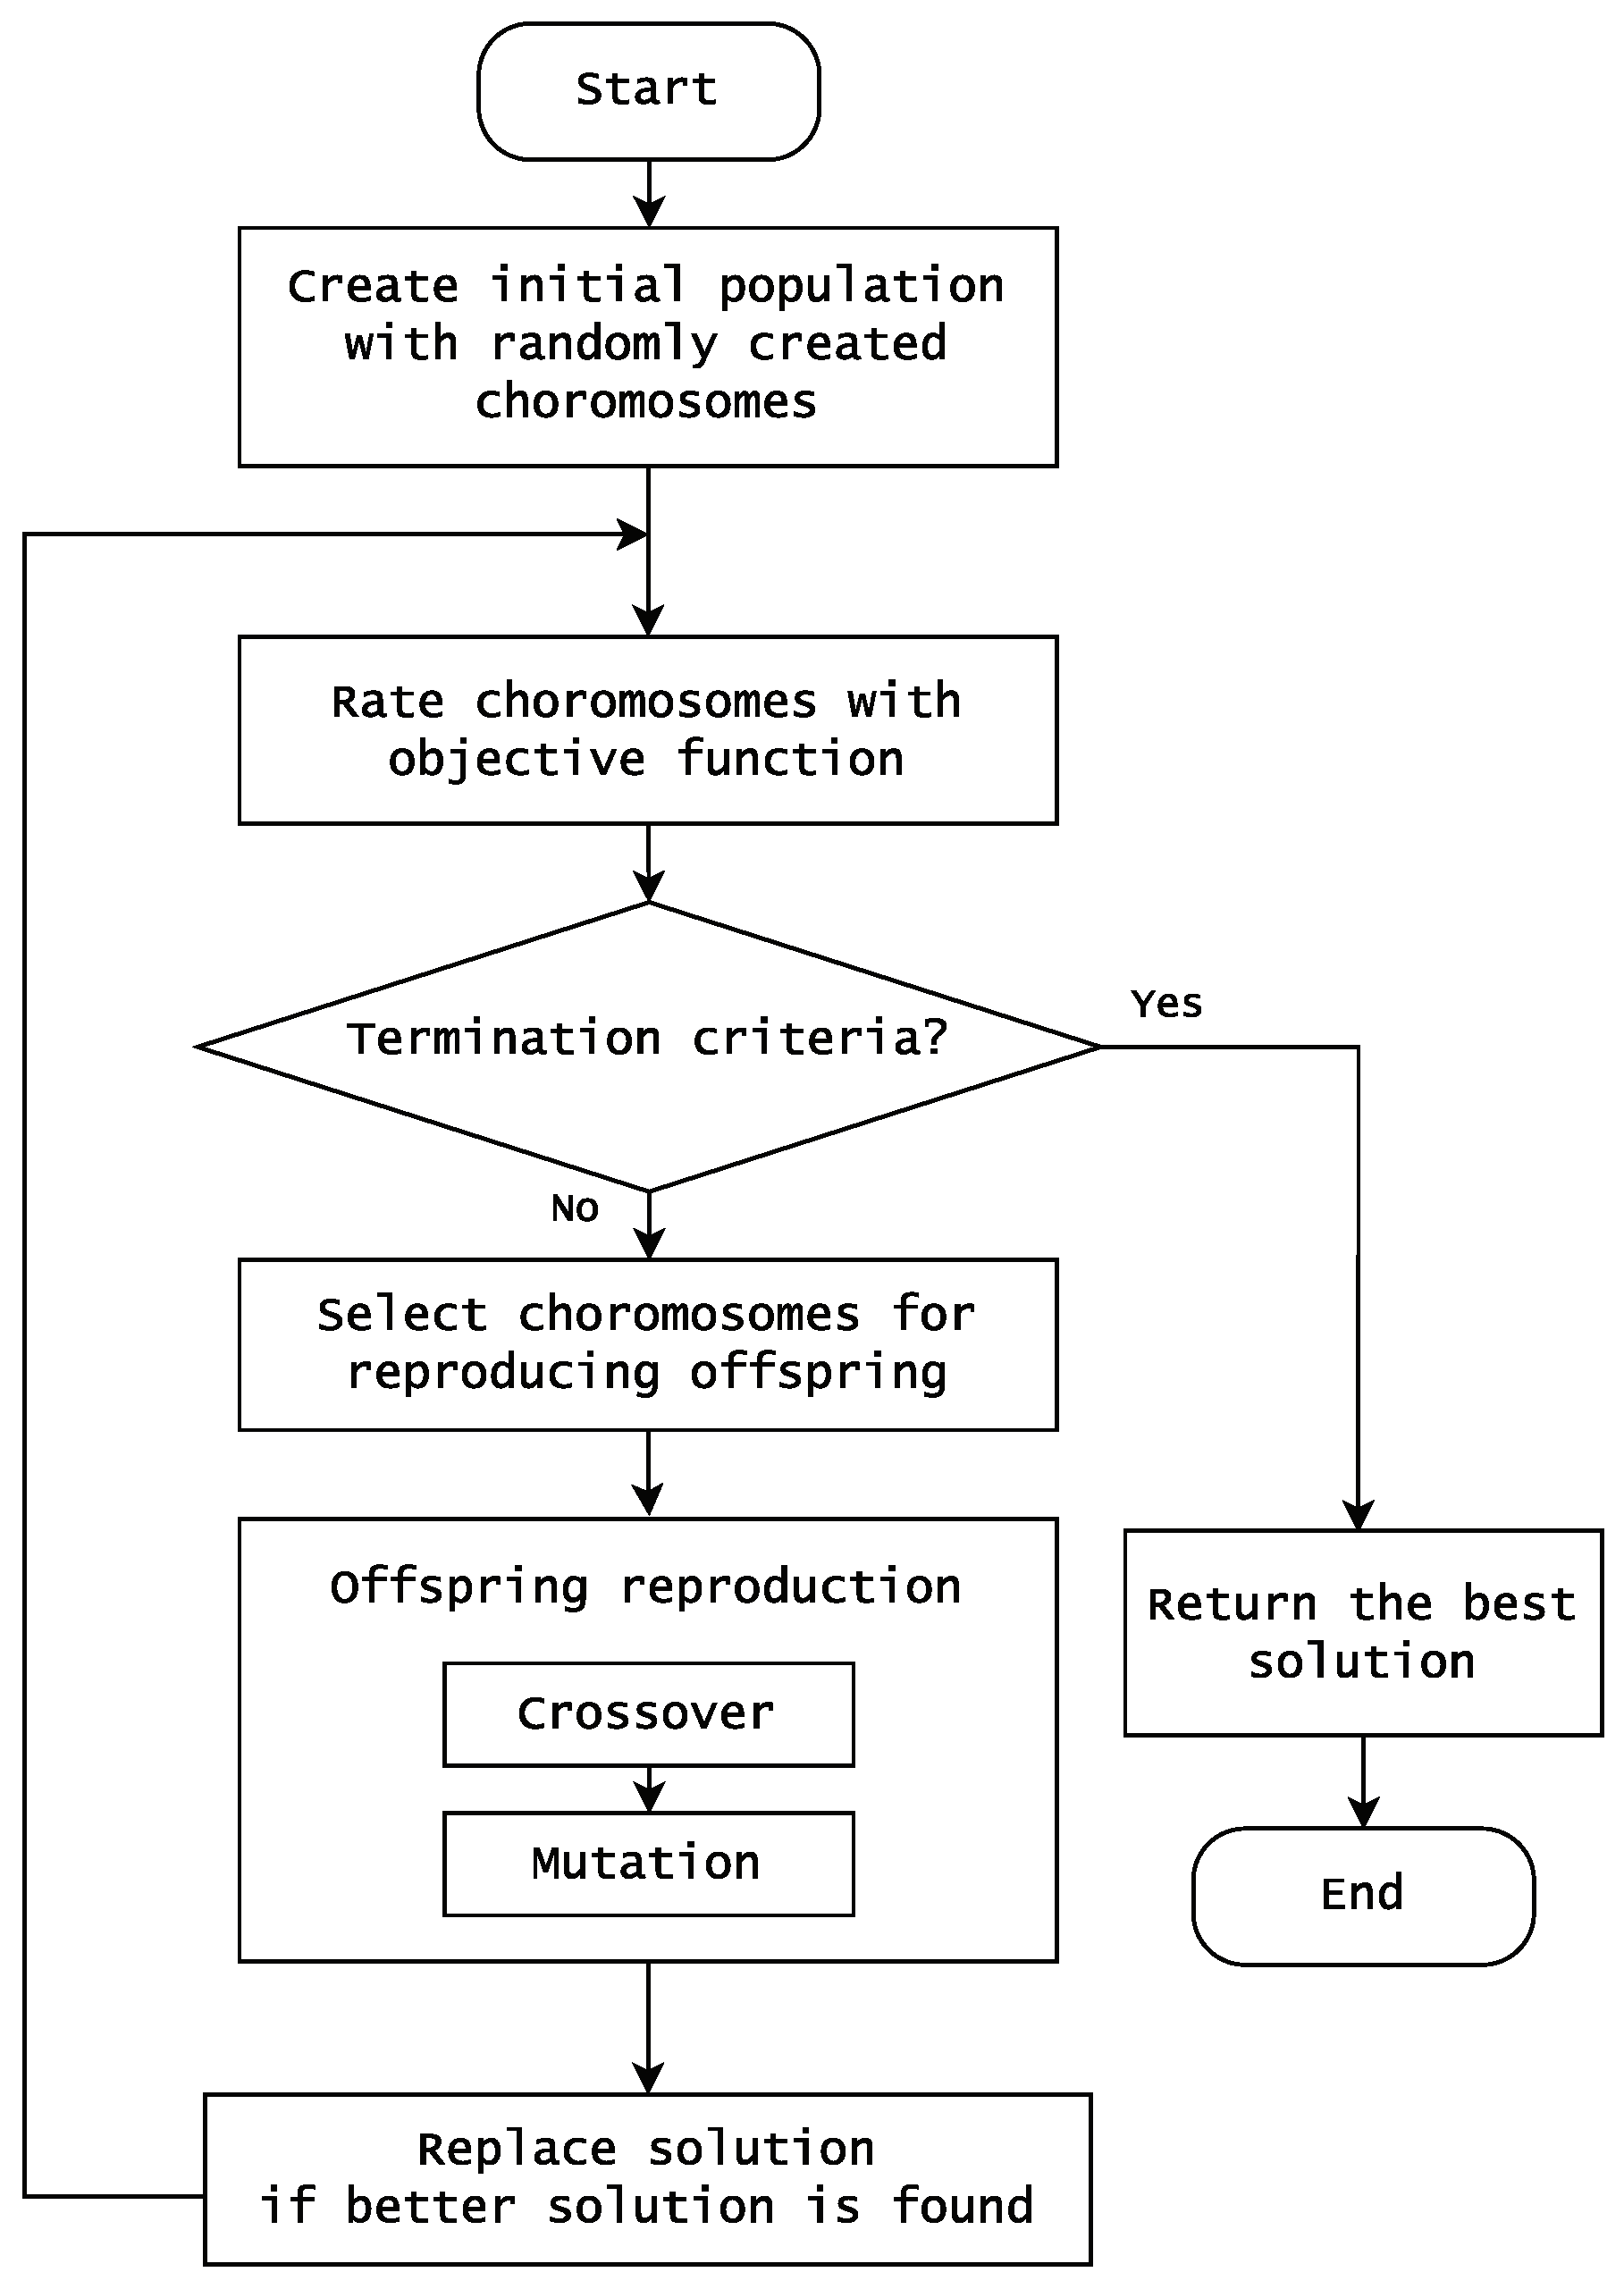
2.3. The Genetic Algorithm
2.4. Harmony Search
- Initialization of the problem and its parameters;
- Random initialization of harmonies in the solution set;
- Generation and evaluation of new harmonies;
- Replacement of existing worst harmonies with newly created ones if they yield better fitness;
- Reiteration of Steps 3 and 4 until meeting termination conditions.
3. Experiment Setup
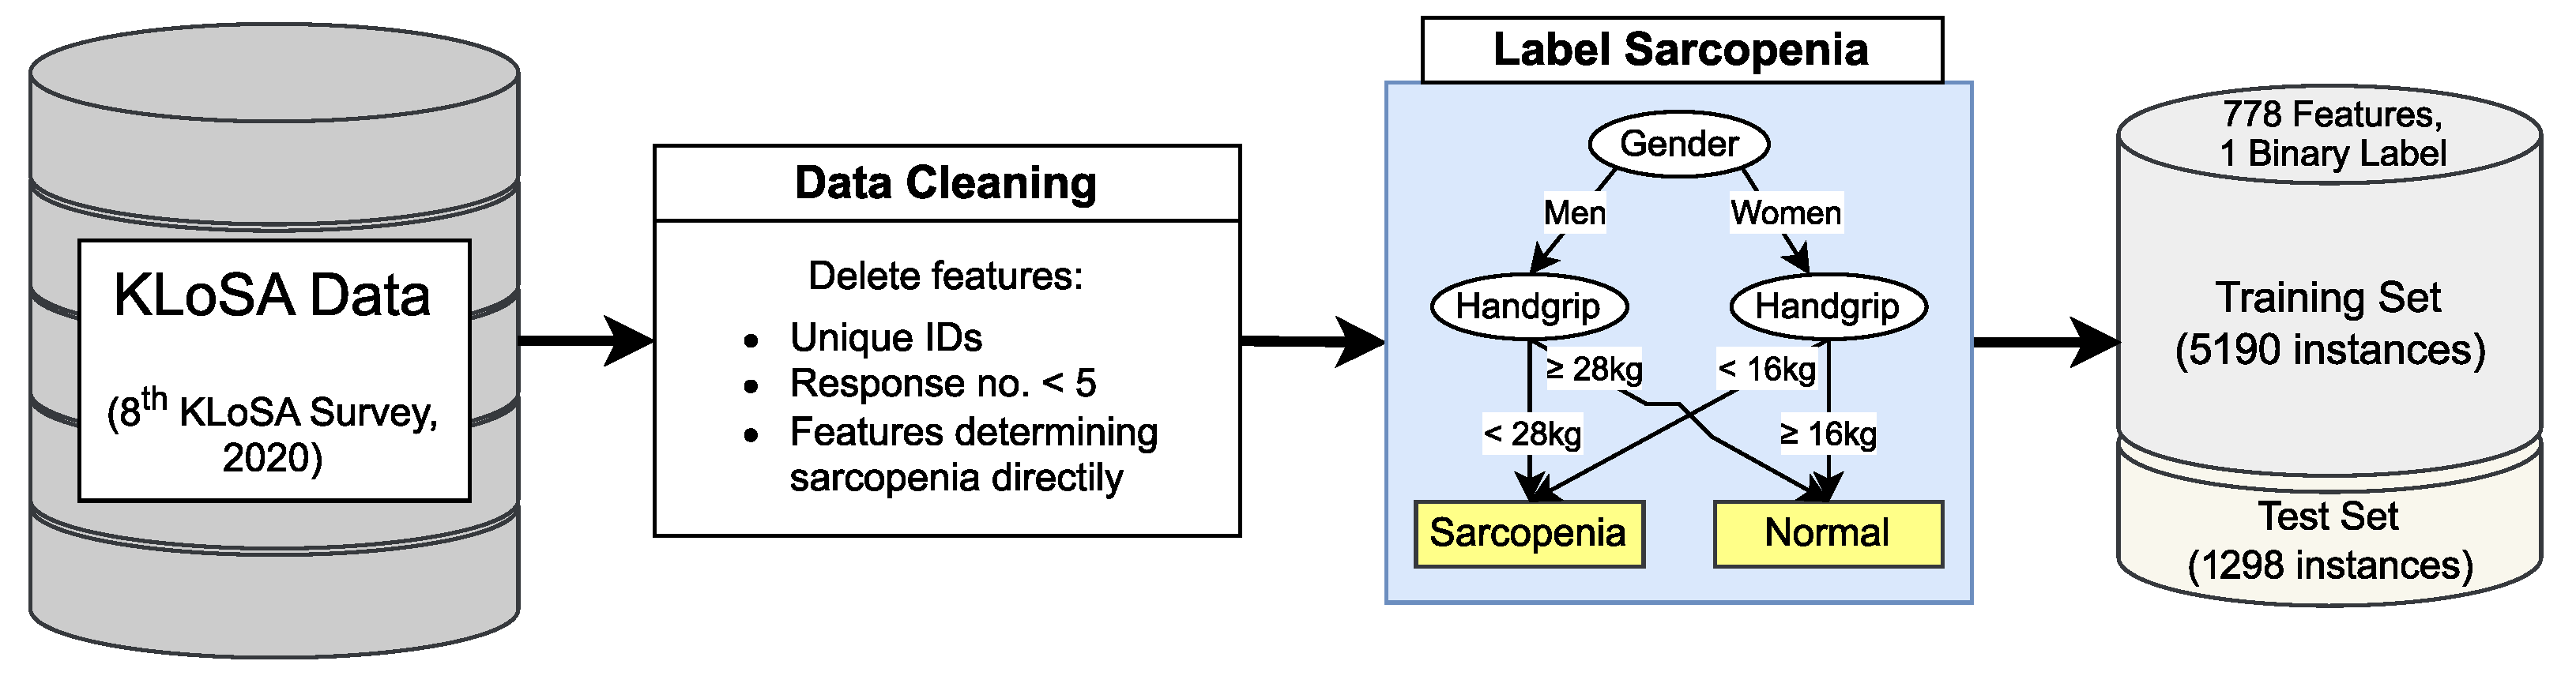
3.1. Dataset
3.2. The Metaheuristic Algorithm
3.2.1. Algorithm Implementation
3.2.2. Dynamic Parameter Adjustment
3.3. Feature Set Evaluation
4. Experimental Results and Discussion
4.1. Comparison with Traditional Feature Selection Methods
4.2. The Effect of Dynamic Parameter Adjustment
4.3. Summarization
5. Conclusions
Author Contributions
Funding
Institutional Review Board Statement
Informed Consent Statement
Data Availability Statement
Acknowledgments
Conflicts of Interest
Abbreviations
| GA | genetic algorithm; |
| HS | harmony search; |
| CFS | CfsSubsetEval in WEKA; |
| IG | InfoGainAttributeEval in WEKA; |
| KLoSA | Korean Longitudinal Study of Aging. |
Appendix A. Parameter for Machine Learning

| Algorithm | Parameter |
|---|---|
| J48 | -C 0.25 -M 2 |
| RandomForest | -K 0 -M 1.0 -V 0.001 -S 1 |
| SMO | -C 1.0 -L 0.001 -P 1.0E-12 -K PolyKernel -calibrator Logistic |
| NaiveBayes | Do not have specific parameter |
References
- Santilli, V.; Bernetti, A.; Mangone, M.; Paoloni, M. Clinical definition of sarcopenia. Clin. Cases Miner. Bone Metab. 2014, 11, 177. [Google Scholar] [CrossRef] [PubMed]
- Sayer, A.A.; Cruz-Jentoft, A. Sarcopenia definition, diagnosis and treatment: Consensus is growing. Age Ageing 2022, 51, afac220. [Google Scholar] [CrossRef] [PubMed]
- Gu, S.; Wang, L.; Han, R.; Liu, X.; Wang, Y.; Chen, T.; Zheng, Z. Detection of sarcopenia using deep learning-based artificial intelligence body part measure system (AIBMS). Front. Physiol. 2023, 14, 46. [Google Scholar] [CrossRef] [PubMed]
- Lin, S.; Chen, C.; Cai, X.; Yang, F.; Fan, Y. Development and verification of a combined diagnostic model for sarcopenia with random forest and artificial neural network. Comput. Math. Methods Med. 2022, 2022, 2957731. [Google Scholar] [CrossRef] [PubMed]
- Kang, Y.-J.; Yoo, J.-I.; Ha, Y.-C. Sarcopenia feature selection and risk prediction using machine learning: A cross-sectional study. Medicine 2019, 98, e17699. [Google Scholar] [CrossRef] [PubMed]
- Turimov Mustapoevich, D.; Kim, W. Machine learning applications in sarcopenia detection and management: A comprehensive survey. Healthcare 2023, 11, 2483. [Google Scholar] [CrossRef] [PubMed]
- Geng, J.; Deng, L.; Qiu, S.; Bian, H.; Cai, B.; Jin, K.; Zheng, X.; Li, J.; Liao, X.; Li, Y.; et al. Dietary inflammatory potential and risk of sarcopenia: Data from national health and nutrition examination surveys. Aging 2021, 13, 1913. [Google Scholar] [CrossRef]
- Van Dongen, C.; Paik, J.M.; Harring, M.; Younossi, Y.; Price, J.K.; Kabbara, K.; Golabi, P.; Younossi, Z.M. Sarcopenia, healthy living, and mortality in patients with chronic liver diseases. Hepatol. Commun. 2022, 6, 3140–3153. [Google Scholar] [CrossRef]
- Liao, H.; Yang, Y.; Zeng, Y.; Qiu, Y.; Chen, Y.; Zhu, L.; Fu, P.; Yan, F.; Chen, Y.; Yuan, H. Use machine learning to help identify possible sarcopenia cases in maintenance hemodialysis patients. BMC Nephrol. 2023, 24, 34. [Google Scholar]
- Siregar, E. Learning human insight by cooperative AI: Shannon-Neumann measure. IOP SciNotes 2021, 2, 025001. [Google Scholar] [CrossRef]
- Luo, X.; Ding, H.; Broyles, A.; Warden, S.J.; Moorthi, R.N.; Imel, E.A. Using machine learning to detect sarcopenia from electronic health records. Digit. Health 2023, 9, 20552076231197098. [Google Scholar] [CrossRef] [PubMed]
- Seok, M.; Kim, W. Sarcopenia prediction for elderly people using machine learning: A case study on physical activity. Healthcare 2023, 11, 1334. [Google Scholar] [CrossRef]
- Zupo, R.; Moroni, A.; Castellana, F.; Gasparri, C.; Catino, F.; Lampignano, L.; Perna, S.; Clodoveo, M.L.; Sardone, R.; Rondanelli, M. A machine-learning approach to target clinical and biological features associated with sarcopenia: Findings from northern and Southern Italian aging populations. Metabolites 2023, 13, 565. [Google Scholar] [CrossRef] [PubMed]
- Laousy, O.; Chassagnon, G.; Oyallon, E.; Paragios, N.; Revel, M.P.; Vakalopoulou, M. Deep reinforcement learning for l3 slice localization in sarcopenia assessment. In Proceedings of the Machine Learning in Medical Imaging: 12th International Workshop, MLMI 2021, Held in Conjunction with MICCAI 2021, Strasbourg, France, 27 September 2021; Proceedings 12. Springer: Cham, Switzerland, 2021; pp. 317–326. [Google Scholar]
- Teixeira, E.; Bohn, L.; Guimarães, J.P.; Marques-Aleixo, I. Portable digital monitoring system for sarcopenia screening and diagnosis. Geriatrics 2022, 7, 121. [Google Scholar] [CrossRef] [PubMed]
- Lee, S.H.; Gong, H.S. Measurement and interpretation of handgrip strength for research on sarcopenia and osteoporosis. J. Bone Metab. 2020, 27, 85. [Google Scholar] [CrossRef]
- Chen, L.K.; Woo, J.; Assantachai, P.; Auyeung, T.W.; Chou, M.Y.; Iijima, K.; Jang, H.C.; Kang, L.; Kim, M.; Kim, S.; et al. Asian Working Group for Sarcopenia: 2019 consensus update on sarcopenia diagnosis and treatment. J. Am. Med. Dir. Assoc. 2020, 21, 300–307. [Google Scholar] [CrossRef]
- Kim, S.; Kim, M.; Won, C.W. Validation of the Korean version of the SARC-F questionnaire to assess sarcopenia: Korean frailty and aging cohort study. J. Am. Med. Dir. Assoc. 2018, 19, 40–45. [Google Scholar] [CrossRef]
- Perez-Sousa, M.A.; Venegas-Sanabria, L.C.; Chavarro-Carvajal, D.A.; Cano-Gutierrez, C.A.; Izquierdo, M.; Correa-Bautista, J.E.; Ramírez-Vélez, R. Gait speed as a mediator of the effect of sarcopenia on dependency in activities of daily living. J. Cachexia Sarcopenia Muscle 2019, 10, 1009–1015. [Google Scholar] [CrossRef]
- Kostka, J.; Sosowska, N.; Guligowska, A.; Kostka, T. A proposed method of converting gait speed and TUG test in older subjects. Int. J. Environ. Res. Public Health 2022, 19, 12145. [Google Scholar] [CrossRef]
- Seok, M.; Kim, W.; Kim, J. Machine learning for sarcopenia prediction in the elderly using socioeconomic, infrastructure, and quality-of-life data. Healthcare 2023, 11, 2881. [Google Scholar] [CrossRef]
- Lee, J.; Choi, Y.; Yoon, Y. Genetic algorithm-based feature selection for machine learning system diagnosing sarcopenia with survey data. In Proceedings of the Companion Conference on Genetic and Evolutionary Computation, Lisbon, Portugal, 15–19 July 2023; pp. 71–72. [Google Scholar]
- Bohannon, R.W. Grip strength: An indispensable biomarker for older adults. Clin. Interv. Aging 2019, 14, 1681–1691. [Google Scholar] [CrossRef]
- Sousa-Santos, A.; Amaral, T. Differences in handgrip strength protocols to identify sarcopenia and frailty—A systematic review. BMC Geriatr. 2017, 17, 238. [Google Scholar] [CrossRef]
- Blanquet, M.; Ducher, G.; Sauvage, A.; Dadet, S.; Guiyedi, V.; Farigon, N.; Guiguet-Auclair, C.; Berland, P.; Bohatier, J.; Boirie, Y.; et al. Handgrip strength as a valid practical tool to screen early-onset sarcopenia in acute care wards: A first evaluation. Eur. J. Clin. Nutr. 2022, 76, 56–64. [Google Scholar] [CrossRef]
- Verstraeten, L.M.; de Haan, N.J.; Verbeet, E.; van Wijngaarden, J.P.; Meskers, C.G.; Maier, A.B. Handgrip strength rather than chair stand test should be used to diagnose sarcopenia in geriatric rehabilitation inpatients: REStORing health of acutely unwell adulTs (RESORT). Age Ageing 2022, 51, afac242. [Google Scholar] [CrossRef]
- Zebari, R.; Abdulazeez, A.; Zeebaree, D.; Zebari, D.; Saeed, J. A comprehensive review of dimensionality reduction techniques for feature selection and feature extraction. J. Appl. Sci. Technol. Trends 2020, 1, 56–70. [Google Scholar] [CrossRef]
- Guyon, I.; Elisseeff, A. An introduction to variable and feature selection. J. Mach. Learn. Res. 2003, 3, 1157–1182. [Google Scholar]
- Li, J.; Cheng, K.; Wang, S.; Morstatter, F.; Trevino, R.P.; Tang, J.; Liu, H. Feature selection: A data perspective. ACM Comput. Surv. (CSUR) 2017, 50, 1–45. [Google Scholar] [CrossRef]
- Yusta, S.C. Different metaheuristic strategies to solve the feature selection problem. Pattern Recognit. Lett. 2009, 30, 525–534. [Google Scholar] [CrossRef]
- Diao, R.; Shen, Q. Nature inspired feature selection meta-heuristics. Artif. Intell. Rev. 2015, 44, 311–340. [Google Scholar] [CrossRef]
- Diao, R.; Shen, Q. Feature selection with harmony search. IEEE Trans. Syst. Man Cybern. Part B (Cybern.) 2012, 42, 1509–1523. [Google Scholar] [CrossRef]
- Kumar, R.A.; Franklin, J.V.; Koppula, N. A comprehensive survey on metaheuristic algorithm for feature selection techniques. Mater. Today Proc. 2022, 64, 435–441. [Google Scholar] [CrossRef]
- Mitchell, M. An Introduction to Genetic Algorithms; MIT Press: Cambridge, MA, USA, 1998. [Google Scholar]
- Lambora, A.; Gupta, K.; Chopra, K. Genetic algorithm—A literature review. In Proceedings of the 2019 International Conference on Machine Learning, Big Data, Cloud and Parallel Computing (COMITCon), Faridabad, India, 14–16 February 2019; pp. 380–384. [Google Scholar]
- Panchal, G.; Panchal, D. Solving NP hard problems using genetic algorithm. Int. J. Comput. Sci. Inf. Technol. 2015, 6, 1824–1827. [Google Scholar]
- Montazeri, M.; Montazeri, M.; Naji, H.R.; Faraahi, A. A novel memetic feature selection algorithm. In Proceedings of the 5th Conference on Information and Knowledge Technology, Shiraz, Iran, 28–30 May 2013; pp. 295–300. [Google Scholar]
- Whitley, D. A genetic algorithm tutorial. Stat. Comput. 1994, 4, 65–85. [Google Scholar] [CrossRef]
- Srinivas, M.; Patnaik, L.M. Adaptive probabilities of crossover and mutation in genetic algorithms. IEEE Trans. Syst. Man Cybern. 1994, 24, 656–667. [Google Scholar] [CrossRef]
- Geem, Z.W.; Kim, J.H.; Loganathan, G.V. A new heuristic optimization algorithm: Harmony search. Simulation 2001, 76, 60–68. [Google Scholar] [CrossRef]
- Yang, X.S. Harmony Search as a Metaheuristic Algorithm. In Music-Inspired Harmony Search Algorithm: Theory and Applications; Springer: Berlin/Heidelberg, Germany, 2009; pp. 1–14. [Google Scholar]
- Leung, C.K.; Joseph, K.W. Sports data mining: Predicting results for the college football games. Procedia Comput. Sci. 2014, 35, 710–719. [Google Scholar] [CrossRef]
- Alia, O.M.; Mandava, R. The variants of the harmony search algorithm: An overview. Artif. Intell. Rev. 2011, 36, 49–68. [Google Scholar] [CrossRef]
- Gholami, J.; Pourpanah, F.; Wang, X. Feature selection based on improved binary global harmony search for data classification. Appl. Soft Comput. 2020, 93, 106402. [Google Scholar] [CrossRef]
- Yoo, J.I.; Choi, H.; Ha, Y.C. Mean hand grip strength and cut-off value for sarcopenia in Korean adults using KNHANES VI. J. Korean Med. Sci. 2017, 32, 868–872. [Google Scholar] [CrossRef]
- Hall, M.; Frank, E.; Holmes, G.; Pfahringer, B.; Reutemann, P.; Witten, I.H. The WEKA data mining software: An update. ACM SIGKDD Explor. Newsl. 2009, 11, 10–18. [Google Scholar] [CrossRef]
- Taheri, S.; Mammadov, M. Learning the naive Bayes classifier with optimization models. Int. J. Appl. Math. Comput. Sci. 2013, 23, 787–795. [Google Scholar] [CrossRef]
- Koch, P.; Golovidov, O.; Gardner, S.; Wujek, B.; Griffin, J.; Xu, Y. Autotune: A derivative-free optimization framework for hyperparameter tuning. In Proceedings of the 24th ACM SIGKDD International Conference on Knowledge Discovery & Data Mining, London, UK, 19–23 August 2018; pp. 443–452. [Google Scholar]
- Passos, D.; Mishra, P. A tutorial on automatic hyperparameter tuning of deep spectral modelling for regression and classification tasks. Chemom. Intell. Lab. Syst. 2022, 223, 104520. [Google Scholar] [CrossRef]
- Andre, J.; Siarry, P.; Dognon, T. An improvement of the standard genetic algorithm fighting premature convergence in continuous optimization. Adv. Eng. Softw. 2001, 32, 49–60. [Google Scholar] [CrossRef]
- Hall, M.A. Correlation-Based Feature Selection for Machine Learning. Ph.D. Thesis, The University of Waikato, Hamilton, New Zealand, 1999. [Google Scholar]
- Azhagusundari, B.; Thanamani, A.S. Feature selection based on information gain. Int. J. Innov. Technol. Explor. Eng. (IJITEE) 2013, 2, 18–21. [Google Scholar]
- Kora, P.; Yadlapalli, P. Crossover operators in genetic algorithms: A review. Int. J. Comput. Appl. 2017, 162, 34–36. [Google Scholar] [CrossRef]
- Kira, K.; Rendell, L.A. A practical approach to feature selection. In Machine Learning Proceedings 1992; Elsevier: Amsterdam, The Netherlands, 1992; pp. 249–256. [Google Scholar]
- Hassanat, A.; Almohammadi, K.; Alkafaween, E.; Abunawas, E.; Hammouri, A.; Prasath, V.S. Choosing mutation and crossover ratios for genetic algorithms—A review with a new dynamic approach. Information 2019, 10, 390. [Google Scholar] [CrossRef]
- Grote, T.; Berens, P. On the ethics of algorithmic decision-making in healthcare. J. Med. Ethics 2020, 46, 205–211. [Google Scholar] [CrossRef]
- Heyen, N.B.; Salloch, S. The ethics of machine learning-based clinical decision support: An analysis through the lens of professionalisation theory. BMC Med. Ethics 2021, 22, 112. [Google Scholar] [CrossRef]
- Ahsan, M.M.; Luna, S.A.; Siddique, Z. Machine-learning-based disease diagnosis: A comprehensive review. Healthcare 2022, 10, 541. [Google Scholar] [CrossRef]
- Alufaisan, Y.; Marusich, L.R.; Bakdash, J.Z.; Zhou, Y.; Kantarcioglu, M. Does explainable artificial intelligence improve human decision-making? In Proceedings of the AAAI Conference on Artificial Intelligence, Virtually, 2–9 February 2021; Volume 35, pp. 6618–6626. [Google Scholar]
- Ghassemi, M.; Oakden-Rayner, L.; Beam, A.L. The false hope of current approaches to explainable artificial intelligence in health care. Lancet Digit. Health 2021, 3, e745–e750. [Google Scholar] [CrossRef]
- Dokeroglu, T.; Deniz, A.; Kiziloz, H.E. A comprehensive survey on recent metaheuristics for feature selection. Neurocomputing 2022, 494, 269–296. [Google Scholar] [CrossRef]
- Lundberg, S.M.; Lee, S.I. A Unified Approach to Interpreting Model Predictions. In Proceedings of the Advances in Neural Information Processing Systems, Long Beach, CA, USA, 4–9 December 2017; Curran Associates, Inc.: New York, NY, USA, 2017; Volume 30. [Google Scholar]
- Zacharias, J.; von Zahn, M.; Chen, J.; Hinz, O. Designing a feature selection method based on explainable artificial intelligence. Electron. Mark. 2022, 32, 2159–2184. [Google Scholar] [CrossRef]


| Data | Sarcopenia | Normal | Total |
|---|---|---|---|
| Training set | 2051 | 3139 | 5190 |
| Test set | 513 | 785 | 1298 |
| Total | 2564 | 3924 | 6488 |
| Parameter | Value |
|---|---|
| Population | 30 |
| Mutation rate | 0.01 |
| Parent selection rate | 0.5 |
| Parameter | Value |
|---|---|
| HMS | 30 |
| HMCR | 0.85 |
| PAR | 0.7 |
| Parameter | Value |
|---|---|
| 0.7 | |
| 1.0 | |
| 0.001 | |
| 0.1 |
| Dataset | J48 | RandomForest | SMO | NaiveBayes | Selected Features | Time Costs(s) | |||||||||
|---|---|---|---|---|---|---|---|---|---|---|---|---|---|---|---|
| Accuracy | Weighted F1 | AUC | Accuracy | Weighted F1 | AUC | Accuracy | Weighted F1 | AUC | Accuracy | Weighted F1 | AUC | ||||
| GA | 100 | 0.728 | 0.722 | 0.705 | 0.742 | 0.729 | 0.808 | 0.760 | 0.757 | 0.740 | 0.718 | 0.718 | 0.777 | 327.0 | 145.34 |
| 500 | 0.722 | 0.715 | 0.692 | 0.733 | 0.717 | 0.794 | 0.752 | 0.748 | 0.729 | 0.722 | 0.717 | 0.770 | 181.0 | 469.01 | |
| 1000 | 0.700 | 0.683 | 0.674 | 0.729 | 0.708 | 0.800 | 0.742 | 0.737 | 0.717 | 0.715 | 0.713 | 0.761 | 277.2 | 951.81 | |
| HS | 1000 | 0.728 | 0.722 | 0.705 | 0.750 | 0.736 | 0.822 | 0.773 | 0.770 | 0.752 | 0.743 | 0.738 | 0.803 | 250.0 | 207.67 |
| 5000 | 0.728 | 0.722 | 0.706 | 0.748 | 0.733 | 0.830 | 0.784 | 0.781 | 0.764 | 0.754 | 0.748 | 0.808 | 238.0 | 848.32 | |
| 10,000 | 0.727 | 0.721 | 0.705 | 0.746 | 0.730 | 0.824 | 0.785 | 0.782 | 0.765 | 0.749 | 0.744 | 0.807 | 233.8 | 1560.57 | |
| CFS | 0.705 | 0.695 | 0.706 | 0.728 | 0.721 | 0.781 | 0.731 | 0.720 | 0.694 | 0.713 | 0.714 | 0.780 | 18.0 | 3.82 | |
| IG | 0.711 | 0.704 | 0.682 | 0.746 | 0.737 | 0.818 | 0.747 | 0.742 | 0.721 | 0.715 | 0.716 | 0.773 | 94.0 | 1.72 | |
| Original | 0.728 | 0.721 | 0.706 | 0.743 | 0.728 | 0.813 | 0.760 | 0.760 | 0.750 | 0.701 | 0.704 | 0.773 | 778.0 | - | |
| Dataset | J48 | RandomForest | SMO | NaiveBayes | |||||||||
|---|---|---|---|---|---|---|---|---|---|---|---|---|---|
| Accuracy | Weighted F1 | AUC | Accuracy | Weighted F1 | AUC | Accuracy | Weighted F1 | AUC | Accuracy | Weighted F1 | AUC | ||
| Dynamic HMCR | 100 | 0.727 | 0.720 | 0.705 | 0.753 | 0.739 | 0.822 | 0.768 | 0.765 | 0.748 | 0.740 | 0.736 | 0.795 |
| 500 | 0.729 | 0.722 | 0.707 | 0.746 | 0.732 | 0.829 | 0.777 | 0.775 | 0.759 | 0.749 | 0.744 | 0.806 | |
| 1000 | 0.726 | 0.720 | 0.704 | 0.746 | 0.729 | 0.827 | 0.783 | 0.781 | 0.766 | 0.751 | 0.747 | 0.808 | |
| HMCR = 0.7 | 1000 | 0.729 | 0.723 | 0.707 | 0.746 | 0.734 | 0.815 | 0.782 | 0.777 | 0.758 | 0.740 | 0.734 | 0.797 |
| 5000 | 0.728 | 0.722 | 0.705 | 0.748 | 0.735 | 0.823 | 0.780 | 0.776 | 0.711 | 0.747 | 0.741 | 0.805 | |
| 10,000 | 0.727 | 0.719 | 0.707 | 0.754 | 0.743 | 0.826 | 0.778 | 0.774 | 0.753 | 0.745 | 0.739 | 0.807 | |
| HMCR = 0.85 | 1000 | 0.728 | 0.722 | 0.705 | 0.750 | 0.736 | 0.822 | 0.773 | 0.770 | 0.752 | 0.743 | 0.738 | 0.803 |
| 5000 | 0.728 | 0.722 | 0.706 | 0.748 | 0.733 | 0.830 | 0.784 | 0.781 | 0.764 | 0.754 | 0.748 | 0.808 | |
| 10,000 | 0.727 | 0.721 | 0.705 | 0.746 | 0.730 | 0.824 | 0.785 | 0.782 | 0.765 | 0.749 | 0.744 | 0.807 | |
| Dataset | J48 | RandomForest | SMO | NaiveBayes | |||||||||
|---|---|---|---|---|---|---|---|---|---|---|---|---|---|
| Accuracy | Weighted F1 | AUC | Accuracy | Weighted F1 | AUC | Accuracy | Weighted F1 | AUC | Accuracy | Weighted F1 | AUC | ||
| Dynamic mutation rate | 100 | 0.727 | 0.721 | 0.706 | 0.742 | 0.728 | 0.808 | 0.774 | 0.771 | 0.753 | 0.718 | 0.718 | 0.774 |
| 500 | 0.729 | 0.723 | 0.707 | 0.747 | 0.734 | 0.814 | 0.749 | 0.747 | 0.732 | 0.714 | 0.715 | 0.775 | |
| 1000 | 0.726 | 0.719 | 0.703 | 0.744 | 0.730 | 0.803 | 0.760 | 0.756 | 0.737 | 0.717 | 0.717 | 0.777 | |
| Mutation rate = 0.1 | 100 | 0.721 | 0.712 | 0.693 | 0.733 | 0.719 | 0.800 | 0.769 | 0.765 | 0.745 | 0.720 | 0.718 | 0.777 |
| 500 | 0.726 | 0.720 | 0.701 | 0.741 | 0.726 | 0.809 | 0.769 | 0.761 | 0.743 | 0.721 | 0.719 | 0.775 | |
| 1000 | 0.728 | 0.721 | 0.705 | 0.746 | 0.733 | 0.812 | 0.769 | 0.766 | 0.749 | 0.729 | 0.727 | 0.779 | |
| Mutation rate = 0.01 | 100 | 0.728 | 0.722 | 0.705 | 0.742 | 0.729 | 0.808 | 0.760 | 0.757 | 0.740 | 0.718 | 0.718 | 0.777 |
| 500 | 0.722 | 0.715 | 0.692 | 0.733 | 0.717 | 0.794 | 0.752 | 0.748 | 0.729 | 0.722 | 0.717 | 0.770 | |
| 1000 | 0.700 | 0.683 | 0.674 | 0.729 | 0.708 | 0.800 | 0.742 | 0.737 | 0.717 | 0.715 | 0.713 | 0.761 | |
| Mutation rate = 0.001 | 100 | 0.727 | 0.721 | 0.703 | 0.743 | 0.728 | 0.808 | 0.759 | 0.757 | 0.741 | 0.714 | 0.715 | 0.771 |
| 500 | 0.726 | 0.719 | 0.700 | 0.738 | 0.724 | 0.801 | 0.741 | 0.739 | 0.724 | 0.718 | 0.718 | 0.770 | |
| 1000 | 0.726 | 0.719 | 0.699 | 0.741 | 0.727 | 0.809 | 0.750 | 0.748 | 0.731 | 0.726 | 0.725 | 0.778 | |
Disclaimer/Publisher’s Note: The statements, opinions and data contained in all publications are solely those of the individual author(s) and contributor(s) and not of MDPI and/or the editor(s). MDPI and/or the editor(s) disclaim responsibility for any injury to people or property resulting from any ideas, methods, instructions or products referred to in the content. |
© 2024 by the authors. Licensee MDPI, Basel, Switzerland. This article is an open access article distributed under the terms and conditions of the Creative Commons Attribution (CC BY) license (https://creativecommons.org/licenses/by/4.0/).
Share and Cite
Lee, J.; Yoon, Y.; Kim, J.; Kim, Y.-H. Metaheuristic-Based Feature Selection Methods for Diagnosing Sarcopenia with Machine Learning Algorithms. Biomimetics 2024, 9, 179. https://doi.org/10.3390/biomimetics9030179
Lee J, Yoon Y, Kim J, Kim Y-H. Metaheuristic-Based Feature Selection Methods for Diagnosing Sarcopenia with Machine Learning Algorithms. Biomimetics. 2024; 9(3):179. https://doi.org/10.3390/biomimetics9030179
Chicago/Turabian StyleLee, Jaehyeong, Yourim Yoon, Jiyoun Kim, and Yong-Hyuk Kim. 2024. "Metaheuristic-Based Feature Selection Methods for Diagnosing Sarcopenia with Machine Learning Algorithms" Biomimetics 9, no. 3: 179. https://doi.org/10.3390/biomimetics9030179