
The Pine Cone Optimization Algorithm (PCOA)


Department of Water Engineering and Hydraulics Structures, Faculty of Civil Engineering, Semnan University, Semnan 35131-19111, Iran
*
Author to whom correspondence should be addressed.
Biomimetics 2024, 9(2), 91; https://doi.org/10.3390/biomimetics9020091
Submission received: 21 December 2023
/
Revised: 26 January 2024
/
Accepted: 29 January 2024
/
Published: 1 February 2024
(This article belongs to the Special Issue Plant-Based Algorithm)
Abstract
:The present study introduces a novel nature-inspired optimizer called the Pine Cone Optimization algorithm (PCOA) for solving science and engineering problems. PCOA is designed based on the different mechanisms of pine tree reproduction, including pollination and pine cone dispersal by gravity and animals. It employs new and powerful operators to simulate the mentioned mechanisms. The performance of PCOA is analyzed using classic benchmark functions, CEC017 and CEC2019 as mathematical problems and CEC2006 and CEC2011 as engineering design problems. In terms of accuracy, the results show the superiority of PCOA to well-known algorithms (PSO, DE, and WOA) and new algorithms (AVOA, RW_GWO, HHO, and GBO). The results of PCOA are competitive with state-of-the-art algorithms (LSHADE and EBOwithCMAR). In terms of convergence speed and time complexity, the results of PCOA are reasonable. According to the Friedman test, PCOA’s rank is 1.68 and 9.42 percent better than EBOwithCMAR (second-best algorithm) and LSHADE (third-best algorithm), respectively. The authors recommend PCOA for science, engineering, and industrial societies for solving complex optimization problems.
1. Introduction
Nature-inspired optimization algorithms refer to the new optimization methods designed based on natural phenomena. These algorithms can solve optimization problems without the need to calculate the gradient of the objective function. Hence, nature-inspired optimization algorithms can solve non-derivative optimization problems. Nature-inspired optimization algorithms are flexible and can handle many constraints and decision variables. In contrast, the computation times of numeric optimization methods increase exponentially with the number of constraints and decision variables. Thanks to the design and development of nature-inspired algorithms, it is possible to solve complex problems that have not been solved so far. Although many nature-based algorithms have been proposed, new algorithms are still being developed due to the “no free lunch in search and optimization” theory [1]. According to this theory, each optimization algorithm can solve some optimization problems. Some problems still need to be solved, and new nature-inspired optimization algorithms can solve them with better accuracy. Researchers divide these algorithms into six categories based on the type of idea that inspires them: evolutionary, swarm-based, mathematical-based, physics and chemistry-based, sport-based, and human-based. Evolutionary algorithms are based on the principle of natural evolution. They begin by creating a random population, which then evolves through selection, crossover, and mutation operations. The most popular evolutionary algorithms are Genetic Algorithm (GA) (developed in 1975) [2]; Differential Evolution (DE) (developed in 1997) [3]; Harmony Search (HS) (developed in 2001) [4]; Black Widow Optimization Algorithm (BWO) (developed in 2020) [5]; Learner Performance Based Behavior algorithm (LPB) (developed in 2021) [6]; Evolutionary Mating Algorithm, based on the adoption of the random mating concept from the Hardy–Weinberg equilibrium and crossover index [7]; and One-Dimensional Subspaces Optimization Algorithm (1D-SOA) [8]. Although evolutionary algorithms have seen successful application in some problems, these algorithms slowly converge to the optimal solutions and become stuck in local optima. Swarm-inspired algorithms are another type of nature-inspired algorithms. These algorithms are designed based on the moving methods of swarms. The most popular swarm-based algorithm is the Particle Swarm Optimization algorithm (PSO) (developed in 1995) [9]. Moving swarms of birds or fish inspire the search processing in PSO. Researchers introduced the Artificial Bee Colony (ABC) in 2007 [10], Firefly Algorithm (FA) [11] in 2008, Bat Optimization Algorithm (BA) in 2012 [12], Krill-Herd Algorithm (KHA) in 2012 [13], Gray Wolf Optimizer (GWO) in 2014 [14], Whale Optimization Algorithm (WOA) in 2016 [15], Harris Hawks Optimization Algorithm [16] in 2019, Coati Optimization Algorithm (COA) in 2023 [17], Dung Beetle Optimizer (DBO) in 2023 [18], Kookaburra Optimization Algorithm (KOA) in 2023 [19], Giant Armadillo Optimization (GAO) in 2023 [20], Lyrebird Optimization Algorithm (LOA) in 2023 [21], and Humboldt Squid Optimization Algorithm (HSOA) in 2023 [22]. In this category, algorithms such as PSO have poor local optimization ability. The bat algorithm has yet to establish a good balance between global and local search ability. KH has two main limitations: stagnation in local optima and a slow convergence speed. GWO and WOA use adaptive weights to control the search scope and balance global and local search capabilities. However, the global search ability of these algorithms is weak. The other types of nature-inspired optimization algorithms are physics and chemistry-based algorithms. These algorithms are designed based on the laws of physics or chemistry. Some of the well-known algorithms in this category include Central Force Optimization (CFO) (developed in 2008) [23], Charged System Search (CSS) Optimization Algorithm (developed in 2010) [24], Artificial Chemical Reaction Optimization Algorithm (ACROA) (developed in 2011) [25], Multi-Verse Optimizer (MVO) (developed in 2016) [26], Flow Direction Algorithm (FDA) (developed in 2021) [27], and Rime Optimization Algorithm (RIME) (developed in 2023) [28]. Certain optimization problems may pose challenges for physics and chemistry-based algorithms. In particular, ACROA may suffer from slow convergence as a result of unbalanced local and global searches, while MVO may lack diversity, resulting in trapping and premature convergence. Human-based optimization algorithms are another category of nature-inspired optimization algorithms. These algorithms work based on human-based phenomena. In 1989, Tabu Search (TS) was developed, using the mechanics of human memory [29]. The other well-known algorithms in this category consist of the Poor and Rich Optimization (PRO) algorithm (developed in 2019) [30], Coronavirus Herd Immunity Optimizer (CHIO) (developed in 2019) [31], Incomprehensible but Intelligible-in-Time Logics: Theory and Optimization Algorithm (ILA) (developed in 2023) [32], Technical and Vocational Education and Training-Based Optimizer (TVETBO) (developed in 2023) [33], and Human Memory Optimization (HMO) (developed in 2024) [34]. The category of sport-based algorithms includes optimization algorithms that are motivated by sports methods. The best known of these algorithms are Tug of War Optimization (TWO) (developed in 2017) [35], Football Game Based Optimization (FGBO) (developed in 2020) [36], and Athletic Run Based Optimization (ARBO) (developed in 2021) [37]. Efforts to develop and create new optimization algorithms are still ongoing. In this regard, researchers developed the Polar Bear Optimization Algorithm [38]; a modified Whale Optimization Algorithm, based on different searching paths and perceptual disturbance [39]; an Improved Butterfly Optimization Algorithm, based on the cross-entropy method [40]; and an improved Chaotic Particle Swarm Optimization Algorithm, with a more symmetric distribution [41]. Figure 1 shows nature-inspired optimization algorithms in the different categories.
Although researchers have studied various natural phenomena to design nature-based algorithms, phenomena related to the life of plants, despite their high potential for designing nature-based algorithms, have received less attention. The studies in this field are reviewed in the following section. Researchers developed the Invasive Weed Optimization (IWO) algorithm in 2006, based on colonizing weeds [42]. IWO selects better fitness seeds and distributes them in a search space. It uses normal-distribution random numbers with a large standard deviation in the exploration phase and decreases the standard deviation in the exploitation phase. IWO uses adaptive standard deviation but does not share information between seeds. The Flower Pollination Algorithm was introduced in 2012. The pollination mechanism of flowers inspires this algorithm [43]. FPA uses Levy flight to balance exploration and exploitation. It updates the position of pollen based on the best position, the current position, and Levy distribution. When exploiting, it updates the position by randomly choosing two pollen grains and generating a random number. It does not use dispersing seeds and assumes an equal chance for exploration and exploitation. In 2015, the Tree Seed Algorithm (TSA) was motivated by the relationship between trees and their seeds for continuous optimization [44]. TSA uses the best tree and seed positions as selection operators. TSA generates multiple seeds around the current and a random tree during exploration. During exploitation, TSA generates numerous seeds around the tree based on the best position of all trees, a random tree, and the current position of the tree. TSA uses the wind impact to disperse seeds but does not involve animals, pollination, or Levy flight. Researchers in 2018 developed the Tree Growth Algorithm (TGA) based on the competition among trees for acquiring light and food [45]. TGA categorizes trees into four fitness groups and uses different methods for exploration and exploitation. It balances exploration and exploitation but does not use dispersing seed strategies, a pollination process, or Levy flight. In 2022, the Trees Social Relations Optimization Algorithm was inspired by the hierarchical and collective life of trees in the jungle [46]. This algorithm has advantages, such as dividing the search domain into sub-clusters. However, it does not incorporate pollination mechanisms or the roles of animals in seed dispersal. In 2023, researchers proposed the Orchard Algorithm (OA), based on the fruit gardening process [47]. This algorithm used a neighborhood search. However, it does not use clustering search space, pollination mechanisms, or dispersing seeds. The Tree Optimization Algorithm (TOA) was created by [48] in 2023. The growth of trees inspired this algorithm. However, TOA does not consider reproduction methods for one tree.
To the best of the authors’ knowledge, previous research on nature-inspired optimization algorithms has given less attention to the excellent life potential of plants, particularly their reproductive methods. While there have been some studies on developing nature-based algorithms, little work has been performed on exploring the different aspects of tree reproduction. As a result, this study introduces a new algorithm named the Pine Cone Optimization Algorithm (PCOA), which is based on the unique reproductive strategies of pine trees. These strategies have enabled the pine species to survive for millions of years, and simulating them in developing PCOA could offer solutions to scientific and engineering issues. The new contributions of this study are as follows:
- Considering different pollination mechanisms for simulating the impact of wind on pine tree pollination.
- Considering the impacts of animals and gravity on pine cone dispersal using new operators.
- Clustering the search domain to sub-cluster and search in each of them in parallel.
- Shrinking the search domain over course generations.
- Using both swarm-based and evolutionary operators in updating solutions to the PCOA.
PCOA is set apart from other existing algorithms due to these contributions. The remainder of the paper is structured as follows: Section 2 describes the pine tree’s reproduction methods, introduces the PCOA theory and its structure and flowchart, and discusses the mathematical and engineering problems. Section 3 presents the accuracy, convergence efficacy, and time complexity of PCOA in classic and new mathematical benchmark functions and engineering problems. Lastly, Section 4 presents the conclusions and future scope.
2. Materials and Methods
2.1. Inspiration: The Life Cycle of the Pine Tree
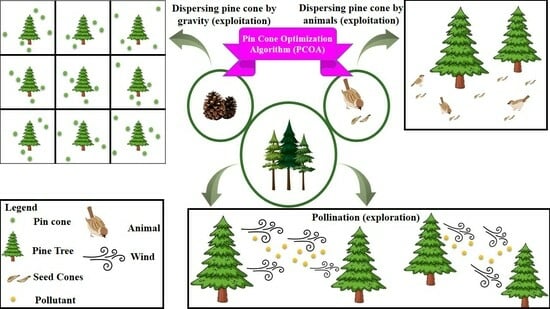
Pines are coniferous trees in the Pinus family of the Pinaceae, which grow in a wide range of ecosystems. They grow to 50 m in height with dark green needles and 5–10 cm cones with rounded scales [49]. Some pines, like Scotch pine, are monoecious because they have female and male flowers on the same tree. Tree shoots have male flowers at their base. The wind pollinates female flowers in the early summer. The female flower develops into small cones that quickly grow and reach full size by early summer after more than a year. Then, gravity causes the cones to break away and fall to the ground, or animals eat them and disperse the seeds in spring. Eventually, the seeds turn into saplings, and new trees arise. Plants like the pine tree are pollinated only by the wind and, unlike other plants, insects do not affect their pollination [50,51]. Figure 2 shows the life cycle of pine trees and pine tree swarms in the forest.
2.2. Mathematical Modeling of Pine Reproduction
The pollination and dispersal of cone seeds is a critical phase of the life cycle of pine trees. Therefore, the present study focuses only on considering the pollination and dispersion of cones. In PCOA, gravity and animals scatter the cones, just like in nature. Continuing with the study, we mathematically express the PCOA, considering the pollination and scattering of cones through gravity and animals. According to previous studies, pine tree reproduction is significantly dependent on pollination [52], and dispersion of cone seeds by gravity [53] and animals [54]. Pollination in a pine tree is similar to solving an optimization problem in two aspects. In one aspect, the movement of pollen particles between cones of pine trees can be simulated by a swarm-based operator. In this case, pollen particles move driven by the wind. The atmosphere of the forest is the search space for problems, and the pollen particles are the search agents. Each particle has a position and objective function in the search space of the optimization problem. The movement of pollen particles from one pine tree cone to another is similar to searching for the optimal solution in the problem’s search space. In another aspect, pollen particles enter the female flower of the pine tree and cause the female flower to develop and create small cones. Therefore, this process can be simulated by evolutionary operators. The evolution of the pine cone from one state to another is similar to improving the problem solution and finding its optimal solution. The scattering of pine cone seeds by gravity and animals causes the creation and growth of pine seedlings in new situations. If the position of the seedling is suitable, it will become a pine tree. Similarly, in the PCOA, the answers are updated if a better position is found. The pine tree forest is equivalent to the problem search space, and the pine cone seeds are the search agents. Population-based operators can be used to simulate the dispersion of pine cone seeds by gravity or animals. Hence, population-based and evolutionary-based operators can simulate the mentioned biological principles and solve optimization problems. In this regard, the position of the pollen, seeds of cones, and pine trees are the search agents, and the best position for growing the pine tree is the global optimal problem.
2.3. Generating the Initial Population in PCOA
The PCOA has two populations: pine trees and their cones. The problem domain is divided into equal segments. In the algorithm initialization, there is a tree in the center of each segment, and multiple cones are generated around each tree. For this purpose, the boundary conditions for each part are given by
In Equations (1) and (2), and are the lower and upper bounds of the problem’s domain, and and are each segment’s lower and upper bounds. The pine cone population is generated as follows:
In Equation (3), is the pine cone position, is a random vector with a normal distribution between 0 and 1, and is a random number with a normal distribution between 0 and 1. In operators of PCOA, i indicates the pine tree index and j shows the cone index. After initializing PCOA, the position of each tree is equal to the position of the best cone in that segment.
2.4. Pine Cone Dispersal by Gravity (Exploitation)
When the pine cones mature and their weight increases, gravity causes the pine cones to fall from the tree. The issue causes the cones to disperse in a limited area. The search space problem is divided into multiple super-cubes to simulate this process. Each of these super-cubes contains a tree inside. In order to accurately simulate the impact of gravitational forces on the dispersion of cones in the vicinity of trees, it is necessary to generate multiple solutions around each tree. In order to accomplish this objective, the following operator is utilized.
In Equation (4), is the new position of the pine cone, is the updated position of the pine cone, is the position of the tree, is the upper bound of the super-cube, is the lower bound of the super-cube, is a randomly selected solution in the memory of PCOA, is the ith of the top solutions of PCOA, is an adaptive weight, r1 is a random integer number between 1 and the size of the PCOA memory, and and are normal random numbers between 0 and 1. In the operators of PCOA, i shows the pine tree index, and j indicates the cone index. The boundaries of the problem ( and ), and , shrink over the generations. In this approach, the research space is restricted to the closing area in the best surrounding position over the generations. This approach enables the PCOA to balance exploration and exploitation. To achieve this, we define the following equations:
In Equations (5)–(11), the algorithm updates the boundaries of the problem, and . It also determines the shrinking radius with and . The adaptive weight W decreases from 1 to 0.5. represents the current best position. signifies the current generation, with denoting the maximum number of generations.
2.5. Pollination (Exploration)
In pollinating pine trees, the agents are produced from male cones and drift to female cones. This movement can occur from one tree’s cones to those of another or within the same tree. As this movement is very complicated, it is possible to define different mechanisms to simulate it. In PCOA, two different methods are defined to mimic this motion. In the first method, Algorithm 1 is used to simulate wind pollination. In the second method, wind pollination is simulated according to the study by [55]. This method is formulated as follows:
In Equation (12), is the chance of successful pollination of pine cones. is calculated as follows:
In Equations (13) and (14), is the effect of the ith cone on the jth cone, and is the Euclidian distance between the ith cone and jth cone. In addition, , , and are constant parameters that define the pollination process mathematically. According to the conducted study by [55], the values of , , and are set to 3, 40, and 0.62, respectively.
| Algorithm 1 Pollination |
| Input: Pollination cycle (), cones position (), cones fitness () |
| Output: Pine Cone’s position |
| Wind’s pollination: |
|
2.6. Pine Cone Dispersal by Animals (Exploitation)
Animals eat pine cones and disperse them in the environment. For example, in the fall, squirrels bury pine cones to eat later on [56]. Birds and other animals like bears, deer, rats, and mice eat pine cones. In the PCOA, four operators are defined to simulate these behaviors. In the first operator, it is assumed that animals like the squirrel carry pine cones from a random position to a position with a better condition for burial. This operator employs the quadratic programming optimization method to find the best location. The initial point in this method is defined as follows:
In Equation (15), is the initial position in quadratic programming, and is an average of all the pine cones’ positions. It should be noted that the quadratic programmatic search is performed under the updated boundary conditions of the problem. This approach allows the PCOA to approximate the global optimum better. The roles of animals in scattering pine cones are the basis for driving the second to fourth operators. The second operator is designed as follows:
In Equation (16), is known as the position of the pine cones carried by animals, a random number generated by the Levy distribution. In the third operator, it is assumed that animals carry pine cones from their position to near a tree’s position. The position of the pine cone is updated by the third operator as follows:
In Equation (17), is the average position of the pine trees, is an adaptive weight that is given by [57]:
limits the search domain over increasing function evaluations and leads to converting exploration into exploitation. The fourth operator assumes that an animal carries a pine cone in a nearer position:
In PCOA, exploitation falls under the responsibility of all four defined operators. Algorithm 2 illustrates how animals in PCOA disperse pine cones.
| Algorithm 2 Dispersing pine cone by animals |
| Input: |
| Input: , , , , and |
| Output: Pine Cone’s position |
| Dispersing pine cone by animals: |
|
2.7. Assigning Pine Cones to Each Tree
Each tree in PCOA has cones that are updated exclusively near it. This approach is used to simulate the scattering of pine cones by gravity. In the first generation, every tree has an equal number of cones. However, in later generations, each tree receives the cones that are closest to it. Since most solutions converge towards the best solution through increasing generations, pines with a better position have more cones. This issue balances exploration and exploitation and estimates the absolute optimum more accuracy.
2.8. Flowchart of PCOA
In the PCOA, first, the algorithm generates the initial population. Then, it updates this population using the operators of pine cone dispersal by gravity, wind pollination, and pine cone dispersal by animals. Gravity dispersal of the pine cones and animal dispersal of the pine cones handle exploitation, and wind pollination is associated with exploration. In addition, the adaptive weight and reduced boundary conditions help the PCOA to achieve a balance between exploration and exploitation. Figure 3 shows the flowchart of PCOA.
3. Experimental Research Settings
PCOA was evaluated using mathematical benchmark functions and engineering problems. The mathematical benchmark functions comprise 23 classic benchmark functions, 29 CEC-BC-2017 benchmark functions in 10, 30, 50, and 100 dimensions [58], and 10 CEC-C06 2019 benchmark functions [58]. The engineering problems include 6 CEC2006 and 17 CEC2011 problems [59]. PCOA and other algorithms were implemented using Matlab R2020b, executed on Windows 10, Intel Xeon 2.2 GHz CPU, and 40 G RAM. This study uses the following assumptions to evaluate PCOA and other competitors:
- In order to achieve a fair comparison of optimization algorithms, we set the maximum number of function evaluations () to the same value. for the classic benchmark functions, CEC2017, CEC2006, and CEC2011 is equal to 150,000, 10,000. [60], 15,000, and 150,000 [59], respectively. For CEC2019, the for first to tenth benchmark functions are equal to 90,000, 320,000, 1,800,000, 1,000,000, 100,000, 100,000, 1,000,000, 1,000,000, 1,000,000, and 600,000, respectively.
3.1. Mathematical Benchmark Functions
Sixty-two benchmark functions were employed to evaluate the performance of PCOA and the other investigated algorithms. The classic benchmark functions comprise seven unimodal (1 to 7), six multi-modal (8 to 13), and ten multi-modal fixed-dimension (14 to 23) functions. The CEC2017 test suite includes two unimodal (1 and 3), seven multi-modal (4–10), ten hybrid (11–20), and ten composite (21–30) benchmark functions. Because of the unstable behavior, the second CEC2017 benchmark function was removed. Algorithms with better performance in solving unimodal and multi-modal benchmark functions have more ability in exploration and exploitation. An algorithm with more accuracy in optimizing hybrid and composite functions has more ability to escape from local optima. The global optimum for CEC2017_01 and CEC2017_03–30 are 100, 300, 400, 500, 600, 700, 800, 900, 1000, 1100, 1200, 1300, 1400, 1500, 1600, 1700, 1800, 1900, 2000, 2100, 2200, 2300, 2400, 2500, 2600, 2700, 2800, 2900, and 3000, respectively. The global optima of the classic benchmark functions and CEC2019 and their characteristics are listed in Table A1 and Table A2 in the Appendix A.
3.2. Engineering Design Optimization Problems
The analysis of PCOA’s and its competitors’ performance in optimizing engineering design problems involved using twenty-three problems. CEC2006 comprises a tension/compression spring [61], gear train [27], speed reducer [62], and three models of a 25-bar truss [15]. CEC2011 contains constrained problems, and several linear and non-linear constraints increase their complexity. Therefore, using these problems shows the ability of PCOA to solve engineering problems. These problems comprise parameter estimation for frequency-modulated (FM) sound waves (CEC11_01); the Lennard–Jones potential problem (CEC11_02); optimal control of a non-linear stirred tank reactor (CEC11_03); the transmission network expansion planning (TNEP) problem (CEC11_04); the large-scale transmission pricing problem (CEC11_05); the circular antenna array design problem (CEC11_06); the static economic load dispatch (ELD) problem (CEC11_07); different models of dynamic economic dispatch (DED) problems (CEC11_08–12); different models of hydrothermal scheduling problems (CEC11_13–15); the messenger: spacecraft trajectory optimization problem (CEC11_16); and the Cassini 2: spacecraft trajectory optimization problem (CEC11_17). This study uses the Lagrangian method to handle the constrained CEC2006 and CEC2011 problems.
3.3. PCOA Competitors
In this study, a range of well-known, new, and state-of-the-art algorithms are chosen for comparative reference to demonstrate PCOA’s performance in relation to various algorithms. Among the well-known algorithms are PSO, DE, and WOA; AVOA, RW_GWO, HHO, and gradient-based optimizer (GBO) are new algorithms; and linear population size reduction (LSHADE) and Effective Butterfly Optimizer with Covariance Matrix Adapted Retreat Phase (EBOwithCMAR) represent state-of-the-art optimization algorithms.
3.4. PCOA Competitors’ Parameter Settings
Table 1 tabulates the parameter settings of PCOA’s competitors. The population size and maximum number of iterations for the investigated algorithms were selected so that was the same for them. In this table, the parameters of AVOA, RW_GWO, WOA, HHO, and GBO are fixed; no sensitivity analysis is needed. The parameters for PSO and DE are determined based on sensitivity analyses from previous studies [22,63], which had experimental settings similar to the present study. The parameters of LSHADE and EBOwithCMAR are determined by the sensitivity analyses in the studies of [63,64].
3.5. Analyzing the Influence of the PCOA Parameters
In this study, we analyzed the influence of the parameters of the proposed algorithm using a sensitivity analysis. The method for analyzing the influence of the PCOA parameters was as follows:
- To perform a sensitivity analysis on the PCOA, select one parameter (either N_Tree, N_Cone, N_Cycle, P1, or P2).
- Determine one value for the selected parameter.
- Execute the PCOA algorithm multiple times and compute the fitness function.
- If there is another value for the investigated parameters, go to step 3; otherwise, go to step 5.
- Normalize the obtained fitness function using the map min–max method as follows:In Equation (20), is the normalized fitness function for the jth parameter, is the average fitness function for the jth parameter in the nth random run. The value of n equals the number of random runs for each benchmark function or engineering problem set.
- Consider the parameter setting with a minimum as the desired value.
- If there is another parameter for sensitivity analysis, go to step 2. For each parameter, plot the sensitivity analysis results. The plot displays the minimum value of the fitness function as closest to zero (green color), whereas values closer to one (red color) indicate the maximum values.
3.6. Statistical Tests
Wilcoxon signed-rank and Friedman tests, as non-parametric tests, were employed to compare PCOA with the other investigated algorithms. The study conducted by [67] recommended the Wilcoxon signed-rank test for pair-wise comparisons. The Wilcoxon test returns the number of victories and defeats of one algorithm against the others. The Friedman test determines the algorithm’s mean rank and is used in many studies, such as [66,67].
4. Results
In this section, a sensitivity analysis of PCOA is carried out, and the best parameters of PCOA are reported. Then, the robustness, convergence efficiency, and time complexity of PCOA are evaluated on 62 benchmark functions and 21 engineering design problems. The benchmark functions test suite comprises 23 classical benchmark functions, 29 CEC2017 in 10, 30, 50, and 100 dimensions, and 10 CEC2019. The engineering design problems include 6 CEC2006 and 18 CEC2011.
4.1. Sensitivity Analysis
In this study, the parameters of PCOA are obtained using a sensitivity analysis. The sensitivity analysis method presented by [22] is employed. This method uses the min–max normalization method to scale the objective function between 0 and 1. The results are clearly shown using this method. Figure 4 and Figure A1, Figure A2, Figure A3, Figure A4, Figure A5, Figure A6 and Figure A7 show the results of the PCOA sensitivity analysis. These figures clearly show the best results (represented by a green color) and the worst results (represented by a red color) which are obtained by employing the method proposed by [22] and using the min–max normalization method to scale the objective function between 0 and 1. As seen for the classic benchmark functions, CEC2019 and CEC2006, the best N_Tree was equal to 2. In contrast, the best N_Tree for CEC2017 was equal to 2 and 30. About CEC2006 and CEC2011, the best value of N_Tree was 20 and 10, respectively. About N_Cone, the best values for the classic benchmark functions, CEC2017, CEC2019, CEC2006, and CEC2011, were equal to 20, 5, 5, 20, and 5, respectively. The best values of N_Cycle for the classic benchmark functions, CEC2017, CEC2019, CEC2006, and CEC2011, were 5, 50, 100, 5, and 10, respectively. Considering P1, the best value was 0.05. The best value for P2 was equal to 0.8. Regarding all results, the default values for N_Tree, N_Cone, N_Cycle, P1, and P2 were 2, 5, 50, 0.05, and 0.8, respectively.
4.2. The Benchmark Set and Compared Algorithms
A comparison was made between PCOA and AVOA, PSO, DE, RW_GWO, WOA, HHO, LSHADE, GBO, and EBOwithCMAR to assess their ability to solve the classic benchmark functions, CEC2017 and CEC2019. Table A3 presents the minimum (min), mean, median, maximum (max), and standard deviation (std) results of PCOA and other approaches for solving the classical benchmark functions. PCOA reached the global optimum for F1–F6, F9, F11, F17–F18, F20, and F21. Regarding the remaining classical benchmark functions, PCOA approached the global optimum with high accuracy. In Figure 5, the Wilcoxon test determines the number of victories, equalities, and defeats of PCOA compared to other competitors. According to the results, the numbers of PCOA’s victories against AVOA, PSO, DE, RW_GWO, WOA, HHO, LSHADE, GBO, and EBOwithCMAR were equal to 14, 19, 18, 19, 20, 19, 8, 15, and 6, respectively. Based on the mentioned results, the superiority of PCOA compared to AVOA, PSO, DE, RW_GWO, WOA, HHO, and GBO is clear in optimizing the investigated classical benchmark functions. The equality results in this figure show that PCOA had 13 and 14 equalities versus LSHADE and EBOwithCMAR. Hence, in the classical benchmark functions, PCOA’s results were comparable to those for LSHADE and EBOwithCMAR. In Figure 6, the Friedman ranking test is employed to show the rank of each algorithm. The Friedman ranking analysis shows that PCOA was ranked first. Meanwhile, EBOwithCMAR and LSHADE rank second and third, respectively. The PCOA’s rank (2.90) was 28.92% and 26.77% less than LSHADE and EBOwithCMAR.
Table A4 lists the statistical criteria of PCOA and other approaches for optimizing CEC2017 over 10 dimensions. Regarding unimodal benchmark functions (CEC17_01 and CEC17_02), PCOA could consistently find a global optimum solution. Regarding multi-modal benchmark functions (CEC17_04–10), PCOA could consistently find global optimum solutions for CEC17_04–06 and CEC17_08–09. PCOA approached the global optimum solutions with reasonable accuracy in the remaining multi-modal functions. Regarding hybrid benchmark functions (CEC17_11–20), PCOA could compute the global optimum of CEC17_11 consistently. In the remaining hybrid functions, the solutions of PCOA were close to the global optimum, and sometimes PCOA approached the global optimum solutions with 100% accuracy. About the composite benchmark functions (CEC17_21–30), PCOA became trapped in local optimum solutions in solving CEC17_21, CEC17_23–25, CEC17_27, and CEC17_29–30. This is an issue because of the many local optimums and complex structures of the mentioned functions. However, PCOA’s results were close to the optimum solutions in the remaining composite functions. PCOA could find the global optima of CEC17_22, CEC17_26, and CEC17_28 in some runs. A comparison of the results of PCOA and its competitors based on the Wilcoxon test (Figure 7) showed that PCOA had 28 victories over AVOA, 25 victories over PSO and DE, 27 victories over RW_GWO, 29 victories over WOA and HHO, and 28 victories over GBO. Compared to LSHADE, PCOA had 11 victories and 4 equalities. The number of victories and equalities of PCOA against EBOwithCMAR were equal to 4 and 5, respectively. The Friedman test results (Figure 8) showed that PCOA had a lower rank than other approaches, followed by LSHADE and EBOwithCMAR.
Table A5 tabulates the results of solving CEC2017 over 30 dimensions using PCOA, AVOA, PSO, DE, RW_GWO, WOA, HHO, LSHADE, GBO, and EBOwithCMAR. On the unimodal benchmark functions, PCOA could find global optimum solutions for them in all runs. Regarding the multi-modal benchmark functions, PCOA consistently obtained the global optimum solutions of CEC17_04, CEC17_06, and CEC17_09. In the remaining unimodal functions, PCOA estimated optimum solutions with good precision. Regarding the hybrid benchmark functions, PCOA could find global optimum solutions of CEC17_11 and, in the remaining functions, approached the optimum solutions with reasonable accuracy. Regarding the composite benchmark functions, PCOA was trapped in a local optimum because of the large number of local optimum solutions and the challenging structure of these functions. However, the accuracy of PCOA in solving the composite functions was comparable with other algorithms. According to the Wilcoxon test results for CEC2017 over 30 dimensions (Figure A8), PCOA won in 29, 27, 28, 28, 29, 29, 13, 28, and 9 functions, respectively. According to the Friedman test results (Figure A9), PCOA achieved the highest rank, followed by EBOwithCMAR. Table A6 displays the results of solving CEC2017 over 50 dimensions using PCOA, AVOA, DE, RW_GWO, WOA, HHO, LSHADE, GBO, and EBOwithCMAR. Based on the results, for unimodal CEC2017, PCOA achieved the global optimum solutions consistently. Regarding multi-modal CEC2017, PCOA reached the global optimum of CEC17_04, CEC17_06, and CEC17_09 with an accuracy of 100%. PCOA’s precision in approximating global optimum solutions in the remaining multi-modal CEC2017 was reasonable compared to other competitors. Regarding hybrid and composite CEC2017, PCOA had a challenge finding global optimum solutions. However, the results of PCOA competed with the other investigated algorithms. The Wilcoxon test (Figure A10) and the Friedman test (Figure A11) showed the superiority of PCOA over the other competitors. PCOA was the winner in 19 and 18 functions over LSHADE and EBOwithCMAR. In comparison with the state-of-the-art algorithms, the Friedman’s ranking of PCOA was 31.91% and 20.62% better than LSHADE and EBOwithCMAR. Table A7 compares PCOA and its competitors using CEC2017 over 100 dimensions. PCOA obtained global optimum solutions (CEC17_01 and CEC17_02) and some multi-modal CEC2017 (CEC17_04, CEC17_06, and CEC17_09). In the remaining CEC2017, PCOA performed better than the other competitors in most conditions. The Wilcoxon test results (Figure A12) showed that PCOA had 29 victories over AVOA, PSO, WOA, HHO, and GBO, 28 victories over DE and RW_GWO, 22 victories over LSHADE, and 17 victories over EBOwithCMAR. Figure A13 shows the Friedman ranking results in solving CEC2017 with 100 dimensions. As seen, PCOA took the first rank (1.68), which was 39.37% and 18.43% less than the third- (LSHADE) and second- (EBOwithCMAR) best algorithms. Considering the CEC2017 benchmark functions in all dimensions, PCOA had superiority over AVOA, PSO, DE, RW_GWO, WOA, HHO, and GBO. In 10 and 30 dimensions, the results of PCOA were close to the winners of CEC2017, LSHADE and EBOwithCMAR, while in the remaining dimensions, PCOA had more accuracy. Regarding the quality of PCOA’s results, it can be recognized that PCOA’s results were comparable to those of the other investigated algorithms. Table A8 presents the min, mean, median, max, and std results of solving the CEC2019 benchmark functions using PCOA and the other approaches. Based on the findings of this table, the proposed algorithm performed better than AVOA, PSO, DE, RW_GWO, WOA, HHO, LSHADE, GBO, and EBOwithCMAR. PCOA could find a global optimum for CEC19_01 and CEC19_03–CEC19_06. For other benchmark functions, the PCOA results were comparable with other investigated approaches. The Wilcoxon test in Figure 9 revealed that PCOA had more victories over AVOA, PSO, DE, RW_GWO, WOA, HHO, LSHADE, and GBO. In comparison with EBOwithCMAR, PCOA had three victories and one equality. According to the Friedman ranking, PCOA achieved the first rank. The Friedman ranking of PCOA (Figure 10) was 24.36% and 21.69%, better than LSHADE (the third-best algorithm) and EBOwithCMAR (the second-best algorithm).
According to the obtained results for the benchmark functions, in most benchmark functions PCOA had better performance than AVOA, PSO, DE, RW_GWO, WOA, HHO, LSHADE, GBO, and EBOwithCMAR. Comparing statistical criteria over 51 random runs (min, mean, median, max, and std), the Wilcoxon and Friedman ranking tests confirm this.
4.3. The Engineering Problems and the Compared Algorithms
A summary of the statistical results (min, mean, median, max, and std) of the PCOA and other approaches to solving the CEC2006 engineering problems is presented in Table A9. The results of this table are for 51 random runs. PCOA performed better than AVOA, PSO, DE, RW_GWO, WOA, HHO, and GBO in solving CEC06_01–02 and CEC06_04–06. For CEC06_03, the results of PCOA were better than AVOA, RW_GWO, WOA, and HHO. According to the Wilcoxon test (Figure 11) and Friedman test (Figure 12), PCOA was better than AVOA, PSO, DE, RW_GWO, WOA, HHO, and GBO.
Table A10 displays the optimization results for CEC2011 by PCOA and its competitors. PCOA outperformed its competitors in solving CEC11_03, CEC11_05, CEC11_07, CEC11_11–13, and CEC11_15–17. Considering the Wilcoxon test results (Figure 13), PCOA had 11, 14, 15, 13, 15, 15, 11, 13, and 10 victories over AVOA, PSO, DE, RW_GWO, WOA, HHO, LSHADE, GBO, and EBOwithCMAR. Regarding the Friedman test (Figure 14), the proposed algorithm was ranked first (rank = 1.94). LSHADE achieved the second-ranking (rank = 2.60) while EBOwithCMAR obtained the third-ranking (rank = 3.25). Therefore, the results show that PCOA performed competitively compared to the other investigated approaches in optimizing engineering problems.
4.4. PCOA Convergence Analysis
This subsection analyzes the PCOA’s and competitors’ convergence efficacies using violin plots (Figure 15) and convergence curves (Figure 16). The violin plot shows the distribution of the algorithm’s results. A broader violin shows more uncertainty and less quality in this plot, and vice versa. Based on the violin plots shown in Figure 15, PCOA converged to optimum values in almost all conditions. The difference between the maximum and minimum solutions of PCOA was significantly less than other algorithms. This issue shows that the results of PCOA are consistent. Considering Figure 16, PCOA had a reasonable convergence speed compared to the competitors. The following equations are used to ensure that algorithms converge.
In Equation (20), is globally optimal, the is the objective function in the last generation, and is the objective function in the initial generation.
Table 2 shows the results for PCOA, AVOA, PSO, DE, RW_GWO, WOA, HHO, LSHADE, GBO, and EBOwithCMAR on distinct problems. According to the results of solving the classic, CEC2017, CEC2019, CEC2006, and CEC2011 functions, convergence is guaranteed in almost all conditions for PCOA. PCOA’s convergence rate () competes with other algorithms.
4.5. Complexity Evaluation
The complexity evaluation is carried out by estimating the , , and values. The computation time of calculating mathematical functions relates to . is the computation time of calculating the 18th CEC2017 on 200,000 evaluations and all dimensions. is the average computation time for executing CEC17_18 with 200,000 evaluations five times. The time complexity is as follows:
Table 3 shows the time complexities of PCOA, AVOA, PSO, DE, RW_GWO, WOA, HHO, LSHADE, GBO, and EBOwithCMAR. In 10 and 30 dimensions, the algorithms’ complexities were close to each other. However, as the dimensions increased, the time complexity of the PCOA and the state-of-the-art algorithms increased, which is due to the greater efforts of these algorithms in finding optimal solutions to the problem.
5. Discussion
Figure 17 shows the average of the Friedman’s ranking results for all eighty-six benchmark functions. As seen in Figure 17, PCOA, EBOwithCMAR, and LSHADE achieved ranks of 2.42, 2.46, and 2.67, respectively, placing them in the first, second, and third positions. Thus, in terms of accuracy, PCOA performed better than well-known optimization algorithms (PSO, DE, and WOA), new optimization algorithms (AVOA, RW_GWO, HHO, and GBO), and state-of-the-art algorithms (LSHADE and EBOwithCMAR). Regarding the convergence efficacy and time complexity, PCOA had competitive results compared to the other optimization algorithms. The outstanding performance of PCOA is for the following reasons:
- Using pollination operators in Equations (12)–(14) leads to good exploration and convergence to near the space of the global optimum.
- Considering new operators in pine cone dispersal by animals and gravity leads to an approximate global optimum with reasonable accuracy.
- Clustering the search domain into sub-clusters and shrinking the search space increases the chance of finding the global optimum faster and more accurately.
- Using adaptive weight creates a good balance between the exploration and exploitation ability.
- Employing Levy flight distribution and a mathematical optimizer generates diverse solutions and helps PCOA to approximate optimum solutions.
Although PCOA performed better than the other investigated algorithms, in some problems other algorithms performed better. This issue can be explained by the “no free lunch in search and optimization” theorem [1]. According to this theorem, each optimization algorithm performs better than others in some problems.
6. Conclusions
The present research proposed a new optimization algorithm called the Pine Cone Optimization Algorithm (PCOA). This algorithm works based on the pine tree’s reproduction methods. PCOA benefits from new operators for pollination and cone dispersal by gravity and animals. The utilization of sub-clustering methods within the search domain, coupled with the reduction in the search domain and the incorporation of adaptive weights, leads to a significant increase in the efficacy of the PCOA algorithm. This approach balances exploration and exploitation capabilities and enhances the algorithm’s performance. The performance of this algorithm was investigated in different mathematical benchmark functions and engineering optimization problems. The mathematical benchmark test suite included 23 classic benchmark functions, 29 CEC2017, and 10 CEC2019. There were six CEC2006 and seventeen CEC2011 problems in engineering optimization. The results showed that PCOA was superior to well-known optimization algorithms (PSO, DE, and WOA) and new optimization algorithms (AVOA, RW_GWO, HHO, and GBO). In addition, PCOA was a competitor for state-of-the-art algorithms (LSHADE and EBOwithCMAR). The Friedman rank for PCOA in solving all the test suite problems was 2.42, 1.68 and 9.42 percent better than EBOwithCMAR (second-best algorithm) and LSHADE (third-best algorithm). For executing PCOA, a sensitivity analysis is needed. However, in this study, the researchers reported the default values of the PCOA parameters. Users can use these default parameters to run PCOA with no sensitivity analysis. In order to use this algorithm, programming language software is needed. PCOA has a high potential for solving various complex science and engineering problems.
Author Contributions
Conceptualization, M.V.A. and S.F.; methodology, M.V.A. and S.F.; software, M.V.A. and S.F.; validation, M.V.A. and S.F. formal analysis, M.V.A. and S.F.; investigation, M.V.A. and S.F.; resources, M.V.A. and S.F.; data curation, M.V.A. and S.F.; writing—original draft preparation, M.V.A. and S.F.; writing—review and editing, M.V.A. and S.F.; visualization, M.V.A. and S.F.; supervision, S.F; project administration, S.F. All authors have read and agreed to the published version of the manuscript.
Funding
This research received no external funding.
Data Availability Statement
The raw data supporting the conclusions of this article will be made available by the authors on request.
Conflicts of Interest
The authors declare no conflicts of interest.
Abbreviations
The following abbreviations are used in this manuscript:
| Pine cone’s current position | Adaptive weight | ||
| Tree’s current position | Adaptive weight | ||
| Updated position of pine cone | Average value for | ||
| Updated position of pine tree | Average value for | ||
| The best global position | Average value for | ||
| The average of all pine cones’ positions | Crossover rate | ||
| The average of all trees’ positions | Average value for | ||
| The position of pine cones that are carried by an animal | Number of tree | ||
| The initial position in quadratic programming | Shrinking radius | ||
| The top best individuals (10%) | Current function evaluation | ||
| The memory of PCOA to save solutions | Maximum number of function evaluations | ||
| Adaptive weight | Random number with Levy flight distribution | ||
| Adaptive weight | Control parameter | ||
| Adaptive weight | Control parameter | ||
| Number of pollination cycle |
Appendix A

Table A1.
Characteristics of classic benchmark functions.
| Function Formula | Dimensions | ||
|---|---|---|---|
| 0 | 30 | ||
| 0 | 30 | ||
| 0 | 30 | ||
| 0 | 30 | ||
| 0 | 30 | ||
| 0 | 30 | ||
| 0 | 30 | ||
| 30 | |||
| 0 | 30 | ||
| 0 | 30 | ||
| 0 | 30 | ||
| 0 | 30 | ||
| 0 | 30 | ||
| 1 | 2 | ||
| 4 | |||
| 2 | |||
| 2 | |||
| 3 | 2 | ||
| 3 | |||
| 6 | |||
| 4 | |||
| 4 | |||
| 4 |
Table A2.
Description of CEC2019 benchmark functions.
| Name | Benchmark Function Name | Dimensions | ||
|---|---|---|---|---|
| STORN’S CHEBYSHEV POLYNOMIAL FITTING PROBLEM | 9 | 1 | ||
| INVERSE HILBERT MATRIX PROBLEM | 16 | 16,384, 16,384] | 1 | |
| LENNARD-JONES MINIMUM ENERGY CLUSTER | 18 | 1 | ||
| RASTRIGIN’S FUNCTION | 10 | 1 | ||
| GRIEWANGK’S FUNCTION | 10 | 1 | ||
| WEIERSTRASS FUNCTION | 10 | 1 | ||
| MODIFIED SCHWEFEL’S FUNCTION | 10 | 1 | ||
| EXPANDED SCHAFFER’S CEC06 FUNCTION | 10 | 1 | ||
| HAPPY CAT FUNCTION | 10 | 1 | ||
| ACKLEY FUNCTION | 10 | 1 |
Figure A1.
PCOA sensitivity analysis using CEC2017 benchmark functions on 10 dimensions. (a) N_Tree; (b) N_Cone; (c) N_Cycle; (d) P1; (e) P2.
Figure A1.
PCOA sensitivity analysis using CEC2017 benchmark functions on 10 dimensions. (a) N_Tree; (b) N_Cone; (c) N_Cycle; (d) P1; (e) P2.

Figure A2.
PCOA sensitivity analysis using CEC2017 benchmark functions on 30 dimensions. (a) N_Tree; (b) N_Cone; (c) N_Cycle; (d) P1; (e) P2.
Figure A2.
PCOA sensitivity analysis using CEC2017 benchmark functions on 30 dimensions. (a) N_Tree; (b) N_Cone; (c) N_Cycle; (d) P1; (e) P2.

Figure A3.
PCOA sensitivity analysis using CEC2017 benchmark functions on 50 dimensions. (a) N_Tree; (b) N_Cone; (c) N_Cycle; (d) P1; (e) P2.
Figure A3.
PCOA sensitivity analysis using CEC2017 benchmark functions on 50 dimensions. (a) N_Tree; (b) N_Cone; (c) N_Cycle; (d) P1; (e) P2.

Figure A4.
PCOA sensitivity analysis using CEC2017 benchmark functions on 100 dimensions. (a) N_Tree; (b) N_Cone; (c) N_Cycle; (d) P1; (e) P2.
Figure A4.
PCOA sensitivity analysis using CEC2017 benchmark functions on 100 dimensions. (a) N_Tree; (b) N_Cone; (c) N_Cycle; (d) P1; (e) P2.

Figure A5.
PCOA sensitivity analysis using CEC2019 benchmark functions. (a) N_Tree; (b) N_Cone; (c) N_Cycle; (d) P1; (e) P2.
Figure A5.
PCOA sensitivity analysis using CEC2019 benchmark functions. (a) N_Tree; (b) N_Cone; (c) N_Cycle; (d) P1; (e) P2.

Figure A6.
PCOA sensitivity analysis using CEC2006 benchmark functions. (a) N_Tree; (b) N_Cone; (c) N_Cycle; (d) P1; (e) P2.
Figure A6.
PCOA sensitivity analysis using CEC2006 benchmark functions. (a) N_Tree; (b) N_Cone; (c) N_Cycle; (d) P1; (e) P2.

Figure A7.
PCOA sensitivity analysis using CEC2011 benchmark functions. (a) N_Tree; (b) N_Cone; (c) N_Cycle; (d) P1; (e) P2.
Figure A7.
PCOA sensitivity analysis using CEC2011 benchmark functions. (a) N_Tree; (b) N_Cone; (c) N_Cycle; (d) P1; (e) P2.

Figure A8.
Comparison of Wilcoxon test for PCOA and other algorithms using the 30D CEC2017 benchmark functions over 51 independent runs and 300,000 NFES.
Figure A8.
Comparison of Wilcoxon test for PCOA and other algorithms using the 30D CEC2017 benchmark functions over 51 independent runs and 300,000 NFES.

Table A3.
Statistical criteria results of PCOA and other algorithms on classic benchmark functions, over 51 independent runs.
Table A3.
Statistical criteria results of PCOA and other algorithms on classic benchmark functions, over 51 independent runs.
| Function | PCOA | AVOA | PSO | DE | RW_GWO | WOA | HHO | LSHADE | GBO | EBOwithCMAR | |
|---|---|---|---|---|---|---|---|---|---|---|---|
| Min | 0.00 | 0.00 | 0.00 | ||||||||
| Mean | 0.00 | 0.00 | |||||||||
| F1 | Median | 0.00 | 0.00 | ||||||||
| Max | 0.00 | 0.00 | |||||||||
| Std | 0.00 | 0.00 | 0.00 | 0.00 | 0.00 | ||||||
| Min | 0.00 | 0.00 | 0.00 | ||||||||
| Mean | 0.00 | 0.00 | |||||||||
| F2 | Median | 0.00 | 0.00 | ||||||||
| Max | 0.00 | 0.00 | |||||||||
| Std | 0.00 | 0.00 | |||||||||
| Min | 0.00 | 0.00 | |||||||||
| Mean | 0.00 | 0.00 | |||||||||
| F3 | Median | 0.00 | 0.00 | ||||||||
| Max | 0.00 | 0.00 | |||||||||
| Std | 0.00 | 0.00 | 0.00 | 0.00 | |||||||
| Min | 0.00 | 0.00 | |||||||||
| Mean | 0.00 | 0.00 | |||||||||
| F4 | Median | 0.00 | 0.00 | ||||||||
| Max | 0.00 | 0.00 | |||||||||
| Std | 0.00 | 0.00 | |||||||||
| Min | |||||||||||
| Mean | |||||||||||
| F5 | Median | ||||||||||
| Max | |||||||||||
| Std | |||||||||||
| Min | |||||||||||
| Mean | |||||||||||
| F6 | Median | ||||||||||
| Max | |||||||||||
| Std | |||||||||||
| Min | |||||||||||
| Mean | |||||||||||
| F7 | Median | ||||||||||
| Max | |||||||||||
| Std | |||||||||||
| Min | |||||||||||
| Mean | |||||||||||
| F8 | Median | ||||||||||
| Max | |||||||||||
| Std | |||||||||||
| Min | |||||||||||
| Mean | |||||||||||
| F9 | Median | ||||||||||
| Max | |||||||||||
| Std | |||||||||||
| Min | |||||||||||
| Mean | |||||||||||
| F10 | Median | ||||||||||
| Max | |||||||||||
| Std | |||||||||||
| Min | |||||||||||
| Mean | |||||||||||
| F11 | Median | ||||||||||
| Max | |||||||||||
| Std | |||||||||||
| Min | |||||||||||
| Mean | |||||||||||
| F12 | Median | ||||||||||
| Max | |||||||||||
| Std | |||||||||||
| Min | |||||||||||
| Mean | |||||||||||
| F13 | Median | ||||||||||
| Max | |||||||||||
| Std | |||||||||||
| Min | |||||||||||
| Mean | |||||||||||
| F14 | Median | ||||||||||
| Max | |||||||||||
| Std | |||||||||||
| Min | |||||||||||
| Mean | |||||||||||
| F15 | Median | ||||||||||
| Max | |||||||||||
| Std | |||||||||||
| Min | |||||||||||
| Mean | |||||||||||
| F16 | Median | ||||||||||
| Max | |||||||||||
| Std | |||||||||||
| Min | |||||||||||
| Mean | |||||||||||
| F17 | Median | ||||||||||
| Max | |||||||||||
| Std | |||||||||||
| Min | |||||||||||
| Mean | |||||||||||
| F18 | Median | ||||||||||
| Max | |||||||||||
| Std | |||||||||||
| Min | |||||||||||
| Mean | |||||||||||
| F19 | Median | ||||||||||
| Max | |||||||||||
| Std | |||||||||||
| Min | |||||||||||
| Mean | |||||||||||
| F20 | Median | ||||||||||
| Max | |||||||||||
| Std | |||||||||||
| Min | |||||||||||
| Mean | |||||||||||
| F21 | Median | ||||||||||
| Max | |||||||||||
| Std | |||||||||||
| Min | |||||||||||
| Mean | |||||||||||
| F22 | Median | ||||||||||
| Max | |||||||||||
| Std | |||||||||||
| Min | |||||||||||
| Mean | |||||||||||
| F23 | Median | ||||||||||
| Max | |||||||||||
| Std |
Figure A9.
Comparison of Friedman ranking for PCOA and other algorithms using the 30D CEC2017 benchmark functions over 51 independent runs and 300,000 NFES.
Figure A9.
Comparison of Friedman ranking for PCOA and other algorithms using the 30D CEC2017 benchmark functions over 51 independent runs and 300,000 NFES.

Figure A10.
Comparison of Wilcoxon test for PCOA and other algorithms using the 50D CEC2017 benchmark functions over 51 independent runs and 500,000 NFES.
Figure A10.
Comparison of Wilcoxon test for PCOA and other algorithms using the 50D CEC2017 benchmark functions over 51 independent runs and 500,000 NFES.

Table A4.
Statistical criteria results of PCOA and other algorithms on the 10D CEC2017, over 51 independent runs.
Table A4.
Statistical criteria results of PCOA and other algorithms on the 10D CEC2017, over 51 independent runs.
| Function | PCOA | AVOA | PSO | DE | RW_GWO | WOA | HHO | LSHADE | GBO | EBOwithCMAR | |
|---|---|---|---|---|---|---|---|---|---|---|---|
| Min | 100.00 | 102.70 | 100.96 | 135.13 | 2439.47 | 7915.27 | 36460.41 | 100.00 | 100.10 | 100.00 | |
| Mean | 100.00 | 4312.89 | 1723.10 | 1371.99 | 292277.87 | 295915.24 | 233033.39 | 100.00 | 1004.74 | 100.00 | |
| CEC_17/01 | Median | 100.00 | 3954.98 | 785.93 | 1230.12 | 11000.50 | 70542.61 | 218064.13 | 100.00 | 476.65 | 100.00 |
| Max | 100.00 | 12739.83 | 12252.30 | 4280.86 | 7276035.49 | 2676940.69 | 577133.76 | 100.00 | 6084.59 | 100.00 | |
| Std | 0.00 | 3600.65 | 2329.07 | 1010.83 | 1269917.69 | 579476.71 | 117529.75 | 0.00 | 1235.43 | 0.00 | |
| Min | 300.00 | 300.00 | 300.00 | 879.94 | 300.06 | 310.19 | 300.20 | 300.00 | 300.00 | 300.00 | |
| Mean | 300.00 | 300.00 | 300.00 | 1936.66 | 304.15 | 511.89 | 300.78 | 300.00 | 300.00 | 300.00 | |
| CEC_17/03 | Median | 300.00 | 300.00 | 300.00 | 1922.24 | 302.75 | 468.70 | 300.73 | 300.00 | 300.00 | 300.00 |
| Max | 300.00 | 300.00 | 300.00 | 3465.34 | 317.71 | 1241.93 | 301.66 | 300.00 | 300.00 | 300.00 | |
| Std | 0.00 | 0.00 | 0.00 | 564.41 | 4.39 | 187.70 | 0.35 | 0.00 | 0.00 | 0.00 | |
| Min | 400.00 | 400.02 | 400.03 | 404.94 | 400.20 | 400.12 | 400.06 | 400.00 | 400.00 | 400.00 | |
| Mean | 400.00 | 403.89 | 400.43 | 406.01 | 406.65 | 426.11 | 421.85 | 400.00 | 400.00 | 400.00 | |
| CEC_17/04 | Median | 400.00 | 404.55 | 400.37 | 406.10 | 407.17 | 407.60 | 407.04 | 400.00 | 400.00 | 400.00 |
| Max | 400.00 | 406.25 | 401.52 | 406.57 | 407.76 | 550.26 | 500.39 | 400.00 | 400.00 | 400.00 | |
| Std | 0.00 | 1.54 | 0.32 | 0.36 | 1.63 | 38.06 | 30.38 | 0.00 | 0.00 | 0.00 | |
| Min | 500.00 | 506.96 | 508.95 | 505.94 | 506.97 | 517.04 | 513.32 | 501.03 | 503.98 | 500.00 | |
| Mean | 500.33 | 531.81 | 519.00 | 509.53 | 517.88 | 548.42 | 539.51 | 503.45 | 521.18 | 500.04 | |
| CEC_17/05 | Median | 500.00 | 531.84 | 517.91 | 509.57 | 516.05 | 545.77 | 539.87 | 503.18 | 520.89 | 500.00 |
| Max | 503.98 | 557.87 | 544.77 | 513.22 | 530.26 | 584.60 | 567.02 | 505.16 | 543.78 | 500.99 | |
| Std | 0.71 | 11.63 | 7.20 | 1.64 | 6.02 | 17.64 | 14.66 | 1.04 | 8.67 | 0.20 | |
| Min | 600.00 | 600.15 | 600.00 | 600.00 | 600.03 | 606.41 | 601.79 | 600.00 | 600.00 | 600.00 | |
| Mean | 600.00 | 606.18 | 600.66 | 600.00 | 600.09 | 629.83 | 626.74 | 600.00 | 600.05 | 600.00 | |
| CEC_17/06 | Median | 600.00 | 602.26 | 600.00 | 600.00 | 600.06 | 629.63 | 625.50 | 600.00 | 600.00 | 600.00 |
| Max | 600.00 | 627.73 | 608.72 | 600.00 | 600.51 | 660.34 | 654.49 | 600.00 | 601.01 | 600.00 | |
| Std | 0.00 | 7.53 | 1.59 | 0.00 | 0.09 | 12.25 | 12.64 | 0.00 | 0.18 | 0.00 | |
| Min | 710.46 | 719.00 | 707.96 | 714.85 | 713.96 | 724.62 | 725.78 | 710.74 | 716.88 | 710.37 | |
| Mean | 711.39 | 751.56 | 720.26 | 721.29 | 726.72 | 775.21 | 771.76 | 712.91 | 734.61 | 710.62 | |
| CEC_17/07 | Median | 711.13 | 749.90 | 719.26 | 721.55 | 725.60 | 772.32 | 775.75 | 712.87 | 733.43 | 710.60 |
| Max | 716.24 | 790.49 | 736.39 | 724.17 | 747.55 | 849.95 | 811.68 | 714.86 | 767.46 | 711.33 | |
| Std | 0.90 | 15.91 | 5.69 | 1.68 | 8.69 | 25.87 | 19.81 | 0.82 | 10.55 | 0.21 | |
| Min | 800.00 | 806.96 | 804.97 | 806.37 | 803.98 | 811.95 | 808.04 | 801.10 | 806.96 | 800.00 | |
| Mean | 800.60 | 824.50 | 812.95 | 810.14 | 815.07 | 839.82 | 828.80 | 803.09 | 821.10 | 800.04 | |
| CEC_17/08 | Median | 800.00 | 821.89 | 812.93 | 810.45 | 814.95 | 839.80 | 828.95 | 803.11 | 820.89 | 800.00 |
| Max | 803.98 | 852.73 | 824.87 | 814.72 | 831.00 | 872.64 | 853.80 | 805.13 | 837.81 | 800.99 | |
| Std | 0.87 | 10.70 | 4.66 | 1.96 | 5.70 | 14.67 | 10.09 | 0.99 | 6.99 | 0.18 | |
| Min | 900.00 | 900.00 | 900.00 | 900.00 | 900.01 | 955.95 | 936.51 | 900.00 | 900.00 | 900.00 | |
| Mean | 900.00 | 992.43 | 900.00 | 900.00 | 900.24 | 1329.27 | 1280.98 | 900.00 | 902.40 | 900.00 | |
| CEC_17/09 | Median | 900.00 | 945.72 | 900.00 | 900.00 | 900.15 | 1240.42 | 1251.71 | 900.00 | 900.54 | 900.00 |
| Max | 900.00 | 1467.93 | 900.09 | 900.00 | 901.07 | 2230.91 | 1988.21 | 900.00 | 917.77 | 900.00 | |
| Std | 0.00 | 121.14 | 0.02 | 0.00 | 0.21 | 284.21 | 246.47 | 0.00 | 4.24 | 0.00 | |
| Min | 1000.31 | 1239.78 | 1122.10 | 1224.47 | 1006.99 | 1462.16 | 1364.00 | 1002.32 | 1033.47 | 1000.12 | |
| Mean | 1213.54 | 1807.25 | 1725.69 | 1499.66 | 1684.13 | 2035.03 | 1964.97 | 1053.54 | 1796.73 | 1040.74 | |
| CEC_17/10 | Median | 1148.94 | 1805.86 | 1731.51 | 1488.98 | 1684.84 | 2003.27 | 1955.32 | 1020.27 | 1758.07 | 1010.31 |
| Max | 1690.47 | 2655.32 | 2288.46 | 1655.37 | 2408.16 | 2790.73 | 2509.85 | 1156.71 | 2472.82 | 1140.59 | |
| Std | 179.47 | 306.96 | 267.92 | 89.18 | 318.23 | 328.16 | 317.63 | 53.66 | 382.81 | 52.59 | |
| Min | 1100.00 | 1110.42 | 1101.00 | 1101.84 | 1102.02 | 1110.62 | 1106.76 | 1100.00 | 1100.99 | 1100.00 | |
| Mean | 1100.00 | 1129.01 | 1117.56 | 1103.23 | 1118.13 | 1213.21 | 1174.19 | 1100.26 | 1111.44 | 1100.00 | |
| CEC_17/11 | Median | 1100.00 | 1128.13 | 1116.64 | 1103.29 | 1115.48 | 1182.55 | 1148.59 | 1100.00 | 1109.95 | 1100.00 |
| Max | 1100.00 | 1165.69 | 1136.53 | 1104.62 | 1139.40 | 1474.54 | 1438.76 | 1102.54 | 1140.51 | 1100.00 | |
| Std | 0.00 | 12.63 | 9.99 | 0.69 | 8.49 | 94.62 | 78.49 | 0.67 | 7.39 | 0.00 | |
| Min | 1200.01 | 2415.85 | 1477.84 | 36299.73 | 4111.51 | 5248.95 | 5698.61 | 1200.00 | 1756.71 | 1200.00 | |
| Mean | 1228.06 | 132474.92 | 11755.29 | 200376.87 | 411662.85 | 4206287.96 | 1162284.97 | 1254.76 | 9008.62 | 1305.65 | |
| CEC_17/12 | Median | 1200.24 | 62475.27 | 7636.71 | 194254.38 | 150558.47 | 1128022.07 | 693823.69 | 1200.42 | 5114.42 | 1318.65 |
| Max | 1357.53 | 854825.32 | 42196.42 | 412382.29 | 2177557.30 | 16104189.76 | 5643740.41 | 1437.08 | 48238.37 | 1438.18 | |
| Std | 50.98 | 183238.78 | 9941.89 | 83886.38 | 609954.72 | 5158085.66 | 1369978.67 | 70.71 | 9667.51 | 54.85 | |
| Min | 1300.02 | 1614.52 | 1519.67 | 1399.24 | 1627.30 | 2001.09 | 1430.90 | 1300.00 | 1315.37 | 1300.00 | |
| Mean | 1303.74 | 9260.09 | 7000.24 | 2543.82 | 8099.66 | 17137.51 | 14957.44 | 1303.71 | 1617.12 | 1302.92 | |
| CEC_17/13 | Median | 1304.86 | 4196.33 | 6368.89 | 2251.27 | 5794.93 | 13227.39 | 11656.41 | 1304.84 | 1486.43 | 1304.84 |
| Max | 1307.30 | 32117.88 | 25692.23 | 5957.97 | 20336.83 | 44508.74 | 36610.82 | 1307.95 | 4386.19 | 1308.37 | |
| Std | 2.37 | 9300.00 | 4786.33 | 1041.33 | 5340.20 | 12861.08 | 10314.04 | 2.24 | 481.00 | 2.88 | |
| Min | 1400.00 | 1438.49 | 1410.22 | 1402.10 | 1431.33 | 1461.81 | 1449.90 | 1400.00 | 1427.16 | 1400.00 | |
| Mean | 1401.58 | 1505.73 | 1493.21 | 1423.75 | 1951.21 | 1590.80 | 1516.01 | 1400.09 | 1479.00 | 1400.03 | |
| CEC_17/14 | Median | 1401.00 | 1473.64 | 1465.62 | 1415.58 | 1485.84 | 1532.57 | 1515.97 | 1400.00 | 1477.81 | 1400.00 |
| Max | 1421.01 | 1940.64 | 2017.12 | 1617.52 | 4996.08 | 3587.22 | 1610.16 | 1401.08 | 1574.65 | 1401.00 | |
| Std | 3.25 | 97.23 | 96.73 | 31.55 | 1119.87 | 294.60 | 29.84 | 0.25 | 33.86 | 0.14 | |
| Min | 1500.00 | 1515.54 | 1510.37 | 1503.15 | 1509.98 | 1645.24 | 1552.72 | 1500.00 | 1502.51 | 1500.00 | |
| Mean | 1500.08 | 2374.80 | 1667.28 | 1534.60 | 2187.20 | 4243.55 | 1935.86 | 1500.12 | 1576.95 | 1500.19 | |
| CEC_17/15 | Median | 1500.04 | 1693.37 | 1591.87 | 1522.00 | 1748.71 | 2885.60 | 1754.63 | 1500.01 | 1555.35 | 1500.04 |
| Max | 1500.41 | 4271.99 | 2707.72 | 1625.71 | 4619.45 | 13038.27 | 3637.64 | 1500.50 | 1795.85 | 1500.50 | |
| Std | 0.11 | 1091.57 | 211.38 | 30.78 | 949.00 | 2871.28 | 493.98 | 0.18 | 68.30 | 0.22 | |
| Min | 1600.02 | 1603.92 | 1600.61 | 1600.84 | 1603.97 | 1611.55 | 1604.36 | 1600.09 | 1600.95 | 1600.02 | |
| Mean | 1600.39 | 1761.75 | 1817.30 | 1602.59 | 1673.18 | 1806.85 | 1845.21 | 1600.55 | 1727.66 | 1600.41 | |
| CEC_17/16 | Median | 1600.29 | 1732.98 | 1839.48 | 1602.26 | 1624.72 | 1782.08 | 1859.80 | 1600.57 | 1723.56 | 1600.42 |
| Max | 1601.60 | 2059.24 | 2019.73 | 1609.01 | 1985.85 | 2118.66 | 2105.10 | 1600.99 | 2005.07 | 1600.86 | |
| Std | 0.36 | 107.15 | 124.51 | 1.33 | 96.67 | 115.27 | 145.92 | 0.21 | 116.57 | 0.20 | |
| Min | 1700.18 | 1721.50 | 1706.33 | 1700.49 | 1718.12 | 1730.66 | 1727.06 | 1700.06 | 1702.09 | 1700.01 | |
| Mean | 1702.58 | 1764.90 | 1752.92 | 1701.89 | 1755.63 | 1809.73 | 1767.20 | 1700.42 | 1733.61 | 1700.15 | |
| CEC_17/17 | Median | 1701.66 | 1751.05 | 1746.15 | 1701.79 | 1745.94 | 1786.60 | 1761.39 | 1700.41 | 1733.00 | 1700.07 |
| Max | 1720.49 | 1867.39 | 1864.15 | 1705.56 | 1885.46 | 1957.83 | 1856.01 | 1701.13 | 1784.32 | 1700.64 | |
| Std | 3.27 | 37.93 | 29.38 | 0.95 | 36.92 | 57.23 | 26.69 | 0.23 | 18.64 | 0.16 | |
| Min | 1800.05 | 2524.50 | 1904.43 | 1970.86 | 2542.69 | 2123.21 | 2023.05 | 1800.00 | 1844.02 | 1800.00 | |
| Mean | 1800.55 | 14537.39 | 8241.89 | 2780.07 | 24587.99 | 17612.72 | 14585.47 | 1800.98 | 2022.97 | 1800.31 | |
| CEC_17/18 | Median | 1800.50 | 10776.59 | 4850.99 | 2591.89 | 24762.65 | 15656.72 | 12745.97 | 1800.06 | 1937.78 | 1800.39 |
| Max | 1801.54 | 46035.86 | 29748.03 | 4465.11 | 55129.22 | 42302.15 | 48567.29 | 1820.14 | 3156.85 | 1800.50 | |
| Std | 0.37 | 11349.36 | 7398.50 | 641.46 | 16644.94 | 10840.98 | 11808.48 | 3.91 | 255.17 | 0.18 | |
| Min | 1900.02 | 1934.90 | 1907.17 | 1900.43 | 1914.98 | 1987.16 | 1960.31 | 1900.00 | 1903.82 | 1900.00 | |
| Mean | 1900.16 | 6716.24 | 2965.90 | 1934.34 | 3633.70 | 19300.84 | 9184.00 | 1900.02 | 1945.88 | 1900.02 | |
| CEC_17/19 | Median | 1900.08 | 3708.05 | 2051.55 | 1913.50 | 1938.32 | 9366.37 | 6255.76 | 1900.01 | 1933.75 | 1900.02 |
| Max | 1901.56 | 21532.73 | 10403.01 | 2353.13 | 13273.83 | 231816.56 | 28920.82 | 1900.07 | 2077.16 | 1900.04 | |
| Std | 0.26 | 5461.81 | 1815.59 | 66.95 | 3568.13 | 33453.35 | 7683.22 | 0.02 | 40.65 | 0.01 | |
| Min | 2000.00 | 2017.23 | 2002.30 | 2000.00 | 2018.47 | 2039.55 | 2038.79 | 2000.00 | 2000.31 | 2000.00 | |
| Mean | 2000.03 | 2069.90 | 2080.23 | 2000.00 | 2064.13 | 2140.01 | 2148.19 | 2000.01 | 2047.36 | 2000.16 | |
| CEC_17/20 | Median | 2000.00 | 2052.41 | 2049.09 | 2000.00 | 2044.78 | 2124.64 | 2147.36 | 2000.00 | 2033.25 | 2000.31 |
| Max | 2000.57 | 2172.84 | 2191.00 | 2000.00 | 2189.77 | 2290.38 | 2318.93 | 2000.31 | 2196.48 | 2000.31 | |
| Std | 0.10 | 41.34 | 57.84 | 0.00 | 49.65 | 62.09 | 71.40 | 0.04 | 47.01 | 0.16 | |
| Min | 2200.00 | 2200.00 | 2200.00 | 2212.26 | 2200.03 | 2206.74 | 2200.10 | 2200.00 | 2200.00 | 2200.00 | |
| Mean | 2208.96 | 2231.38 | 2259.97 | 2264.83 | 2306.31 | 2305.83 | 2303.38 | 2273.53 | 2241.59 | 2228.10 | |
| CEC_17/21 | Median | 2200.00 | 2202.29 | 2203.24 | 2255.08 | 2317.26 | 2332.06 | 2333.67 | 2303.90 | 2202.11 | 2200.00 |
| Max | 2304.63 | 2350.22 | 2349.48 | 2319.04 | 2332.98 | 2398.64 | 2404.68 | 2307.78 | 2336.21 | 2302.84 | |
| Std | 19.66 | 54.68 | 61.84 | 37.49 | 35.66 | 61.37 | 70.63 | 47.08 | 58.33 | 45.68 | |
| Min | 2200.00 | 2239.42 | 2211.20 | 2258.63 | 2301.00 | 2247.75 | 2231.19 | 2200.00 | 2219.29 | 2300.00 | |
| Mean | 2250.02 | 2307.06 | 2298.89 | 2296.80 | 2304.74 | 2313.36 | 2308.94 | 2298.07 | 2299.93 | 2300.00 | |
| CEC_17/22 | Median | 2232.00 | 2307.09 | 2301.92 | 2300.57 | 2305.89 | 2313.40 | 2313.52 | 2300.00 | 2302.45 | 2300.00 |
| Max | 2300.35 | 2321.07 | 2303.37 | 2301.42 | 2309.04 | 2336.06 | 2330.27 | 2300.35 | 2309.11 | 2300.00 | |
| Std | 39.37 | 10.83 | 15.49 | 9.53 | 2.91 | 11.94 | 20.33 | 14.01 | 14.93 | 0.00 | |
| Min | 2300.00 | 2609.40 | 2605.14 | 2607.02 | 2606.54 | 2615.62 | 2610.56 | 2602.86 | 2604.32 | 2600.00 | |
| Mean | 2599.22 | 2629.83 | 2624.95 | 2611.41 | 2619.61 | 2644.45 | 2657.81 | 2604.60 | 2624.02 | 2600.44 | |
| CEC_17/23 | Median | 2605.91 | 2627.48 | 2624.94 | 2611.60 | 2619.57 | 2642.83 | 2658.93 | 2604.60 | 2621.87 | 2600.00 |
| Max | 2613.12 | 2663.67 | 2665.34 | 2615.19 | 2632.72 | 2695.53 | 2695.42 | 2607.27 | 2656.68 | 2604.11 | |
| Std | 42.83 | 11.90 | 12.33 | 1.86 | 5.90 | 16.34 | 20.39 | 1.02 | 10.90 | 1.13 | |
| Min | 2500.00 | 2429.87 | 2500.00 | 2620.00 | 2500.36 | 2501.92 | 2500.56 | 2500.00 | 2500.00 | 2500.00 | |
| Mean | 2545.93 | 2726.69 | 2726.34 | 2717.77 | 2742.39 | 2753.22 | 2771.01 | 2717.68 | 2689.53 | 2554.74 | |
| CEC_17/24 | Median | 2500.00 | 2763.09 | 2748.54 | 2743.72 | 2747.15 | 2777.74 | 2793.75 | 2732.03 | 2745.95 | 2500.00 |
| Max | 2734.93 | 2823.81 | 2800.40 | 2750.26 | 2764.90 | 2856.97 | 2882.39 | 2735.65 | 2775.27 | 2729.54 | |
| Std | 68.36 | 104.54 | 79.72 | 40.92 | 34.99 | 85.54 | 94.40 | 50.33 | 112.35 | 91.60 | |
| Min | 2600.03 | 2600.19 | 2897.74 | 2899.84 | 2897.79 | 2606.80 | 2609.28 | 2897.74 | 2897.74 | 2897.74 | |
| Mean | 2896.52 | 2929.07 | 2923.15 | 2911.91 | 2924.10 | 2941.23 | 2926.75 | 2915.07 | 2925.92 | 2919.48 | |
| CEC_17/25 | Median | 2897.75 | 2946.50 | 2943.47 | 2909.79 | 2943.42 | 2951.52 | 2945.58 | 2898.03 | 2944.18 | 2899.58 |
| Max | 2943.44 | 3024.18 | 2949.15 | 2944.47 | 2948.56 | 3052.13 | 2972.85 | 2945.80 | 2971.76 | 2943.37 | |
| Std | 44.49 | 53.74 | 23.30 | 10.71 | 23.50 | 66.69 | 51.10 | 22.42 | 25.43 | 22.73 | |
| Min | 2600.00 | 2600.00 | 2600.00 | 2715.72 | 2600.57 | 2601.90 | 2811.59 | 2900.00 | 2600.00 | 2800.00 | |
| Mean | 2833.28 | 3019.96 | 2885.47 | 2896.64 | 3004.37 | 3332.97 | 3316.84 | 2900.00 | 2953.87 | 2884.61 | |
| CEC_17/26 | Median | 2884.67 | 3025.99 | 2900.00 | 2918.33 | 2900.17 | 3137.58 | 3206.68 | 2900.00 | 2900.00 | 2900.00 |
| Max | 2900.00 | 3462.30 | 3044.26 | 2952.48 | 3997.45 | 4801.41 | 4552.35 | 2900.00 | 3857.35 | 2900.00 | |
| Std | 86.07 | 153.11 | 81.83 | 54.60 | 305.99 | 487.08 | 426.84 | 0.00 | 173.27 | 36.08 | |
| Min | 3086.89 | 3089.52 | 3089.01 | 3089.05 | 3073.32 | 3090.24 | 3097.14 | 3089.01 | 3089.64 | 3089.52 | |
| Mean | 3088.66 | 3099.77 | 3106.63 | 3089.69 | 3079.47 | 3122.82 | 3131.65 | 3089.45 | 3103.45 | 3091.80 | |
| CEC_17/27 | Median | 3089.01 | 3097.51 | 3097.80 | 3089.66 | 3078.33 | 3106.23 | 3120.99 | 3089.52 | 3095.74 | 3090.75 |
| Max | 3089.71 | 3131.03 | 3208.63 | 3090.47 | 3094.43 | 3221.35 | 3219.83 | 3089.52 | 3193.05 | 3095.98 | |
| Std | 0.82 | 8.74 | 27.44 | 0.25 | 4.22 | 35.35 | 30.88 | 0.18 | 22.92 | 2.38 | |
| Min | 2800.00 | 3100.00 | 3100.00 | 3172.85 | 3100.18 | 3100.40 | 3101.60 | 3100.00 | 3100.00 | 3100.00 | |
| Mean | 3200.01 | 3310.54 | 3199.33 | 3236.69 | 3235.88 | 3403.55 | 3337.01 | 3214.03 | 3330.47 | 3100.00 | |
| CEC_17/28 | Median | 3100.00 | 3383.75 | 3100.00 | 3210.61 | 3222.55 | 3411.82 | 3383.87 | 3100.00 | 3402.69 | 3100.00 |
| Max | 3411.82 | 3411.82 | 3444.13 | 3411.82 | 3300.00 | 3749.37 | 3501.44 | 3411.82 | 3411.82 | 3100.00 | |
| Std | 158.46 | 124.69 | 135.72 | 66.54 | 64.23 | 185.04 | 115.05 | 145.87 | 120.05 | 0.00 | |
| Min | 3129.61 | 3145.87 | 3148.21 | 3145.35 | 3137.22 | 3156.68 | 3160.31 | 3128.05 | 3145.56 | 3128.28 | |
| Mean | 3140.45 | 3233.85 | 3212.09 | 3161.97 | 3175.42 | 3308.50 | 3300.66 | 3138.34 | 3234.63 | 3132.96 | |
| CEC_17/29 | Median | 3137.70 | 3226.35 | 3199.64 | 3161.65 | 3168.03 | 3300.99 | 3294.46 | 3138.01 | 3224.14 | 3132.98 |
| Max | 3174.45 | 3412.72 | 3331.33 | 3178.83 | 3300.25 | 3473.89 | 3479.31 | 3154.30 | 3359.96 | 3139.27 | |
| Std | 9.88 | 58.82 | 45.48 | 7.60 | 30.91 | 77.33 | 75.93 | 5.89 | 55.10 | 2.43 | |
| Min | 3408.33 | 4296.06 | 3762.14 | 4657.82 | 4676.02 | 6296.85 | 4838.12 | 3394.50 | 3416.36 | 3394.50 | |
| Mean | 3451.00 | 150294.12 | 167688.20 | 17934.90 | 24185.38 | 564983.34 | 527231.40 | 99555.88 | 395498.50 | 3409.27 | |
| CEC_17/30 | Median | 3454.01 | 16180.83 | 6759.34 | 13574.83 | 15177.31 | 220962.22 | 121932.13 | 3442.66 | 3729.03 | 3407.44 |
| Max | 3503.40 | 1237436.14 | 1261343.43 | 67896.82 | 168236.16 | 2136927.89 | 4219938.92 | 820578.06 | 1827680.48 | 3600.49 | |
| Std | 23.51 | 345469.25 | 359033.99 | 12874.06 | 27828.94 | 630800.00 | 851685.44 | 265899.84 | 540967.78 | 31.24 |
Figure A11.
Comparison of Friedman ranking for PCOA and other algorithms using the 50D CEC2017 benchmark functions over 51 independent runs and 500,000 NFES.
Figure A11.
Comparison of Friedman ranking for PCOA and other algorithms using the 50D CEC2017 benchmark functions over 51 independent runs and 500,000 NFES.

Table A5.
Statistical criteria results of PCOA and other algorithms on the 30D CEC2017, over 51 independent runs.
Table A5.
Statistical criteria results of PCOA and other algorithms on the 30D CEC2017, over 51 independent runs.
| Function | PCOA | AVOA | PSO | DE | RW_GWO | WOA | HHO | LSHADE | GBO | EBOwithCMAR | |
|---|---|---|---|---|---|---|---|---|---|---|---|
| Min | 100.00 | 102.98 | 106.52 | 212.81 | 38377.90 | 665661.68 | 4499846.11 | 100.00 | 100.01 | 100.00 | |
| Mean | 100.00 | 4224.24 | 4050.68 | 1000.45 | 5136068.49 | 2268995.66 | 8054047.76 | 100.00 | 357.29 | 100.00 | |
| CEC_17/01 | Median | 100.00 | 2025.53 | 1986.28 | 587.59 | 3818964.65 | 1898323.36 | 8009196.91 | 100.00 | 156.76 | 100.00 |
| Max | 100.00 | 19388.31 | 18359.26 | 5040.67 | 33430312.04 | 6686501.55 | 12662974.38 | 100.00 | 3532.36 | 100.00 | |
| Std | 0.00 | 5616.02 | 4865.16 | 1056.94 | 5856386.97 | 1315520.78 | 1815136.59 | 0.00 | 575.82 | 0.00 | |
| Min | 300.00 | 300.00 | 300.00 | 47264.28 | 405.55 | 39936.40 | 462.04 | 300.00 | 300.00 | 300.00 | |
| Mean | 300.00 | 302.89 | 300.00 | 77421.16 | 1925.99 | 167967.21 | 973.16 | 300.00 | 300.00 | 300.00 | |
| CEC_17/03 | Median | 300.00 | 300.00 | 300.00 | 78391.28 | 1336.95 | 168353.99 | 906.63 | 300.00 | 300.00 | 300.00 |
| Max | 300.00 | 373.48 | 300.00 | 98397.77 | 6154.85 | 367619.37 | 2557.15 | 300.00 | 300.00 | 300.00 | |
| Std | 0.00 | 14.40 | 0.00 | 10561.32 | 1520.83 | 75225.44 | 378.24 | 0.00 | 0.00 | 0.00 | |
| Min | 400.00 | 400.73 | 400.00 | 487.35 | 440.77 | 483.63 | 440.26 | 400.00 | 400.03 | 400.00 | |
| Mean | 400.39 | 489.19 | 436.16 | 488.98 | 483.89 | 553.91 | 515.69 | 455.23 | 434.55 | 445.44 | |
| CEC_17/04 | Median | 400.00 | 488.35 | 447.78 | 488.68 | 486.23 | 547.25 | 519.29 | 458.56 | 404.44 | 458.56 |
| Max | 403.99 | 534.77 | 487.59 | 493.69 | 593.64 | 675.67 | 633.33 | 464.12 | 510.29 | 467.90 | |
| Std | 1.20 | 25.08 | 30.71 | 1.24 | 36.46 | 43.13 | 30.06 | 13.97 | 36.26 | 26.25 | |
| Min | 500.99 | 621.38 | 552.73 | 607.68 | 561.60 | 630.76 | 649.15 | 508.25 | 577.61 | 503.98 | |
| Mean | 506.63 | 699.67 | 617.07 | 629.22 | 655.14 | 768.39 | 716.81 | 515.22 | 644.09 | 514.29 | |
| CEC_17/05 | Median | 506.96 | 701.06 | 611.44 | 629.25 | 654.70 | 768.62 | 718.20 | 515.14 | 647.25 | 514.92 |
| Max | 512.93 | 793.51 | 685.06 | 649.54 | 697.00 | 904.92 | 793.23 | 522.55 | 750.73 | 519.90 | |
| Std | 2.63 | 38.33 | 28.97 | 8.97 | 23.45 | 53.97 | 30.14 | 3.04 | 37.53 | 3.40 | |
| Min | 600.00 | 617.78 | 600.35 | 600.00 | 600.09 | 642.00 | 632.14 | 600.00 | 601.49 | 600.00 | |
| Mean | 600.00 | 631.03 | 619.54 | 600.00 | 600.61 | 668.05 | 656.41 | 600.00 | 618.86 | 600.00 | |
| CEC_17/06 | Median | 600.00 | 630.55 | 618.99 | 600.00 | 600.53 | 667.82 | 657.00 | 600.00 | 615.65 | 600.00 |
| Max | 600.00 | 645.96 | 648.00 | 600.00 | 601.68 | 692.51 | 671.42 | 600.00 | 645.56 | 600.00 | |
| Std | 0.00 | 7.36 | 11.05 | 0.00 | 0.39 | 10.07 | 7.85 | 0.00 | 9.99 | 0.00 | |
| Min | 733.09 | 890.89 | 782.91 | 832.55 | 771.27 | 970.15 | 1044.04 | 740.79 | 814.63 | 733.71 | |
| Mean | 736.96 | 1062.40 | 819.56 | 865.42 | 827.69 | 1219.07 | 1200.22 | 744.47 | 911.64 | 739.01 | |
| CEC_17/07 | Median | 736.22 | 1066.84 | 815.21 | 867.17 | 808.97 | 1227.84 | 1205.24 | 744.41 | 903.90 | 737.41 |
| Max | 757.78 | 1195.42 | 873.22 | 880.81 | 948.63 | 1437.82 | 1317.70 | 749.17 | 1049.18 | 747.06 | |
| Std | 3.91 | 69.18 | 22.38 | 8.85 | 47.23 | 113.93 | 58.39 | 2.11 | 53.20 | 4.08 | |
| Min | 802.98 | 891.92 | 849.75 | 897.53 | 851.84 | 918.73 | 889.65 | 808.37 | 866.66 | 803.98 | |
| Mean | 807.14 | 952.39 | 898.01 | 931.39 | 950.07 | 1001.24 | 948.79 | 815.83 | 929.93 | 814.79 | |
| CEC_17/08 | Median | 806.96 | 951.23 | 893.53 | 931.45 | 954.46 | 988.21 | 945.44 | 816.16 | 931.33 | 815.92 |
| Max | 810.94 | 1029.83 | 948.25 | 949.73 | 1007.11 | 1127.57 | 1002.39 | 826.00 | 994.02 | 820.89 | |
| Std | 1.93 | 27.01 | 23.36 | 10.01 | 28.89 | 50.08 | 27.20 | 3.37 | 28.61 | 3.77 | |
| Min | 900.00 | 3304.25 | 942.75 | 900.00 | 900.85 | 4045.01 | 4192.92 | 900.00 | 1269.23 | 900.00 | |
| Mean | 900.00 | 4960.05 | 2376.94 | 900.00 | 1072.20 | 7624.71 | 5741.65 | 900.04 | 2415.88 | 900.00 | |
| CEC_17/09 | Median | 900.00 | 4965.89 | 2556.07 | 900.00 | 950.54 | 6605.28 | 5746.24 | 900.00 | 2223.02 | 900.00 |
| Max | 900.00 | 8133.58 | 4931.76 | 900.00 | 3758.81 | 19864.97 | 7353.05 | 900.45 | 4728.04 | 900.00 | |
| Std | 0.00 | 875.03 | 798.98 | 0.00 | 428.97 | 3182.47 | 627.85 | 0.09 | 827.60 | 0.00 | |
| Min | 2814.56 | 3600.94 | 3151.84 | 5570.60 | 5449.52 | 4456.07 | 3353.79 | 1959.27 | 3550.19 | 1915.75 | |
| Mean | 3544.44 | 5250.50 | 4603.72 | 6250.93 | 6555.74 | 5940.29 | 5328.90 | 2639.91 | 4875.87 | 2572.14 | |
| CEC_17/10 | Median | 3520.11 | 5250.54 | 4570.15 | 6264.21 | 6562.91 | 6004.70 | 5343.33 | 2694.72 | 4835.05 | 2618.47 |
| Max | 4172.49 | 7671.22 | 5857.98 | 6874.20 | 7815.49 | 7265.31 | 6930.96 | 3075.74 | 6876.76 | 2978.07 | |
| Std | 358.80 | 721.49 | 665.92 | 302.42 | 608.37 | 719.10 | 662.72 | 266.31 | 660.29 | 268.76 | |
| Min | 1100.00 | 1149.29 | 1156.91 | 1172.03 | 1137.22 | 1291.20 | 1154.68 | 1105.97 | 1119.91 | 1101.99 | |
| Mean | 1104.90 | 1227.75 | 1211.95 | 1211.34 | 1236.15 | 1492.07 | 1251.09 | 1129.86 | 1228.93 | 1111.86 | |
| CEC_17/11 | Median | 1103.98 | 1229.11 | 1206.54 | 1212.00 | 1227.70 | 1466.25 | 1256.38 | 1121.90 | 1229.36 | 1108.95 |
| Max | 1112.93 | 1314.20 | 1331.11 | 1230.11 | 1349.63 | 1706.81 | 1391.59 | 1181.87 | 1336.77 | 1168.93 | |
| Std | 2.60 | 40.64 | 38.37 | 12.62 | 53.21 | 106.58 | 47.02 | 23.32 | 51.24 | 14.52 | |
| Min | 1204.05 | 120736.43 | 3476.54 | 1928477.57 | 377318.88 | 2378332.84 | 1302535.90 | 1667.76 | 3327.10 | 1559.83 | |
| Mean | 1395.63 | 1100703.62 | 24088.16 | 4790126.13 | 9559114.35 | 44028601.18 | 8155343.18 | 2388.74 | 25753.76 | 2262.83 | |
| CEC_17/12 | Median | 1352.02 | 809576.42 | 23307.24 | 4514042.73 | 4376168.29 | 38116682.71 | 8424103.30 | 2338.33 | 22029.89 | 2236.68 |
| Max | 1816.58 | 3563762.94 | 54707.01 | 9741650.12 | 59516470.09 | 136707295.16 | 19384765.91 | 3368.97 | 61419.69 | 3222.54 | |
| Std | 133.06 | 748699.40 | 11032.90 | 1613361.15 | 12304373.82 | 29508877.67 | 4214263.45 | 399.49 | 15347.92 | 362.11 | |
| Min | 1312.81 | 7660.82 | 1343.03 | 30473.74 | 35773.36 | 30091.76 | 35522.10 | 1305.97 | 1408.25 | 1303.00 | |
| Mean | 1344.16 | 28911.06 | 16171.10 | 146726.65 | 980345.93 | 144160.58 | 206240.87 | 1350.26 | 9108.23 | 1323.80 | |
| CEC_17/13 | Median | 1341.27 | 25854.18 | 7967.07 | 133370.81 | 136741.35 | 123359.28 | 163679.27 | 1334.62 | 5430.03 | 1321.78 |
| Max | 1401.83 | 80043.26 | 62326.73 | 354936.28 | 7774765.83 | 384604.94 | 784358.31 | 1910.22 | 36223.86 | 1391.54 | |
| Std | 17.02 | 14649.55 | 16821.97 | 69413.70 | 1848724.45 | 87239.35 | 151738.41 | 83.12 | 8514.52 | 13.01 | |
| Min | 1423.98 | 2199.83 | 1638.88 | 11935.62 | 1715.83 | 23294.09 | 1947.64 | 1422.12 | 1520.90 | 1420.04 | |
| Mean | 1432.19 | 19239.67 | 4163.46 | 53701.50 | 31337.86 | 955063.45 | 29981.07 | 1428.79 | 1684.61 | 1427.89 | |
| CEC_17/14 | Median | 1430.95 | 12833.49 | 3348.02 | 47578.41 | 31225.57 | 463613.62 | 15836.48 | 1427.00 | 1668.28 | 1427.27 |
| Max | 1446.87 | 58848.90 | 11083.32 | 138042.59 | 113684.69 | 3824324.28 | 182969.26 | 1450.91 | 1893.95 | 1437.93 | |
| Std | 5.38 | 16640.26 | 2309.51 | 25009.51 | 25513.18 | 1088994.45 | 36465.09 | 5.08 | 77.56 | 3.77 | |
| Min | 1502.43 | 2526.12 | 1671.24 | 4990.13 | 12331.29 | 6749.46 | 7755.33 | 1504.08 | 1609.74 | 1503.06 | |
| Mean | 1508.54 | 14482.50 | 11147.89 | 18124.53 | 54752.89 | 64357.96 | 49555.97 | 1525.09 | 4791.77 | 1511.50 | |
| CEC_17/15 | Median | 1507.47 | 10159.23 | 7065.03 | 14642.30 | 38400.49 | 51815.01 | 36241.07 | 1518.17 | 2776.77 | 1510.30 |
| Max | 1531.31 | 45212.56 | 42505.78 | 51425.50 | 174560.03 | 264670.50 | 330469.83 | 1620.85 | 34792.95 | 1534.86 | |
| Std | 5.02 | 11175.95 | 10247.63 | 11210.95 | 38705.50 | 47347.85 | 50979.42 | 22.68 | 5478.39 | 6.02 | |
| Min | 1618.63 | 2001.29 | 2080.19 | 1858.60 | 1757.82 | 2628.65 | 2342.21 | 1629.54 | 1967.64 | 1602.80 | |
| Mean | 2007.96 | 2766.62 | 2573.18 | 2219.25 | 2470.15 | 3470.23 | 3077.23 | 1845.49 | 2651.18 | 1728.31 | |
| CEC_17/16 | Median | 2007.61 | 2775.27 | 2563.02 | 2207.27 | 2502.98 | 3499.70 | 3056.74 | 1866.02 | 2636.80 | 1729.03 |
| Max | 2402.45 | 3560.38 | 3372.83 | 2461.32 | 3174.82 | 4992.73 | 3846.58 | 2092.32 | 3280.31 | 1978.39 | |
| Std | 178.70 | 350.94 | 292.69 | 128.78 | 335.57 | 503.71 | 350.49 | 123.12 | 316.06 | 107.19 | |
| Min | 1728.72 | 1785.89 | 1773.35 | 1804.48 | 1763.58 | 1996.83 | 1925.65 | 1723.09 | 1827.40 | 1710.19 | |
| Mean | 1756.85 | 2374.58 | 2160.49 | 1872.42 | 1944.33 | 2505.29 | 2479.08 | 1750.36 | 2267.10 | 1732.73 | |
| CEC_17/17 | Median | 1748.28 | 2409.20 | 2160.03 | 1869.52 | 1908.98 | 2522.54 | 2417.80 | 1748.21 | 2251.78 | 1735.06 |
| Max | 1894.07 | 2974.73 | 2670.06 | 1957.60 | 2559.81 | 2965.75 | 3196.54 | 1862.02 | 2785.67 | 1748.07 | |
| Std | 32.24 | 248.37 | 186.86 | 37.72 | 137.17 | 260.12 | 297.26 | 19.68 | 203.65 | 9.05 | |
| Min | 1834.13 | 31369.81 | 9221.01 | 139286.37 | 58623.46 | 106357.24 | 44349.37 | 1821.42 | 2697.75 | 1823.29 | |
| Mean | 1850.49 | 196418.28 | 81372.01 | 434267.58 | 426071.81 | 2378285.00 | 551704.58 | 1870.87 | 17325.42 | 1843.23 | |
| CEC_17/18 | Median | 1849.17 | 151462.26 | 69280.04 | 394068.42 | 313723.60 | 1407405.99 | 418531.59 | 1851.22 | 14203.73 | 1836.22 |
| Max | 1870.95 | 700979.12 | 205596.08 | 1030494.17 | 2123401.96 | 11153514.86 | 2187907.17 | 2228.37 | 65205.56 | 1931.80 | |
| Std | 8.35 | 153670.44 | 41025.70 | 198408.22 | 378599.12 | 2670246.23 | 522709.93 | 66.95 | 14492.49 | 22.00 | |
| Min | 1908.10 | 2198.05 | 2004.66 | 6791.08 | 8940.79 | 305811.87 | 20034.00 | 1904.56 | 1937.65 | 1904.79 | |
| Mean | 1916.22 | 13104.75 | 8094.25 | 20373.55 | 119739.32 | 3042004.00 | 167480.21 | 1914.71 | 2476.18 | 1913.38 | |
| CEC_17/19 | Median | 1916.15 | 9274.25 | 4551.45 | 18876.17 | 74442.16 | 2511558.92 | 159769.80 | 1911.43 | 2105.42 | 1911.50 |
| Max | 1925.30 | 52272.64 | 35267.60 | 64664.69 | 663763.90 | 12760968.24 | 406243.80 | 1951.43 | 8195.16 | 1937.99 | |
| Std | 3.49 | 12669.47 | 8101.85 | 10908.20 | 123601.86 | 2539552.67 | 107615.39 | 9.71 | 1142.17 | 6.30 | |
| Min | 2027.65 | 2114.61 | 2207.68 | 2049.38 | 2131.39 | 2342.07 | 2263.56 | 2030.19 | 2123.39 | 2017.40 | |
| Mean | 2090.19 | 2545.71 | 2463.99 | 2147.24 | 2370.87 | 2697.81 | 2664.92 | 2078.53 | 2431.03 | 2062.60 | |
| CEC_17/20 | Median | 2060.46 | 2542.39 | 2458.83 | 2128.83 | 2344.58 | 2694.95 | 2671.11 | 2048.39 | 2437.53 | 2041.63 |
| Max | 2217.96 | 2923.51 | 3070.79 | 2268.86 | 2730.48 | 3198.92 | 3144.70 | 2175.35 | 2818.73 | 2163.91 | |
| Std | 59.01 | 183.45 | 184.22 | 55.23 | 137.49 | 201.51 | 206.20 | 54.18 | 178.13 | 45.71 | |
| Min | 2200.00 | 2392.67 | 2345.60 | 2404.06 | 2342.50 | 2468.86 | 2398.43 | 2310.30 | 2356.23 | 2302.99 | |
| Mean | 2308.83 | 2480.64 | 2406.29 | 2432.32 | 2441.72 | 2559.22 | 2522.68 | 2316.63 | 2415.63 | 2312.41 | |
| CEC_17/21 | Median | 2309.60 | 2486.59 | 2398.34 | 2434.47 | 2443.02 | 2548.67 | 2519.62 | 2316.61 | 2417.02 | 2313.57 |
| Max | 2324.63 | 2594.28 | 2488.09 | 2449.46 | 2481.53 | 2686.51 | 2667.02 | 2322.08 | 2495.22 | 2320.12 | |
| Std | 16.27 | 50.71 | 34.36 | 9.60 | 22.67 | 57.94 | 51.96 | 2.64 | 33.89 | 4.77 | |
| Min | 2300.00 | 2300.00 | 2300.00 | 2559.60 | 2310.52 | 2314.49 | 2316.49 | 2300.00 | 2300.00 | 2300.00 | |
| Mean | 2300.00 | 5217.29 | 3636.20 | 3254.76 | 6084.43 | 6341.02 | 4902.78 | 2300.00 | 3254.30 | 2300.00 | |
| CEC_17/22 | Median | 2300.00 | 6308.16 | 2302.45 | 3225.11 | 7258.64 | 7314.27 | 6042.55 | 2300.00 | 2302.46 | 2300.00 |
| Max | 2300.00 | 8175.04 | 7606.95 | 4246.95 | 8508.85 | 8811.62 | 7858.86 | 2300.00 | 7977.74 | 2300.00 | |
| Std | 0.00 | 2129.19 | 2039.38 | 333.78 | 2506.43 | 2318.24 | 2321.01 | 0.00 | 1759.59 | 0.00 | |
| Min | 2644.69 | 2788.25 | 2715.95 | 2747.63 | 2704.46 | 2847.34 | 2914.39 | 2650.05 | 2713.95 | 2652.03 | |
| Mean | 2660.84 | 2897.02 | 2826.55 | 2779.46 | 2811.14 | 3055.07 | 3048.60 | 2665.11 | 2788.20 | 2660.83 | |
| CEC_17/23 | Median | 2658.62 | 2898.06 | 2827.39 | 2780.46 | 2811.92 | 3062.16 | 3032.12 | 2665.80 | 2789.27 | 2660.63 |
| Max | 2679.33 | 3024.60 | 2983.14 | 2795.50 | 2863.25 | 3334.17 | 3247.26 | 2674.96 | 2914.16 | 2671.19 | |
| Std | 9.14 | 63.75 | 47.59 | 9.37 | 24.68 | 102.82 | 78.36 | 5.02 | 43.80 | 4.34 | |
| Min | 2826.46 | 2951.23 | 2895.97 | 2955.73 | 2924.29 | 2972.52 | 3041.84 | 2828.20 | 2880.57 | 2600.00 | |
| Mean | 2836.71 | 3114.91 | 2990.45 | 2983.34 | 2968.64 | 3155.93 | 3345.31 | 2835.97 | 2949.61 | 2826.84 | |
| CEC_17/24 | Median | 2832.99 | 3111.11 | 2985.80 | 2984.03 | 2968.28 | 3157.83 | 3364.12 | 2835.73 | 2943.68 | 2831.60 |
| Max | 2853.29 | 3326.07 | 3134.56 | 3002.68 | 3018.77 | 3354.54 | 3641.83 | 2845.93 | 3084.74 | 2841.04 | |
| Std | 7.53 | 83.47 | 56.86 | 10.30 | 17.92 | 94.77 | 131.14 | 3.33 | 44.55 | 32.59 | |
| Min | 2883.39 | 2883.83 | 2883.48 | 2887.08 | 2884.17 | 2889.25 | 2884.33 | 2886.74 | 2883.72 | 2883.61 | |
| Mean | 2883.84 | 2900.64 | 2891.52 | 2887.33 | 2903.82 | 2938.48 | 2907.97 | 2886.84 | 2896.51 | 2886.65 | |
| CEC_17/25 | Median | 2883.44 | 2890.40 | 2887.94 | 2887.36 | 2904.20 | 2944.49 | 2908.69 | 2886.83 | 2889.71 | 2886.79 |
| Max | 2887.12 | 2945.48 | 2941.42 | 2887.62 | 2940.71 | 2978.91 | 2950.68 | 2887.06 | 2940.78 | 2888.37 | |
| Std | 1.12 | 17.75 | 10.54 | 0.10 | 10.74 | 25.17 | 17.57 | 0.07 | 15.18 | 0.79 | |
| Min | 2800.00 | 2900.00 | 2800.00 | 4746.81 | 2901.70 | 3815.79 | 2864.07 | 3595.14 | 2800.00 | 2800.00 | |
| Mean | 3351.93 | 6193.00 | 4548.70 | 4931.23 | 5181.01 | 7397.92 | 6699.50 | 3691.92 | 4917.60 | 3544.95 | |
| CEC_17/26 | Median | 3590.58 | 6421.87 | 4980.99 | 4936.54 | 5244.56 | 7545.58 | 6956.79 | 3688.00 | 5152.93 | 3589.33 |
| Max | 3996.54 | 8311.80 | 6911.57 | 5071.31 | 5868.04 | 9707.03 | 8755.10 | 3796.25 | 7554.15 | 3760.51 | |
| Std | 460.33 | 1185.95 | 1350.94 | 66.71 | 443.32 | 1282.68 | 1294.23 | 48.29 | 1152.94 | 221.23 | |
| Min | 3180.61 | 3209.05 | 3204.78 | 3201.77 | 3161.41 | 3251.25 | 3221.17 | 3181.59 | 3208.95 | 3182.53 | |
| Mean | 3200.89 | 3271.09 | 3249.76 | 3209.04 | 3198.05 | 3367.50 | 3312.66 | 3205.39 | 3248.64 | 3205.07 | |
| CEC_17/27 | Median | 3201.75 | 3259.92 | 3244.79 | 3209.00 | 3200.01 | 3342.96 | 3299.11 | 3206.41 | 3243.92 | 3205.45 |
| Max | 3230.25 | 3416.33 | 3330.63 | 3213.64 | 3200.01 | 3696.48 | 3522.39 | 3224.62 | 3342.70 | 3226.91 | |
| Std | 9.43 | 39.14 | 28.08 | 2.47 | 8.11 | 90.82 | 64.17 | 8.24 | 30.46 | 6.98 | |
| Min | 3100.00 | 3100.00 | 3100.00 | 3208.26 | 3289.66 | 3236.60 | 3111.29 | 3100.00 | 3100.00 | 3100.00 | |
| Mean | 3100.00 | 3206.95 | 3141.43 | 3224.35 | 3299.80 | 3302.67 | 3241.66 | 3139.95 | 3133.20 | 3111.33 | |
| CEC_17/28 | Median | 3100.00 | 3209.17 | 3100.00 | 3221.75 | 3300.01 | 3298.13 | 3251.39 | 3100.00 | 3100.00 | 3100.00 |
| Max | 3100.00 | 3266.64 | 3260.11 | 3265.69 | 3300.01 | 3498.62 | 3285.49 | 3266.64 | 3261.85 | 3253.93 | |
| Std | 0.00 | 42.59 | 57.89 | 11.09 | 1.45 | 44.02 | 29.58 | 55.62 | 55.95 | 35.25 | |
| Min | 3281.91 | 3443.19 | 3371.87 | 3473.61 | 3377.66 | 3895.34 | 3526.75 | 3288.74 | 3510.59 | 3278.90 | |
| Mean | 3451.27 | 4013.32 | 3779.36 | 3638.74 | 3710.66 | 4745.22 | 4261.91 | 3358.02 | 3948.38 | 3338.64 | |
| CEC_17/29 | Median | 3428.50 | 4071.52 | 3745.07 | 3642.60 | 3729.95 | 4721.59 | 4274.94 | 3359.23 | 3908.64 | 3335.43 |
| Max | 3661.95 | 4603.29 | 4388.51 | 3799.41 | 4104.16 | 5734.41 | 4883.95 | 3453.61 | 4438.80 | 3444.73 | |
| Std | 81.12 | 270.07 | 227.78 | 78.59 | 192.77 | 358.21 | 280.45 | 24.36 | 232.72 | 23.70 | |
| Min | 5159.96 | 10476.10 | 5310.53 | 10044.83 | 177700.27 | 667293.22 | 162969.89 | 4941.81 | 5069.54 | 4984.43 | |
| Mean | 5543.69 | 28572.87 | 8248.09 | 24304.51 | 919685.11 | 9513847.27 | 885053.81 | 5088.99 | 7536.31 | 5131.40 | |
| CEC_17/30 | Median | 5536.86 | 27824.48 | 6880.08 | 23438.21 | 684404.15 | 8068347.15 | 858471.02 | 5052.27 | 6953.51 | 5078.41 |
| Max | 5845.63 | 57458.41 | 16725.47 | 42467.45 | 3166194.32 | 30866546.23 | 2056085.10 | 6146.01 | 14109.65 | 5879.85 | |
| Std | 137.41 | 11102.58 | 2882.37 | 6656.45 | 658333.94 | 6809939.36 | 387608.27 | 181.57 | 2052.50 | 157.63 |
Figure A12.
Comparison of Wilcoxon test for PCOA and other algorithms using the 100D CEC2017 benchmark functions over 51 independent runs and 1,000,000 NFES.
Figure A12.
Comparison of Wilcoxon test for PCOA and other algorithms using the 100D CEC2017 benchmark functions over 51 independent runs and 1,000,000 NFES.

Table A6.
Statistical criteria results of PCOA and other algorithms on the 50D CEC2017, over 51 independent runs.
Table A6.
Statistical criteria results of PCOA and other algorithms on the 50D CEC2017, over 51 independent runs.
| Function | PCOA | AVOA | PSO | DE | RW_GWO | WOA | HHO | LSHADE | GBO | EBOwithCMAR | |
|---|---|---|---|---|---|---|---|---|---|---|---|
| Min | 100.00 | 100.17 | 100.00 | 605.87 | 1670157.63 | 1684606.05 | 22820942.68 | 100.00 | 100.17 | 100.00 | |
| Mean | 100.00 | 4577.60 | 4447.91 | 8518.81 | 47380363.48 | 8174316.10 | 33116463.10 | 100.00 | 3289.60 | 100.00 | |
| CEC_17/01 | Median | 100.00 | 3236.96 | 2371.44 | 6211.29 | 44898327.03 | 6977503.00 | 31911908.27 | 100.00 | 1947.05 | 100.00 |
| Max | 100.01 | 18512.74 | 24284.22 | 49166.80 | 128007344.64 | 25573323.10 | 48631908.15 | 100.00 | 18347.79 | 100.00 | |
| Std | 0.00 | 4578.47 | 6185.88 | 8557.35 | 28212702.75 | 5530006.96 | 5719541.68 | 0.00 | 3661.13 | 0.00 | |
| Min | 300.00 | 306.20 | 1228.41 | 137505.56 | 1431.51 | 28954.53 | 1311.27 | 300.00 | 300.00 | 300.00 | |
| Mean | 300.00 | 998.55 | 5926.34 | 195430.08 | 14082.67 | 78789.73 | 2653.51 | 300.00 | 300.15 | 300.00 | |
| CEC_17/03 | Median | 300.00 | 684.57 | 5042.26 | 197005.47 | 12760.09 | 66596.15 | 2586.33 | 300.00 | 300.05 | 300.00 |
| Max | 300.00 | 4739.99 | 13706.63 | 230895.63 | 27996.63 | 202623.84 | 5566.20 | 300.00 | 302.35 | 300.00 | |
| Std | 0.00 | 998.83 | 3439.55 | 18389.98 | 6070.63 | 38408.67 | 931.04 | 0.00 | 0.36 | 0.00 | |
| Min | 400.00 | 403.99 | 400.15 | 504.27 | 469.50 | 566.49 | 453.15 | 400.00 | 400.16 | 400.00 | |
| Mean | 400.08 | 523.82 | 482.14 | 538.89 | 595.10 | 685.88 | 622.07 | 455.45 | 475.90 | 434.26 | |
| CEC_17/04 | Median | 400.00 | 541.42 | 497.41 | 530.26 | 598.10 | 684.39 | 623.37 | 428.51 | 475.35 | 428.51 |
| Max | 403.99 | 618.09 | 553.03 | 617.55 | 693.39 | 958.28 | 791.56 | 542.31 | 563.58 | 542.31 | |
| Std | 0.56 | 50.54 | 41.67 | 26.78 | 52.87 | 66.72 | 59.94 | 52.55 | 47.77 | 43.49 | |
| Min | 508.95 | 720.88 | 638.30 | 782.97 | 619.14 | 806.99 | 788.76 | 520.15 | 705.96 | 524.87 | |
| Mean | 515.24 | 830.73 | 721.98 | 816.85 | 848.03 | 920.24 | 861.84 | 532.98 | 793.92 | 534.24 | |
| CEC_17/05 | Median | 514.92 | 837.46 | 716.90 | 818.73 | 862.98 | 903.70 | 867.18 | 533.17 | 797.49 | 533.83 |
| Max | 523.88 | 920.86 | 825.35 | 845.72 | 922.78 | 1160.48 | 920.32 | 548.38 | 891.01 | 548.75 | |
| Std | 3.52 | 41.21 | 41.75 | 15.95 | 70.25 | 75.42 | 30.98 | 4.91 | 39.88 | 4.70 | |
| Min | 600.00 | 628.26 | 612.56 | 600.00 | 600.42 | 657.25 | 648.98 | 600.00 | 618.75 | 600.00 | |
| Mean | 600.00 | 636.55 | 635.33 | 600.00 | 602.59 | 675.59 | 667.58 | 600.00 | 636.30 | 600.00 | |
| CEC_17/06 | Median | 600.00 | 635.10 | 636.33 | 600.00 | 602.01 | 672.95 | 667.40 | 600.00 | 636.14 | 600.00 |
| Max | 600.00 | 653.38 | 649.77 | 600.00 | 609.63 | 699.53 | 678.32 | 600.00 | 662.69 | 600.00 | |
| Std | 0.00 | 6.11 | 8.05 | 0.00 | 1.85 | 10.19 | 5.48 | 0.00 | 9.58 | 0.00 | |
| Min | 757.08 | 1241.20 | 856.68 | 1010.87 | 875.15 | 1209.27 | 1525.98 | 771.21 | 1020.05 | 772.87 | |
| Mean | 767.65 | 1445.83 | 964.49 | 1073.10 | 946.70 | 1689.24 | 1714.36 | 782.10 | 1227.97 | 781.21 | |
| CEC_17/07 | Median | 766.49 | 1445.43 | 954.03 | 1074.41 | 937.93 | 1673.31 | 1718.57 | 781.79 | 1218.88 | 781.85 |
| Max | 805.23 | 1638.29 | 1087.63 | 1096.50 | 1142.95 | 1998.46 | 1902.58 | 791.55 | 1463.82 | 792.71 | |
| Std | 7.86 | 106.54 | 47.99 | 13.89 | 49.87 | 133.97 | 96.50 | 4.46 | 111.88 | 4.02 | |
| Min | 808.95 | 1034.81 | 963.17 | 1090.66 | 909.96 | 1069.19 | 1067.37 | 824.24 | 968.15 | 825.87 | |
| Mean | 816.68 | 1139.65 | 1045.09 | 1116.78 | 1136.92 | 1207.07 | 1155.61 | 831.90 | 1097.32 | 834.57 | |
| CEC_17/08 | Median | 816.91 | 1140.27 | 1036.80 | 1116.47 | 1148.04 | 1205.91 | 1162.08 | 831.30 | 1092.52 | 833.83 |
| Max | 826.86 | 1248.21 | 1151.22 | 1141.02 | 1223.58 | 1360.98 | 1230.03 | 845.41 | 1204.35 | 848.75 | |
| Std | 3.98 | 43.45 | 44.20 | 11.75 | 78.35 | 70.14 | 37.00 | 4.30 | 55.07 | 4.62 | |
| Min | 900.00 | 10019.08 | 2530.20 | 900.00 | 1045.18 | 11991.17 | 11841.15 | 900.00 | 2861.72 | 900.00 | |
| Mean | 900.00 | 12890.15 | 7678.15 | 900.48 | 3808.95 | 20535.21 | 16271.33 | 901.10 | 7060.11 | 900.64 | |
| CEC_17/09 | Median | 900.00 | 12782.68 | 7372.11 | 900.03 | 3013.66 | 19032.21 | 15672.13 | 900.81 | 6799.83 | 900.54 |
| Max | 900.00 | 16395.42 | 14306.88 | 902.98 | 15843.34 | 45133.38 | 21972.05 | 906.90 | 12180.18 | 902.73 | |
| Std | 0.00 | 1472.61 | 2319.52 | 0.82 | 2634.10 | 6412.27 | 2072.99 | 1.29 | 2249.90 | 0.64 | |
| Min | 3332.50 | 6042.83 | 5546.07 | 11154.90 | 9856.37 | 7707.26 | 6220.21 | 3652.64 | 4825.42 | 3136.77 | |
| Mean | 5130.57 | 8087.00 | 7460.04 | 12207.68 | 12087.03 | 9816.14 | 8451.49 | 4353.74 | 7772.80 | 4069.16 | |
| CEC_17/10 | Median | 5145.32 | 8070.98 | 7405.04 | 12224.63 | 12122.56 | 10113.93 | 8472.94 | 4346.98 | 7710.24 | 4100.14 |
| Max | 6544.60 | 10039.90 | 10672.11 | 12727.89 | 14207.41 | 12600.48 | 11624.49 | 4918.79 | 10282.92 | 4622.84 | |
| Std | 611.83 | 835.46 | 1039.71 | 312.87 | 753.10 | 1209.41 | 1105.83 | 283.20 | 961.84 | 387.44 | |
| Min | 1122.24 | 1215.29 | 1195.81 | 1264.32 | 1228.31 | 1357.63 | 1286.76 | 1166.02 | 1263.53 | 1146.76 | |
| Mean | 1130.44 | 1326.52 | 1271.23 | 1286.75 | 1324.45 | 1567.94 | 1401.06 | 1233.41 | 1371.14 | 1185.64 | |
| CEC_17/11 | Median | 1130.20 | 1324.32 | 1257.56 | 1287.50 | 1327.23 | 1550.88 | 1388.34 | 1226.71 | 1364.97 | 1182.88 |
| Max | 1137.17 | 1502.39 | 1350.09 | 1309.98 | 1541.03 | 1837.24 | 1645.54 | 1317.20 | 1499.33 | 1236.66 | |
| Std | 3.31 | 60.99 | 39.84 | 11.89 | 49.60 | 111.42 | 77.61 | 37.52 | 59.55 | 21.55 | |
| Min | 1502.54 | 541664.81 | 22885.18 | 22183437.30 | 3945280.51 | 36435630.20 | 15666921.05 | 3198.00 | 41347.21 | 2155.25 | |
| Mean | 2036.39 | 4334805.02 | 167111.75 | 48841523.31 | 55849602.53 | 211041964.56 | 60461136.84 | 7080.84 | 133934.55 | 4241.58 | |
| CEC_17/12 | Median | 2029.42 | 3478776.80 | 167428.00 | 45793562.32 | 28795701.87 | 192956616.65 | 58738578.48 | 6750.50 | 126105.55 | 3533.97 |
| Max | 2536.91 | 11233159.09 | 330719.18 | 90649117.45 | 248514634.63 | 544732228.03 | 139533682.69 | 16107.62 | 381628.58 | 16989.93 | |
| Std | 224.63 | 2483709.01 | 75454.20 | 16916756.74 | 69329851.47 | 119281845.43 | 28163750.13 | 3047.10 | 74127.81 | 2356.40 | |
| Min | 1344.81 | 17950.58 | 1538.71 | 44047.62 | 60569.90 | 43545.93 | 353191.48 | 1336.81 | 1610.43 | 1357.71 | |
| Mean | 1399.54 | 49641.60 | 4604.70 | 195786.26 | 1470233.59 | 212953.29 | 1202608.24 | 1584.81 | 7795.81 | 1551.59 | |
| CEC_17/13 | Median | 1394.40 | 46756.82 | 3141.51 | 153888.96 | 260512.52 | 174262.04 | 992346.34 | 1519.43 | 4750.71 | 1498.09 |
| Max | 1486.47 | 111187.29 | 21185.68 | 587126.47 | 26607924.61 | 853813.02 | 3601114.97 | 2730.35 | 31392.02 | 2425.29 | |
| Std | 30.76 | 21547.51 | 4332.33 | 125660.19 | 5003204.22 | 161046.90 | 642965.60 | 227.99 | 6572.06 | 189.65 | |
| Min | 1462.78 | 7829.86 | 2591.68 | 129784.28 | 7530.13 | 30026.58 | 30847.87 | 1510.58 | 1708.43 | 1467.78 | |
| Mean | 1510.64 | 73692.52 | 22866.05 | 501344.80 | 129492.00 | 562872.06 | 225388.93 | 1626.82 | 3160.28 | 1571.88 | |
| CEC_17/14 | Median | 1510.54 | 57312.01 | 17805.62 | 489629.74 | 108810.75 | 432352.25 | 183623.24 | 1603.09 | 2825.03 | 1562.28 |
| Max | 1548.35 | 261793.38 | 74444.19 | 1085071.94 | 408864.93 | 2195056.48 | 759905.37 | 1844.88 | 8012.41 | 1708.56 | |
| Std | 19.22 | 61771.02 | 17749.84 | 203768.77 | 97343.30 | 456415.83 | 149083.37 | 76.73 | 1303.78 | 50.81 | |
| Min | 1543.21 | 6723.19 | 1841.29 | 12930.67 | 20479.62 | 19431.49 | 29535.92 | 1596.54 | 1650.06 | 1588.60 | |
| Mean | 1578.91 | 22042.42 | 7025.29 | 31395.13 | 330386.02 | 80865.55 | 178630.38 | 1823.88 | 9768.76 | 1732.96 | |
| CEC_17/15 | Median | 1577.05 | 20638.55 | 5305.91 | 28421.23 | 72135.47 | 61928.35 | 172952.17 | 1801.54 | 7890.76 | 1727.40 |
| Max | 1621.91 | 39457.70 | 18283.74 | 103037.27 | 6284859.36 | 563154.26 | 482990.18 | 2151.67 | 32625.69 | 1923.92 | |
| Std | 17.90 | 8315.98 | 5075.64 | 17500.64 | 1139745.62 | 86140.80 | 93804.62 | 135.36 | 7511.56 | 83.44 | |
| Min | 1848.54 | 2743.41 | 2156.60 | 2761.71 | 2282.57 | 3211.69 | 2990.04 | 1891.16 | 2479.80 | 1739.65 | |
| Mean | 2326.64 | 3741.27 | 3236.92 | 3296.68 | 3417.32 | 4666.16 | 4049.99 | 2310.70 | 3585.17 | 2089.60 | |
| CEC_17/16 | Median | 2309.68 | 3605.40 | 3206.28 | 3293.88 | 3442.22 | 4582.45 | 4063.00 | 2307.25 | 3572.64 | 2075.95 |
| Max | 2798.99 | 4626.45 | 4331.39 | 3695.49 | 4325.93 | 6396.89 | 5108.63 | 2601.15 | 4859.45 | 2406.47 | |
| Std | 209.81 | 481.71 | 471.81 | 189.67 | 452.79 | 681.30 | 553.28 | 187.47 | 488.68 | 158.76 | |
| Min | 1906.08 | 2994.78 | 2327.63 | 2305.85 | 2120.32 | 3043.46 | 2962.24 | 1915.93 | 2478.23 | 1912.16 | |
| Mean | 2385.76 | 3548.55 | 3063.94 | 2615.98 | 2969.23 | 3936.57 | 3636.28 | 2220.16 | 3142.14 | 2089.82 | |
| CEC_17/17 | Median | 2383.23 | 3608.18 | 3061.83 | 2629.85 | 3060.95 | 3939.66 | 3606.85 | 2224.63 | 3098.16 | 2093.00 |
| Max | 2837.55 | 4228.98 | 3848.87 | 2909.34 | 3714.70 | 4991.35 | 4372.53 | 2502.21 | 3927.08 | 2276.62 | |
| Std | 196.42 | 300.37 | 326.63 | 141.65 | 400.26 | 441.69 | 360.51 | 130.62 | 343.61 | 88.32 | |
| Min | 1832.28 | 48011.63 | 28154.04 | 840139.45 | 237519.92 | 542752.40 | 194292.53 | 1838.56 | 4422.64 | 1843.20 | |
| Mean | 1849.90 | 354316.49 | 73927.78 | 2501584.71 | 2261881.46 | 6809268.87 | 2093474.45 | 2018.27 | 23812.73 | 1985.11 | |
| CEC_17/18 | Median | 1849.23 | 287513.31 | 66770.98 | 2421316.03 | 1705677.57 | 4958884.12 | 1708668.08 | 2003.72 | 17637.23 | 1978.10 |
| Max | 1868.11 | 1106454.42 | 161628.10 | 5548910.83 | 11702982.76 | 23684567.30 | 7103693.87 | 2298.13 | 66047.00 | 2208.04 | |
| Std | 8.50 | 214449.43 | 30439.35 | 995450.01 | 1901410.71 | 5925562.18 | 1547116.39 | 127.19 | 16295.27 | 91.29 | |
| Min | 1944.75 | 3217.72 | 2029.38 | 12456.38 | 29290.32 | 25079.14 | 31026.66 | 1976.69 | 2303.36 | 1957.88 | |
| Mean | 1970.58 | 19193.86 | 14449.09 | 23141.82 | 642435.12 | 2274195.64 | 360263.60 | 2063.61 | 15394.75 | 2021.88 | |
| CEC_17/19 | Median | 1970.31 | 14505.56 | 9862.24 | 21944.33 | 343272.63 | 1977944.78 | 266742.62 | 2059.02 | 16293.59 | 2021.66 |
| Max | 1996.76 | 45233.59 | 39089.58 | 42341.48 | 4979804.14 | 6803584.44 | 1689025.71 | 2195.55 | 38950.41 | 2093.70 | |
| Std | 12.65 | 12979.34 | 10236.87 | 6795.81 | 993844.02 | 1799909.54 | 320833.28 | 53.89 | 9665.91 | 35.16 | |
| Min | 2113.88 | 2631.72 | 2276.06 | 2396.19 | 2282.70 | 2924.69 | 2745.34 | 2094.55 | 2296.80 | 2068.02 | |
| Mean | 2501.74 | 3335.42 | 3047.48 | 2747.58 | 3010.75 | 3646.83 | 3382.18 | 2301.69 | 3156.51 | 2225.53 | |
| CEC_17/20 | Median | 2486.18 | 3373.39 | 3076.87 | 2752.59 | 3016.59 | 3665.40 | 3394.19 | 2317.75 | 3117.15 | 2235.82 |
| Max | 2834.56 | 3954.94 | 3637.10 | 3030.08 | 3563.85 | 4253.41 | 3963.43 | 2573.23 | 3903.22 | 2422.09 | |
| Std | 168.46 | 323.72 | 311.47 | 159.36 | 285.64 | 319.59 | 280.25 | 129.31 | 324.58 | 99.48 | |
| Min | 2309.38 | 2579.89 | 2456.18 | 2579.22 | 2410.93 | 2708.49 | 2611.37 | 2322.16 | 2431.93 | 2327.30 | |
| Mean | 2317.19 | 2705.16 | 2535.43 | 2625.01 | 2618.72 | 2878.00 | 2784.42 | 2334.43 | 2568.09 | 2335.09 | |
| CEC_17/21 | Median | 2316.93 | 2700.11 | 2538.41 | 2628.95 | 2643.23 | 2874.29 | 2788.48 | 2335.33 | 2562.09 | 2335.39 |
| Max | 2325.50 | 2810.69 | 2637.55 | 2654.08 | 2709.89 | 3114.15 | 2992.26 | 2344.39 | 2706.61 | 2345.97 | |
| Std | 3.54 | 61.10 | 44.90 | 17.26 | 80.99 | 96.67 | 78.67 | 4.54 | 57.59 | 3.95 | |
| Min | 2300.00 | 2302.95 | 6898.72 | 12342.48 | 11095.89 | 9227.51 | 8458.41 | 2300.00 | 2300.00 | 2300.00 | |
| Mean | 2424.86 | 9840.48 | 9365.78 | 13888.82 | 13516.13 | 11436.15 | 10582.39 | 5344.89 | 9337.36 | 3672.80 | |
| CEC_17/22 | Median | 2300.00 | 9989.38 | 9431.80 | 13975.88 | 13605.58 | 11395.87 | 10626.60 | 6009.33 | 9750.16 | 2300.00 |
| Max | 8406.35 | 12161.63 | 11245.08 | 14616.39 | 14968.16 | 14998.30 | 12553.77 | 6789.42 | 11640.86 | 6610.96 | |
| Std | 855.11 | 1411.89 | 1067.85 | 440.87 | 725.31 | 1182.00 | 957.25 | 1464.83 | 1690.30 | 1811.90 | |
| Min | 2731.54 | 2976.87 | 2944.22 | 3012.29 | 2811.09 | 3308.55 | 3288.83 | 2739.99 | 2887.14 | 2736.18 | |
| Mean | 2755.84 | 3285.08 | 3127.89 | 3048.33 | 3100.27 | 3618.39 | 3564.60 | 2756.57 | 3079.81 | 2755.07 | |
| CEC_17/23 | Median | 2755.00 | 3266.63 | 3115.82 | 3048.57 | 3110.65 | 3614.99 | 3542.66 | 2756.57 | 3091.27 | 2755.04 |
| Max | 2779.24 | 3526.33 | 3388.63 | 3069.78 | 3189.85 | 3933.48 | 3916.35 | 2773.69 | 3269.47 | 2772.21 | |
| Std | 10.89 | 111.48 | 99.51 | 11.84 | 65.62 | 155.09 | 143.91 | 8.91 | 83.30 | 7.33 | |
| Min | 2905.53 | 3248.89 | 3052.41 | 3219.89 | 3049.09 | 3303.61 | 3814.43 | 2915.14 | 3047.76 | 2911.17 | |
| Mean | 2931.17 | 3548.02 | 3254.22 | 3260.76 | 3258.40 | 3657.97 | 4135.41 | 2930.63 | 3199.21 | 2928.06 | |
| CEC_17/24 | Median | 2933.07 | 3560.76 | 3241.33 | 3263.11 | 3257.62 | 3662.49 | 4161.98 | 2929.73 | 3181.23 | 2929.25 |
| Max | 2960.90 | 4019.27 | 3439.42 | 3285.52 | 3354.84 | 3938.13 | 4507.13 | 2953.11 | 3492.76 | 2938.01 | |
| Std | 14.28 | 141.97 | 92.81 | 16.06 | 50.17 | 136.43 | 178.96 | 7.91 | 95.53 | 5.73 | |
| Min | 2928.11 | 2961.20 | 2956.81 | 2980.33 | 2972.44 | 3082.32 | 3055.85 | 2979.76 | 2961.73 | 2928.74 | |
| Mean | 2982.25 | 3066.44 | 3033.35 | 2982.35 | 3090.91 | 3139.43 | 3119.34 | 3003.70 | 3062.66 | 3000.42 | |
| CEC_17/25 | Median | 2970.49 | 3073.20 | 3031.90 | 2980.35 | 3086.77 | 3134.80 | 3116.36 | 2980.40 | 3068.95 | 2991.97 |
| Max | 3062.70 | 3112.73 | 3089.69 | 3021.85 | 3197.86 | 3205.37 | 3195.94 | 3068.65 | 3115.97 | 3068.87 | |
| Std | 42.70 | 32.20 | 41.45 | 7.79 | 49.19 | 31.29 | 34.90 | 33.79 | 34.52 | 28.16 | |
| Min | 2900.00 | 2900.00 | 2900.00 | 6512.07 | 5062.07 | 4745.58 | 2941.17 | 3785.35 | 2900.00 | 3855.22 | |
| Mean | 2900.00 | 9177.14 | 6762.93 | 6850.55 | 7305.15 | 12708.12 | 9385.51 | 4004.13 | 6649.52 | 4000.98 | |
| CEC_17/26 | Median | 2900.00 | 9368.39 | 7616.96 | 6856.33 | 7480.17 | 12848.07 | 10417.31 | 3995.68 | 7404.67 | 3994.59 |
| Max | 2900.00 | 11914.36 | 9896.62 | 7074.37 | 8433.33 | 18304.43 | 12448.88 | 4221.68 | 11620.56 | 4206.09 | |
| Std | 0.00 | 1616.64 | 2441.30 | 118.53 | 739.53 | 2020.60 | 2718.65 | 89.51 | 3405.48 | 80.87 | |
| Min | 3204.39 | 3429.40 | 3286.84 | 3231.31 | 3200.01 | 3511.87 | 3458.62 | 3211.41 | 3276.20 | 3217.63 | |
| Mean | 3243.23 | 3680.69 | 3511.52 | 3248.21 | 3200.01 | 4217.39 | 3940.30 | 3246.49 | 3613.03 | 3262.68 | |
| CEC_17/27 | Median | 3232.34 | 3646.34 | 3491.55 | 3246.92 | 3200.01 | 4121.60 | 3892.13 | 3238.28 | 3598.62 | 3255.13 |
| Max | 3331.13 | 4180.75 | 3878.28 | 3290.33 | 3200.01 | 5268.64 | 4906.91 | 3299.94 | 4084.62 | 3386.20 | |
| Std | 32.56 | 175.00 | 126.57 | 11.95 | 0.00 | 395.00 | 263.44 | 24.46 | 160.98 | 30.88 | |
| Min | 3253.35 | 3258.85 | 3253.35 | 3258.85 | 3278.78 | 3325.47 | 3263.56 | 3258.85 | 3258.52 | 3251.96 | |
| Mean | 3255.38 | 3302.02 | 3289.99 | 3259.37 | 3299.60 | 3420.71 | 3365.27 | 3286.41 | 3288.23 | 3284.03 | |
| CEC_17/28 | Median | 3253.35 | 3307.71 | 3296.67 | 3258.85 | 3300.01 | 3417.56 | 3364.36 | 3307.69 | 3296.67 | 3295.20 |
| Max | 3258.85 | 3323.69 | 3397.50 | 3270.47 | 3300.01 | 3519.42 | 3481.01 | 3307.69 | 3314.63 | 3333.39 | |
| Std | 2.58 | 15.66 | 30.19 | 2.26 | 2.97 | 54.03 | 38.77 | 24.29 | 19.64 | 24.13 | |
| Min | 3345.28 | 3914.07 | 3990.26 | 3688.92 | 3754.56 | 5654.72 | 4335.02 | 3264.19 | 3945.35 | 3222.71 | |
| Mean | 3632.76 | 4804.78 | 4443.09 | 4081.53 | 4450.64 | 7135.84 | 5296.51 | 3351.09 | 4664.58 | 3277.07 | |
| CEC_17/29 | Median | 3617.96 | 4790.17 | 4413.46 | 4095.93 | 4432.81 | 7014.21 | 5193.53 | 3321.21 | 4616.44 | 3264.44 |
| Max | 4069.12 | 5568.79 | 5310.72 | 4374.06 | 5307.27 | 9444.32 | 6839.25 | 3650.91 | 5687.80 | 3435.50 | |
| Std | 188.01 | 385.55 | 296.77 | 145.98 | 326.37 | 943.42 | 525.59 | 85.70 | 437.31 | 46.92 | |
| Min | 582421.93 | 662354.91 | 696401.55 | 850585.87 | 3377929.99 | 42870693.14 | 5586342.07 | 582411.37 | 582446.49 | 582412.37 | |
| Mean | 582464.54 | 1407176.80 | 879583.04 | 1162219.88 | 9028706.16 | 94011085.54 | 12390619.55 | 676334.24 | 659661.01 | 670999.37 | |
| CEC_17/30 | Median | 582468.40 | 1376082.93 | 879433.83 | 1142131.95 | 8106247.96 | 90051617.53 | 12662209.20 | 654647.65 | 611533.00 | 664055.13 |
| Max | 582513.56 | 2605124.91 | 1125762.23 | 1478477.88 | 22851833.55 | 178721186.09 | 19096625.20 | 955209.29 | 1162667.73 | 928188.22 | |
| Std | 22.22 | 340680.34 | 104641.29 | 162242.13 | 3711188.45 | 30853888.68 | 3053384.13 | 90357.41 | 114279.47 | 73507.51 |
Table A7.
Statistical criteria results of PCOA and other algorithms on the 100D CEC2017, over 51 independent runs.
Table A7.
Statistical criteria results of PCOA and other algorithms on the 100D CEC2017, over 51 independent runs.
| Function | PCOA | AVOA | PSO | DE | RW_GWO | WOA | HHO | LSHADE | GBO | EBOwithCMAR | |
|---|---|---|---|---|---|---|---|---|---|---|---|
| Min | 100.00 | 106.36 | 113.94 | 117.56 | 47597183.46 | 20394203.12 | 159317986.86 | 100.00 | 104.74 | 100.00 | |
| Mean | 100.03 | 7292.34 | 9396.68 | 6915.99 | 389024453.65 | 34942862.54 | 210098155.31 | 100.00 | 7066.34 | 100.00 | |
| CEC_17/01 | Median | 100.03 | 4314.88 | 6346.00 | 3694.66 | 312892414.16 | 32873854.80 | 208910955.17 | 100.00 | 3477.29 | 100.00 |
| Max | 100.10 | 40027.33 | 53307.10 | 36982.74 | 1449521296.76 | 82459700.62 | 255597980.32 | 100.00 | 50189.20 | 100.00 | |
| Std | 0.02 | 8744.79 | 10688.93 | 8315.25 | 278111759.81 | 11030280.94 | 21593995.71 | 0.00 | 9615.04 | 0.00 | |
| Min | 300.00 | 8918.53 | 61770.16 | 503922.59 | 61255.51 | 198647.67 | 19415.13 | 300.00 | 301.65 | 300.00 | |
| Mean | 300.00 | 20295.04 | 111828.82 | 597385.37 | 106248.26 | 608994.27 | 34573.96 | 300.00 | 311.64 | 300.00 | |
| CEC_17/03 | Median | 300.00 | 19492.19 | 109143.15 | 597826.75 | 104786.41 | 583665.90 | 34386.47 | 300.00 | 310.19 | 300.00 |
| Max | 300.00 | 35773.26 | 177245.41 | 676095.86 | 185637.71 | 1075156.07 | 54832.82 | 300.00 | 342.99 | 300.00 | |
| Std | 0.00 | 6439.85 | 25745.75 | 38176.92 | 23947.20 | 196928.93 | 6962.76 | 0.00 | 8.84 | 0.00 | |
| Min | 400.00 | 558.71 | 462.66 | 597.36 | 690.79 | 813.74 | 656.94 | 400.00 | 499.80 | 400.00 | |
| Mean | 400.47 | 649.66 | 577.58 | 626.55 | 759.28 | 1015.23 | 830.76 | 530.23 | 632.71 | 461.11 | |
| CEC_17/04 | Median | 400.00 | 643.02 | 587.52 | 628.40 | 759.57 | 1012.52 | 834.80 | 541.63 | 639.06 | 403.99 |
| Max | 403.99 | 778.52 | 683.38 | 635.71 | 857.97 | 1247.64 | 947.87 | 625.55 | 712.64 | 678.37 | |
| Std | 1.30 | 47.40 | 52.05 | 5.41 | 40.57 | 94.58 | 65.52 | 57.87 | 42.38 | 87.32 | |
| Min | 528.85 | 1154.68 | 956.68 | 1345.19 | 830.70 | 1230.15 | 1324.37 | 566.56 | 1074.09 | 568.65 | |
| Mean | 541.57 | 1304.37 | 1120.69 | 1401.16 | 1173.62 | 1427.52 | 1416.68 | 600.34 | 1269.02 | 590.03 | |
| CEC_17/05 | Median | 539.80 | 1315.26 | 1123.83 | 1405.98 | 968.56 | 1413.57 | 1424.68 | 600.99 | 1278.05 | 590.54 |
| Max | 558.70 | 1450.17 | 1311.88 | 1434.97 | 1581.45 | 1714.36 | 1504.74 | 627.14 | 1450.17 | 611.27 | |
| Std | 7.43 | 62.97 | 81.53 | 20.97 | 305.78 | 99.59 | 45.21 | 13.62 | 69.89 | 10.62 | |
| Min | 600.00 | 632.92 | 631.48 | 600.00 | 605.98 | 662.48 | 670.81 | 600.01 | 631.45 | 600.00 | |
| Mean | 600.00 | 642.44 | 645.94 | 600.00 | 613.41 | 680.16 | 676.44 | 600.08 | 647.02 | 600.00 | |
| CEC_17/06 | Median | 600.00 | 643.00 | 646.42 | 600.00 | 612.74 | 677.06 | 676.39 | 600.06 | 648.52 | 600.00 |
| Max | 600.00 | 650.78 | 667.87 | 600.00 | 626.45 | 708.82 | 681.34 | 600.21 | 661.05 | 600.02 | |
| Std | 0.00 | 4.20 | 6.70 | 0.00 | 4.04 | 10.35 | 2.61 | 0.05 | 5.83 | 0.00 | |
| Min | 832.38 | 2376.48 | 1189.64 | 1642.50 | 1321.43 | 2972.41 | 2927.66 | 875.21 | 1996.15 | 864.61 | |
| Mean | 855.39 | 2774.21 | 1489.26 | 1724.85 | 1481.62 | 3243.23 | 3421.76 | 910.92 | 2436.84 | 881.74 | |
| CEC_17/07 | Median | 851.68 | 2782.91 | 1453.34 | 1724.26 | 1466.94 | 3245.97 | 3434.59 | 912.22 | 2346.11 | 880.44 |
| Max | 919.89 | 3085.18 | 1966.92 | 1769.58 | 1697.51 | 3574.33 | 3644.18 | 940.91 | 3026.21 | 901.88 | |
| Std | 17.90 | 145.88 | 159.44 | 25.40 | 86.87 | 152.77 | 119.74 | 14.87 | 262.87 | 8.61 | |
| Min | 827.86 | 1489.50 | 1295.49 | 1608.26 | 1105.93 | 1688.20 | 1724.51 | 869.15 | 1383.04 | 870.64 | |
| Mean | 839.54 | 1696.14 | 1452.59 | 1698.16 | 1417.13 | 1878.96 | 1855.67 | 898.88 | 1627.56 | 887.28 | |
| CEC_17/08 | Median | 837.81 | 1692.47 | 1453.68 | 1704.44 | 1225.52 | 1858.74 | 1860.78 | 897.71 | 1625.81 | 887.56 |
| Max | 859.70 | 1880.51 | 1612.87 | 1733.68 | 1916.19 | 2206.28 | 1972.05 | 926.93 | 1874.54 | 907.46 | |
| Std | 7.50 | 87.65 | 76.97 | 25.45 | 287.00 | 110.68 | 61.03 | 12.38 | 96.91 | 8.18 | |
| Min | 900.00 | 19188.23 | 13422.43 | 1342.00 | 10463.32 | 24489.16 | 24051.09 | 908.95 | 16066.52 | 900.91 | |
| Mean | 900.00 | 22622.90 | 19061.46 | 1932.65 | 22940.81 | 37080.47 | 29653.90 | 930.32 | 20616.59 | 908.37 | |
| CEC_17/09 | Median | 900.00 | 22484.84 | 19039.48 | 1992.69 | 17993.22 | 32944.74 | 29295.43 | 925.30 | 20480.79 | 906.81 |
| Max | 900.00 | 27160.69 | 32497.28 | 2607.85 | 42231.28 | 74169.65 | 43704.81 | 1037.96 | 25898.33 | 939.60 | |
| Std | 0.00 | 1272.09 | 3290.08 | 289.40 | 9776.38 | 11443.15 | 3693.05 | 20.34 | 2142.49 | 7.24 | |
| Min | 9016.54 | 13759.83 | 11548.80 | 27479.20 | 25557.97 | 15580.23 | 15382.11 | 8821.63 | 12489.90 | 8966.89 | |
| Mean | 10920.61 | 16370.65 | 14782.49 | 29299.73 | 28340.45 | 19940.44 | 18241.74 | 10345.32 | 15433.88 | 9817.42 | |
| CEC_17/10 | Median | 10902.76 | 16343.15 | 14847.32 | 29193.75 | 28490.16 | 19838.72 | 18114.85 | 10436.24 | 15508.93 | 9835.91 |
| Max | 12384.87 | 20275.97 | 17402.09 | 30231.43 | 30593.49 | 24937.57 | 21005.64 | 11332.06 | 20267.56 | 10573.39 | |
| Std | 696.62 | 1554.47 | 1285.06 | 535.42 | 967.79 | 2168.75 | 1207.48 | 537.98 | 1436.49 | 428.80 | |
| Min | 1239.29 | 1848.73 | 1627.09 | 6354.41 | 2393.80 | 4033.27 | 2478.72 | 1674.85 | 1959.72 | 1500.73 | |
| Mean | 1333.43 | 2277.43 | 2011.98 | 8516.60 | 3116.09 | 7357.08 | 2939.04 | 2208.34 | 2414.40 | 1823.79 | |
| CEC_17/11 | Median | 1324.63 | 2280.45 | 2031.04 | 8572.75 | 3006.41 | 6847.67 | 2940.03 | 2236.43 | 2353.27 | 1806.17 |
| Max | 1416.16 | 2852.79 | 2340.73 | 10928.74 | 5965.62 | 13729.68 | 3806.82 | 2713.59 | 3097.51 | 2336.70 | |
| Std | 44.46 | 187.43 | 175.96 | 1020.04 | 579.45 | 1870.76 | 214.05 | 208.45 | 268.16 | 178.37 | |
| Min | 3112.93 | 2368449.11 | 265973.64 | 289971578.25 | 56695946.84 | 149956101.44 | 112685152.18 | 6147.37 | 194903.47 | 3890.60 | |
| Mean | 3754.71 | 11722791.80 | 867352.13 | 370007827.41 | 187415887.72 | 632541372.99 | 290321315.26 | 20769.66 | 740216.59 | 17708.18 | |
| CEC_17/12 | Median | 3760.80 | 10945699.15 | 753391.33 | 367093730.84 | 191858837.94 | 644395114.00 | 283908994.44 | 13614.30 | 737664.49 | 5760.74 |
| Max | 4283.18 | 24198208.40 | 2322942.31 | 463054570.00 | 313940010.21 | 1297508667.15 | 429434170.74 | 142477.88 | 1285629.80 | 96045.21 | |
| Std | 275.24 | 5633631.18 | 440810.05 | 39464063.10 | 71034897.79 | 246016502.73 | 79337205.20 | 19897.79 | 236865.55 | 21045.35 | |
| Min | 1316.03 | 16839.43 | 2019.83 | 2490.01 | 95682.29 | 42607.70 | 1393374.80 | 1399.01 | 2996.14 | 1483.15 | |
| Mean | 1427.70 | 41399.42 | 7633.80 | 12859.15 | 1915545.17 | 91569.22 | 3295965.04 | 2603.42 | 10365.71 | 1842.54 | |
| CEC_17/13 | Median | 1428.47 | 42419.99 | 6722.08 | 8068.77 | 1239717.51 | 83491.39 | 3361944.66 | 1765.89 | 8263.50 | 1702.86 |
| Max | 1590.45 | 65687.61 | 23083.99 | 79267.35 | 10585325.12 | 207186.66 | 5176087.46 | 10061.48 | 23496.53 | 6071.14 | |
| Std | 69.91 | 10696.09 | 5066.00 | 12796.95 | 2109607.46 | 37464.80 | 920283.72 | 1805.33 | 5435.91 | 640.58 | |
| Min | 1510.54 | 70094.27 | 30038.80 | 4437636.27 | 467851.83 | 550918.16 | 295485.38 | 1628.25 | 7359.90 | 1609.29 | |
| Mean | 1550.52 | 218220.30 | 159297.81 | 9187110.98 | 1402592.17 | 1656839.85 | 918039.58 | 2011.82 | 25606.63 | 1908.01 | |
| CEC_17/14 | Median | 1555.31 | 210613.90 | 130539.08 | 9316782.63 | 1269257.83 | 1483296.94 | 842315.29 | 1993.56 | 24862.04 | 1891.61 |
| Max | 1582.18 | 463861.89 | 387781.94 | 16067469.75 | 3147744.34 | 5223854.35 | 2776266.87 | 2410.78 | 57903.67 | 2151.73 | |
| Std | 16.58 | 83524.19 | 85194.60 | 2446545.59 | 644714.34 | 879379.60 | 412681.78 | 188.25 | 11804.89 | 106.93 | |
| Min | 1534.34 | 12112.15 | 1891.81 | 6968.13 | 37615.84 | 21935.67 | 155297.84 | 1697.09 | 2057.17 | 1660.59 | |
| Mean | 1605.89 | 24360.70 | 4526.43 | 37311.25 | 342701.37 | 139637.00 | 1045892.81 | 1851.45 | 5765.32 | 1810.78 | |
| CEC_17/15 | Median | 1606.79 | 22521.24 | 3498.30 | 32551.03 | 170216.27 | 60483.32 | 819538.49 | 1856.24 | 4587.87 | 1812.82 |
| Max | 1679.42 | 54190.55 | 16000.41 | 113427.34 | 1554972.74 | 2713486.55 | 8152670.75 | 2076.46 | 20219.62 | 1962.34 | |
| Std | 34.12 | 8672.17 | 3074.51 | 21323.51 | 377160.39 | 381475.15 | 1151919.14 | 93.86 | 4420.88 | 78.76 | |
| Min | 2728.48 | 5139.83 | 3635.13 | 7813.65 | 4365.70 | 6306.64 | 5159.01 | 2960.91 | 4435.34 | 2832.72 | |
| Mean | 3581.62 | 6366.10 | 5309.06 | 8928.68 | 7729.06 | 9425.19 | 7073.44 | 3882.19 | 5788.48 | 3420.55 | |
| CEC_17/16 | Median | 3572.11 | 6289.08 | 5404.45 | 8976.22 | 8028.66 | 9226.19 | 6966.66 | 3952.76 | 5837.70 | 3352.84 |
| Max | 4632.81 | 8060.63 | 6978.37 | 9657.37 | 9268.35 | 13151.66 | 8906.61 | 4324.21 | 8027.44 | 4191.14 | |
| Std | 481.39 | 697.75 | 675.23 | 374.51 | 943.32 | 1474.99 | 785.09 | 331.77 | 786.76 | 299.53 | |
| Min | 2749.83 | 4515.06 | 3247.45 | 4730.31 | 3933.47 | 5873.63 | 4888.74 | 3065.85 | 4726.02 | 2834.67 | |
| Mean | 3598.85 | 5916.83 | 4733.13 | 5318.08 | 6177.91 | 6990.83 | 6114.33 | 3573.35 | 5446.05 | 3175.20 | |
| CEC_17/17 | Median | 3599.23 | 5856.80 | 4716.28 | 5347.45 | 6310.98 | 6964.48 | 6291.02 | 3590.64 | 5330.69 | 3140.11 |
| Max | 4331.39 | 7209.78 | 6256.67 | 5718.73 | 7306.02 | 8629.20 | 7080.62 | 4038.46 | 7107.64 | 3574.36 | |
| Std | 316.36 | 593.55 | 631.29 | 271.42 | 782.59 | 702.85 | 609.64 | 219.99 | 489.66 | 183.62 | |
| Min | 1857.31 | 118075.90 | 94759.25 | 10002816.41 | 239153.08 | 965001.72 | 817917.29 | 2121.40 | 25727.05 | 1954.79 | |
| Mean | 1901.99 | 333355.02 | 265321.50 | 19578179.65 | 1996903.93 | 2096164.85 | 2016116.41 | 3694.52 | 96433.83 | 2078.29 | |
| CEC_17/18 | Median | 1902.03 | 320188.66 | 243642.40 | 19755450.13 | 1841653.27 | 1799820.74 | 2031950.54 | 3209.81 | 95332.61 | 2057.81 |
| Max | 1938.69 | 633659.66 | 698160.60 | 28866206.78 | 4433191.06 | 5041024.10 | 3261813.33 | 8092.27 | 185330.19 | 2322.14 | |
| Std | 16.97 | 113252.74 | 115568.25 | 4963306.71 | 1063032.69 | 889773.69 | 602230.93 | 1505.49 | 37561.54 | 80.37 | |
| Min | 1979.22 | 3645.17 | 2119.22 | 5895.21 | 601831.57 | 999357.93 | 884570.46 | 2056.57 | 2194.12 | 2025.04 | |
| Mean | 2050.45 | 11795.75 | 4578.58 | 37475.39 | 2211734.62 | 14068547.09 | 3405104.51 | 2190.07 | 5837.60 | 2090.38 | |
| CEC_17/19 | Median | 2040.66 | 10516.47 | 3540.85 | 31933.62 | 2005437.21 | 14206280.01 | 3137545.84 | 2152.21 | 3985.29 | 2088.73 |
| Max | 2150.13 | 24138.80 | 13747.13 | 116706.42 | 4918732.46 | 29381540.11 | 7211833.46 | 3376.88 | 19070.20 | 2235.52 | |
| Std | 44.20 | 5605.63 | 2817.99 | 26291.64 | 1052654.66 | 7005404.79 | 1438985.84 | 204.52 | 4486.09 | 41.66 | |
| Min | 3038.45 | 4354.79 | 3280.58 | 4929.70 | 4700.98 | 4693.24 | 4328.29 | 3230.59 | 3869.38 | 2923.86 | |
| Mean | 3860.31 | 5660.28 | 5028.53 | 5470.97 | 5795.40 | 6148.91 | 5745.00 | 3696.51 | 5078.62 | 3453.90 | |
| CEC_17/20 | Median | 3903.55 | 5787.09 | 5089.81 | 5497.14 | 5772.72 | 6019.97 | 5789.40 | 3658.06 | 5089.31 | 3470.12 |
| Max | 4333.81 | 6649.63 | 6025.60 | 5906.01 | 6482.45 | 7460.43 | 6751.95 | 4076.48 | 6102.80 | 3997.64 | |
| Std | 307.11 | 550.89 | 553.37 | 219.39 | 400.51 | 600.53 | 492.82 | 190.42 | 443.77 | 232.17 | |
| Min | 2354.83 | 3134.36 | 2928.72 | 3160.61 | 2589.21 | 3361.45 | 3483.50 | 2402.65 | 2849.28 | 2399.60 | |
| Mean | 2375.09 | 3447.98 | 3119.81 | 3224.29 | 2936.03 | 3886.00 | 3832.42 | 2429.30 | 3082.30 | 2418.10 | |
| CEC_17/21 | Median | 2374.70 | 3465.01 | 3102.94 | 3222.04 | 2743.00 | 3856.07 | 3821.95 | 2428.17 | 3081.61 | 2417.00 |
| Max | 2397.00 | 3925.50 | 3446.58 | 3264.50 | 3395.99 | 4385.72 | 4278.84 | 2459.77 | 3352.96 | 2440.19 | |
| Std | 10.16 | 155.37 | 109.21 | 23.44 | 308.29 | 229.76 | 184.59 | 13.00 | 131.12 | 9.80 | |
| Min | 2300.00 | 15322.46 | 14134.68 | 30040.40 | 28082.65 | 19041.26 | 19548.56 | 11390.79 | 15023.76 | 2300.00 | |
| Mean | 6416.65 | 19158.68 | 18258.87 | 31420.19 | 30300.50 | 24108.83 | 22444.44 | 12791.02 | 18645.42 | 12082.06 | |
| CEC_17/22 | Median | 2300.00 | 19179.59 | 18326.86 | 31510.94 | 30375.36 | 24242.82 | 22584.01 | 12975.87 | 18933.05 | 12343.47 |
| Max | 18290.62 | 22760.70 | 21370.02 | 32329.56 | 32837.36 | 28973.57 | 27314.35 | 13655.74 | 22061.04 | 13375.30 | |
| Std | 6098.59 | 1555.51 | 1728.11 | 461.90 | 1001.02 | 2245.82 | 1586.79 | 511.17 | 1582.70 | 1513.32 | |
| Min | 2877.73 | 3385.37 | 3541.98 | 3496.59 | 3660.48 | 4227.12 | 4170.77 | 2888.00 | 3383.84 | 2877.15 | |
| Mean | 2908.78 | 3761.69 | 3946.65 | 3547.74 | 3782.73 | 4800.32 | 4508.73 | 2911.06 | 3642.01 | 2906.42 | |
| CEC_17/23 | Median | 2909.49 | 3735.28 | 3935.77 | 3550.78 | 3786.83 | 4757.49 | 4483.89 | 2911.49 | 3624.90 | 2905.21 |
| Max | 2945.80 | 4213.33 | 4463.11 | 3588.41 | 3927.03 | 5309.38 | 4922.31 | 2949.85 | 3994.87 | 2940.03 | |
| Std | 16.05 | 173.54 | 175.56 | 21.55 | 54.85 | 236.45 | 186.42 | 14.84 | 124.47 | 12.36 | |
| Min | 3323.94 | 4312.28 | 3912.05 | 4050.32 | 3494.07 | 5260.83 | 4866.99 | 3348.90 | 3950.78 | 3332.38 | |
| Mean | 3366.32 | 4716.47 | 4286.32 | 4098.86 | 3864.44 | 5973.98 | 5629.99 | 3399.84 | 4334.06 | 3373.11 | |
| CEC_17/24 | Median | 3366.91 | 4689.91 | 4261.24 | 4098.19 | 3679.54 | 5942.96 | 5653.54 | 3392.46 | 4317.62 | 3376.03 |
| Max | 3420.37 | 5215.92 | 5012.06 | 4133.57 | 4309.87 | 6797.58 | 6633.74 | 3482.26 | 4952.77 | 3406.87 | |
| Std | 23.65 | 216.67 | 250.61 | 16.79 | 309.68 | 386.78 | 373.24 | 27.12 | 244.29 | 16.67 | |
| Min | 3058.73 | 3145.76 | 3120.85 | 3240.10 | 3436.59 | 3484.79 | 3344.22 | 3133.82 | 3198.20 | 3102.08 | |
| Mean | 3130.42 | 3291.65 | 3252.28 | 3328.44 | 3536.15 | 3616.48 | 3529.40 | 3241.06 | 3294.37 | 3224.33 | |
| CEC_17/25 | Median | 3109.63 | 3295.26 | 3258.19 | 3320.60 | 3528.77 | 3606.51 | 3525.23 | 3243.04 | 3287.75 | 3216.35 |
| Max | 3242.78 | 3379.79 | 3345.70 | 3460.73 | 3820.87 | 3815.45 | 3712.70 | 3350.92 | 3476.38 | 3334.10 | |
| Std | 44.21 | 60.73 | 67.54 | 48.83 | 84.32 | 79.61 | 70.28 | 49.07 | 58.88 | 53.39 | |
| Min | 2900.00 | 15671.07 | 2900.00 | 14013.49 | 8777.62 | 25783.35 | 4660.26 | 6332.19 | 2900.00 | 6250.89 | |
| Mean | 6533.21 | 21071.83 | 14736.49 | 14553.56 | 11844.71 | 31617.05 | 23849.18 | 6792.19 | 18327.89 | 6564.92 | |
| CEC_17/26 | Median | 6586.69 | 20683.79 | 15842.00 | 14558.10 | 10076.84 | 31456.75 | 24353.22 | 6781.11 | 17959.83 | 6605.46 |
| Max | 7405.62 | 26174.51 | 21962.55 | 15059.20 | 16794.81 | 39277.38 | 27392.53 | 7302.08 | 24343.20 | 6969.08 | |
| Std | 587.15 | 2353.12 | 5296.76 | 221.32 | 2950.54 | 3300.90 | 3089.12 | 203.27 | 3820.78 | 149.17 | |
| Min | 3304.29 | 3547.54 | 3484.85 | 3470.13 | 3200.02 | 3788.71 | 3662.10 | 3301.55 | 3445.33 | 3277.20 | |
| Mean | 3345.13 | 3905.64 | 3790.36 | 3543.66 | 3200.02 | 4974.13 | 4110.94 | 3373.20 | 3713.94 | 3353.90 | |
| CEC_17/27 | Median | 3341.02 | 3883.65 | 3773.45 | 3543.87 | 3200.02 | 4991.77 | 4086.12 | 3371.41 | 3702.54 | 3350.82 |
| Max | 3404.09 | 4259.91 | 4090.91 | 3602.52 | 3200.02 | 6648.73 | 4819.35 | 3434.38 | 4172.46 | 3425.64 | |
| Std | 25.90 | 182.96 | 139.59 | 27.09 | 0.00 | 586.10 | 255.86 | 33.32 | 156.52 | 26.75 | |
| Min | 3100.00 | 3307.31 | 3288.49 | 3327.32 | 3300.02 | 3597.66 | 3428.13 | 3209.63 | 3301.39 | 3100.00 | |
| Mean | 3155.84 | 3366.18 | 3346.01 | 3347.40 | 3300.02 | 3718.60 | 3570.03 | 3324.66 | 3369.76 | 3283.82 | |
| CEC_17/28 | Median | 3100.00 | 3359.84 | 3340.80 | 3346.19 | 3300.02 | 3714.44 | 3568.69 | 3320.07 | 3363.29 | 3318.64 |
| Max | 3321.67 | 3465.33 | 3422.81 | 3423.84 | 3300.02 | 3868.30 | 3690.78 | 3434.40 | 3436.87 | 3418.24 | |
| Std | 87.68 | 33.13 | 30.12 | 14.12 | 0.00 | 68.85 | 54.86 | 48.08 | 32.60 | 89.81 | |
| Min | 4591.75 | 6288.14 | 5572.02 | 6648.97 | 7001.12 | 9447.24 | 7363.53 | 4481.43 | 5471.30 | 3891.10 | |
| Mean | 5237.32 | 7887.23 | 6853.07 | 7269.34 | 8115.64 | 13591.33 | 8929.57 | 5025.78 | 7159.33 | 4447.44 | |
| CEC_17/29 | Median | 5259.43 | 7917.74 | 6745.60 | 7324.38 | 7955.99 | 13280.36 | 8823.02 | 5017.78 | 7143.42 | 4463.92 |
| Max | 5945.51 | 9304.54 | 8091.26 | 7673.19 | 9897.92 | 18105.82 | 10486.00 | 5701.76 | 8218.33 | 5233.81 | |
| Std | 314.00 | 673.67 | 505.57 | 248.67 | 702.76 | 1731.80 | 654.17 | 304.74 | 509.78 | 246.88 | |
| Min | 5273.60 | 62774.26 | 5662.20 | 16891.33 | 40823905.93 | 70568462.27 | 10438810.60 | 5332.63 | 6649.44 | 5220.44 | |
| Mean | 5584.63 | 136331.10 | 9920.47 | 26961.79 | 64625903.41 | 220411229.62 | 19696989.78 | 5793.26 | 11182.19 | 5583.76 | |
| CEC_17/30 | Median | 5557.12 | 125436.83 | 8395.69 | 25904.40 | 64403338.35 | 191993438.42 | 19180090.35 | 5707.24 | 9618.69 | 5524.20 |
| Max | 5998.00 | 291003.37 | 20481.54 | 42839.89 | 103310275.73 | 614413569.24 | 31214878.66 | 8781.00 | 21715.16 | 6321.60 | |
| Std | 187.47 | 53295.39 | 3704.77 | 6026.26 | 14556025.50 | 117525290.23 | 4647662.07 | 517.73 | 4049.77 | 246.34 |
Table A8.
Statistical results of PCOA and other algorithms on the CEC2019, over 51 independent runs.
Table A8.
Statistical results of PCOA and other algorithms on the CEC2019, over 51 independent runs.
| Function | PCOA | AVOA | PSO | DE | RW_GWO | WOA | HHO | LSHADE | GBO | EBOwithCMAR | |
|---|---|---|---|---|---|---|---|---|---|---|---|
| Min | 1.00 | 1.00 | 15687.32 | 477575.81 | 1.00 | 8.79 | 1.00 | 1.00 | 1.00 | 1.00 | |
| Mean | 1.00 | 1.00 | 8542182.77 | 2006007.93 | 19824.68 | 3031265.52 | 1.00 | 1.00 | 1.00 | 18.48 | |
| CEC19_01 | Median | 1.00 | 1.00 | 2578552.14 | 1985994.72 | 897.58 | 2210414.02 | 1.00 | 1.00 | 1.00 | 1.41 |
| Max | 1.00 | 1.00 | 90408077.34 | 3695753.18 | 208490.41 | 8949464.63 | 1.00 | 1.00 | 1.00 | 263.71 | |
| Std | 0.00 | 0.00 | 14190821.68 | 824405.80 | 46856.90 | 2921171.39 | 0.00 | 0.00 | 0.00 | 44.42 | |
| Min | 2.40 | 4.22 | 259.20 | 746.97 | 16.92 | 168.77 | 4.64 | 1.00 | 3.73 | 85.98 | |
| Mean | 3.06 | 4.54 | 2041.36 | 1170.76 | 239.10 | 7125.43 | 4.97 | 1.00 | 4.26 | 301.17 | |
| CEC19_02 | Median | 3.10 | 4.31 | 628.19 | 1165.37 | 231.73 | 6892.84 | 5.00 | 1.00 | 4.26 | 302.64 |
| Max | 3.44 | 5.00 | 10311.45 | 1518.66 | 632.95 | 13211.22 | 5.00 | 1.00 | 4.52 | 564.38 | |
| Std | 0.16 | 0.35 | 2464.02 | 187.09 | 151.77 | 2648.86 | 0.09 | 0.00 | 0.10 | 106.03 | |
| Min | 1.00 | 1.00 | 1.41 | 1.60 | 1.00 | 1.41 | 1.00 | 1.00 | 1.00 | 1.00 | |
| Mean | 1.04 | 1.38 | 4.87 | 2.36 | 1.64 | 1.74 | 2.15 | 1.02 | 1.40 | 1.00 | |
| CEC19_03 | Median | 1.00 | 1.41 | 4.61 | 2.40 | 1.41 | 1.41 | 1.69 | 1.00 | 1.41 | 1.00 |
| Max | 1.41 | 1.41 | 9.71 | 2.87 | 6.71 | 6.71 | 4.38 | 1.41 | 1.41 | 1.00 | |
| Std | 0.12 | 0.11 | 2.64 | 0.27 | 1.11 | 1.05 | 1.03 | 0.10 | 0.06 | 0.00 | |
| Min | 1.00 | 6.97 | 9.04 | 1.00 | 4.98 | 12.94 | 12.05 | 1.99 | 6.97 | 1.00 | |
| Mean | 1.00 | 22.34 | 24.98 | 1.06 | 14.48 | 42.13 | 45.21 | 3.52 | 23.29 | 1.00 | |
| CEC19_04 | Median | 1.00 | 19.90 | 24.52 | 1.01 | 13.46 | 39.81 | 43.94 | 2.99 | 21.89 | 1.00 |
| Max | 1.00 | 46.77 | 44.58 | 2.03 | 27.63 | 73.63 | 80.82 | 5.97 | 45.41 | 1.00 | |
| Std | 0.00 | 9.30 | 8.72 | 0.20 | 4.89 | 14.34 | 13.45 | 1.10 | 9.01 | 0.00 | |
| Min | 1.00 | 1.08 | 1.03 | 1.03 | 1.08 | 1.17 | 1.59 | 1.00 | 1.03 | 1.00 | |
| Mean | 1.00 | 1.40 | 8.42 | 1.08 | 1.43 | 1.90 | 1.91 | 1.00 | 1.14 | 1.00 | |
| CEC19_05 | Median | 1.00 | 1.32 | 9.84 | 1.07 | 1.41 | 1.81 | 1.90 | 1.00 | 1.12 | 1.00 |
| Max | 1.00 | 2.56 | 28.14 | 1.13 | 1.84 | 3.25 | 2.33 | 1.02 | 1.48 | 1.00 | |
| Std | 0.00 | 0.29 | 7.65 | 0.02 | 0.22 | 0.44 | 0.17 | 0.01 | 0.09 | 0.00 | |
| Min | 1.00 | 3.18 | 1.00 | 1.00 | 1.10 | 3.28 | 4.86 | 1.00 | 1.00 | 1.00 | |
| Mean | 1.00 | 5.93 | 4.65 | 1.07 | 1.59 | 7.92 | 8.06 | 1.00 | 3.74 | 1.00 | |
| CEC19_06 | Median | 1.00 | 5.99 | 4.67 | 1.01 | 1.25 | 7.74 | 7.92 | 1.00 | 3.55 | 1.00 |
| Max | 1.00 | 9.32 | 9.03 | 1.48 | 4.31 | 11.76 | 11.26 | 1.00 | 8.08 | 1.00 | |
| Std | 0.00 | 1.41 | 2.08 | 0.13 | 0.78 | 1.54 | 1.52 | 0.00 | 1.85 | 0.00 | |
| Min | 1.12 | 245.49 | 238.45 | 4.12 | 105.53 | 482.69 | 369.43 | 1.19 | 300.26 | 1.06 | |
| Mean | 40.69 | 723.22 | 750.82 | 19.91 | 578.50 | 1059.58 | 983.63 | 33.65 | 797.86 | 46.17 | |
| CEC19_07 | Median | 4.60 | 727.08 | 718.49 | 17.71 | 565.65 | 1086.83 | 969.22 | 4.79 | 773.41 | 7.89 |
| Max | 369.85 | 1281.30 | 1443.48 | 63.32 | 1137.52 | 1595.21 | 1564.28 | 238.52 | 1468.09 | 241.42 | |
| Std | 78.10 | 264.11 | 264.11 | 12.05 | 239.93 | 266.34 | 265.48 | 55.15 | 288.32 | 63.88 | |
| Min | 1.04 | 2.77 | 2.24 | 1.56 | 1.64 | 2.87 | 3.76 | 1.58 | 2.50 | 1.06 | |
| Mean | 1.39 | 3.76 | 3.59 | 2.21 | 3.00 | 4.19 | 4.40 | 2.20 | 3.59 | 1.21 | |
| CEC19_08 | Median | 1.26 | 3.76 | 3.60 | 2.20 | 3.05 | 4.17 | 4.43 | 2.22 | 3.61 | 1.21 |
| Max | 2.62 | 4.51 | 4.52 | 2.80 | 4.04 | 4.98 | 4.98 | 2.65 | 4.55 | 1.83 | |
| Std | 0.37 | 0.37 | 0.54 | 0.28 | 0.61 | 0.35 | 0.30 | 0.24 | 0.43 | 0.15 | |
| Min | 1.01 | 1.09 | 1.04 | 1.07 | 1.04 | 1.07 | 1.10 | 1.02 | 1.04 | 1.00 | |
| Mean | 1.02 | 1.26 | 1.23 | 1.10 | 1.07 | 1.38 | 1.41 | 1.05 | 1.16 | 1.02 | |
| CEC19_09 | Median | 1.02 | 1.23 | 1.17 | 1.10 | 1.07 | 1.37 | 1.38 | 1.05 | 1.15 | 1.02 |
| Max | 1.03 | 1.51 | 1.55 | 1.13 | 1.19 | 1.88 | 1.78 | 1.07 | 1.34 | 1.04 | |
| Std | 0.00 | 0.11 | 0.14 | 0.02 | 0.03 | 0.21 | 0.19 | 0.01 | 0.07 | 0.01 | |
| Min | 1.00 | 1.00 | 21.00 | 8.96 | 1.03 | 6.45 | 20.92 | 1.02 | 1.00 | 1.00 | |
| Mean | 12.62 | 20.63 | 21.02 | 20.16 | 19.71 | 20.76 | 21.01 | 9.06 | 19.13 | 1.19 | |
| CEC19_10 | Median | 15.04 | 21.00 | 21.01 | 21.04 | 21.25 | 21.00 | 21.00 | 3.02 | 21.00 | 1.00 |
| Max | 21.00 | 21.25 | 21.14 | 21.07 | 21.37 | 21.34 | 21.10 | 21.00 | 21.22 | 3.01 | |
| Std | 8.27 | 2.80 | 0.04 | 2.73 | 5.34 | 2.05 | 0.03 | 9.15 | 5.86 | 0.54 |
Figure A13.
Comparison of Friedman ranking for PCOA and other algorithms using the 100D CEC2017 benchmark functions over 51 independent runs and 1,000,000 NFES.
Figure A13.
Comparison of Friedman ranking for PCOA and other algorithms using the 100D CEC2017 benchmark functions over 51 independent runs and 1,000,000 NFES.

Table A9.
Statistical results of PCOA and other algorithms on the CEC2006, over 51 independent runs.
Table A9.
Statistical results of PCOA and other algorithms on the CEC2006, over 51 independent runs.
| Function | PCOA | AVOA | PSO | DE | RW_GWO | WOA | HHO | LSHADE | GBO | EBOwithCMAR | |
|---|---|---|---|---|---|---|---|---|---|---|---|
| Function | PCOA | AVOA | PSO | DE | RW_GWO | WOA | HHO | L_SHADE | GBO | EBO_BIN | |
| Min | 0.01 | 0.01 | 0.01 | 0.01 | 0.01 | 0.01 | 0.01 | 0.01 | 0.01 | 0.01 | |
| Mean | 0.01 | 0.01 | 0.01 | 0.01 | 0.01 | 0.01 | 0.01 | 0.01 | 0.01 | 0.01 | |
| CEC06_1 | Median | 0.01 | 0.01 | 0.01 | 0.01 | 0.01 | 0.01 | 0.01 | 0.01 | 0.01 | 0.01 |
| Max | 0.01 | 0.02 | 0.02 | 0.01 | 0.01 | 0.02 | 0.02 | 0.01 | 0.01 | 0.01 | |
| Std | 0.00 | 0.00 | 0.00 | 0.00 | 0.00 | 0.00 | 0.00 | 0.00 | 0.00 | 0.00 | |
| Min | 0.00 | 0.00 | 0.00 | 0.00 | 0.00 | 0.00 | 0.00 | 0.00 | 0.00 | 0.00 | |
| Mean | 0.00 | 0.00 | 0.00 | 0.00 | 0.00 | 0.00 | 0.00 | 0.00 | 0.00 | 0.00 | |
| CEC06_2 | Median | 0.00 | 0.00 | 0.00 | 0.00 | 0.00 | 0.00 | 0.00 | 0.00 | 0.00 | 0.00 |
| Max | 0.00 | 0.00 | 0.00 | 0.00 | 0.00 | 0.00 | 0.00 | 0.00 | 0.00 | 0.00 | |
| Std | 0.00 | 0.00 | 0.00 | 0.00 | 0.00 | 0.00 | 0.00 | 0.00 | 0.00 | 0.00 | |
| Min | 2522.48 | 2749.58 | 2749.58 | 2749.58 | 2751.00 | 2749.58 | 2749.63 | 2749.58 | 2749.58 | 2749.58 | |
| Mean | 2712.28 | 2750.28 | 2749.58 | 2749.58 | 2759.26 | 2886.49 | 2759.82 | 2749.58 | 2749.58 | 2749.58 | |
| CEC06_3 | Median | 2750.11 | 2749.83 | 2749.58 | 2749.58 | 2759.27 | 2776.88 | 2756.18 | 2749.58 | 2749.58 | 2749.58 |
| Max | 2753.66 | 2754.02 | 2749.58 | 2749.58 | 2770.05 | 4205.24 | 2808.03 | 2749.58 | 2749.58 | 2749.58 | |
| Std | 64.90 | 0.99 | 0.00 | 0.00 | 4.29 | 284.02 | 11.74 | 0.00 | 0.00 | 0.00 | |
| Min | 464.66 | 464.80 | 464.68 | 466.05 | 464.92 | 478.80 | 468.23 | 464.65 | 464.68 | 464.65 | |
| Mean | 464.69 | 469.10 | 464.87 | 471.86 | 467.41 | 552.26 | 479.41 | 464.66 | 465.03 | 464.66 | |
| CEC06_4 | Median | 464.68 | 467.07 | 464.84 | 471.34 | 466.82 | 550.98 | 476.34 | 464.66 | 464.91 | 464.66 |
| Max | 464.79 | 498.31 | 465.31 | 479.73 | 474.27 | 650.83 | 528.17 | 464.69 | 467.26 | 464.69 | |
| Std | 0.03 | 5.45 | 0.14 | 3.05 | 2.30 | 44.24 | 10.29 | 0.01 | 0.44 | 0.01 | |
| Min | 384.78 | 384.88 | 384.80 | 385.22 | 385.06 | 390.25 | 386.55 | 384.78 | 384.78 | 384.78 | |
| Mean | 384.82 | 385.72 | 385.00 | 386.09 | 386.34 | 471.09 | 397.62 | 384.79 | 384.99 | 384.78 | |
| CEC06_5 | Median | 384.81 | 385.59 | 384.94 | 386.05 | 386.40 | 465.47 | 396.08 | 384.79 | 384.91 | 384.78 |
| Max | 384.93 | 387.54 | 385.82 | 387.54 | 388.30 | 624.02 | 418.70 | 384.81 | 385.44 | 384.81 | |
| Std | 0.04 | 0.58 | 0.20 | 0.48 | 0.73 | 60.32 | 7.57 | 0.01 | 0.18 | 0.01 | |
| Min | 455.35 | 455.50 | 455.37 | 457.97 | 455.80 | 461.81 | 462.46 | 455.35 | 455.36 | 455.35 | |
| Mean | 455.37 | 459.94 | 455.55 | 460.96 | 457.79 | 552.40 | 479.45 | 455.37 | 455.64 | 455.35 | |
| CEC06_6 | Median | 455.37 | 457.95 | 455.55 | 460.81 | 457.55 | 545.45 | 475.34 | 455.37 | 455.51 | 455.35 |
| Max | 455.43 | 510.22 | 455.88 | 467.15 | 461.16 | 682.91 | 519.71 | 455.40 | 457.93 | 455.36 | |
| Std | 0.02 | 8.38 | 0.12 | 1.92 | 1.18 | 49.88 | 13.87 | 0.01 | 0.40 | 0.00 |
Table A10.
Statistical results of PCOA and other algorithms on the CEC2011, over 25 independent runs.
Table A10.
Statistical results of PCOA and other algorithms on the CEC2011, over 25 independent runs.
| Function | PCOA | AVOA | PSO | DE | RW_GWO | WOA | HHO | LSHADE | GBO | EBOwithCMAR | |
|---|---|---|---|---|---|---|---|---|---|---|---|
| Min | 0.00 | 0.00 | 6.53 | 0.00 | 0.02 | 11.49 | 2.06 | 0.00 | 0.00 | 0.00 | |
| Mean | 1.41 | 15.73 | 16.48 | 4.60 | 13.46 | 19.05 | 19.41 | 0.02 | 14.66 | 0.00 | |
| CEC11_01 | Median | 0.01 | 16.66 | 14.93 | 3.80 | 12.32 | 19.85 | 21.42 | 0.01 | 14.91 | 0.00 |
| Max | 9.79 | 22.75 | 24.14 | 12.84 | 21.97 | 24.03 | 25.10 | 0.09 | 24.75 | 0.00 | |
| Std | 3.00 | 5.15 | 5.28 | 4.09 | 5.72 | 3.77 | 4.89 | 0.03 | 6.71 | 0.00 | |
| Min | −18.42 | −18.42 | −17.52 | −13.65 | −17.40 | −16.31 | −12.27 | −15.25 | −18.42 | −12.43 | |
| Mean | −16.66 | −15.89 | −13.90 | −11.86 | −14.58 | −19.28 | −14.95 | −13.72 | −16.70 | −18.98 | |
| CEC11_02 | Median | −17.11 | −16.52 | −15.33 | −11.76 | −15.36 | −19.52 | −15.17 | −13.74 | −16.52 | −17.55 |
| Max | −18.86 | −17.06 | −11.11 | −10.46 | −10.27 | −12.11 | −1.73 | −11.22 | −15.34 | −16.46 | |
| Std | 1.77 | 2.37 | 4.34 | 0.69 | 1.83 | 3.92 | 2.82 | 1.11 | 0.81 | 3.41 | |
| Min | 13.77 | 13.77 | 13.77 | 13.77 | 22.00 | 13.77 | 13.77 | 13.77 | 13.77 | 13.77 | |
| Mean | 13.77 | 13.93 | 15.74 | 19.04 | 22.00 | 13.86 | 14.06 | 14.08 | 13.96 | 14.56 | |
| CEC11_03 | Median | 13.77 | 13.77 | 14.33 | 20.82 | 22.00 | 13.77 | 13.98 | 14.33 | 13.85 | 14.33 |
| Max | 13.77 | 14.33 | 20.96 | 21.54 | 22.00 | 14.33 | 14.33 | 14.33 | 14.33 | 20.96 | |
| Std | 0.00 | 0.26 | 3.00 | 2.92 | 0.00 | 0.21 | 0.27 | 0.28 | 0.24 | 1.39 | |
| Min | −19.17 | −19.17 | −11.07 | −11.84 | −19.03 | −19.16 | −16.33 | −19.16 | −12.71 | −139.58 | |
| Mean | −15.72 | −12.77 | 68.96 | 639993.58 | −13.22 | −19.58 | −17.44 | −19.15 | 599992.22 | 119927.45 | |
| CEC11_04 | Median | −16.50 | −13.01 | 28.67 | 999999.00 | −13.01 | −10.34 | −16.84 | −19.15 | 999999.00 | −17.89 |
| Max | −11.27 | −15.09 | 259.18 | 999999.00 | −19.51 | −12.42 | −12.37 | −19.09 | 999999.00 | 999999.00 | |
| Std | 2.91 | 3.64 | 89.24 | 489905.33 | 2.39 | 3.94 | 3.20 | 0.02 | 500008.48 | 331689.44 | |
| Min | 0.50 | 0.50 | 0.71 | 1.14 | 0.50 | 1.29 | 1.51 | 1.02 | 0.86 | 0.50 | |
| Mean | 0.50 | 0.92 | 0.94 | 1.45 | 1.12 | 1.84 | 1.79 | 1.24 | 1.12 | 0.61 | |
| CEC11_05 | Median | 0.50 | 0.96 | 0.98 | 1.48 | 0.95 | 1.84 | 1.76 | 1.26 | 1.11 | 0.60 |
| Max | 0.50 | 1.76 | 1.23 | 1.62 | 2.24 | 2.11 | 2.09 | 1.41 | 1.48 | 0.94 | |
| Std | 0.00 | 0.42 | 0.15 | 0.11 | 0.45 | 0.19 | 0.16 | 0.10 | 0.17 | 0.10 | |
| Min | 1552.55 | 276.00 | 141739.85 | 70489.55 | 276.00 | 85737.56 | 636544.57 | 1445.63 | 1650.06 | 951.89 | |
| Mean | 2587.62 | 276.00 | 497339.93 | 77454.95 | 276.00 | 329594.72 | 866109.74 | 2320.93 | 27312.16 | 2746.01 | |
| CEC11_06 | Median | 2556.01 | 276.00 | 490832.51 | 78416.59 | 276.00 | 277460.83 | 829889.65 | 2172.22 | 6255.91 | 2486.81 |
| Max | 4251.39 | 276.00 | 937154.93 | 86909.05 | 276.00 | 988037.86 | 1412178.14 | 3668.35 | 244113.32 | 6191.53 | |
| Std | 678.35 | 0.00 | 191825.36 | 4452.09 | 0.00 | 187525.11 | 172888.68 | 611.83 | 53248.10 | 1269.08 | |
| Min | −11.74 | 50839.74 | 73657.95 | 2671395.85 | 179725.51 | 1079038.97 | 844051.65 | 51421.34 | 51516.81 | 49795.05 | |
| Mean | −11.49 | 51931.42 | 977042.57 | 8108830.36 | 1226566.54 | 1283885.59 | 1077297.57 | 52340.32 | 52332.50 | 54633.15 | |
| CEC11_07 | Median | −11.53 | 51966.51 | 864259.83 | 7906327.72 | 1166252.02 | 1289379.36 | 1075151.78 | 52431.04 | 52272.64 | 51036.64 |
| Max | −10.83 | 52886.07 | 2162549.98 | 17822571.76 | 2791576.91 | 1517540.11 | 1307857.18 | 53085.25 | 53129.64 | 140531.31 | |
| Std | 0.20 | 584.81 | 567785.02 | 3554121.32 | 696306.91 | 127610.82 | 107536.82 | 443.53 | 416.53 | 17905.28 | |
| Min | 50901.31 | −1.00 | 1085435.80 | 2167360.78 | 1081583.43 | 4754050.00 | 5055128.46 | 1070988.13 | 1066501.11 | 1078713.57 | |
| Mean | 52052.82 | −1.00 | 1150668.14 | 2424708.11 | 1164355.05 | 5734290.01 | 5636371.99 | 1073658.22 | 1089573.42 | 1091056.62 | |
| CEC11_08 | Median | 52011.79 | −1.00 | 1125337.72 | 2409397.75 | 1145458.89 | 5705051.15 | 5732391.42 | 1073465.79 | 1076630.86 | 1089220.71 |
| Max | 53009.27 | −1.00 | 1432486.28 | 2592310.04 | 1305362.44 | 6836173.02 | 6136753.67 | 1077117.75 | 1170827.71 | 1116992.41 | |
| Std | 505.97 | 0.00 | 75513.32 | 108410.33 | 61487.58 | 517550.00 | 334879.67 | 1430.31 | 26038.43 | 8036.46 | |
| Min | 1074177.62 | 15459.24 | 15447.53 | 15451.83 | 15444.85 | 15482.09 | 15448.95 | 15444.19 | 15451.72 | 15447.68 | |
| Mean | 1077796.86 | 15509.64 | 15472.60 | 15466.50 | 15465.39 | 15542.90 | 15507.90 | 15444.19 | 15513.24 | 23783.56 | |
| CEC11_09 | Median | 1077450.40 | 15506.46 | 15467.74 | 15465.18 | 15464.02 | 15539.42 | 15502.58 | 15444.19 | 15489.84 | 15488.33 |
| Max | 1084215.41 | 15619.66 | 15514.91 | 15497.40 | 15517.96 | 15689.94 | 15713.47 | 15444.19 | 15603.33 | 82872.58 | |
| Std | 2102.14 | 35.52 | 20.72 | 11.26 | 17.25 | 49.60 | 56.54 | 0.00 | 48.65 | 16470.80 | |
| Min | 15444.20 | 18751.11 | 18955.07 | 18864.00 | 18782.74 | 19045.79 | 18924.30 | 18018.81 | 18644.30 | 18117.65 | |
| Mean | 15444.40 | 19132.46 | 19236.57 | 19246.16 | 19162.64 | 19320.68 | 19331.89 | 18118.79 | 19010.07 | 18304.53 | |
| CEC11_10 | Median | 15444.33 | 19148.63 | 19276.62 | 19229.57 | 19144.88 | 19328.97 | 19365.14 | 18113.04 | 19005.19 | 18288.00 |
| Max | 15445.15 | 19417.13 | 19573.09 | 19571.02 | 19528.45 | 19535.33 | 19681.85 | 18253.92 | 19360.71 | 18639.64 | |
| Std | 0.22 | 141.26 | 170.96 | 206.68 | 214.78 | 138.79 | 187.60 | 56.40 | 162.56 | 134.20 | |
| Min | 18028.35 | 32878.03 | 32902.41 | 32820.39 | 32886.66 | 33017.61 | 33011.09 | 32740.27 | 32748.88 | 33221.98 | |
| Mean | 18080.89 | 33179.87 | 33065.87 | 32908.11 | 33028.46 | 68765.72 | 79767.09 | 32740.79 | 32976.34 | 231364.35 | |
| CEC11_11 | Median | 18082.85 | 33180.67 | 33058.16 | 32896.03 | 33033.86 | 33330.44 | 33276.02 | 32740.56 | 32976.63 | 157042.72 |
| Max | 18089.22 | 33444.90 | 33281.82 | 33017.64 | 33288.78 | 378760.69 | 351923.61 | 32743.42 | 33343.51 | 834765.88 | |
| Std | 11.04 | 131.17 | 94.80 | 44.91 | 93.90 | 81088.81 | 86648.34 | 0.69 | 118.44 | 235751.07 | |
| Min | 32747.13 | 128436.81 | 131901.91 | 132868.82 | 130831.47 | 136215.66 | 131465.71 | 124321.46 | 128658.44 | 123741.57 | |
| Mean | 32831.27 | 140780.47 | 138260.66 | 137048.59 | 138449.56 | 147430.49 | 147439.78 | 126600.93 | 142175.72 | 125055.74 | |
| CEC11_12 | Median | 32835.84 | 140744.76 | 137783.90 | 136949.60 | 137405.52 | 148383.66 | 147541.42 | 126430.83 | 143535.65 | 124859.69 |
| Max | 32913.80 | 163201.86 | 146011.73 | 142049.26 | 152004.76 | 156292.50 | 160652.12 | 128586.34 | 153778.42 | 127272.45 | |
| Std | 39.71 | 8359.81 | 4299.43 | 2319.69 | 5202.79 | 5251.41 | 5928.64 | 1066.73 | 6792.22 | 859.40 | |
| Min | 122505.31 | 1930428.28 | 1945623.48 | 1944161.27 | 1945720.36 | 7726884358.46 | 2005470362.16 | 1861887.69 | 1927117.66 | 1855197.95 | |
| Mean | 123476.78 | 2561734.09 | 2494342.73 | 2186020.42 | 2503682.90 | 11903068077.39 | 3941812140.22 | 1885476.33 | 2395618.07 | 1971252.82 | |
| CEC11_13 | Median | 123485.62 | 2284701.14 | 2427551.13 | 2153785.96 | 2200330.35 | 11447819359.27 | 3797990141.83 | 1886486.24 | 2353480.53 | 1939378.23 |
| Max | 124773.04 | 4399930.03 | 3962075.04 | 2521246.03 | 3890218.00 | 17528363172.57 | 6381060003.82 | 1913332.70 | 4529421.02 | 2283288.76 | |
| Std | 679.38 | 675718.43 | 538192.41 | 169472.29 | 572426.41 | 2835687898.14 | 1140520813.39 | 12151.17 | 583799.27 | 103990.59 | |
| Min | 1863920.05 | 941849.49 | 954638.61 | 1495756.99 | 951416.11 | 1126296.44 | 1143797.77 | 931788.50 | 940925.15 | 932554.77 | |
| Mean | 1903734.28 | 1274993.49 | 978836.56 | 2264687.02 | 969450.84 | 3778221.29 | 2518310.61 | 937371.26 | 1184095.29 | 936770.93 | |
| CEC11_14 | Median | 1902236.61 | 955856.60 | 974694.73 | 2228997.20 | 968567.12 | 2657983.25 | 2600770.02 | 937265.55 | 955554.68 | 936959.84 |
| Max | 1929218.62 | 3168699.21 | 1113024.24 | 2956030.55 | 992366.83 | 14272534.86 | 3905498.51 | 941670.57 | 3140878.67 | 940695.62 | |
| Std | 15110.54 | 609751.60 | 29245.71 | 391035.75 | 9412.84 | 3045108.32 | 698322.05 | 2701.65 | 516519.40 | 2119.25 | |
| Min | 924988.38 | 1327658.14 | 1032135.13 | 2056007.54 | 1069126.57 | 1724267.96 | 1905637.22 | 937089.50 | 998182.72 | 937455.09 | |
| Mean | 926039.02 | 2046687.30 | 1258767.56 | 2828111.86 | 1309575.11 | 6264590.00 | 3297726.23 | 941015.11 | 1344472.06 | 942472.21 | |
| CEC11_15 | Median | 926037.70 | 1786470.00 | 1249938.18 | 2844296.39 | 1303127.52 | 4314947.66 | 2886428.18 | 940552.14 | 1279200.17 | 942014.10 |
| Max | 927502.52 | 3751699.50 | 1487934.82 | 3416317.88 | 1663842.81 | 23442234.17 | 7092458.85 | 948157.10 | 2801185.32 | 953980.50 | |
| Std | 715.35 | 676209.07 | 134492.73 | 327779.35 | 140301.90 | 5275163.04 | 1255903.48 | 2589.49 | 421179.08 | 3497.43 | |
| Min | 928359.37 | 945322.70 | 957289.68 | 1533893.63 | 966100.40 | 1123529.06 | 1280726.03 | 933470.94 | 942804.32 | 932637.67 | |
| Mean | 933631.94 | 1316757.53 | 972938.11 | 2195326.57 | 987737.54 | 4475588.85 | 2367518.16 | 937300.70 | 1106441.65 | 936145.02 | |
| CEC11_16 | Median | 933990.16 | 1068889.56 | 972340.12 | 2109765.22 | 977394.59 | 2643035.90 | 1867048.70 | 937066.15 | 957536.60 | 936002.39 |
| Max | 938931.36 | 2556828.08 | 987884.90 | 3014580.73 | 1097222.42 | 16686744.65 | 5039477.25 | 942275.84 | 2437343.25 | 939918.90 | |
| Std | 2536.51 | 506756.23 | 7858.08 | 398425.84 | 30763.56 | 4492618.92 | 1026801.36 | 2477.72 | 391839.26 | 1578.15 | |
| Min | 924739.22 | 19919191.15 | 957289.68 | 1533893.63 | 957360.13 | 1123529.06 | 1280726.03 | 933470.94 | 942804.32 | 932637.67 | |
| Mean | 926182.48 | 26324193.34 | 972938.11 | 2195326.57 | 973923.72 | 4475588.85 | 2367518.16 | 937300.70 | 1106441.65 | 936145.02 | |
| CEC11_17 | Median | 926235.72 | 26362916.56 | 972340.12 | 2109765.22 | 972845.75 | 2643035.90 | 1867048.70 | 937066.15 | 957536.60 | 936002.39 |
| Max | 928083.87 | 31358238.73 | 987884.90 | 3014580.73 | 990713.06 | 16686744.65 | 5039477.25 | 942275.84 | 2437343.25 | 939918.90 | |
| Std | 926.03 | 2945458.10 | 7858.08 | 398425.84 | 7506.78 | 4492618.92 |
References
- Wolpert, D.; Macready, W. No free lunch theorems for optimization. IEEE Trans. Evol. Comput. 1997, 1, 67–82. [Google Scholar] [CrossRef]
- Holland, J.H. Adaptation in Natural and Artificial Systems: An Introductory Analysis with Applications to Biology, Control, and Artificial Intelligence; MIT Press: Cambridge, MA, USA, 1992; 211p. [Google Scholar]
- Storn, R.; Price, K. Differential Evolution—A Simple and Efficient Heuristic for global Optimization over Continuous Spaces. J. Glob. Optim. 1997, 11, 341–359. [Google Scholar] [CrossRef]
- Geem, Z.W.; Kim, J.H.; Loganathan, G. A New Heuristic Optimization Algorithm: Harmony Search. Simulation 2001, 76, 60–68. [Google Scholar] [CrossRef]
- Hayyolalam, V.; Pourhaji Kazem, A.A. Black Widow Optimization Algorithm: A novel meta-heuristic approach for solving engineering optimization problems. Eng. Appl. Artif. Intell. 2020, 87, 103249. [Google Scholar] [CrossRef]
- Rahman, C.M.; Rashid, T.A. A new evolutionary algorithm: Learner performance based behavior algorithm. Egypt. Inform. J. 2021, 22, 213–223. [Google Scholar] [CrossRef]
- Sulaiman, M.H.; Mustaffa, Z.; Saari, M.M.; Daniyal, H.; Mirjalili, S. Evolutionary mating algorithm. Neural Comput. Appl. 2023, 35, 487–516. [Google Scholar] [CrossRef]
- Díaz-Cortés, G.B.; Luna-García, R. A Novel Evolutionary Algorithm: One-Dimensional Subspaces Optimization Algorithm (1D-SOA). Symmetry 2023, 15, 1873. [Google Scholar] [CrossRef]
- Kennedy, J.; Eberhart, R. Particle swarm optimization. In Proceedings of the ICNN’95-International Conference on Neural Networks, Perth, WA, Australia, 27 November–1 December 1995; Volume 4, pp. 1942–1948. [Google Scholar]
- Karaboga, D.; Basturk, B. Artificial bee colony (ABC) optimization algorithm for solving constrained optimization problems. In Proceedings of the 12th International Fuzzy Systems Association World Congress, IFSA 2007, Cancun, Mexico, 18–21 June 2007; pp. 789–798. [Google Scholar]
- Yang, X.S. Firefly algorithm. In Nature-Inspired Metaheuristic Algorithms; Luniver Press: Frome, UK, 2008; pp. 79–90. [Google Scholar]
- Yang, X.; Hossein Gandomi, A. Bat algorithm: A novel approach for global engineering optimization. Eng. Comput. 2012, 29, 464–483. [Google Scholar] [CrossRef]
- Gandomi, A.H.; Alavi, A.H. Krill herd: A new bio-inspired optimization algorithm. Commun. Nonlinear Sci. Numer. Simul. 2012, 17, 4831–4845. [Google Scholar] [CrossRef]
- Mirjalili, S.; Mirjalili, S.M.; Lewis, A. Grey Wolf Optimizer. Adv. Eng. Softw. 2014, 69, 46–61. [Google Scholar] [CrossRef]
- Mirjalili, S.; Lewis, A. The Whale Optimization Algorithm. Adv. Eng. Softw. 2016, 95, 51–67. [Google Scholar] [CrossRef]
- Heidari, A.A.; Mirjalili, S.; Faris, H.; Aljarah, I.; Mafarja, M.; Chen, H. Harris hawks optimization: Algorithm and applications. Future Gener. Comput. Syst. 2019, 97, 849–872. [Google Scholar] [CrossRef]
- Dehghani, M.; Montazeri, Z.; Trojovská, E.; Trojovský, P. Coati Optimization Algorithm: A new bio-inspired metaheuristic algorithm for solving optimization problems. Knowl.-Based Syst. 2023, 259, 110011. [Google Scholar] [CrossRef]
- Xue, J.; Shen, B. Dung beetle optimizer: A new meta-heuristic algorithm for global optimization. J. Supercomput. 2023, 79, 7305–7336. [Google Scholar] [CrossRef]
- Dehghani, M.; Montazeri, Z.; Bektemyssova, G.; Malik, O.P.; Dhiman, G.; Ahmed, A.E.M. Kookaburra Optimization Algorithm: A New Bio-Inspired Metaheuristic Algorithm for Solving Optimization Problems. Biomimetics 2023, 8, 470. [Google Scholar] [CrossRef]
- Alsayyed, O.; Hamadneh, T.; Al-Tarawneh, H.; Alqudah, M.; Gochhait, S.; Leonova, I.; Malik, O.P.; Dehghani, M. Giant Armadillo Optimization: A New Bio-Inspired Metaheuristic Algorithm for Solving Optimization Problems. Biomimetics 2023, 8, 619. [Google Scholar] [CrossRef]
- Dehghani, M.; Bektemyssova, G.; Montazeri, Z.; Shaikemelev, G.; Malik, O.P.; Dhiman, G. Lyrebird Optimization Algorithm: A New Bio-Inspired Metaheuristic Algorithm for Solving Optimization Problems. Biomimetics 2023, 8, 507. [Google Scholar] [CrossRef]
- Anaraki, M.V.; Farzin, S. Humboldt Squid Optimization Algorithm (HSOA): A Novel Nature-Inspired Technique for Solving Optimization Problems. IEEE Access 2023, 11, 122069–122115. [Google Scholar] [CrossRef]
- Formato, R.A. Central Force Optimization: A New Nature Inspired Computational Framework for Multidimensional Search and Optimization. In Nature Inspired Cooperative Strategies for Optimization (NICSO 2007); Springer: Berlin/Heidelberg, Germany, 2008; pp. 221–238. [Google Scholar] [CrossRef]
- Kaveh, A.; Talatahari, S. A novel heuristic optimization method: Charged system search. Acta Mech. 2010, 213, 267–289. [Google Scholar] [CrossRef]
- Alatas, B. ACROA: Artificial Chemical Reaction Optimization Algorithm for global optimization. Expert Syst. Appl. 2011, 38, 13170–13180. [Google Scholar] [CrossRef]
- Mirjalili, S.; Mirjalili, S.M.; Hatamlou, A. Multi-Verse Optimizer: A nature-inspired algorithm for global optimization. Neural Comput. Appl. 2016, 27, 495–513. [Google Scholar] [CrossRef]
- Karami, H.; Anaraki, M.V.; Farzin, S.; Mirjalili, S. Flow Direction Algorithm (FDA): A Novel Optimization Approach for Solving Optimization Problems. Comput. Ind. Eng. 2021, 156, 107224. [Google Scholar] [CrossRef]
- Su, H.; Zhao, D.; Heidari, A.A.; Liu, L.; Zhang, X.; Mafarja, M.; Chen, H. RIME: A physics-based optimization. Neurocomputing 2023, 532, 183–214. [Google Scholar] [CrossRef]
- Glover, F. Tabu Search—Part I. ORSA J. Comput. 1989, 1, 190–206. [Google Scholar] [CrossRef]
- Samareh Moosavi, S.H.; Bardsiri, V.K. Poor and rich optimization algorithm: A new human-based and multi populations algorithm. Eng. Appl. Artif. Intell. 2019, 86, 165–181. [Google Scholar] [CrossRef]
- Al-Betar, M.A.; Alyasseri, Z.A.A.; Awadallah, M.A.; Doush, I.A. Coronavirus herd immunity optimizer (CHIO). Neural Comput. Appl. 2020, 33, 5011–5042. [Google Scholar] [CrossRef]
- Mirrashid, M.; Naderpour, H. Incomprehensible but Intelligible-in-time logics: Theory and optimization algorithm. Knowl.-Based Syst. 2023, 264, 110305. [Google Scholar] [CrossRef]
- Hubalovska, M.; Major, S. A New Human-Based Metaheuristic Algorithm for Solving Optimization Problems Based on Technical and Vocational Education and Training. Biomimetics 2023, 8, 508. [Google Scholar] [CrossRef]
- Zhu, D.; Wang, S.; Zhou, C.; Yan, S.; Xue, J. Human memory optimization algorithm: A memory-inspired optimizer for global optimization problems. Expert Syst. Appl. 2024, 237, 121597. [Google Scholar] [CrossRef]
- Kaveh, A. Tug of War Optimization. In Advances in Metaheuristic Algorithms for Optimal Design of Structures; Springer International Publishing: Cham, Switzerland, 2017; pp. 451–487. [Google Scholar] [CrossRef]
- Dehghani, M.; Mardaneh, M.; Guerrero, J.; Malik, O.; Kumar, V. Football Game Based Optimization: An Application to Solve Energy Commitment Problem. Int. J. Intell. Eng. Syst. 2020, 13, 514–523. [Google Scholar] [CrossRef]
- Barik, S.; Das, D. Athletic Run Based Optimization: A novel method for the integration of DGs and shunt capacitors. In Proceedings of the 2021 IEEE International Conference on Electronics, Computing and Communication Technologies (CONECCT), Bangalore, India, 9–11 July 2021; pp. 1–6. [Google Scholar] [CrossRef]
- Połap, D.; Woz´niak, M. Polar Bear Optimization Algorithm: Meta-Heuristic with Fast Population Movement and Dynamic Birth and Death Mechanism. Symmetry 2017, 9, 203. [Google Scholar] [CrossRef]
- Sun, W.z.; Wang, J.s.; Wei, X. An Improved Whale Optimization Algorithm Based on Different Searching Paths and Perceptual Disturbance. Symmetry 2018, 10, 210. [Google Scholar] [CrossRef]
- Li, G.; Shuang, F.; Zhao, P.; Le, C. An Improved Butterfly Optimization Algorithm for Engineering Design Problems Using the Cross-Entropy Method. Symmetry 2019, 11, 1049. [Google Scholar] [CrossRef]
- Ma, Z.; Yuan, X.; Han, S.; Sun, D.; Ma, Y. Improved Chaotic Particle Swarm Optimization Algorithm with More Symmetric Distribution for Numerical Function Optimization. Symmetry 2019, 11, 876. [Google Scholar] [CrossRef]
- Mehrabian, A.; Lucas, C. A novel numerical optimization algorithm inspired from weed colonization. Ecol. Inform. 2006, 1, 355–366. [Google Scholar] [CrossRef]
- Yang, X.S. Flower pollination algorithm for global optimization. In Proceedings of the International Conference on Unconventional Computing and Natural Computation, Orléans, France, 3–7 September 2012; pp. 240–249. [Google Scholar]
- Kiran, M.S. TSA: Tree-seed algorithm for continuous optimization. Expert Syst. Appl. 2015, 42, 6686–6698. [Google Scholar] [CrossRef]
- Cheraghalipour, A.; Hajiaghaei-Keshteli, M.; Paydar, M.M. Tree Growth Algorithm (TGA): A novel approach for solving optimization problems. Eng. Appl. Artif. Intell. 2018, 72, 393–414. [Google Scholar] [CrossRef]
- Alimoradi, M.; Azgomi, H.; Asghari, A. Trees Social Relations Optimization Algorithm: A new Swarm-Based metaheuristic technique to solve continuous and discrete optimization problems. Math. Comput. Simul. 2022, 194, 629–664. [Google Scholar] [CrossRef]
- Kaveh, M.; Mesgari, M.S.; Saeidian, B. Orchard Algorithm (OA): A new meta-heuristic algorithm for solving discrete and continuous optimization problems. Math. Comput. Simul. 2023, 208, 95–135. [Google Scholar] [CrossRef]
- Mahmoodabadi, M.J.; Rasekh, M.; Yahyapour, M. Tree optimization algorithm (TOA): A novel metaheuristic approach for solving mathematical test functions and engineering problems. Evol. Intell. 2023, 16, 1325–1338. [Google Scholar] [CrossRef]
- Bello, A.; Manyala, N.; Barzegar, F.; Khaleed, A.A.; Momodu, D.Y.; Dangbegnon, J.K. Renewable pine cone biomass derived carbon materials for supercapacitor application. RSC Adv. 2016, 6, 1800–1809. [Google Scholar] [CrossRef]
- Culley, T.M.; Weller, S.G.; Sakai, A.K. The evolution of wind pollination in angiosperms. Trends Ecol. Evol. 2002, 17, 361–369. [Google Scholar] [CrossRef]
- Lu, Y.; Jin, B.; Wang, L.; Wang, Y.; Wang, D.; Jiang, X.X.; Chen, P. Adaptation of male reproductive structures to wind pollination in gymnosperms: Cones and pollen grains. Can. J. Plant Sci. 2011, 91, 897–906. [Google Scholar] [CrossRef]
- Burczyk, J.; Adams, W.T.; Shimizu, J.Y. Mating patterns and pollen dispersal in a natural knobcone pine (Pinus attenuate Lemmon.) stand. Heredity 1996, 77, 251–260. [Google Scholar] [CrossRef]
- Offord, C.A.; Porter, C.L.; Meagher, P.F.; Errington, G. Sexual reproduction and early plant growth of the Wollemi pine (Wollemia nobilis), a rare and threatened Australian conifer. Ann. Bot. 1999, 84, 1–9. [Google Scholar] [CrossRef]
- Benkman, C.W. Wind dispersal capacity of pine seeds and the evolution of different seed dispersal modes in pines. Oikos 1995, 73, 221–224. [Google Scholar] [CrossRef]
- Baker, R. Mathematics in the Garden: Arranging Sweetcorn Plants for Maximum Pollination. Math. Today 2020, 56, 107–109. [Google Scholar]
- Moller, H. Foods and foraging behaviour of Red (Sciurus vulgaris) and Grey (Sciurus carolinensis) squirrels. Mammal Rev. 1983, 13, 81–98. [Google Scholar] [CrossRef]
- Sun, P.; Liu, H.; Zhang, Y.; Meng, Q.; Tu, L.; Zhao, J. An improved atom search optimization with dynamic opposite learning and heterogeneous comprehensive learning. Appl. Soft Comput. 2021, 103, 107140. [Google Scholar] [CrossRef]
- Awad, N.H.; Ali, M.Z.; Liang, J.J.; Qu, B.Y.; Suganthan, P.N. Problem Definitions and Evaluation Criteria for the CEC 2017 Special Session and Competition on Single Objective Bound Constrained Real-Parameter Numerical Optimization; Technical Report; Nanyang Technological University: Singapore, 2016. [Google Scholar]
- Das, S.; Suganthan, P.N. Problem Definitions and Evaluation Criteria for CEC 2011 Competition on Testing Evolutionary Algorithms on Real World Optimization Problems; Jadavpur University: Kolkata, India; Nanyang Technological University: Singapore, 2010; pp. 341–359. [Google Scholar]
- Awad, N.H.; Ali, M.Z.; Suganthan, P.N. Ensemble sinusoidal differential covariance matrix adaptation with Euclidean neighborhood for solving CEC2017 benchmark problems. In Proceedings of the 2017 IEEE Congress on Evolutionary Computation (CEC), Donostia, Spain, 5–8 June 2017; pp. 372–379. [Google Scholar]
- Nematollahi, A.F.; Rahiminejad, A.; Vahidi, B. A novel meta-heuristic optimization method based on golden ratio in nature. Soft Comput. 2020, 24, 1117–1151. [Google Scholar] [CrossRef]
- Zhao, W.; Zhang, Z.; Wang, L. Manta ray foraging optimization: An effective bio-inspired optimizer for engineering applications. Eng. Appl. Artif. Intell. 2020, 87, 103300. [Google Scholar] [CrossRef]
- Kumar, A.; Misra, R.K.; Singh, D. Improving the local search capability of effective butterfly optimizer using covariance matrix adapted retreat phase. In Proceedings of the 2017 IEEE Congress on Evolutionary Computation (CEC), Donostia, Spain, 5–8 June 2017; pp. 1835–1842. [Google Scholar]
- Tanabe, R.; Fukunaga, A.S. Improving the search performance of SHADE using linear population size reduction. In Proceedings of the 2014 IEEE Congress on Evolutionary Computation (CEC), Beijing, China, 6–11 July 2014; pp. 1658–1665. [Google Scholar]
- Faramarzi, A.; Heidarinejad, M.; Stephens, B.; Mirjalili, S. Equilibrium optimizer: A novel optimization algorithm. Knowl.-Based Syst. 2020, 191, 105190. [Google Scholar] [CrossRef]
- Ahmadianfar, I.; Heidari, A.A.; Gandomi, A.H.; Chu, X.; Chen, H. RUN beyond the metaphor: An efficient optimization algorithm based on Runge Kutta method. Expert Syst. Appl. 2021, 181, 115079. [Google Scholar] [CrossRef]
- Derrac, J.; García, S.; Molina, D.; Herrera, F. A practical tutorial on the use of nonparametric statistical tests as a methodology for comparing evolutionary and swarm intelligence algorithms. Swarm Evol. Comput. 2011, 1, 3–18. [Google Scholar] [CrossRef]
Figure 1.
Nature-based optimization algorithms in various categories.

Figure 2.
Pine tree life cycle and swarms in the forest. (a) Pine tree life cycle. (b) Pine tree forest.
Figure 2.
Pine tree life cycle and swarms in the forest. (a) Pine tree life cycle. (b) Pine tree forest.

Figure 3.
Pine Cone Optimization Algorithm (PCOA) flowchart.

Figure 4.
PCOA sensitivity analysis using classic benchmark functions. (a) N_Tree; (b) N_Cone; (c) N_Cycle; (d) P1; (e) P2.
Figure 4.
PCOA sensitivity analysis using classic benchmark functions. (a) N_Tree; (b) N_Cone; (c) N_Cycle; (d) P1; (e) P2.

Figure 5.
Comparison of Wilcoxon test for PCOA and other algorithms using the classic benchmark functions over 51 independent runs and 150,000 NFES.
Figure 5.
Comparison of Wilcoxon test for PCOA and other algorithms using the classic benchmark functions over 51 independent runs and 150,000 NFES.

Figure 6.
Comparison of Friedman ranking for PCOA and other algorithms using the classic benchmark functions over 51 independent runs and 150,000 NFES.
Figure 6.
Comparison of Friedman ranking for PCOA and other algorithms using the classic benchmark functions over 51 independent runs and 150,000 NFES.

Figure 7.
Comparison of Wilcoxon test for PCOA and other algorithms using the 10D CEC2017 benchmark functions over 51 independent runs and 100,000 NFES.
Figure 7.
Comparison of Wilcoxon test for PCOA and other algorithms using the 10D CEC2017 benchmark functions over 51 independent runs and 100,000 NFES.

Figure 8.
Comparison of Friedman ranking for PCOA and other algorithms using the 10D CEC2017 benchmark functions over 51 independent runs and 100,000 NFES.
Figure 8.
Comparison of Friedman ranking for PCOA and other algorithms using the 10D CEC2017 benchmark functions over 51 independent runs and 100,000 NFES.

Figure 9.
Comparison of Wilcoxon test for PCOA and other algorithms using the CEC2019 benchmark functions over 51 independent runs.
Figure 9.
Comparison of Wilcoxon test for PCOA and other algorithms using the CEC2019 benchmark functions over 51 independent runs.

Figure 10.
Comparison of Friedman ranking for PCOA and other algorithms using the CEC2019 benchmark functions over 51 independent runs.
Figure 10.
Comparison of Friedman ranking for PCOA and other algorithms using the CEC2019 benchmark functions over 51 independent runs.

Figure 11.
Comparison of Wilcoxon test for PCOA and other algorithms using the CEC2006 benchmark functions over 51 independent runs.
Figure 11.
Comparison of Wilcoxon test for PCOA and other algorithms using the CEC2006 benchmark functions over 51 independent runs.

Figure 12.
Comparison of Friedman ranking for PCOA and other algorithms using the CEC2006 benchmark functions over 51 independent runs.
Figure 12.
Comparison of Friedman ranking for PCOA and other algorithms using the CEC2006 benchmark functions over 51 independent runs.

Figure 13.
Comparison of Wilcoxon test for PCOA and other algorithms using the CEC2011 benchmark functions over 25 independent runs.
Figure 13.
Comparison of Wilcoxon test for PCOA and other algorithms using the CEC2011 benchmark functions over 25 independent runs.

Figure 14.
Comparison of Friedman ranking for PCOA and other algorithms using the CEC2011 benchmark functions over 25 independent runs.
Figure 14.
Comparison of Friedman ranking for PCOA and other algorithms using the CEC2011 benchmark functions over 25 independent runs.

Figure 15.
Violin plots of PCOA and competitors in optimizing CEC2019 benchmark functions. (a) CEC19_01; (b) CEC19_02; (c) CEC19_03; (d) CEC19_04; (e) CEC19_05; (f) CEC19_06; (g) CEC19_07; (h) CEC19_08; (i) CEC19_09; (j) CEC19_10; (k) Legend.
Figure 15.
Violin plots of PCOA and competitors in optimizing CEC2019 benchmark functions. (a) CEC19_01; (b) CEC19_02; (c) CEC19_03; (d) CEC19_04; (e) CEC19_05; (f) CEC19_06; (g) CEC19_07; (h) CEC19_08; (i) CEC19_09; (j) CEC19_10; (k) Legend.


Figure 16.
Convergence plots of PCOA and competitors in optimizing CEC2019 benchmark functions. (a) CEC19_01; (b) CEC19_02; (c) CEC19_03; (d) CEC19_04; (e) CEC19_05; (f) CEC19_06; (g) CEC19_07; (h) CEC19_08; (i) CEC19_09; (j) CEC19_10; (k) Legend.
Figure 16.
Convergence plots of PCOA and competitors in optimizing CEC2019 benchmark functions. (a) CEC19_01; (b) CEC19_02; (c) CEC19_03; (d) CEC19_04; (e) CEC19_05; (f) CEC19_06; (g) CEC19_07; (h) CEC19_08; (i) CEC19_09; (j) CEC19_10; (k) Legend.


Figure 17.
Average Friedman ranking for eighty-five benchmark functions and engineering problems.

Table 1.
Parameter settings of PCOA’s competitors.
| Algorithm | Parameters | Parameter Values |
|---|---|---|
| AVOA | , , K, , , | , , , , , and [65] |
| PSO | , , inertia weight | 2, 2, linearly decreasing from 0.9 to 0.1 [66] |
| DE | Lower bound of scaling factor (), upper bound of scaling factor (), crossover probability | , , |
| RW_GWO | Convergence parameter (a) | Linearly decreasing from 2 to 0 |
| WOA | Convergence parameter (a) | Linearly decreasing from 2 to 0 |
| HHO | 1.5 | |
| LSHADE | Archive size rate, initial population size, top individuals present, memory size | 2, 20, , 5 |
| GBO | , , | , , |
| EBOwithCMAR | Maximum primary population size, minimum primary population size, maximum secondary population size, minimum secondary population size, memory size, third population size, local search probability | , 4, , 10, 6, , |
Table 2.
Convergence rate analysis of PCOA and competitors using the classic, CEC2017, CEC2019, CEC2006, and CEC2011 benchmark functions.
Table 2.
Convergence rate analysis of PCOA and competitors using the classic, CEC2017, CEC2019, CEC2006, and CEC2011 benchmark functions.
| Function | PCOA | AVOA | PSO | DE | RW_GWO | WOA | HHO | LSHADE | GBO | EBOwithCMAR |
|---|---|---|---|---|---|---|---|---|---|---|
| F1 | 1.00 | 1.00 | 0.99 | 0.97 | 1.00 | 1.00 | 1.00 | 0.99 | 1.00 | 0.99 |
| F2 | 1.00 | 1.00 | 1.00 | 0.99 | 1.00 | 1.00 | 1.00 | 1.00 | 1.00 | 0.99 |
| F3 | 1.00 | 0.99 | 0.98 | 0.55 | 0.99 | 0.81 | 1.00 | 0.99 | 1.00 | 0.99 |
| F4 | 1.00 | 0.96 | 0.93 | 0.75 | 0.99 | 0.79 | 1.00 | 0.97 | 1.00 | 0.98 |
| F5 | 1.00 | 1.00 | 1.00 | 0.98 | 1.00 | 1.00 | 1.00 | 1.00 | 1.00 | 0.99 |
| F6 | 1.00 | 1.00 | 1.00 | 1.00 | 1.00 | 1.00 | 1.00 | 1.00 | 1.00 | 1.00 |
| F7 | 1.00 | 1.00 | 1.00 | 0.98 | 1.00 | 1.00 | 1.00 | 1.00 | 1.00 | 1.00 |
| F8 | 1.00 | 1.00 | 1.00 | 1.00 | 1.00 | 1.00 | 1.00 | 1.00 | 1.00 | 1.00 |
| F9 | 1.94 | 0.56 | 0.43 | 0.45 | 0.53 | 0.59 | 0.58 | 0.49 | 0.46 | 1.22 |
| F10 | 1.00 | 0.96 | 0.89 | 0.89 | 0.99 | 0.99 | 1.00 | 0.97 | 1.00 | - |
| F11 | 1.00 | 1.00 | 1.00 | 1.00 | 1.00 | 1.00 | 1.00 | 1.00 | 1.00 | 1.00 |
| F12 | 1.00 | 1.00 | 1.00 | 1.00 | 1.00 | 1.00 | 1.00 | 1.00 | 1.00 | 1.00 |
| F13 | 1.00 | 1.00 | 1.00 | 0.99 | 1.00 | 1.00 | 1.00 | 1.00 | 1.00 | 1.00 |
| F14 | 1.00 | 1.00 | 0.99 | 1.00 | 1.00 | 1.00 | 1.00 | 0.99 | 0.99 | 1.00 |
| F15 | 1.00 | 1.00 | 1.00 | 1.00 | 1.00 | 1.00 | 1.00 | 1.00 | 1.00 | 1.00 |
| F16 | 1.00 | 1.00 | 1.00 | 1.00 | 1.00 | 1.00 | 1.00 | 1.00 | 1.00 | 1.00 |
| F17 | 1.00 | 1.00 | 1.00 | 1.00 | 1.00 | 1.00 | 1.00 | 1.00 | 1.00 | 1.00 |
| F18 | 1.00 | 1.00 | 1.00 | 1.00 | 1.00 | 1.00 | 1.00 | 1.00 | 1.00 | 1.00 |
| F19 | 1.00 | 1.00 | 1.00 | 1.00 | 1.00 | 1.00 | 1.00 | 1.00 | 1.00 | 1.00 |
| F20 | 1.00 | 1.00 | 1.00 | 1.00 | 1.00 | 1.00 | 1.00 | 1.00 | 1.00 | 1.00 |
| F21 | 1.00 | 1.00 | 1.00 | 1.00 | 1.00 | 1.00 | 1.00 | 1.00 | 1.00 | 1.00 |
| F22 | 1.00 | 1.00 | 1.00 | 1.00 | 1.00 | 1.00 | 1.00 | 1.00 | 1.00 | 1.00 |
| F23 | 1.00 | 1.00 | 1.00 | 1.00 | 1.00 | 1.00 | 1.00 | 1.00 | 1.00 | 1.00 |
| CEC17_01 | 0.99 | 1.00 | 1.00 | 0.99 | 0.99 | 0.99 | 0.96 | 1.00 | 1.00 | 1.00 |
| CEC17_03 | 0.77 | 0.99 | 0.95 | 0.96 | 0.97 | 0.98 | 0.94 | 0.99 | 0.99 | 0.99 |
| CEC17_04 | 0.98 | 0.99 | 1.00 | 0.99 | 0.99 | 0.99 | 0.98 | 1.00 | 1.00 | 1.00 |
| CEC17_05 | 0.95 | 0.80 | 0.87 | 0.74 | 0.75 | 0.76 | 0.64 | 0.91 | 0.82 | 0.95 |
| CEC17_06 | 0.96 | 0.79 | 0.92 | 0.98 | 0.85 | 0.66 | 0.56 | 0.99 | 0.89 | 1.00 |
| CEC17_07 | 0.94 | 0.88 | 0.96 | 0.91 | 0.90 | 0.86 | 0.82 | 0.96 | 0.86 | 0.95 |
| CEC17_08 | 0.94 | 0.82 | 0.88 | 0.73 | 0.74 | 0.76 | 0.70 | 0.92 | 0.84 | 0.95 |
| CEC17_09 | 0.98 | 0.91 | 0.98 | 0.96 | 0.96 | 0.89 | 0.89 | 1.00 | 0.95 | 1.00 |
| CEC17_10 | 0.75 | 0.69 | 0.77 | 0.40 | 0.48 | 0.63 | 0.60 | 0.73 | 0.78 | 0.77 |
| CEC17_11 | 0.97 | 0.99 | 1.00 | 0.98 | 0.98 | 0.99 | 0.97 | 0.99 | 1.00 | 0.99 |
| CEC17_12 | 0.90 | 1.00 | 1.00 | 0.99 | 0.99 | 1.00 | 0.99 | 1.00 | 1.00 | 1.00 |
| CEC17_13 | 0.97 | 1.00 | 1.00 | 1.00 | 1.00 | 1.00 | 0.99 | 1.00 | 1.00 | 1.00 |
| CEC17_14 | 0.88 | 0.99 | 0.99 | 0.98 | 1.00 | 1.00 | 0.99 | 0.99 | 1.00 | 1.00 |
| CEC17_15 | 0.89 | 1.00 | 1.00 | 1.00 | 1.00 | 1.00 | 0.99 | 1.00 | 1.00 | 1.00 |
| CEC17_16 | 0.90 | 0.89 | 0.94 | 0.85 | 0.88 | 0.87 | 0.76 | 0.94 | 0.93 | 0.95 |
| CEC17_17 | 0.88 | 0.98 | 0.94 | 0.96 | 0.96 | 0.95 | 0.94 | 0.97 | 0.96 | 0.99 |
| CEC17_18 | 0.88 | 1.00 | 1.00 | 0.99 | 1.00 | 1.00 | 0.99 | 1.00 | 1.00 | 1.00 |
| CEC17_19 | 0.97 | 0.98 | 1.00 | 1.00 | 1.00 | 1.00 | 0.99 | 1.00 | 1.00 | 1.00 |
| CEC17_20 | 0.82 | 0.82 | 0.89 | 0.77 | 0.78 | 0.73 | 0.71 | 0.87 | 0.89 | 0.90 |
| CEC17_21 | 0.47 | 0.65 | 0.65 | 0.59 | 0.60 | 0.54 | 0.44 | 0.74 | 0.69 | 0.74 |
| CEC17_22 | 0.98 | 0.86 | 0.84 | 0.56 | 0.63 | 0.75 | 0.68 | 0.88 | 0.90 | 0.96 |
| CEC17_23 | 0.75 | 0.66 | 0.65 | 0.64 | 0.61 | 0.60 | 0.46 | 0.68 | 0.60 | 0.71 |
| CEC17_24 | 0.48 | 0.78 | 0.77 | 0.64 | 0.73 | 0.72 | 0.55 | 0.80 | 0.70 | 0.81 |
| CEC17_25 | 0.65 | 0.97 | 0.92 | 0.86 | 0.91 | 0.97 | 0.93 | 0.93 | 0.90 | 0.89 |
| CEC17_26 | 0.86 | 0.94 | 0.99 | 0.83 | 0.90 | 0.86 | 0.79 | 0.88 | 0.98 | 0.93 |
| CEC17_27 | 0.62 | 0.73 | 0.76 | 0.72 | 0.78 | 0.74 | 0.66 | 0.74 | 0.70 | 0.72 |
| CEC17_28 | 0.96 | 0.91 | 0.91 | 0.87 | 0.88 | 0.90 | 0.87 | 0.90 | 0.90 | 0.90 |
| CEC17_29 | 0.82 | 0.92 | 0.87 | 0.87 | 0.90 | 0.88 | 0.83 | 0.91 | 0.90 | 0.89 |
| CEC17_30 | 0.90 | 1.00 | 1.00 | 0.99 | 1.00 | 1.00 | 0.97 | 1.00 | 1.00 | 1.00 |
| CEC19_01 | 1.00 | 1.00 | 0.99 | 0.97 | 1.00 | 0.97 | 1.00 | 0.99 | 1.00 | 0.56 |
| CEC19_02 | 0.79 | 1.00 | 0.97 | 0.89 | 0.95 | 0.80 | 1.00 | 0.99 | 1.00 | 0.54 |
| CEC19_03 | 0.94 | 0.96 | 0.90 | 0.78 | 0.93 | 0.91 | 0.97 | 0.98 | 0.96 | 0.99 |
| CEC19_04 | 0.98 | 0.79 | 0.84 | 0.98 | 0.89 | 0.83 | 0.68 | 0.98 | 0.80 | 1.00 |
| CEC19_05 | 0.84 | 0.99 | 0.95 | 0.99 | 0.99 | 0.99 | 0.93 | 0.99 | 0.99 | 1.00 |
| CEC19_06 | 0.93 | 0.68 | 0.58 | 0.82 | 0.86 | 0.63 | 0.39 | 0.95 | 0.97 | 0.97 |
| CEC19_07 | 0.94 | 0.79 | 0.62 | 0.94 | 0.90 | 0.31 | 0.59 | 0.98 | 0.46 | 0.99 |
| CEC19_08 | 0.38 | 0.37 | 0.45 | 0.58 | 0.36 | 0.25 | 0.22 | 0.61 | 0.55 | 0.91 |
| CEC19_09 | 0.67 | 0.89 | 0.90 | 0.97 | 0.96 | 0.94 | 0.95 | 0.98 | 0.93 | 0.99 |
| CEC19_10 | 0.13 | 0.05 | 0.04 | 0.04 | 0.03 | 0.04 | 0.06 | 0.82 | 0.04 | 0.91 |
| CEC06_01 | 0.99 | 0.99 | 0.90 | 0.94 | 0.98 | 0.99 | 0.98 | 0.98 | 0.99 | 0.97 |
| CEC06_02 | 1.00 | 0.99 | 0.97 | 0.99 | 0.99 | 0.99 | 0.99 | 0.98 | 0.99 | 0.99 |
| CEC06_03 | 0.70 | 0.65 | 0.69 | 0.78 | 0.99 | 0.99 | 0.80 | 0.79 | 0.68 | 0.55 |
| CEC06_04 | 0.97 | 0.95 | 0.91 | 0.85 | 0.93 | 0.81 | 0.83 | 0.93 | 0.91 | 0.97 |
| CEC06_05 | 0.99 | 0.96 | 0.92 | 0.91 | 0.96 | 0.92 | 0.78 | 0.94 | 0.96 | 0.96 |
| CEC06_06 | 0.97 | 0.96 | 0.95 | 0.84 | 0.95 | 0.94 | 0.82 | 0.94 | 0.96 | 0.93 |
| CEC11_01 | 1.00 | 0.93 | 0.69 | 0.25 | 0.70 | 0.62 | 0.44 | 0.89 | 0.98 | 0.91 |
| CEC11_02 | 1.00 | 0.57 | 0.45 | 0.40 | 0.48 | 0.56 | 0.45 | 0.34 | 0.61 | 0.65 |
| CEC11_03 | 1.00 | 0.94 | 0.99 | 0.91 | 0.00 | 0.91 | 0.85 | 0.97 | 0.91 | 0.83 |
| CEC11_04 | 1.00 | 0.69 | 0.27 | 0.27 | 0.74 | 0.27 | 1.00 | 0.16 | 0.79 | |
| CEC11_05 | 1.00 | 1.00 | 0.85 | 0.78 | 0.59 | 0.62 | 0.34 | 0.62 | 0.85 | 0.68 |
| CEC11_06 | 1.00 | 0.00 | 0.95 | 0.72 | 0.00 | 0.96 | 0.77 | 0.98 | 0.99 | 0.98 |
| CEC11_07 | 1.00 | 1.00 | 0.86 | 0.94 | 0.72 | 1.00 | 0.99 | 0.99 | 0.98 | 0.11 |
| CEC11_08 | 1.00 | 0.00 | 0.52 | 0.52 | 0.43 | 0.65 | 0.53 | 0.91 | 0.85 | 0.06 |
| CEC11_09 | 1.00 | 1.00 | 1.00 | 1.00 | 1.00 | 1.00 | 0.99 | 1.00 | 1.00 | 0.53 |
| CEC11_10 | 1.00 | 0.89 | 0.87 | 0.85 | 0.95 | 1.00 | 0.99 | 0.99 | 0.96 | 0.51 |
| CEC11_11 | 1.00 | 1.00 | 1.00 | 0.97 | 1.00 | 0.99 | 0.97 | 0.94 | 0.96 | 0.51 |
| CEC11_12 | 1.00 | 1.00 | 1.00 | 1.00 | 1.00 | 1.00 | 1.00 | 1.00 | 0.97 | 0.50 |
| CEC11_13 | 1.00 | 0.99 | 0.83 | 0.69 | 0.69 | 0.59 | 0.76 | 0.99 | 0.99 | 0.47 |
| CEC11_14 | 1.00 | 1.00 | 0.97 | 0.96 | 0.97 | 0.99 | 0.95 | 0.99 | 1.00 | 0.99 |
| CEC11_15 | 1.00 | 0.99 | 0.97 | 0.96 | 0.96 | 0.99 | 0.95 | 0.99 | 1.00 | 0.99 |
| CEC11_16 | 1.00 | 0.99 | 0.96 | 0.96 | 0.96 | 0.98 | 0.96 | 0.99 | 0.98 | 0.99 |
Table 3.
Algorithm complexity for PCOA and other competitors.
| Function | PCOA | AVOA | PSO | DE | RW_GWO | WOA | HHO | LSHADE | GBO | EBOwithCMAR |
|---|---|---|---|---|---|---|---|---|---|---|
| CEC_17 (dim = 10) | 1.49 | 0.09 | 5.58 | 1.94 | 1.05 | 0.17 | 31.21 | 6.63 | 1.57 | 45.77 |
| CEC_17 (dim = 30) | 1.57 | 12.20 | 4.31 | 0.93 | 1.60 | 2.60 | 49.30 | 9.02 | 0.55 | 113.91 |
| CEC_17 (dim = 50) | 157.90 | 6.99 | 9.77 | 2.09 | 1.43 | 6.47 | 70.31 | 32.78 | 12.92 | 214.50 |
| CEC_17 (dim = 100) | 241.34 | 21.63 | 6.37 | 5.93 | 8.11 | 12.55 | 136.15 | 24.19 | 21.44 | 373.97 |
Disclaimer/Publisher’s Note: The statements, opinions and data contained in all publications are solely those of the individual author(s) and contributor(s) and not of MDPI and/or the editor(s). MDPI and/or the editor(s) disclaim responsibility for any injury to people or property resulting from any ideas, methods, instructions or products referred to in the content. |
© 2024 by the authors. Licensee MDPI, Basel, Switzerland. This article is an open access article distributed under the terms and conditions of the Creative Commons Attribution (CC BY) license (https://creativecommons.org/licenses/by/4.0/).
Share and Cite
MDPI and ACS Style
Valikhan Anaraki, M.; Farzin, S. The Pine Cone Optimization Algorithm (PCOA). Biomimetics 2024, 9, 91. https://doi.org/10.3390/biomimetics9020091
AMA Style
Valikhan Anaraki M, Farzin S. The Pine Cone Optimization Algorithm (PCOA). Biomimetics. 2024; 9(2):91. https://doi.org/10.3390/biomimetics9020091
Chicago/Turabian StyleValikhan Anaraki, Mahdi, and Saeed Farzin. 2024. "The Pine Cone Optimization Algorithm (PCOA)" Biomimetics 9, no. 2: 91. https://doi.org/10.3390/biomimetics9020091