Article

Modelling the Impact of Driver Work Environment on Driving Performance among Oil and Gas Heavy Vehicles: SEM-PLS

by
Al-Baraa Abdulrahman Al-Mekhlafi
1,*,
Ahmad Shahrul Nizam Isha
1,
Ali Nasser Al-Tahitah
2,
Ahmed Farouk Kineber
3,
Baker Nasser Saleh Al-Dhawi
4 and
Muhammad Ajmal
1
1
Department of Management & Humanities, Universiti Teknologi PETRONAS, Seri Iskandar 32610, Perak, Malaysia
2
Faculty of Leadership and Management (FKP), Universiti Sains Islam Malaysia (USIM), Kajang 43000, Selangor, Malaysia
3
Department of Civil Engineering, College of Engineering in Al-Kharj, Prince Sattam Bin Abdulaziz University, Al-Kharj 11942, Saudi Arabia
4
Department of Civil & Environmental Engineering, Universiti Teknologi PETRONAS, Seri Iskandar 32610, Perak, Malaysia
*
Author to whom correspondence should be addressed.
Safety 2023, 9(3), 48; https://doi.org/10.3390/safety9030048
Submission received: 7 June 2023 / Revised: 13 July 2023 / Accepted: 17 July 2023 / Published: 20 July 2023

Abstract

:
Driving heavy vehicles with dangerous cargo involves various work environments that can significantly impact road safety. This research aims to study the impact of oil and gas tanker drivers’ work environment on driving performance to identify and address any issues that may affect their ability to carry out their jobs effectively. To achieve this, a quantitative approach was employed using a questionnaire survey adapted from the literature review. The data collected from a sample of drivers of oil- and gas-heavy vehicles were analyzed using structural equation modelling. The study’s findings reveal a significant association between the drivers’ work environment and driving performance, represented by a path coefficient of β = 0.237. These results highlight the substantial contribution of the work environment to driving performance, with an effect of 63%. Consequently, the study emphasizes the importance of considering the work environment as a potential factor when assessing and enhancing tanker drivers’ driving abilities during oil and gas transportation.

1. Introduction

Long-haul tanker driving in developed countries has been identified as hazardous, posing health risks to drivers [1]. The trucking industry operates in a highly competitive market with demanding delivery and scheduling requirements, and drivers are typically compensated based on the distance they travel. This industry is characterized by numerous interrelated stresses that increase the inherent dangers associated with transportation and have implications for driver health and road safety [2]. Truck drivers face a work environment marked by excessive workload, poor task management, chronic stress, unpredictable schedules, interrupted sleep patterns, and strict time constraints. These conditions have been associated with stress, exhaustion, sleep apnea, musculoskeletal and gastrointestinal issues, and road accidents, some of which are fatal for drivers and the general public [3].
The detrimental work environment poses risks to truck drivers’ health and compromises road traffic safety. Workload demands play a significant role in the development of exhaustion. At the same time, occupational stress, work shifts, and long working hours with unpredictable schedules have been linked to sleep problems, thereby reducing driving performance [4]. Stress factors such as excessive work hours, monotonous driving duties, stressful work contexts, exhaustion, tight-running schedules, irregular shift work, financial pressures, and social isolation contribute to the increased risk of on-the-job fatalities among truck drivers, which is 11 times higher compared to the overall working population [5]. Additionally, there are over 500,000 documented truck accidents annually, with a fatal collision rate that is 50% higher than the rate for all vehicle crashes [6]. In Malaysia, there has been a continuous up-and-down in the occurrence of serious accidents involving heavy vehicles. These accidents are responsible for over 80% of fatalities involving other vehicles [7]. The size and weight of these heavy vehicles play a significant role in the severe damage and impact in road accidents involving both the vehicles themselves and those they collide with [8].
Malaysia is the second-largest South-East Asian petroleum and gas producer and the world’s second-largest liquefied natural gas exporter [9]. Transportation plays a significant role oil and gas industry. Transportation not only contributes to the country’s economy but also plays a crucial role in facilitating daily activities related to the oil and gas sector. Oil and gas tanker drivers in Malaysia operate in complex work environments characterized by long-distance driving, challenging road conditions, strict schedules and deadlines to meet customer demands, and adherence to stringent safety regulations. Additionally, their responsibilities extend beyond driving the tanker, encompassing various other tasks associated with the transportation process. The work environment of oil and gas tanker drivers, characterized by long working hours, irregular schedules, and demanding physical requirements, significantly affects their driving performance. Research has shown that long working hours and irregular schedules lead to fatigue, impaired cognitive function, and an increased risk of accidents. Similarly, high stress levels and demanding physical requirements negatively impact driving performance by reducing a driver’s ability to concentrate and respond to changing road conditions. Previous studies conducted in Malaysia have explored the impact of fatigue, stress, and other work-related factors [10,11,12], safety culture [13], and psychological risk factors [14]. However, these studies overlooked the influence of the working environment on driving performance, making it critical to examine how the work environment affects the performance of heavy vehicle drivers.
Against this backdrop, the present research aims to discuss the unique occupational context of driving and transporting oil and gas. Specifically, this study investigates the potential relationship between the work environment and the performance of Malaysian oil and gas tanker drivers. The overarching objective is to provide the oil and gas transportation industry and other stakeholders with practical evidence to establish regulations that mitigate the negative impact of the work environment on driving performance.
In the business economy, accidents can result in various losses for companies, including injuries to staff, material and moral losses, damaged property, production disruptions, fines, and a damaged reputation [15]. Similarly, road accidents have a significant impact on the environment. There is particular concern about the safety of transporting hazardous materials in heavy vehicles due to the potential for fires, explosions, groundwater contamination, and adverse effects on human health if hazardous materials are spilt inadvertently or as a result of road accidents [16]. Furthermore, road accidents have social implications, often leaving victims financially depleted due to expenses arising from the aftermath and legal procedures. Based on these facts, individuals are frequently affected socially, often experiencing loss of employment, social degradation, and other financial disadvantages [17]. Social isolation is one of the most distressing conditions faced by road crash victims, as they have limited opportunities to express their emotions and receive support. The situation of the responsible parties in road crashes is also highly problematic, as it can lead to significant psychological and social consequences in their future lives [18]. Studying drivers in the oil and gas transportation industry is crucial for several reasons. Firstly, they handle flammable and hazardous materials, and any mistakes can cause accidents, environmental damage, and loss of life. Secondly, the efficient and safe transportation of oil and gas is vital to the industry’s success. Analyzing driver performance helps to identify and address issues, leading to overall industry improvements. Lastly, drivers of large, heavy vehicles with dangerous cargo face high stress, long hours, and risky work environments. Thus, understanding the work environment of oil and gas tanker drivers will mitigate road crushes and enhance road safety.

2. Literature Review

2.1. Oil and Gas Transportation

Heavy vehicles are referred to as large vehicles used for the road transportation of goods. The heavy vehicle fleet in Malaysia comprises almost one million units [7]. The large dimensions and weights of these heavy vehicles contribute to the severity of their effects on other vehicles [8]. Because of their large dimensions, heavy vehicles have operating limitations, for example, long stopping distances, limited manoeuvrability, and large blind spots, making it important to pay additional attention to road safety [7].
Currently, the transportation of oil and gas via tanker trucks plays a crucial role in global distribution. Truck transportation offers benefits such as availability and flexibility for the delivery of oil and gas products. Tankers transport these resources via roads, enabling their distribution to various locations. Moreover, transporting oil and gas by tanker truck is particularly suitable for short distances, often used at the end of the distribution process, such as conveying refined items from a facility to consumers. Due to limited storage space at oil and gas stations and their remote positioning from railroad tracks, tanker trucks are an ideal choice for delivering industrial services [19]. However, while the distribution of refined petroleum resources to petrol stations is primarily carried out using truck transportation, road accidents involving oil and gas tankers have become a global issue, with severe consequences for both human lives and material resources. Therefore, gaining an understanding of the impact of these accidents is essential for implementing effective safety management solutions.

2.2. Relationship between the Work Environment and Driving Performance

Driving performance is defined as the effectiveness with which one performs one’s driving responsibilities. Driver attentiveness, response time, and concentration while driving are all indicators of effectiveness [20,21,22]. Work environment is defined as the physical environment related to drivers’ workplace conditions such as noise, temperature, climate, weather, other vehicles, road signs, things on the road/roadside, and other members of the traffic system [23].
Various work environment factors can significantly impact driver performance. For instance, work schedules and activities play a crucial role, with driving fatigue acting as a mediator. One study revealed that driving fatigue partially mediates the relationship between work schedule and driving performance, and fully mediates the relationship between work activities and driving performance [11]. Fatigue and rest also play a critical role, as professional drivers require sustained attentiveness and adequate rest. Research has shown that accidents are more likely to occur after rest days due to prolonged work engagement and insufficient rest [24]. The mental workload experienced by drivers is another important factor affecting driving performance. Validity and reliability studies have been conducted using a driver activity load index questionnaire to assess the mental load of drivers [25]. Technical factors, such as road quality, truck conditions, weather, and environmental psychology factors, have been found to impact the travel timeliness and work motivation of coal haul drivers [26]. Furthermore, the driver’s mental state and passenger compartment conditions can influence driving performance and stress levels. Studies indicate that the driver’s initial stress and tiredness significantly impact driving behavior and fatigue. Additionally, emotions such as sadness and the interior conditions of the vehicle can impair driving and affect compliance with traffic regulations [27]. These examples highlight the importance of considering various work environment factors when examining their impact on driver performance.
High-stress levels negatively impact driving performance by reducing the driver’s ability to concentrate and respond to changing road conditions, particularly for drivers facing high physical demands or tight deadlines [28]. Distractions and poor work environments can create distractions that can impair driving performance, for example, working in a cluttered or poorly designed workspace [29]. Health and a poor work environment can also negatively impact a driver’s overall health, impacting their driving performance. For example, poor nutrition or inadequate rest can impair cognitive function and increase the risk of accidents [1].
Interactions between workers and their environment can impact the outcomes of the job demand. According to Gómez-Ortiz [30], drivers usually complained about working conditions such as temperature, noise level, chair design and layout, high vibratory level, and insufficient illumination. The importance of the working environment for transport drivers has been shown, since their workplaces are dynamic and exposed to nature. Poor working conditions can impact other factors, such as stress, job tension and safety [31]. For instance, Horberry [32] conducted an analysis involving 31 university students. Findings from the simulation revealed that different environmental complexities impaired several aspects of driving performance. The study also suggested that drivers in different age groups need to take care of distractions in complex and straightforward highway environments during driving duty to avoid performance decrements. Similarly, Ahlström [33] conducted a study involving 30 drivers in a driving simulation. This study compares two road ecosystems: winding roads with a rural environment and low traffic density, and how they affect low performance. In addition, the simulated study revealed decreased subjective performance because of night-time driving and time spent on tasks. Thus, the two road environments affect driving performance differently.
On the other hand, adverse weather can significantly influence driver and vehicle performance. The character and behaviour of vehicle users are the most important elements influencing driving performance under inclement weather. The results indicate that the drivers’ conduct and performance under clear and rainy conditions differed significantly [34]. Road weather conditions have a sustainable impact on the drivers’ responses and decision-making [35]. Other studies showed that fog significantly affected driver behaviour and safety, leading to slower speeds, longer reaction times, and more frequent collisions [36,37].
In conclusion, this literature review highlights the significant impact of various work environment factors on driver performance. Factors such as work schedule, activities, and driving fatigue have been found to be interconnected, with driving fatigue acting as a mediator. Adequate rest and sustained attentiveness are crucial for professional drivers to maintain optimal performance and reduce risk of accident. The mental workload experienced by drivers also influences their performance, and tools such as the driver activity load index questionnaire were developed to assess this factor. Technical factors, including road quality, truck conditions, weather, and environmental psychology, play a role in travel timeliness and work motivation. The driver’s mental state and passenger compartment conditions have been shown to affect driving behavior, stress levels, and compliance with traffic regulations. High stress levels, distractions, poor work environments, and health-related issues further hinder driving performance. The working environment, particularly for transport drivers, has been recognized as a dynamic and nature-exposed space that can impact stress, job tension, and safety. The complexity of road environments and adverse weather conditions also affect driving performance and decision-making. Adverse weather conditions, such as fog, rain, and different road ecosystems, have been found to significantly influence driver behavior, speed, reaction times, and collision risks. Understanding and addressing these work environment factors are essential for promoting safe and effective driving practices. However, research on how the working environment impacts driver’s performance in the energy transportation segment, notably in Malaysia, is lacking. Consequently, this research will provide a case study by examining these critical factors in the Malaysian oil and gas transportation sector.
Based on the literature review, this paper will proceed as follows: Section 3 will outline the research methodology employed in studying drivers in the oil and gas transportation industry, including data collection methods, sample selection, and analysis techniques. Section 4 will present and analyze the findings of the study. Section 5 will provide a comprehensive discussion of the findings, linking them to the existing literature and theoretical frameworks. Finally, Section 6 will summarize the key findings, discuss their implications, and provide concluding remarks, limitations and suggestions for future researchers.

2.3. Underpinning Theories

2.3.1. Arousal Theory

Arousal theory maintains that driving performance declines due to decreased arousal because of the high monotony of stimulus presentation, i.e., the roadway environment [38]. A primary concern in long-haul oil and gas tanker driving is that long distances can induce the experience of monotony and boredom for the driver. Boredom can then lead to the driver’s mind wandering. Subjective negative experiences in prolonged, simple tasks have been interpreted as associated with increased mind-wandering [39,40]. In this state of mind-wandering, cognitive processing is directed away from the primary task, towards internally oriented goals, such as recalling previous experiences or simulating future experiences and actions (e.g., “daydreaming” or planning). This reallocation of attention and cognitive processing is responsible for performance detriments in any given task [41].
Arousal theory suggests that individuals have an optimal level of arousal that affects their performance. When arousal levels are too low, performance is suboptimal and can also be impaired. In the context of Malaysian oil and gas tanker drivers, work environment can impact their arousal levels, leading to either suboptimal or impaired driving performance. For example, long working hours, irregular schedules, and high stress levels can lead to fatigue and reduced arousal levels, negatively impacting driving performance. On the other hand, distractions and poor work conditions, such as working in a cluttered or poorly designed workspace, can create a high level of arousal, impairing driving performance. Furthermore, environmental factors such as poor land conditions, adverse weather, and road environments can also impact arousal levels and driving performance. For instance, a monotonous road environment can lead to insufficient attention among drivers, reducing arousal levels and leading to a suboptimal driving performance.
As you can see, arousal theory can explain how environmental factors can impact the optimal level of arousal among Malaysian oil and gas tanker drivers, leading to either suboptimal or impaired driving performance. It is crucial to consider the optimal level of arousal for drivers and create a work environment that promotes this level of arousal for optimal driving performance. As a result, arousal theory encompasses the relationship between work environment and driving performance via road monotony and many work conditions, making work environment a factor contributing to poor driving performance.

2.3.2. Transactional Model of Driver Stress
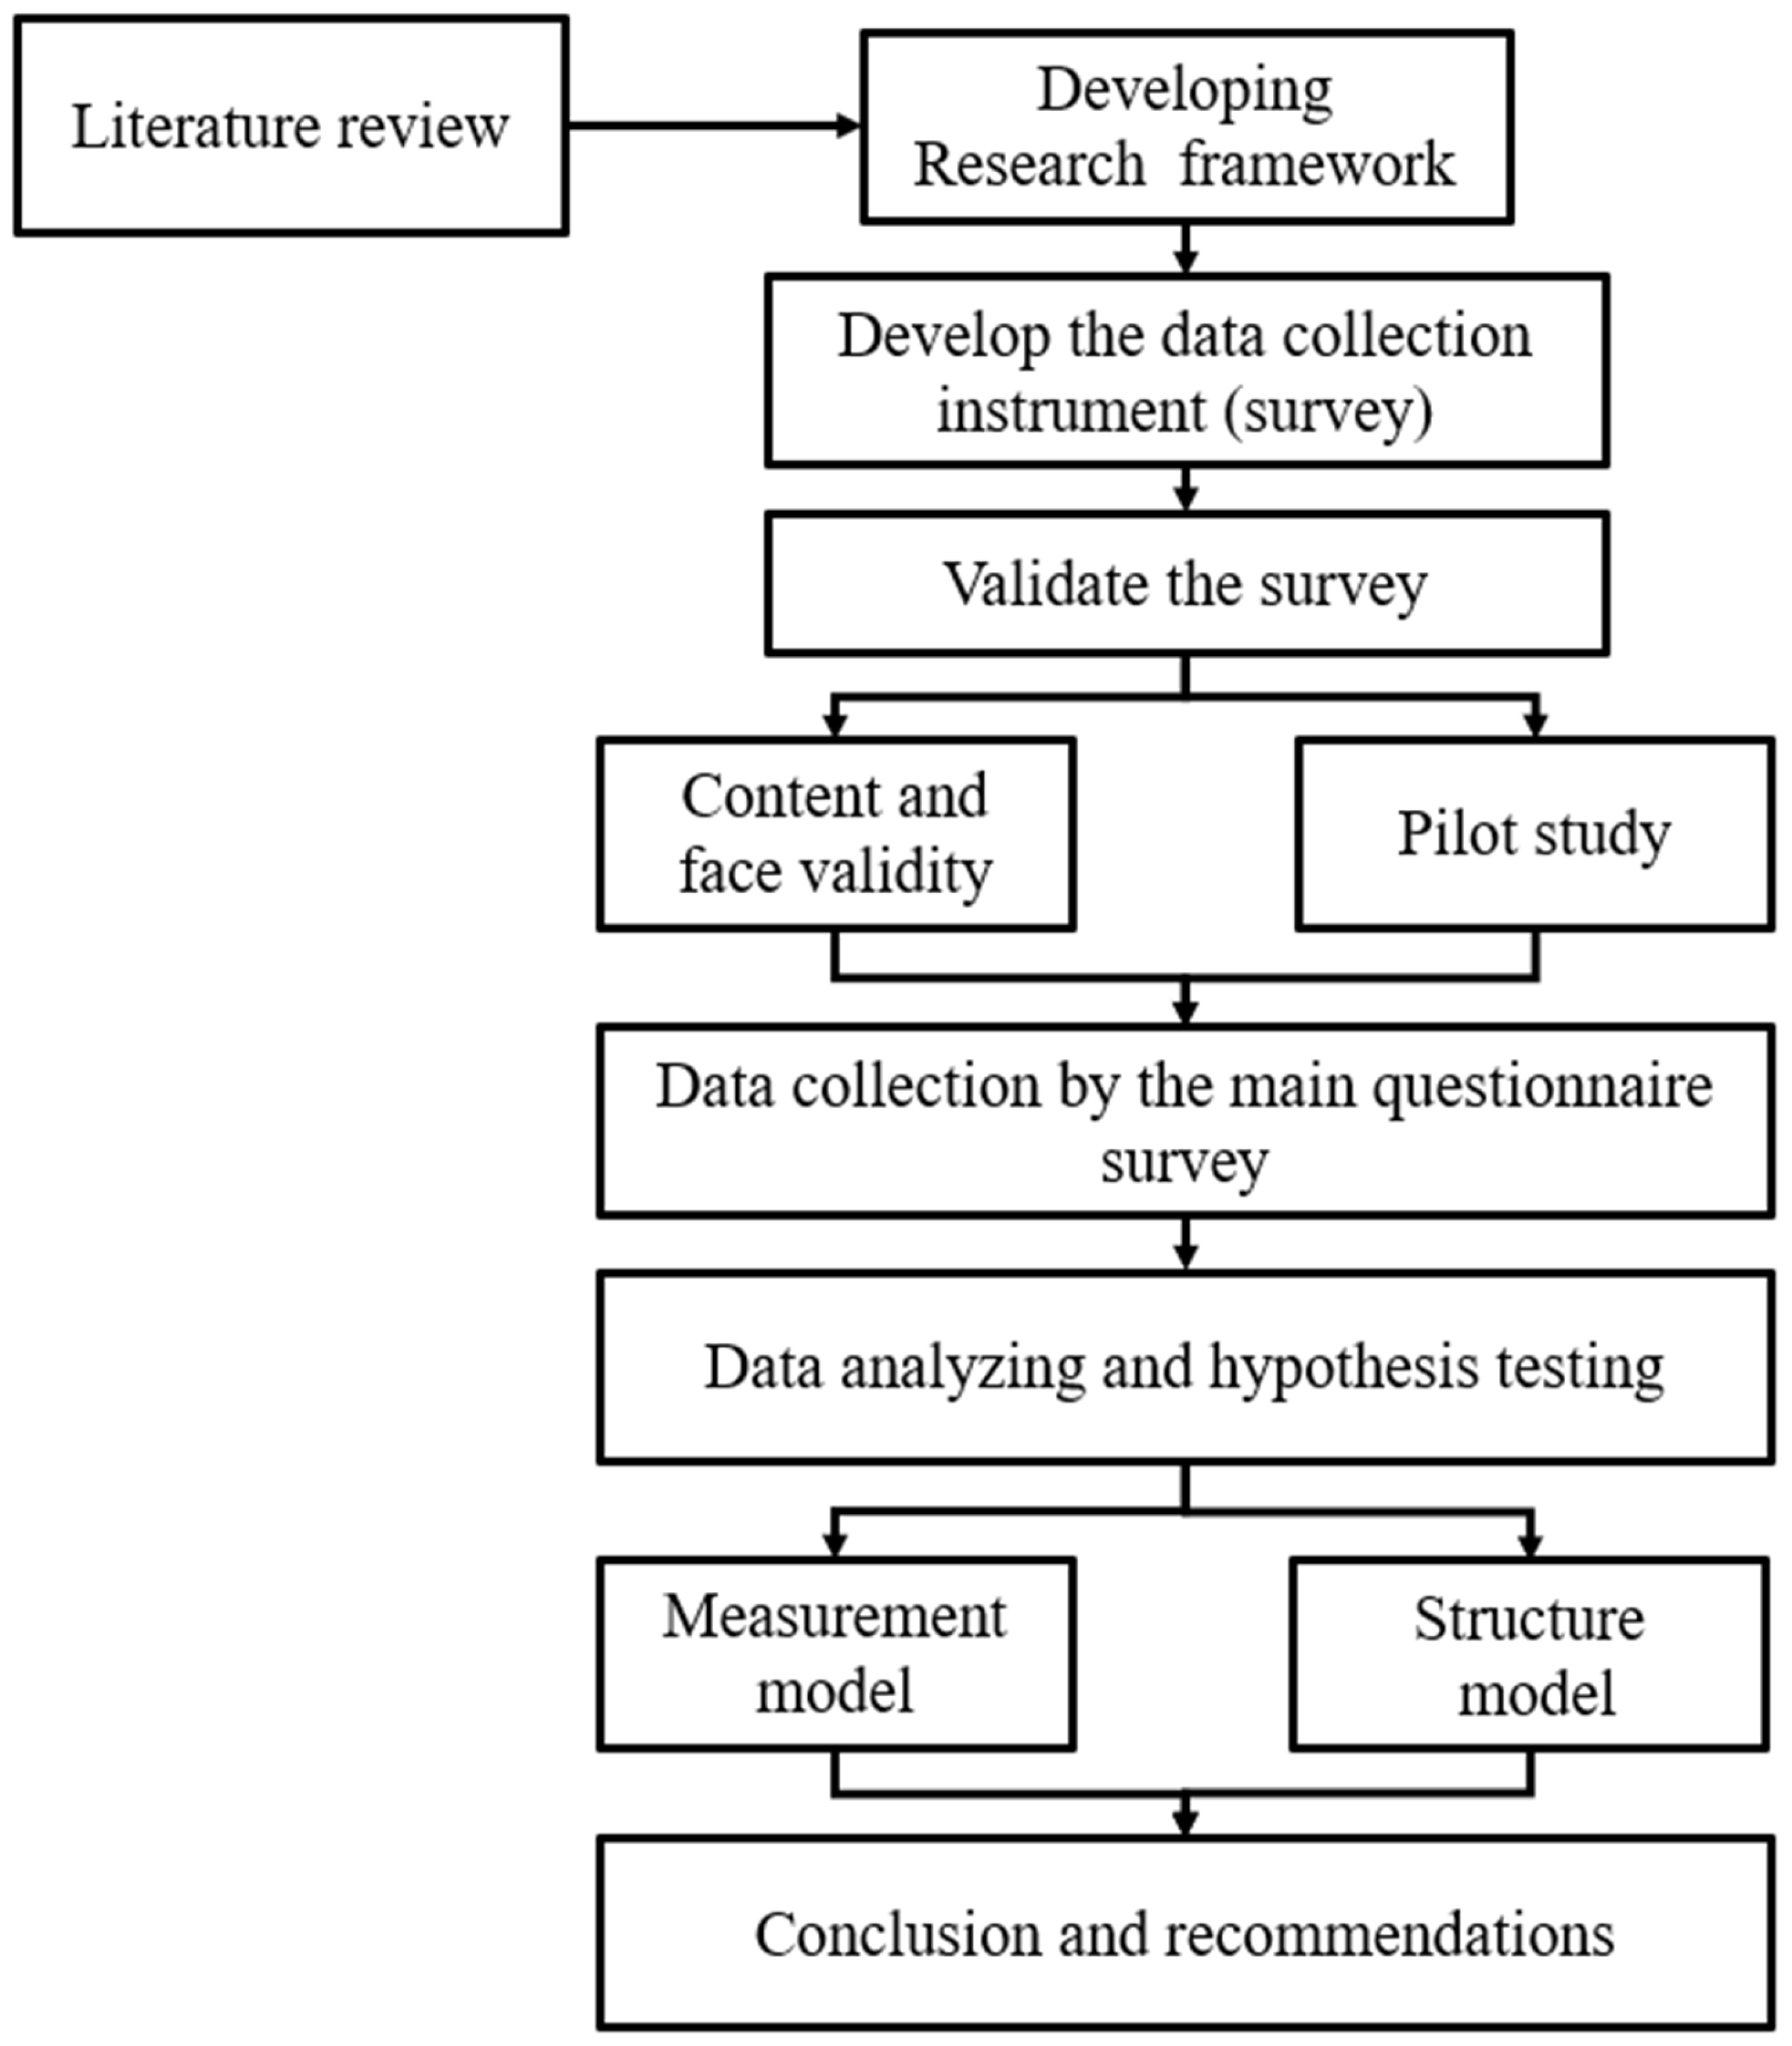
The transactional model of driver stress is a theoretical framework that aims to integrate both subjective and objective data to explain the development of driver stress [42]. According to this model, stress reactions to driving may impair performance and compromise safety. The model is based on Lazarus and Folkman’s [43] transactional model of stress, which suggests that stress is a result of the interaction between the individual and the environment. The transactional model of driver stress aims to explain how cognitive stress processes of appraisal and coping control disturbances of subjective state during driving [44]. The model suggests that both personality factors and situational stressors may elicit maladaptive patterns of cognition that generate subjective stress symptoms, elicit potentially dangerous coping strategies, and interfere with information processing and attention to the task at hand [44].
In this study, based on this model, we suggest that the work environment might be a source of stress for drivers. When drivers view their work environment to be difficult, stressful, or lacking in basic resources, their stress levels rise. This, in turn, can have a detrimental influence on driving performance. Stress can decrease attention, decision-making, response times, and overall cognitive functioning, all of which are important for safe and efficient driving.

3. Methodology

The study plan was built utilizing a conceptual model. According to the literature review and research gap, the research framework was developed to build the hypothesis underlying the analysis that will be tested using practical data [45]. This method is divided into three stages: (i) finding model structures, (ii) categorizing constructions, and (iii) specifying connections between model constructs [46]. Figure 1 depicts the research design and method used.
The study adopted measurement equipment from the existing literature for the work environment and driving performance. As a consequence, three stages of questionnaire surveys were included in this study. The primary stage is the survey’s content and face validity, while the next stage is the pilot study. The pilot study is usually required to test the reliability of the research instrument before collecting primary research data [47]. The objective of the face and content validity was to assess the relevance and clarity of the measurement used. Five experts in the field and academics reviewed the questionnaire, and all of their comments were taken into consideration. Subsequently, in the pilot study, we distributed 50 questionnaires and, based on the 30 returned questionnaires, we assessed reliability and consistency using Cronbach’s alpha. The reliability coefficient of Cronbach’s alpha exceeded 0.70, which is considered acceptable. Finally, the main survey was conducted to test the hypothesis.

3.1. Design of Survey and Data Collection

Based on the literature analysis, a cross-sectional questionnaire was methodically developed. In response to the preliminary questionnaire pilot study, all comments were considered, and changes were made. The study was conducted in Malaysian areas. The main questionnaire was distributed to a diverse group of potential oil and gas tanker drivers to study the influence of the work environment on driving performance. Furthermore, the sample size was determined using Morgan table’s methodological analyses [48]. Kline [49] indicated that a comprehensive route model required 200 or more sample sizes. This work used the PLS-SEM analysis strategy, with over 350 questionnaires disseminated among drivers of oil and gas tankers working in oil and gas transportation firms, using a random stratified sample technique. The questionnaire was administered in person and received a high response rate of more than 80%.
These measurable questionnaire factors were established to examine two variables using respondents who answered regarding whether or not they agreed with each item on a five-opinion of Likert scale, whereby 1 = never, 2 = seldom, 3 = neutral, 4 = often, and 5 = always. The work environment, measured through 9 items, was adapted from [50,51]: “Generally, I feel comfortable with the temperature of my tanker cabin”, “I sweat heavily while performing my work”, “My work environment is very quiet and comfortable”, “I can see my work clearly”, “It is very hot, and I feel uncomfortable here”, “Feel comfortable and less sweating”, “It is very noisy and difficult to communicate here”, “I feel stressed when I drive my tanker during the rain”, “Driving during fog weather makes me tired”. Eleven items were used to measure driving performance according to driver vigilance, attention and the reaction time of drivers [11]: “Operating entertainment systems do not distract me from driving (e.g., playing radio)”, “Operating navigation systems do not distract me from driving”, “I sometimes push the wrong pedal”, “My reactions are faster than they used to be (e.g., braking in an emergency)”, “I sometimes cannot judge my speed”, “I have no difficulty judging the speed of oncoming vehicles”, “I have no trouble judging the distance from the vehicle in front”, “I have no difficulty identifying and reading road signs”, “I sometimes cannot hear the horns of other vehicles/sirens from emergency vehicles”, “Sometimes my speedometer is hard to read during the daytime”, “Sometimes my speedometer is hard to read during the night time”.
Based on the literature review, the questionnaire was adapted from previous studies. The questionnaire consisted of two sections: the first section collected personal information, while the second section focused on the variables of this study, namely work environment and driving performance, with a total of 20 questions. Data collection was conducted using a stratified sampling technique. This involved defining the population and dividing it into strata based on oil and gas transportation companies. Sample sizes for each stratum were determined, and data were randomly collected from each company. The data collection process was carried out in person for one and a half years, from the end of 2019 until the first quarter of 2022. In the inclusion/exclusion criteria, we included all drivers holding a heavy vehicle license and currently working in the oil and gas transportation company. However, we excluded drivers who were still undergoing training.
Before running several data-screening procedures, the data were cleaned and imported into statistical software. Prior to filtering the process data, the variable items were keyed in as code form. The number of tests performed in the data screening was decreased to 304 due to the removal of outliers discovered in the findings.
Personal information was collected from respondents participating in the questionnaire, and basic descriptive statistics were used to summarize their data. The analysis reveals that the majority of respondents (99.7%) were male, with 0.3% female respondents. In terms of age groups, 14.7% were in the 20–29 age group, 48.2% were in the 30–39 age group, 26.4% were in the 40–49 age group, 10.1% were in the 50–59 age group, and 0.7% were 60 years and above. Regarding ethnicity, 93.8% of respondents were Malay, 1.6% were Chinese, and 4.6% were Indian. In terms of marital status, 84.4% were married, 12.7% were single, and 2.9% were separated. In terms of education, the majority (83.7%) had secondary education, 12.7% had a college diploma, 2.6% had primary education, and 1% had graduate/postgraduate education. Regarding the number of years worked in the field, the highest percentage (32.2%) fell within the 1–3-year range. A total of 28% had worked for 4–6 years, 19.9% had worked for less than 1 year, 10.4% had worked for 7–9 years, and 9.4% had worked for 10 years or more.

3.2. Structured Equation Modelling as an Analysis Method (PLS-SEM)

Four strategies were compared to identify the best strategy to choose the most appropriate technique to analyse this study model. These analysis strategies were selected based on their suitability and relevance to the research objectives of developing a driving performance model by integrating the work environment and analyzing the present study data to test the hypothesis. System Dynamic (SD), Artificial Neural Network (ANN), Multiple Linear Regressions (MLR), and Structural Equation Modelling (SEM) were analyzed. First, the system dynamics method was unsuitable for the current data, as it is unrelated to time. Additionally, while the artificial neural network is useful for forecasting, this study aims to investigate the impact of the work environment on driving performance. Third, linear regression was not used, since the relationship between variables was not discovered, which is a critical limiting factor for utilizing the regression equation. Finally, because the Structural Equation Modelling SEM approach depicts the association between multiple relationships and non-observable constructs, it is suited to the study’s requirements. The SEM is a useful technique for handling variable errors [52].
Consequently, the present study used the SEM technique to assess the association between work environment and driving performance through the measurement and structure model. According to Byrne [53], SEM was grown in a non-experimental study technique with previously unknown processes for hypothesis testing. Furthermore, Yuan [54] discovered that SEM is a commonly utilized method to analyze data in social science studies.
Therefore, Partial least squares Smart-PLS is widely used as a substitute for SEM analysis [55]. Among other analysis software, for example, LISREL (developed by Karl Joreskog, Scientific Software International, Inc., Lincolnwood, IL, USA) and AMOS (IBM Corporation, Armonk, NY, USA), the PLS-SEM v. 3.3.5 which was developed by SmartPLS GmbH (Oststeinbek, Germany) is a more powerful and flexible tool for creating and forecasting the multi-relationships model [56]. The PLS route model is better suited to complicated models with hierarchies and a thorough disaggregation approach [57,58].
According to previous studies, the PLS-SEM analysis method was used in different fields, such as the transportation sector [59,60,61], construction industry [62,63,64], competitive performance [65], education [66,67] and management [68,69]. Therefore, as PLS-SEM is considered a failed method to apply the SEM and test the model hypotheses, the present study employed PLS-SEM to measure the influence of work environment on drivers’ performance.

4. Results

4.1. Check Common Method Variance

Common method bias refers to an error in measurement that can affect the validity of the research. It represents a systematic variation in error associated with both estimated and measured variables [70]. One commonly used approach to measuring common method bias is the Harman single-factor test, which examines the presence of a single underlying factor that explains the variance in different measures [71]. In this study, the single-factor test was employed to assess the variance resulting from the standard technique [72]. The results indicate that if the total variance of the variables is below 50%, the data are not influenced by common method bias (Reference [56]). Table 1 presents the distribution of variance, with the variables accounting for 36.21% of the total variance, indicating that the findings are not impacted by common method bias, as it falls below the 50% threshold [71].

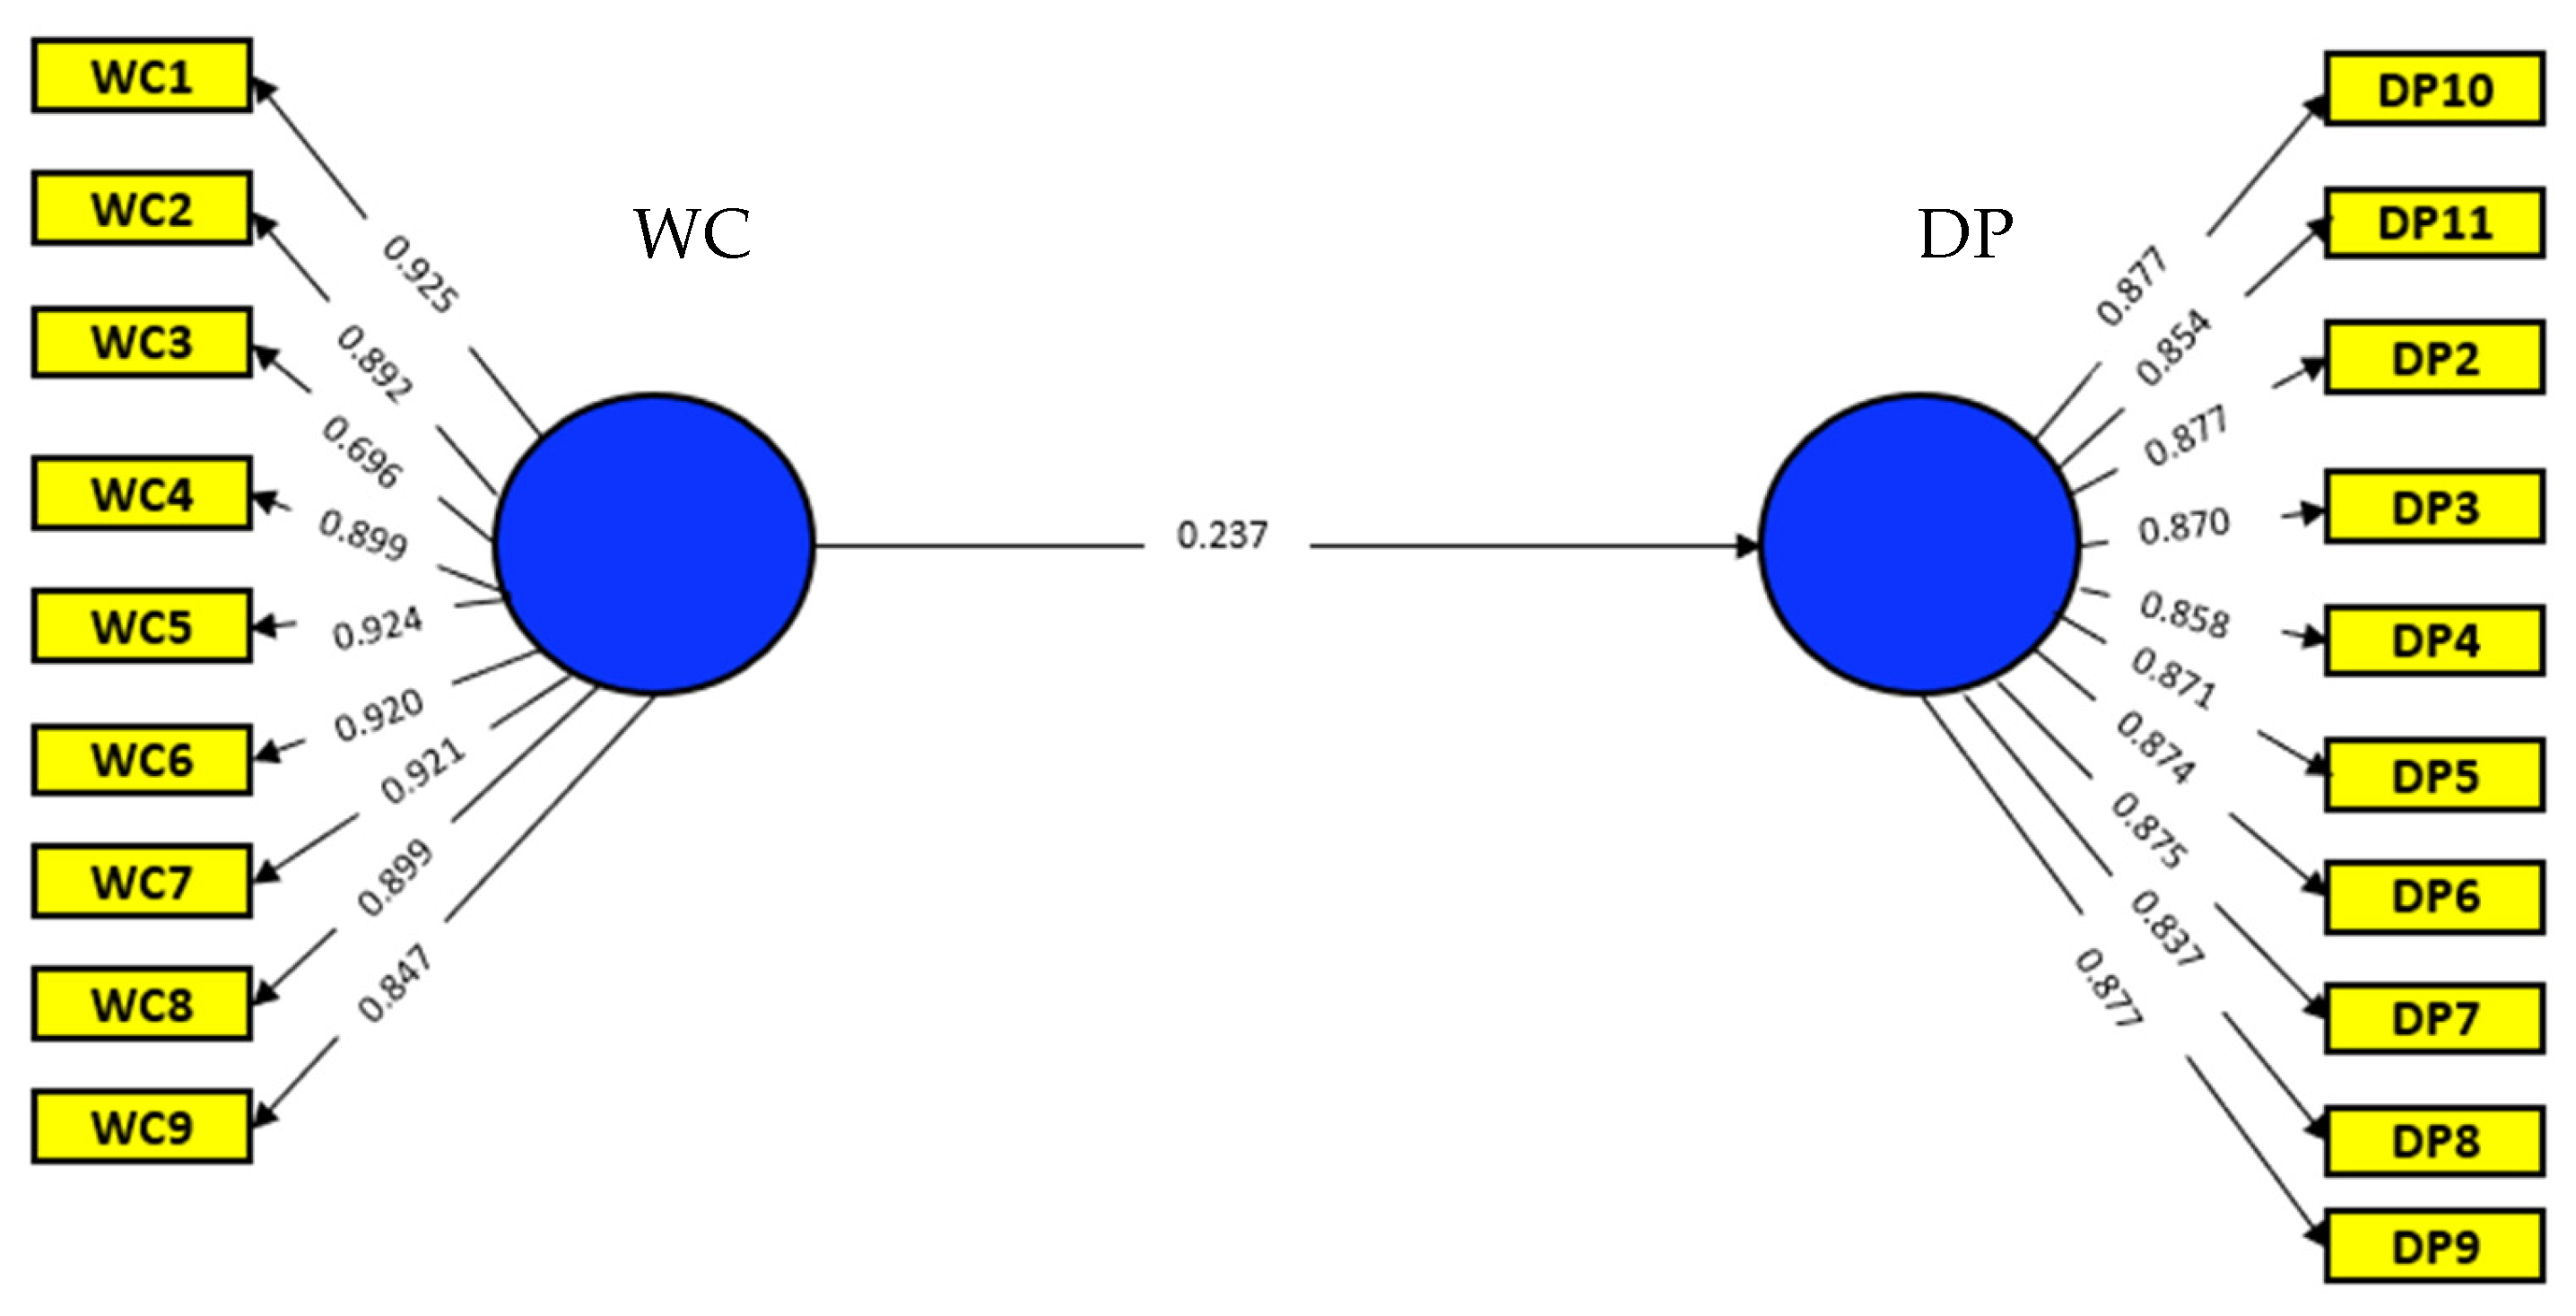
4.2. Measurement Model

According to Hair Jr. [73], assessing the measurement model comprises measuring (i) the reliability coefficient, (i) the average variance-extracted AVE, (ii) composite reliability, and (iv) discriminative validity. Wong [74] indicated that the PLS approach examines convergent validity with the maximum iteration of 300 and a 1.0 weighting criterion. Table 1 displays that the outer loadings for all variable items in the measurement model were greater than 0.70, except WC3, which was 0.696. Thus, values greater than 0.70 are qualified for further analysis [73]. Outside load indicators between 0.40 and 0.70 must only be deleted if doing so significantly gains CR and AVE; hence, we did not remove WC3 [75]. For all outer loads higher than 0.70, the internal reliability of composite reliability (cr) was determined [73]. As illustrated in Table 2, and Figure 2, all elements in the study model contained more than 0.70 acceptable criteria. AVE tested convergent validity in the model. Thus, the construct values should be more than 0.50, as Wong [74] suggested. Thus, in this model, the AVE was above 0.50 for all constructs, which is considered an acceptable convergent value.
Discriminate validity is described as a notion that differs considerably from the other constructs, depending on the criteria that are detected. Model discriminative validity implies that distinct construct capture occurrences are not adequately represented in the model otherwise [76]. The current study investigated discriminant validity using the technique of Fornell and Larcker [77] and cross-loading criteria. Compare the square AVE roots of each construct with their correlations to determine the discriminating construction’s validity. The AVE’s square root should be greater than the correlation between latent variables, according to Fornell and Larcker [77]. Table 3 indicates the measuring model’s discriminating validity [78].
One of the methods used to test discriminant validity is cross-loading. It was also employed to measure discriminant validity. This approach aims to assess indicators’ loading on a certain latent construct, which should be higher than the loading of all other constructs in the same row. This indicates that the loading value must be bigger on the primary construct of indications or objects than on the other constructs. Table 4 shows that all latent variables’ loading is larger than other constructs in the same row. Thus, the outcomes of each component are highly one-dimensional.

4.3. Structural Model

Path analysis between the model relationships is preferred for management and social science analytical approaches. Path analysis is another powerful method for simultaneously analyzing several complicated research relationships [79]. Thus, SEM can be utilized to assess the relationships between model variables. Therefore the structural model elaborates on the relationships between study model constructs [80]. The results usually demonstrate a relationship between independent variables and dependent variables. The fitting of the complete model, including assumed dimensions and significance, is the primary emphasis of structural model evaluation [80]. The study relationship was discussed in the last part of the literature review.
PLS-SEM was employed in this study model to analyze the impact of work environment on driving performance in accordance with the research setting. The hypothesis of the current model was tested using the bootstrapping technique. This method creates samples that mimic the original data. It was used to assess the calculated path coefficient’s reliability, predictive power and accuracy [81].
The model variables were analyzed to test the path coefficients (β), and identify the significance of path p-value and R2 to know how the independent variable explains the variance of the dependent variable. As a result of the bootstrapping run, the p-value of the path significant among study variables is shown in Table 5. According to the findings, the work environment had a statistically significant effect on driving performance, with a path coefficient (β = 0.237) and a significant p-value of 0.017.

4.3.1. The Structural Model’s Explanatory Power R2

The power of the structural model may be identified by evaluating how the dependent variable explains the variance in the model’s dependent variable. The SEM-PLS technique addresses R2 in the same way that traditional regression does. In structural equation modelling (SEM), the R-squared, also known as the coefficient of determination, measures how well the model’s latent variables can explain the observed variables in a model. It ranges from 0 to 1, with higher values indicating a better fit [82].
The current study model’s description of how independent variables explain the dependent variable uses the R2 test. As revealed in Table 6, R2 for the dependent variable of this study, which is driving performance computed by the PLS technique, was 0.638, suggesting that the latent independent variable, work conditions, can explain 63% of driving performance. Based on Chin [81], R2 63% results indicate that the variation represented by work environment is at a substantial level.

4.3.2. The Structural Model’s Predictive Relevance

The Structural Model’s Predictive Relevance refers to the ability of a structural equation model (SEM) to accurately predict the values of the endogenous (dependent) variables based on the values of the exogenous (independent) variables. In other words, it measures how well the model’s estimates of the relationships between variables correspond to the actual relationships in the population [83,84].
The findings displayed that the Q2 value in this model is (0.46), which means the exogenous construct work environment has a predictive value for the dependent variable in this research model [83]. Table 7 shows that Q2 is larger than zero, indicating that the model has substantial predictive relevance.

4.4. Analysis of the Importance-Performance Matrix (IPMA)

IPMA is a tool that is used to evaluate the relative importance and performance of various factors in a particular system or organization [83]. IPMA extends SEM results by accounting for the performance of each variable. The result is usually obtained according to two factors (importance) and (performance). These two factors are crucial when choosing management tasks [73]. The findings of the structural model were named importance, and the mean value of the latent component scales’ performance was utilized to suggest parts that could be improved in management approaches (or the essential emphasis of the model). In the current study, IPMA used work environment as the dependent variable. Table 8 displays the exogenous variables’ importance and performance.

5. Discussion

This research aimed to look at the effect that work environment has on driving performance. The driving environment is defined as the outside vehicle area on road traffic, for example, road marks, road signs, road infrastructure, other vehicles, roadside objects, and other traffic, such as cyclists and pedestrians [23]. The study results further revealed the significant impact of work environment on driving performance (β = 0.237), (t = 2.391), (p < 0.017). This outcome aligns with previous research demonstrating a relationship between work environment and driving performance [31,85,86,87,88]. Thus, the literature is unanimous that work environment significantly impacts driving performance. Horberry [32] reported that different environmental complexities impaired several aspects of driving performance. Conversely, Ahlström [33] argued that there was a decrease in driver performance due to changes in the road environment. Thiffault and Bergeron [89] discovered that, while driving in a more monotonous road environment, the early time-on-task impact on driving performance indicates decreased vigilance. Furthermore, adverse weather may substantially influence highways by impacting roadway conditions, vehicle performance, and driver performance [34]. Therefore, the current study results were consistent with previous study findings.
The road environment is often more exposed to increased danger for drivers due to the intensity and frequency of hot days and storm activity. Islam [90] demonstrated that climate changes during driving duties increase road traffic accidents. Drivers have constantly criticized aspects of work environments such as noise level, temperature, chair design and layout, high vibratory levels, and insufficient illumination, according to Gómez-Ortiz [30]. It has been proven that work conditions are important for transport drivers because their workplaces are flexible and exposed to nature. Furthermore, lousy working conditions may impact other elements (such as stress, job tension, and safety) [31].
The driving environment for Malaysian oil and gas tanker drivers involves navigating a diverse range of road conditions and traffic congestion. Although Malaysia has a well-developed road system in its urban areas, the terrain in rural areas may be more difficult. Hazardous material transportation is subject to stringent safety regulations, which place a strong emphasis on following road safety laws and taking preventative measures to avoid mishaps or spills. It is critical to adapt to tropical weather conditions, including heavy rainfall. In order to ensure the effective and secure transportation of oil and gas products, drivers must generally carefully plan their routes, control traffic, and prioritize safety to keep their performance at a high level, which, in turn, will mitigate road accidents. Malaysia hopes to achieve its target of reducing road fatalities by 50% by the year 2030 and avoid all the economic losses related to road accidents. Therefore, this study’s efforts and findings will help Malaysia achieve its 2023 vision.
This discussion focuses on the impact that work environment has on driving performance. The study results revealed a significant relationship between work environment and driving performance, which is consistent with previous studies in the different sectors. Thus, environmental complexities can impair several aspects of driving performance, and adverse weather may also substantially influence highways. Overall, the study highlighted the importance of improving work environment for transport drivers to enhance their safety and performance.

6. Conclusions

This study shows that the management of oil and gas companies should be aware of the negative effect that road conditions have on the drivers to avoid the consequences of a low driver performance. Moreover, the study of Malaysian drivers of oil and gas tankers perceived that the road environment decreased their physical and mental abilities during driving duties. To address these issues, oil and gas companies must implement policies and practices that promote the health and well-being of their tanker drivers. This may include measures such as providing adequate rest breaks, implementing flexible scheduling, and supporting stress management and physical fitness. By improving the work environment of tanker drivers, companies can aid in decreasing the risk of crashes and improve the overall safety of their operations.
This study provided many implications and contributions for many stakeholders and the literature review, as presented below:
  • Expand the corpus of knowledge: Investigating the influence of work environment on driver performance adds valuable insights and empirical evidence to the understanding of this critical industry. The findings of this study expand road safety scholars’ understanding of the complex dynamics involved in energy transportation and provide a solid foundation for further research in this area.
  • Attention to the influence of the work environment: One of the key contributions of this research is its experimental establishment that the work environment has a large and detrimental influence on driving performance. These findings pave the way for future studies to explore interventions and strategies to mitigate the negative impact of many aspects of the work environment on driving performance.
  • Informing executives in the energy transportation industry: The present research delivers comprehensive information that is particularly relevant to executives and decision-makers in the energy transportation industry. By providing insights into the influence of work conditions on driving performance, this study equips executives with valuable knowledge to optimize working conditions for drivers. This understanding can lead to the implementation of measures that enhance driver safety, well-being, and performance, ultimately benefiting the energy transportation firms as a whole.
  • Benefits for drivers and supervisors: The implications of this study extend beyond the executives and the industry. By emphasizing the relevance of the work environment and its influence on poor driving performance, this research serves as a valuable resource for drivers and supervisors alike. It highlights the importance of creating conducive work environments that promote attentiveness during transportation duties. The study’s focus on drivers’ performance serves as a reminder to supervisors to prioritize training, support, and monitoring measures that can enhance drivers’ performance and overall safety.
Despite its contributions, this work acknowledges several limitations linked to gathering data and generalizing results. To begin with, the questionnaire sample comprised drivers of oil and gas tankers from a single nation, Malaysia. Clearly, the results may not apply to other developing nations; thus, future research should focus on different regions of Southeast Asia. Second, while this research focused on oil and gas tanker drivers, the impact of transporting goods cannot be overstated, considering the growing amounts of international commerce and freight transit. As a result, future studies should focus on large freight trucks and the problems they face. Finally, this study’s methodological weakness is that it uses self-report questionnaires to measure driving performance. It is preferable to undertake an experimental study for future research. Additionally, we recommend that future researchers consider implementing the multi-trait-multimethod matrix or employ mixed methods, such as combining questionnaires and interviews, to measure the variance between two distinct constructs in both self-reported and objective data.

Author Contributions

Conceptualization, A.-B.A.A.-M. and A.S.N.I.; Methodology A.-B.A.A.-M.; Software, A.N.A.-T., A.F.K. and B.N.S.A.-D.; Validation, A.F.K., B.N.S.A.-D. and M.A.; Formal analysis, A.-B.A.A.-M. and A.N.A.-T.; Investigation, A.-B.A.A.-M.; Data curation, A.-B.A.A.-M. and M.A.; Writing—original draft, A.-B.A.A.-M.; Writing—review & editing, A.S.N.I., A.N.A.-T., A.F.K., B.N.S.A.-D. and M.A.; Visualization, A.N.A.-T.; Supervision, A.S.N.I.; Project administration, A.S.N.I.; Funding acquisition, A.S.N.I. All authors have read and agreed to the published version of the manuscript.

Funding

This research was funded by the YUTP project (Cost Center: 015LC0-043), Universiti Teknologi PETRONAS.

Institutional Review Board Statement

This study was conducted according to the guidelines of the Declaration of Helsinki and was approved by the Ethical Committee of Universiti Teknologi PETRONAS (project number: YUTP-015LC0-043, and date of approval 1 December 2018).

Informed Consent Statement

Informed consent was obtained from all subjects involved in the study.

Data Availability Statement

Data are available under reasonable request.

Acknowledgments

The authors would like to thank Universiti Teknologi PETRONAS, oil & gas transportation companies and participants who contributed to the research.

Conflicts of Interest

The authors declare no conflict of interest.

References

  1. Apostolopoulos, Y.; Sönmez, S. The Psychosocial Environment of Commercial Driving: Morbidities, Hazards, and Productivity of Truck and Bus Drivers. In Handbook of Stress in the Occupations; Langan-Fox, J., Cooper, C.L., Eds.; Edward Elgar Publishing: Cheltenham, UK, 2011; Volume 431, pp. 431–447. [Google Scholar]
  2. Apostolopoulos, Y.; Sönmez, S.; Shattel, M.M.; Belzer, M. Worksite-Induced Morbidities among Truck Drivers in the United States. AAOHN J. 2010, 58, 285–296. [Google Scholar] [CrossRef] [PubMed] [Green Version]
  3. Liu, Y.; Tanaka, H. Overtime work, insufficient sleep, and risk of non-fatal acute myocardial infarction in Japanese men. Occup. Environ. Med. 2002, 59, 447–451. [Google Scholar] [CrossRef] [PubMed]
  4. Apostolopoulos, Y.; Sönmez, S.; Shattell, M.M.; Belzer, M.H. Environmental determinants of obesity-associated morbidity risks for truckers. Int. J. Workplace Health Manag. 2012, 5, 120–138. [Google Scholar] [CrossRef] [Green Version]
  5. Apostolopoulos, Y.; Sönmez, S.; Shattel, M.M.; Gonzales, C.; Fehrenbacher, C. Health survey of US long-haul truck drivers: Work environment, physical health, and healthcare access. Work 2013, 46, 113–123. [Google Scholar] [CrossRef] [PubMed]
  6. Moonesinghe, R.; Longthorne, A.; Shankar, U.; Singh, S.; Subramanian, R.; Tessmer, J. An Analysis of Fatal Large Truck Crashes; Technical Report; U.S. Department of Transportation: Washington, DC, USA, 2003.
  7. Hamidun, A.W.; Hoong, R.; Roslan, A.; Shabadin, A.; Jamil, H. Characteristics of Heavy Goods Vehicles (HGV) Accidents in Malaysia. In IOP Conference Series: Materials Science and Engineering; IOP Publishing: Kuala Lumpur, Malaysia, 2019. [Google Scholar]
  8. Evgenikos, P.; Yannis, G.; Folla, K.; Bauer, R.; Machata, K.; Brandstaetter, C. Characteristics and causes of heavy goods vehicles and buses accidents in Europe. Transp. Res. Procedia 2016, 14, 2158–2167. [Google Scholar] [CrossRef] [Green Version]
  9. Al-Qahtani, A.M.; Jebaraj, S. Oil Demand Forecasting in Malaysia in Transportation Sector Using Artificial Neural Network. Int. J. Sci. Eng. Invent. 2019, 5, 8–15. [Google Scholar] [CrossRef]
  10. Al-Mekhlafi, A.-B.A.; Isha, A.S.N.; Chileshe, N.; Abdulrab, M.; Kineber, A.F.; Ajmal, M. Impact of Safety Culture Implementation on Driving Performance among Oil and Gas Tanker Drivers: A Partial Least Squares Structural Equation Modelling (PLS-SEM) Approach. Sustainability 2021, 13, 8886. [Google Scholar] [CrossRef]
  11. Al-Mekhlafi, A.-B.A.; Isha, A.S.N.; Chileshe, N.; Abdulrab, M.; Saeed, A.A.H.; Kineber, A.F. Modelling the Relationship between the Nature of Work Factors and Driving Performance Mediating by Role of Fatigue. Int. J. Environ. Res. Public Health 2021, 18, 6752. [Google Scholar] [CrossRef]
  12. Sabir, A.A. Assessing the fatigue related psychological risk factors among oil and gas tankers drivers in Malaysia. Int. Rev. Manag. Mark. 2016, 6, 4S. [Google Scholar]
  13. Al-Mekhlafi, A.-B.A.; Isha, A.S.N.; Abdulrab, M.; Ajmal, M.; Kanwal, N. Moderating effect of safety culture on the association inter work schedule and driving performance using the theory of situation awareness. Heliyon 2022, 8, e11289. [Google Scholar] [CrossRef]
  14. Selvarajah Krishnan, S.M.H.; Firdhaus, A.; Sarah, S.; Taufiq, A. Analysis of Exhaustion Related Psychological Risk Factors among Oil and Gas Tanker Drivers in Malaysia. Int. J. Adv. Multidiscip. Soc. Sci. 2017, 3, 22–27. [Google Scholar]
  15. Mahachandra, M.; Sutalaksana, I.Z. Fatigue Evaluation of Fuel Truck Drivers. Procedia Manuf. 2015, 4, 352–358. [Google Scholar]
  16. Bariha, N.; Mishra, I.M.; Srivastava, V.C. Fire and explosion hazard analysis during surface transport of liquefied petroleum gas (LPG): A case study of LPG truck tanker accident in Kannur, Kerala, India. J. Loss Prev. Process Ind. 2016, 40, 449–460. [Google Scholar] [CrossRef]
  17. Neusarová, J. Dopravní nehodovost a její následky na životy zasažených lidí. Prevence Úrazů Otrav Násilí 2009, 2, 179–184. [Google Scholar]
  18. Masilkova, M. Health and social consequences of road traffic accidents. Kontakt 2017, 19, e43–e47. [Google Scholar] [CrossRef]
  19. Leibel, A.; Seagram, C.; McMann, C.; McLellan, M.; Oliveira, H.; Savaliya, T.; Bhandal, K. Transportation of Oil and Gas. 2020. Available online: https://web.uvic.ca/~djberg/Chem300A/GroupLM_OilGasMovement_Proj1.pdf (accessed on 1 July 2023).
  20. Mcgehee, D.V.; Mazzae, E.N.; Baldwin, G.S. Driver Reaction Time in Crash Avoidance Research: Validation of a Driving Simulator Study on a Test Track. In Proceedings of the Human Factors and Ergonomics Society Annual Meeting 2000, San Diego, CA, USA, 30 July–4 August 2000; SAGE Publications: Los Angeles, CA, USA, 2000; pp. 320–323. [Google Scholar]
  21. Oken, B.S.; Salinsky, M.C.; Elsas, S. Vigilance, alertness, or sustained attention: Physiological basis and measurement. Clin. Neurophysiol. 2006, 117, 1885–1901. [Google Scholar] [CrossRef] [Green Version]
  22. Paas, F.G.; Van Merriënboer, J.J. The efficiency of instructional conditions: An approach to combine mental effort and performance measures. Hum. Factors 1993, 35, 737–743. [Google Scholar] [CrossRef]
  23. Keeler, T.E. Highway safety, economic behavior, and driving environment. Am. Econ. Rev. 1994, 84, 684–693. [Google Scholar]
  24. Zaranka, J.; Pečeliūnas, R.; Žuraulis, V. A road safety-based selection methodology for professional drivers: Behaviour and accident rate analysis. Int. J. Environ. Res. Public Health 2021, 18, 12487. [Google Scholar] [CrossRef]
  25. Zakerian, S.A.; Zia, G.; Seraji, G.N.; Azam, K.; Mortezapour, A. Reliability and validity of the driver activity load index for assessing mental workload among drivers in production companies. J. Occup. Hyg. Eng. Vol. 2018, 5, 65–71. [Google Scholar] [CrossRef] [Green Version]
  26. Yuniar, D.; Djakfar, L.; Wicaksono, A.; Efendi, A. Model of Truck Travel Timeliness Based on Driver Environment Psychology and Technical Factor: A Warp.PLS-SEM Approach. J. Phys. Conf. Ser. 2021, 1783, 012100. [Google Scholar] [CrossRef]
  27. Magaña, V.C.; Scherz, W.D.; Seepold, R.; Madrid, N.M.; Pañeda, X.G.; Garcia, R. The effects of the driver’s mental state and passenger compartment conditions on driving performance and driving stress. Sensors 2020, 20, 5274. [Google Scholar] [CrossRef] [PubMed]
  28. Sabir, A.A.; Shahru, A.; Isha, N.B.; Langove, N.; Javaid, M.U. An Integrative Approach to Study Drivers Perceived Stress on Aberrant Driving Behaviour: The Mediation Role of Driver Fatigue. In SHS Web of Conferences; EDP Sciences: Kuala Lumpur, Malaysia, 2018. [Google Scholar]
  29. Dehzangi, O.; Williams, C. Towards Multi-Modal Wearable Driver Monitoring: Impact of Road Condition on Driver Distraction. In Proceedings of the 2015 IEEE 12th International Conference on Wearable and Implantable Body Sensor Networks (BSN), Cambridge, MA, USA, 9–12 June 2015. [Google Scholar]
  30. Gómez-Ortiz, V.; Cendales, B.; Useche, S.; Bocarejo, J.P. Relationships of working conditions, health problems and vehicle accidents in bus rapid transit (BRT) drivers. Am. J. Ind. Med. 2018, 61, 336–343. [Google Scholar] [CrossRef] [PubMed]
  31. Stanton, N.A.; Salmon, P.M.J.A.E. Planes, trains and automobiles: Contemporary ergonomics research in transportation safety. Appl. Ergon. 2011, 42, 529–532. [Google Scholar] [CrossRef]
  32. Horberry, T.; Anderson, J.; Regan, M.A.; Triggs, T.J.; Brown, J. Driver distraction: The effects of concurrent in-vehicle tasks, road environment complexity and age on driving performance. Accid. Anal. Prev. 2006, 38, 185–191. [Google Scholar] [CrossRef]
  33. Ahlström, C.; Anund, A.; Fors, C.; Åkerstedt, T. Effects of the road environment on the development of driver sleepiness in young male drivers. Accid. Anal. Prev. 2018, 112, 127–134. [Google Scholar] [CrossRef]
  34. Ahmed, A.; Ghasemzadeh, M. The impacts of heavy rain on speed and headway behaviors: An investigation using the SHRP2 naturalistic driving study data. Transp. Res. Part C Emerg. Technol. 2018, 91, 371–384. [Google Scholar] [CrossRef]
  35. Almadi, A.I.; Al Mamlook, R.E.; Almarhabi, Y.; Ullah, I.; Jamal, A.; Bandara, N. A fuzzy-logic approach based on driver decision-making behavior modeling and simulation. Sustainability 2022, 14, 8874. [Google Scholar] [CrossRef]
  36. Calsavara, F.; Kabbach, F.I., Jr.; Larocca, A.P.C. Effects of Fog in a Brazilian Road Segment Analyzed by a Driving Simulator for Sustainable Transport: Drivers’ Speed Profile under In-Vehicle Warning Systems. Sustainability 2021, 13, 10501. [Google Scholar] [CrossRef]
  37. Calsavara, F.; Kabbach, F.I., Jr.; Larocca, A.P.C. Effects of Fog in a Brazilian Road Segment Analyzed by a Driving Simulator for Sustainable Transport: Drivers’ Visual Profile. Sustainability 2021, 13, 9448. [Google Scholar] [CrossRef]
  38. Mackworth, J.F. Vigilance and Habituation: A Neuropsychological Approach; Penguin Books: London, UK, 1969. [Google Scholar]
  39. Cheyne, J.A.; Solman, G.J.; Carriere, J.S.; Smilek, D.J.C. Anatomy of an error: A bidirectional state model of task engagement/disengagement and attention-related errors. Cognition 2009, 111, 98–113. [Google Scholar] [CrossRef] [PubMed]
  40. Smallwood, J.; Davies, J.B.; Heim, D.; Finnigan, F.; Sudberry, M.; O’Connor, M.J.C.R. Subjective experience and the attentional lapse: Task engagement and disengagement during sustained attention. Conscious. Cogn. 2004, 13, 657–690. [Google Scholar] [CrossRef] [PubMed]
  41. Manly, T.; Robertson, I.H.; Galloway, M.; Hawkins, K.J.N. The absent mind: Further investigations of sustained attention to response. Neuropsychologia 1999, 37, 661–670. [Google Scholar] [CrossRef] [PubMed]
  42. Matthews, G. A Transactional Model of Driver Stress. In Stress, Workload and Fatigue; Hancock, P.A., Desmond, P.A., Eds.; University of Dundee: Dundee, Scotland, 2001. [Google Scholar]
  43. Lazarus, R.S.; Folkman, S. Stress, Appraisal, and Coping; Springer Publishing Company: Berlin/Heidelberg, Germany, 1984. [Google Scholar]
  44. Matthews, G. Towards a transactional ergonomics for driver stress and fatigue. Theor. Issues Ergon. Sci. 2002, 3, 195–211. [Google Scholar] [CrossRef]
  45. Shields, P.M.; Tajalli, H. Intermediate theory: The missing link in successful student scholarship. J. Public Aff. Educ. 2006, 12, 313–334. [Google Scholar] [CrossRef] [Green Version]
  46. Christensen, C.M. The ongoing process of building a theory of disruption. J. Prod. Innov. Manag. 2006, 23, 39–55. [Google Scholar] [CrossRef]
  47. Van Teijlingen, E.; Hundley, V. The importance of pilot studies. Soc. Res. Updat. 2010, 35, 49–59. [Google Scholar] [CrossRef]
  48. Krejcie, R.V.; Morgan, D.W. Determining sample size for research activities. Educ. Psychol. Meas. 1970, 30, 607–610. [Google Scholar] [CrossRef]
  49. Kline, R. Principles and Practice of Structural Equation Modeling, 3rd ed.; The Guilford Press: New York, NY, USA, 2010. [Google Scholar]
  50. Ryan, B.; Wilson, J.R.; Sharples, S.; Clarke, T. Attitudes and opinions of railway signallers and related staff, using the Rail Ergonomics Questionnaire (REQUEST). Appl. Ergon. 2009, 40, 230–238. [Google Scholar] [CrossRef]
  51. Dawal, S.Z.M. A Study of Ergonomics Factors Affecting Job Satisfaction in Work Design for Automotive Industries in Malaysia; Fakulti Kejuruteraan, Universiti Malaya: Kuala Lumpur, Malaysia, 2005. [Google Scholar]
  52. Amaratunga, D.; Kulatunga, U.; Liyanage, C.; Hui, E.C.; Zheng, X. Measuring customer satisfaction of FM service in housing sector. Facilities 2010, 28, 306–320. [Google Scholar] [CrossRef]
  53. Byrne, B.M. Multivariate Applications Series. Structural Equation Modeling with AMOS: Basic Concepts, Applications, and Programming; Routledge/Taylor & Francis Group: New York, NY, USA, 2010. [Google Scholar]
  54. Yuan, K.H.; Wu, R.; Bentler, P.M. Ridge structural equation modelling with correlation matrices for ordinal and continuous data. Br. J. Math. Stat. Psychol. 2011, 64, 107–133. [Google Scholar] [CrossRef] [Green Version]
  55. Hair, J.F.; Anderson, R.E.; Babin, B.J.; Black, W.C. Multivariate Data Analysis: A Global Perspective; Pearson: Upper Saddle River, NJ, USA, 2010; Volume 7. [Google Scholar]
  56. Ringle, C.M.; Sarstedt, M.; Straub, D.W. Editor’s comments: A critical look at the use of PLS-SEM in “MIS Quarterly”. MIS Q. 2012, 36, iii–xiv. [Google Scholar] [CrossRef] [Green Version]
  57. Chin, W.W.; Marcolin, B.L.; Newsted, P.R. A partial least squares latent variable modeling approach for measuring interaction effects: Results from a Monte Carlo simulation study and an electronic-mail emotion/adoption study. Inf. Syst. Res. 2003, 14, 189–217. [Google Scholar] [CrossRef] [Green Version]
  58. Kanwal, N.; Isha, A.S.N. The moderating effects of social media activities on the relationship between effort-reward imbalance and health and wellbeing: A case study of the oil and gas industry in Malaysia. Front. Public Health 2022, 10, 805733. [Google Scholar] [CrossRef] [PubMed]
  59. Lagoudis, I.N.; Lalwani, C.S.; Naim, M.M. Ranking of factors contributing to higher performance in the ocean transportation industry: A multi-attribute utility theory approach. Marit. Policy Manag. 2006, 33, 345–369. [Google Scholar] [CrossRef]
  60. Allen, J.; Eboli, L.; Mazzulla, G.; de Dios Ortúzar, J. Effect of critical incidents on public transport satisfaction and loyalty: An Ordinal Probit SEM-MIMIC approach. Transportation 2020, 47, 827–863. [Google Scholar] [CrossRef]
  61. Papantoniou, P. Structural equation model analysis for the evaluation of overall driving performance: A driving simulator study focusing on driver distraction. Traffic Inj. Prev. 2018, 19, 317–325. [Google Scholar] [CrossRef]
  62. Al-Aidrous, A.-H.M.; Shafiq, N.; Al-Ashmori, Y.Y.; Al-Mekhlafi, A.-B.A.; Baarimah, A.O. Essential Factors Enhancing Industrialized Building Implementation in Malaysian Residential Projects. Sustainability 2022, 14, 11711. [Google Scholar] [CrossRef]
  63. Mohammed, M.; Shafiq, N.; Al-Mekhlafi, A.-B.A.; Al-Fakih, A.; Zawawi, N.A.; Mohamed, A.M.; Khallaf, R.; Abualrejal, H.M.; Shehu, A.A.; Al-Nini, A. Beneficial Effects of 3D BIM for Pre-Empting Waste during the Planning and Design Stage of Building and Waste Reduction Strategies. Sustainability 2022, 14, 3410. [Google Scholar] [CrossRef]
  64. Alawag, A.M.; Alaloul, W.S.; Liew, M.; Baarimah, A.O.; Musarat, M.A.; Al-Mekhlafi, A.-B.A. The Role of the Total-Quality-Management (TQM) Drivers in Overcoming the Challenges of Implementing TQM in Industrialized-Building-System (IBS) Projects in Malaysia: Experts’ Perspectives. Sustainability 2023, 15, 6607. [Google Scholar] [CrossRef]
  65. Mikalef, P.; Pateli, A. Information technology-enabled dynamic capabilities and their indirect effect on competitive performance: Findings from PLS-SEM and fsQCA. J. Bus. Res. 2017, 70, 1–16. [Google Scholar] [CrossRef]
  66. Al-Tahitah, A.N.; Al-Sharafi, M.A.; Abdulrab, M. How COVID-19 Pandemic Is Accelerating the Transformation of Higher Education Institutes: A Health Belief Model View. In Emerging Technologies during the Era of COVID-19 Pandemic; Springer: Berlin/Heidelberg, Germany, 2021; Volume 348, p. 333. [Google Scholar]
  67. Al-Mekhlafi, A.-B.A.; Othman, I.; Kineber, A.F.; Mousa, A.A.; Zamil, A. Modeling the Impact of Massive Open Online Courses (MOOC) Implementation Factors on Continuance Intention of Students: PLS-SEM Approach. Sustainability 2022, 14, 5342. [Google Scholar] [CrossRef]
  68. Kanwal, N.; Isha, A.S.N.B.; Salleh, R.B.; Kanwal, N.; Al-Mekhlafi, A.-B.A. Paradoxical effects of social media use on workplace interpersonal conflicts. Cogent Bus. Manag. 2023, 10, 2200892. [Google Scholar] [CrossRef]
  69. Ajmal, M.; Isha, A.S.N.; Nordin, S.M.; Al-Mekhlafi, A.-B.A. Safety-management practices and the occurrence of occupational accidents: Assessing the mediating role of safety compliance. Sustainability 2022, 14, 4569. [Google Scholar] [CrossRef]
  70. MacKenzie, S.B.; Podsakoff, P.M. Common method bias in marketing: Causes, mechanisms, and procedural remedies. J. Retail. 2012, 88, 542–555. [Google Scholar] [CrossRef]
  71. Podsakoff, P.M.; Organ, D.W. Self-reports in organizational research: Problems and prospects. J. Manag. 1986, 12, 531–544. [Google Scholar] [CrossRef]
  72. Harman, H. Modern Factor Analysis; University of Chicago Press: Chicago, IL, USA, 1967; pp. 486–503. [Google Scholar]
  73. Hair, J.F., Jr.; Hult, G.T.M.; Ringle, C.; Sarstedt, M. A Primer on Partial Least Squares Structural Equation Modeling (PLS-SEM); Sage Publications Inc.: Hong Kong, China, 2016; pp. 211–213. [Google Scholar]
  74. Wong, K.K.-K. Partial least squares structural equation modeling (PLS-SEM) techniques using SmartPLS. Mark. Bull. 2013, 24, 1–32. [Google Scholar]
  75. Henseler, J.; Ringle, C.M.; Sinkovics, R.R. The Use of Partial Least Squares Path Modeling in International Marketing. In New Challenges to International Marketing; Emerald Group Publishing Limited: Bingley, UK, 2009. [Google Scholar]
  76. Hair, J.F.; Ringle, C.M.; Sarstedt, M. Partial least squares structural equation modeling: Rigorous applications, better results and higher acceptance. Long Range Plan. 2013, 46, 1–12. [Google Scholar] [CrossRef]
  77. Fornell, C.; Larcker, D.F. Evaluating structural equation models with unobservable variables and measurement error. J. Mark. Res. 1981, 18, 39–50. [Google Scholar] [CrossRef]
  78. Chin, W.W.; Newsted, P.R. Structural equation modeling analysis with small samples using partial least squares. Stat. Strateg. Small Sample Res. 1999, 1, 307–341. [Google Scholar]
  79. Tabachnick, B.G.; Fidell, L.S.; Ullman, J.B. Using Multivariate Statistics; Pearson: Boston, MA, USA, 2007; Volume 5. [Google Scholar]
  80. Hair, J.F.; Black, W.C.; Babin, B.J.; Anderson, R.E.; Tatham, R.L. Multivariate Data Analysis; Pearson Prentice Hall: Upper Saddle River, NJ, USA, 2006; Volume 6. [Google Scholar]
  81. Chin, W.W. Commentary: Issues and Opinion on Structural Equation Modeling; MIS Quarterly, Management Information Systems Research Center, University of Minnesota: Minneapolis, MN, USA, 1998; Volume 22, pp. vii–xvi. [Google Scholar]
  82. Chin, W.W. The partial least squares approach to structural equation modeling. Mod. Methods Bus. Res. 1998, 295, 295–336. [Google Scholar]
  83. Hair, J.F.; Ringle, C.M.; Sarstedt, M. PLS-SEM: Indeed a silver bullet. J. Mark. Theory Pract. 2011, 19, 139–152. [Google Scholar] [CrossRef]
  84. Ajmal, M.; Isha, A.S.N.; Nordin, S.M.; Rasheed, S.; Al-Mekhlafi, A.B.A.; Naji, G.M.A. Safety management and safety outcomes in oil and gas industry in Malaysia: Safety compliance as a mediator. Process Saf. Prog. 2022, 41, S10–S16. [Google Scholar] [CrossRef]
  85. Kee, S.; Tamrin, S.B.M.; Goh, Y. Driving fatigue and performance among occupational drivers in simulated prolonged driving. Glob. J. Health Sci. 2010, 2, 167. [Google Scholar]
  86. Bailey, R.W. Human Performance Engineering Designing High Quality Professional User Interfaces for Computer Products, Applications and Systems; Prentice-Hall, Inc.: Upper Saddle River, NJ, USA, 1996. [Google Scholar]
  87. Baines, T.S.; Asch, R.; Hadfield, L.; Mason, J.; Fletcher, S.; Kay, J.M. Towards a theoretical framework for human performance modelling within manufacturing systems design. Simul. Model. Pract. Theory 2005, 13, 486–504. [Google Scholar] [CrossRef] [Green Version]
  88. Chang, Y.-H.; Yeh, C.-H. Human performance interfaces in air traffic control. Appl. Ergon. 2010, 41, 123–129. [Google Scholar] [CrossRef]
  89. Thiffault, P.; Bergeron, J. Monotony of road environment and driver fatigue: A simulator study. Accid. Anal. Prev. 2003, 35, 381–391. [Google Scholar] [CrossRef]
  90. Islam, M.; Alharthi, M.; Alam, M. The impacts of climate change on road traffic accidents in Saudi Arabia. Climate 2019, 7, 103. [Google Scholar] [CrossRef] [Green Version]
Figure 1. Research design.
Safety 09 00048 g001
Figure 2. The measurement model.
Safety 09 00048 g002
Table 1. Common method bias.
Extracted Sums of Squared Loadings
Total% Of VarianceCumulative %
7.96736.21136.211
Table 2. Constructs convergent validity.
ConstructsItemsOuter LoadingCronbach’s AlphaComposite
Reliability
AVE
Work environment (WC)WC_10.9250.9630.9690.778
WC_20.892
WC_30.696
WC_40.899
WC_50.924
WC_60.920
WC_70.921
WC_80.889
WC_90.847
Driving performance (DP)DP_1Deleted0.9620.9670.747
DP_20.877
DP_30.870
DP_40.858
DP_50.871
DP_60.874
DP_70.875
DP_80.837
DP_90.850
DP_100.877
DP_110.854
Table 3. (Fornell–Larcker) discriminant validity.
ConstructDriving PerformanceWork Environment
Driving performance0.864
Work environment0.6930.882
Table 4. Cross-loading of discriminant validity.
ItemDriving PerformanceWork Environment
DP_100.8770.627
DP_110.8540.557
DP_20.8770.595
DP_30.8700.612
DP_40.8580.628
DP_50.8710.597
DP_60.8740.611
DP_70.8760.581
DP_80.8370.57
DP_90.8500.607
DP_100.8780.627
WC_10.6420.925
WC_20.6530.892
WC_30.6130.696
WC_40.5870.899
WC_50.6090.924
WC_60.590.920
WC_70.6090.921
WC_80.5980.889
WC_90.5720.847
Table 5. Hypothesis path coefficient, p-value.
PathβSEt-Valuep-Value
WC → DP0.2370.0992.3910.017
Table 6. Explanatory power R2.
Endogenous (Dependent Variable)R2Status Explanation
Driving Performance0.638Substantial
Table 7. Predictive relevance of the model Q2.
Dependent VariableSSOSSEQ2 (=1 − SSE/SSO)
Driving performance DP3040.0001623.2620.46
Table 8. Work conditions’ importance and performance.
PredictorImportancePerformances
Work environment0.23765.838
Disclaimer/Publisher’s Note: The statements, opinions and data contained in all publications are solely those of the individual author(s) and contributor(s) and not of MDPI and/or the editor(s). MDPI and/or the editor(s) disclaim responsibility for any injury to people or property resulting from any ideas, methods, instructions or products referred to in the content.

