Article

A User-Centered Design Exploration of Factors That Influence the Rideshare Experience

1
Department of Automotive Engineering, Clemson University, Greenville, SC 29607, USA
2
Department of Psychology, Clemson University, Clemson, SC 29634, USA
3
J.D. Power, Troy, MI 48083, USA
*
Author to whom correspondence should be addressed.
Safety 2023, 9(2), 36; https://doi.org/10.3390/safety9020036
Submission received: 23 March 2023 / Revised: 23 May 2023 / Accepted: 25 May 2023 / Published: 26 May 2023

Abstract

:
The rise of real-time information communication through smartphones and wireless networks enabled the growth of ridesharing services. While personal rideshare services (individuals riding alone or with acquaintances) initially dominated the market, the popularity of pooled ridesharing (individuals sharing rides with people they do not know) has grown globally. However, pooled ridesharing remains less common in the U.S., where personal vehicle usage is still the norm. Vehicle design and rideshare services may need to be tailored to user preferences to increase pooled rideshare adoption. Based on a large, national U.S. survey (N = 5385), the results of exploratory and confirmatory factor analyses suggested that four key factors influence riders’ willingness to consider pooled ridesharing: comfort/ease of use, convenience, vehicle technology/accessibility, and passenger safety. A binomial logistic regression was conducted to determine how the four factors influence one’s willingness to consider pooled ridesharing. The two factors that positively influence riders’ willingness to consider pooled ridesharing are vehicle technology/accessibility (B = 1.10) and convenience (B = 0.94), while lack of passenger safety (B = −0.63) and comfort/ease of use (B = −0.17) are pooled ridesharing deterrents. Understanding user-centered design and service factors are critical to increase the use of pooled ridesharing services in the future.

1. Introduction

The Society of Automotive Engineers (SAE) defines ridesharing as the formal or informal sharing of rides between drivers and passengers with similar origin–destination pairings [1]. Transportation network companies (TNCs) such as Uber and Lyft are formal ridesharing services that offer personal rideshare, where a rider can choose to travel alone or with individuals in their party, and pooled ridesharing, where a rider indicates their willingness to potentially travel with other riders that they do not know who are traveling towards the same direction. TNCs offer on-demand ride services where requests are made in real time as long as the rider has internet connectivity, typically through an app on a smartphone. Due to the rise in smartphone usage, on-demand ridesharing services have increased. For example, from Uber’s 2019 annual report, their service is available in more than 10,000 cities across 69 countries [2]. There was a 32% increase in the number of bookings from 2018 to 2019. However, there was a 28% decline in 2020 due to the COVID-19 pandemic [3].
Internet-based ridesharing became available after the emergence of information and communication technology (ICT), such as the internet and cellphones, which provided real-time, efficient ride-matching solutions. Ridesharing services that offer pooled rides rely on ICT to enable dynamic, real-time communication for the delivery of their service. A critical element of real-time ridesharing is effective communication between the driver and rider(s). Service providers have been consistently improving ride-matching algorithms [4,5]. The technical convergence of ICT, smartphones and GPS led to real-time ride-matching to enable pooled ridesharing. TNCs such as Uber and Lyft also rely upon services such as Google Maps for navigation to determine the best routes for rides [6,7]. Real-time ridesharing was not possible until accurate information could be delivered in a time-sensitive manner [8]. Once smartphones evolved to the point that reliable location information could be provided, the ability for ride-matching for ridesharing services became possible [9]. Over time, advancements led to higher match rates in pooled ridesharing. Tao and Wu [10] conducted a field trial assessment of a real-time, dynamic ridesharing system, where they identified the essential elements for pooled rideshare service providers to have efficient operations: target customers and a service area, service times and routes, ride-matching algorithms, a mileage calculation, criteria of fare calculation, a payment method, the ability to know customer’s preferences, and a means for transparent communication.
From a travelers’ perspective, one desirable feature is the ability to multi-task during a trip in order to increase productivity during the ride, regardless of if the vehicle is a personal vehicle or public transit [11]; their analysis suggests that the ability to use a laptop, tablet, or notebook during a commute was a significant contributing factor when determining transportation modality. Rideshare services can provide a convenient and flexible transportation option without the burden of driving oneself. Several studies have highlighted that the future fully autonomous vehicles, which are self-driving vehicles, have the potential to be used for ridesharing services [12,13,14]. Shared autonomous vehicles have the potential to allow riders to relax or be productive while traveling.
Travelers consider the safety features essential to using rideshare services. Gurumurthy and Kockelman’s [13] shared autonomous vehicle model showed that respondents’ willingness to share rides with strangers increased by approximately 15% if there is the capability to broadcast their location information to family or friends for safety purposes with the expectation this location-sharing ability occurs for no additional cost. Several researchers have suggested that service providers need to have a mechanism to conduct criminal background checks and screenings of riders using social networking platforms in order to increase rideshare use [13,15,16,17]. Social networking platforms are used to match individuals who have common interests and/or friends. Uber uses Facebook profiles to search for riders’ interests and mutual friends [18]. Riders have mixed opinions about this; some feel this could help them meet new people, while others do not feel comfortable sharing their information [19,20].
Trust is an important topic when considering ridesharing [15]. Several studies suggest that riders feel safe using pooled ridesharing when traveling with co-workers or riders from the same neighborhood [16,17,21]. Trust can also be established through rider reviews and rating systems [15,22,23]. Riders with good ratings can be offered special deals or incentives to reward good behavior. However, in some studies, respondents did not want the service providers to include riders’ ratings [13]. Some feel that rider ratings create the possibility of discrimination against others based on race or class [22]. Sarriera et al. [17] documented that many riders harbor feelings of prejudice towards other riders of different social classes and races.
A transparent pricing structure may increase the trust of the riders [16,17]. Similarly, an efficient ride-matching algorithm which avoids detours will also positively influence trust [22]. A driver is a significant factor when trusting a rideshare service platform. The service providers try to ensure a positive driver credibility [24]. The service providers can include a one-button alarm/panic option to prevent drivers from unnecessary detours [23,25]. Transparent travel routes, driver ratings, and communication channels can improve safety perception [25]. In pooled ridesharing, the vehicle detouring from one’s route needs to be constantly updated to the riders [26].
The needs and preferences of riders vary by the riders’ age. Gluck et al.’s [26] study on older adults’ preferences (with average age of 85.5 years old) in a shared autonomous vehicle showed that assistive features such as swivel seats, automatic doors, and wheelchair accessibility for vehicle ingress and egress are essential. Riders want privacy and sufficient storage for mobility aids. In addition, an emergency contact system or the ability to have the vehicle drive to a nearby hospital in case of a medical emergency were also important. Unlike the younger generations, the potential older users do not want to use smartphone apps to book a vehicle; instead, they prefer to book a ride by making a phone call. In addition, to supplement touch screen display, this older group of potential riders also wants to be able to communicate through audio options.
TNCs offer specialized services aimed at meeting the needs of many consumer groups. HopSkipDrive and Kango are companies that are dedicated to offering ridesharing services to children for pickup and drop-off at school and other events [27,28]. Although Lift Hero is no longer in business, they provided specialized ridesharing services for the U.S.’s aging population [29]. In select markets, both Uber and Lyft offer special services for individuals with disabilities [30,31]. These services may offer different types of vehicles, such as wheelchair-accessible vehicles and/or skilled drivers to support the riders’ needs.
Pratt et al. [22] analyzed the tweets of pooled rideshare riders. The recommendations provided to service providers included the need to ensure that the driver and riders follow social protocols, cleanliness, maintain non-smoking environment, and ensure riders would not ride if they had an infection, even before the COVID-19 pandemic.
Service providers need to develop robust and reliable real-time systems which help accessibility to riders. Michalak et al. [16] suggested that pooled rideshare services need to be available 24 h per day and offer a guaranteed ride to their home. There can be a monthly subscription discount for long-term participation [10,32].
Pooled rideshare acceptance can potentially be increased by exploring the travelers’ requirements and identifying their concerns. There is an opportunity to use technological advancements in several domains, e.g., ICT and vehicle automation, to enhance rideshare vehicle designs, services, and experiences to address the barriers to using rideshare. This study used a subset of a larger dataset which examined the survey items aimed to optimize one’s pooled rideshare experience. Based on a review of extant literature, the present research employed a U.S. nationwide online survey, which focused on enhancing the overall experience of using pooled rideshare services. An exploratory factor analysis was conducted to identify the key groupings of topical areas. Then, a confirmatory factor analysis was conducted to further validate the factor structure. Finally, a binomial logistic regression provided insight into the weightings of each of the factors.

2. Materials and Methods

2.1. Participants

The study included a total of 5385 participants, with 2000 recruited across the United States and 3385 from targeted locations such as Atlanta, Austin, Chicago, Detroit, New York City, San Francisco, and the upstate of South Carolina. The decision to expand to the target locations was primarily driven by the potential for future modeling collaborations with Argonne National Lab. Transportation trends guided the selection of the six cities, as these locations presented valuable insights. In addition to these six locations, the upstate region of South Carolina is near Clemson University. Participants were required to be at least 18 years old, and their ages ranged from 18 to 95 years, with a mean of 46.5 years (SD = 17.5). Of the total participants, 2803 self-identified as female and 2545 as male. This study was approved by the Institutional Review Board at Clemson University and was conducted between July and August 2021.

2.2. Online Survey

Participants completed an online survey. Participants were required to answer two screener questions regarding their age and rideshare experience within the last five years. Those who worked as drivers for rideshare companies but had no experience as passengers were excluded from the study. After the screener questions and providing consent, each participant completed five sections:
  • Section 1: Your transportation needs. This section assessed the participant’s typical modes of transportation and reasons for using personal and pooled rideshare services.
  • Section 2: Willingness to consider pooled ridesharing (PR). This section evaluated the participant’s readiness to utilize PR.
  • Section 3a and 3b: Would/Would-not-consider-PR. This section investigated topics that may influence the participant’s willingness or unwillingness to consider using pooled ridesharing.
  • Section 4: Optimizing rideshare experience. This section examined topics related to user-centered topics and service-related needs.
  • Section 5: Demographics. This section gathered information about the participant and their household.
The present study focused on questions from Section 4 of the larger survey, optimizing rideshare experience. This section included 23 items thematically grouped by the authors into three categories of items (mode, HMI, and route) that are related to user-centered vehicle design and ridesharing services that may influence one’s willingness to consider pooled ridesharing. The mode category consisted of seven items related to vehicle technology and rideshare services provided by the TNC companies. The HMI category consisted of 10 items related to user interaction with the vehicle and/or related rideshare services. The route category included six items related to trip services for a ride, such as cost, time, and the trip’s details (see Table 1). Each item was rated on a four-point Likert-type scale: ‘Strongly disagree’, ‘Disagree’, ‘Agree’, and ‘Strongly agree’.
The survey items were chosen based on an extensive literature review on the challenges and solutions related to ridesharing, with the aim of enhancing the overall experience of using pooled rideshare services. The literature emphasized several important elements of user experience and rideshare service delivery. The items in the mode category explore the technology and services associated with the ridesharing experience. Previous research [9,12,13,14] emphasized the importance of vehicle automation and electric vehicles as factors influencing user preference and adoption. Additionally, the need for cleaning and disinfecting rides, accessibility for passengers with disabilities, the ability to ride with like-minded individuals, pre-screening of passengers, and availability of subscription services were discussed in various studies [10,16,22,24,26]. The items in the HMI (Human–Machine Interface) category focused on user interaction with the vehicle and associated services. Previous research [16,17,26] emphasized the importance of easy-to-use apps, temperature control, adjustable seating, and profile viewing of co-passengers prior to the ride. Items regarding the availability of private spaces, alternative ride-request methods, and sufficient storage space were discussed in various studies [26,32]. User preferences for information and entertainment options and first-time user assistance were also mentioned in the literature [16,22]. The survey items in the route category are related to the trip’s details, including cost, time, and logistics. Based on previous research, the affordability of ridesharing, 24/7 availability, the potential for co-passengers heading to the same direction of the destination, ability to share trip and location information, clarity on ride details (cost, route, time), and minimizing detours are important considerations for users [10,13,16,22,26]. Each of the survey items corresponds to categories that were identified in prior research as influencing user preferences and the adoption of pooled rideshare services. Therefore, they were included in the survey to gain a comprehensive understanding of user preferences and areas for improvement in the current service.

2.3. Data Analysis

The current study utilized data from all participants who completed the optimizing rideshare experience section. The 23 items from this section were used in a factor analysis to identify underlying latent dimensions. Because the sample was representative of the general population, a factor analysis was used to determine if the survey items could be grouped together based on their correlations.
Descriptive statistics were calculated, and an exploratory factor analysis (EFA) was performed. EFA is a statistical procedure that examines whether variables (i.e., items) correlate with each other in a systematic manner [33]. This was done to determine whether the items could be grouped together based on their correlations. Bartlett’s [34] test of sphericity was used to determine whether the correlation matrix deviated from an identity matrix. The Kaiser–Meyer–Olkin measure of sampling adequacy [35] was also used to verify if a factor analysis was appropriate for the items. MSAs 0.9 suggest that the degree of correlation among the variables is sufficiently high for factor analysis.
To extract factors from the correlation matrix, the principal axis method was used [36]. Data reduction is one of the major purposes of factor analysis, where the number of factors extracted is typically much smaller than the number of variables. Two approaches were used to decide how many factors to retain. Kaiser’s [37] rule specifies that the number of factors to extract should be greater than the variance of a single variable. A parallel analysis [33,38] was conducted to compare the eigenvalues from the original dataset to the eigenvalues from a simulated uncorrelated dataset of similar dimensions to the actual data. Parallel analysis is considered a more accurate method for factor retention due to its systematic nature [33].
After factor extraction, the factor loadings were rotated using an oblique factor rotation. The Promax rotation [39] was used to achieve a simple structure, allowing the factors to be correlated. The psych package in R was used to conduct the EFA [40,41]. To validate the EFA model, a confirmatory factor analysis (CFA) was conducted using the lavaan package in R [42]. CFA was used as a validation method to assess how well the factor model reproduced the sample correlation matrix, providing evidence to adopt the new factor model [43].
An 80/20 holdout validation approach was used, where 80% of the total sample (N = 4296) was selected for the EFA model fitting and 20% of the total sample (N = 1099) was selected for the CFA model fitting [44]. The total sample was grouped according to the regions of participants and their willingness to consider using pooled ridesharing. In each sample group, 80% of the samples were randomly selected for the EFA sample set and 20% of the samples were randomly selected for the CFA sample set.
Finally, a binomial logistic regression was conducted to evaluate the influence of each predictor on the outcome [45]. Participants’ willingness to consider pooled ridesharing was determined using the following question: “Regardless of your past experience, would you be willing to consider utilizing a pooled rideshare, one in which you share the ride with people you don’t know who may join from multiple locations during the trip and drop off at different locations? (e.g., UberPool, Lyft Shared)”. Responses to this question were then used to determine participants’ inclination towards considering pooled rideshare services. The responses to this question are ‘Yes’, ‘No’, and ‘Don’t know’. Participants were categorized into two groups according to their willingness to consider pooled ridesharing based on their responses. Participants who answered ‘Yes’ (41.0%, N = 2207) to this question were in the would-consider-PR group. Participants who answered ‘No’ (43.7%, N = 2352) and ‘Don’t know’ (15.3%, N = 826) were in the would-not-consider-PR group. Factor scores from the factor analysis were used as predictors, and the willingness to consider pooled ridesharing was used as the binary outcome.
In summary, in the present study, an EFA was conducted on 23 items from the optimizing rideshare experience section to identify underlying latent dimensions. Descriptive statistics and statistical tests were conducted to determine whether the factor analysis was appropriate for the items. The extracted factors were validated using a CFA, and a logistic regression was used to evaluate the predictive value of the factor scores.

3. Results

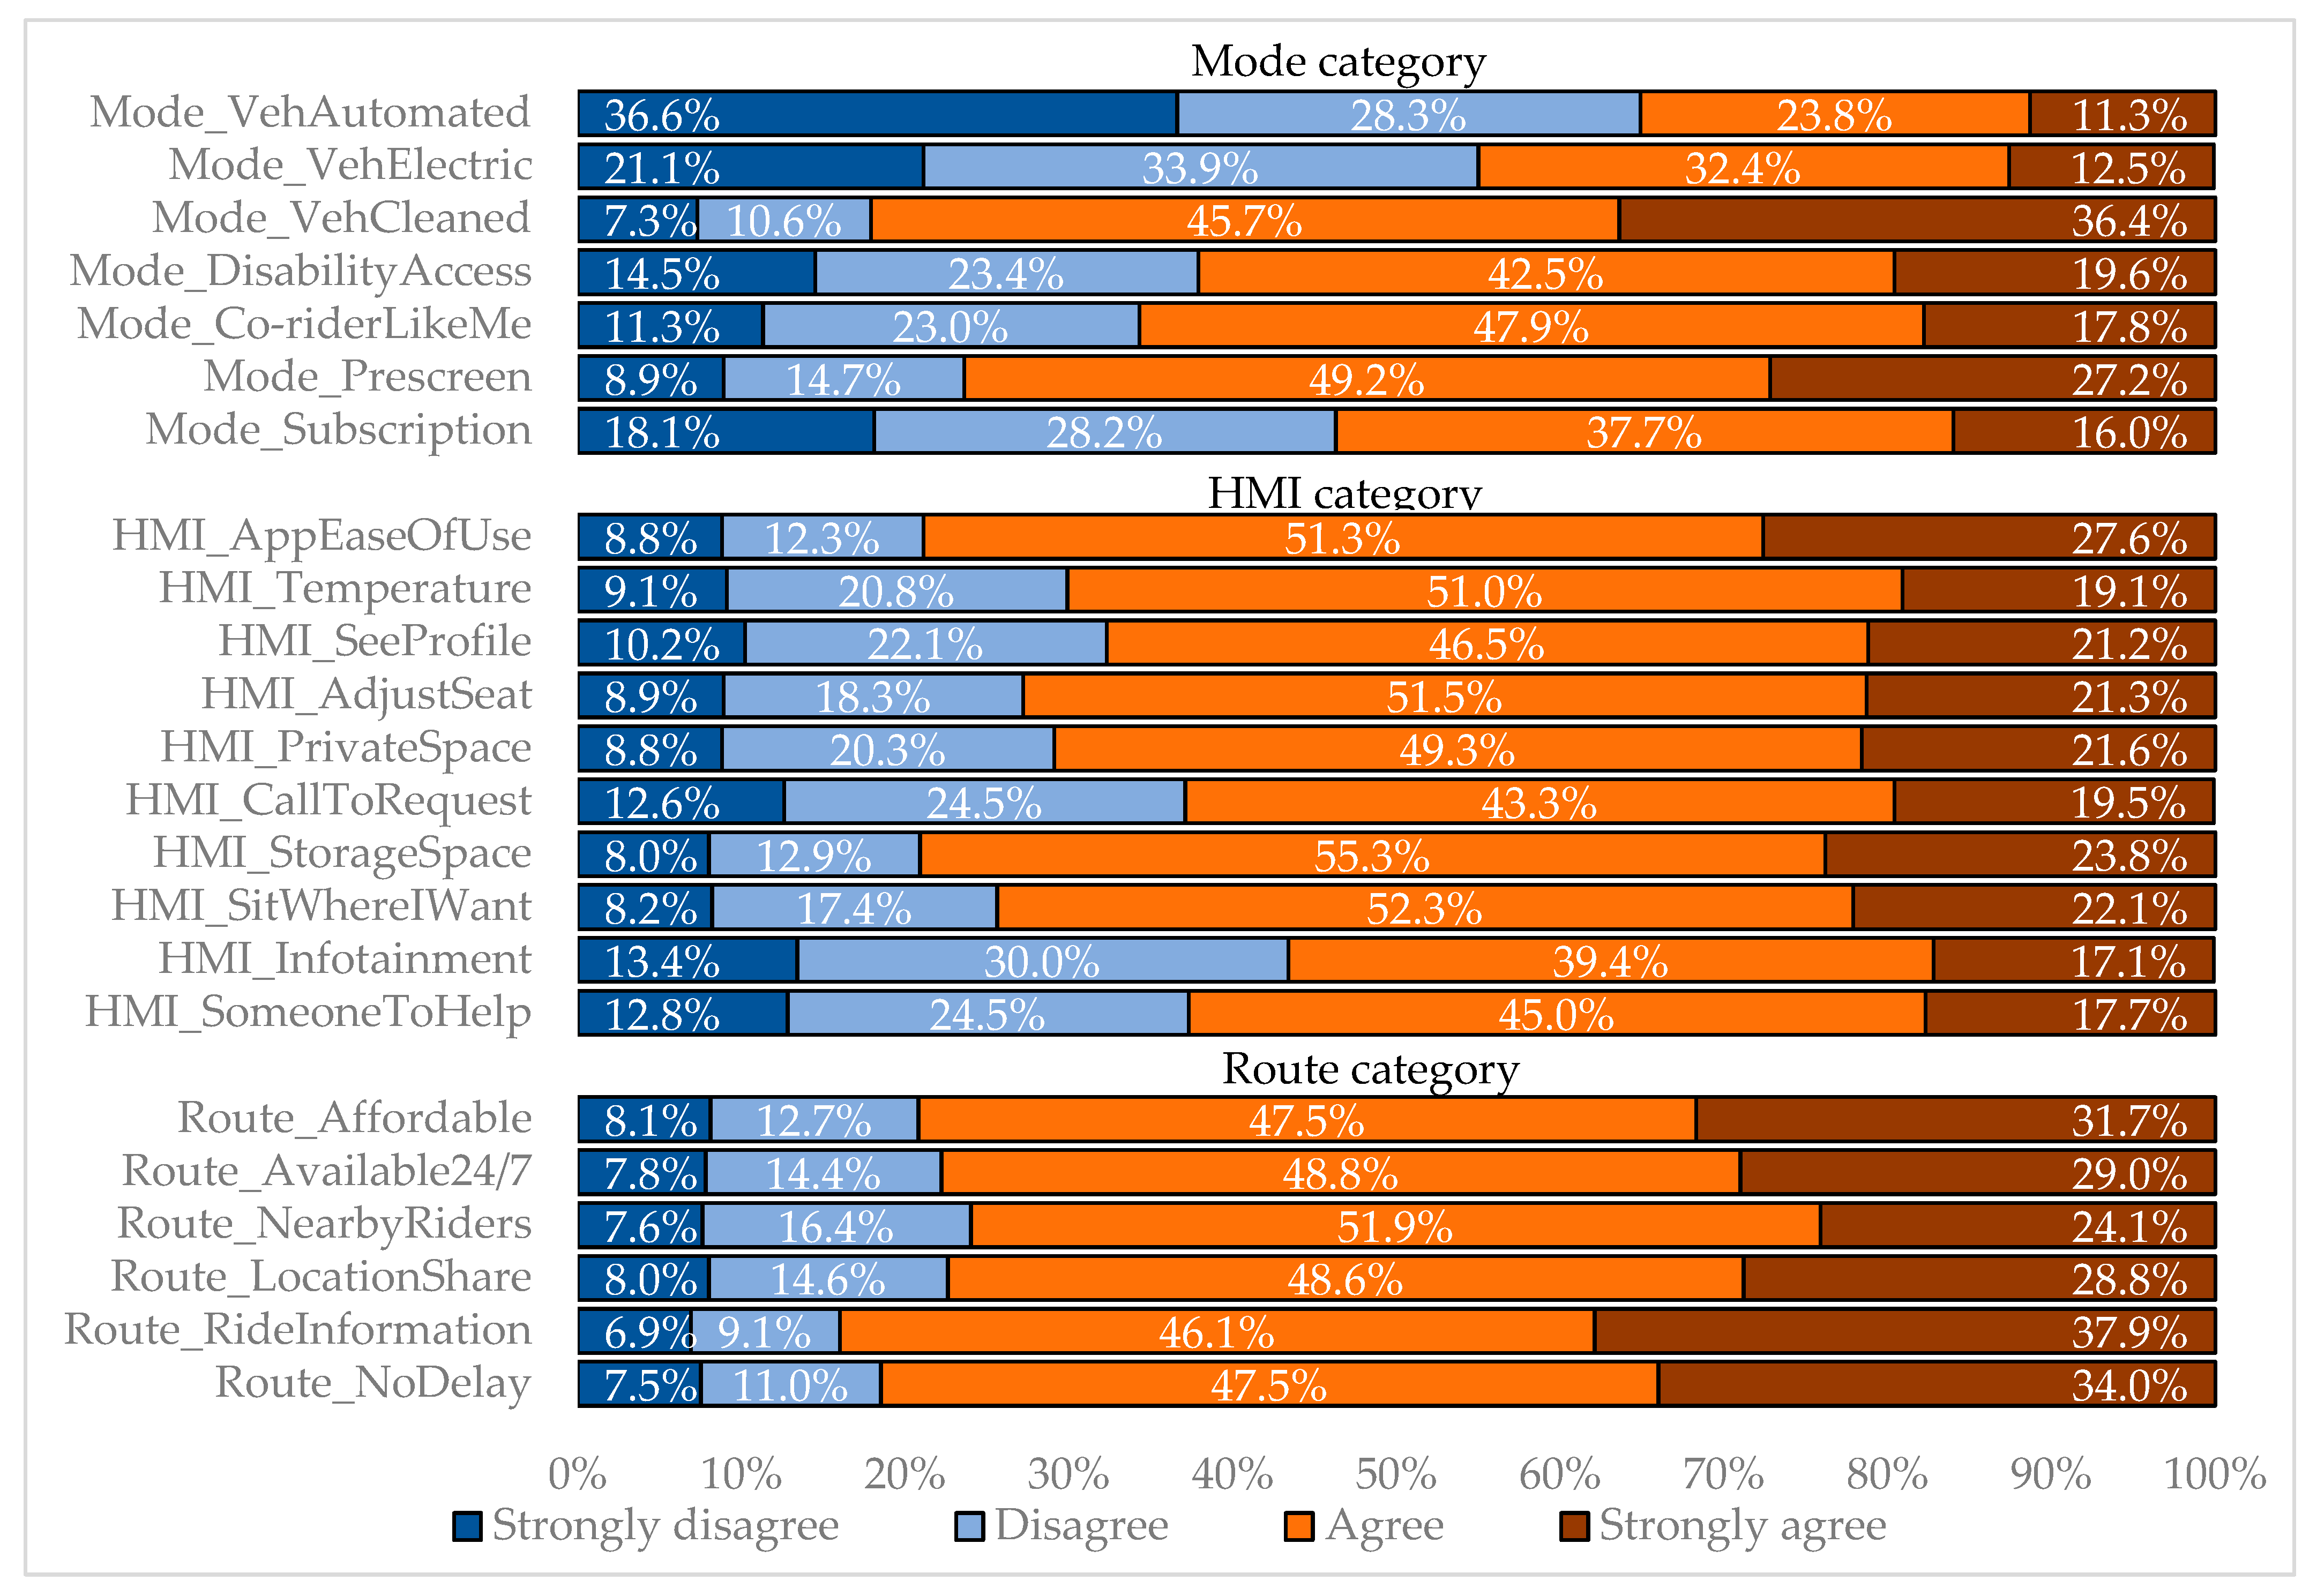
3.1. Descriptive Statistics

Out of the total sample, 21 out of 23 survey items were reported as ‘Agree’ or ‘Strongly agree’ by over 50% of the participants. The two items that fell below the 50% threshold were ‘The vehicle is automated and does not have a human driver’, with 35.1% and ‘The vehicle is a battery-electric vehicle (only runs on electricity)’ with 44.9%. Both items were in the mode category. On the other end of the spectrum in the mode category, ‘The vehicle is cleaned/disinfected in between rides’, was the statement with the greatest percentage of participants (82.1%) responding either ‘Agree’ or ‘Strongly agree’. Using a threshold of 75% of participants responding with either ‘Agree’ or ‘Strongly agree’, one additional item in mode category met this criterion, ‘The other passenger is pre-screened by the rideshare service’ (76%). Only two items in the HMI category met the 75% criteria, ‘Rideshare service app is easy to use’ (78.9%) and ‘There is sufficient storage in the vehicle for all my belongings’ (79.1%). All of the six items in the route category met the 75% criteria. In descending order, they are: ‘There is clear information about the ride (e.g., cost, route, time) before I book it’ (84%), ‘I won’t be delayed by long detours’ (81.5%), ‘The cost to share a ride is more affordable than other transportation’ (79.2%), ‘A ride is available 24/7′ (77.8%), ‘I can provide information about my trip and location to my family and/or friends’ (77.4%), and ‘The other passenger is coming from or going to the same event/location as me’ (76%). A descriptive summary of the responses is located in Figure 1.

3.2. Exploratory Factor Analysis

An EFA was used to form factors/latent variables, which were not directly measured in the survey but relevant to create different themes/topics. A series of survey items representing various measures that can be taken to improve the willingness to consider pooled rideshare services were included in the survey. These survey items might potentially be correlated by several groups. The grouping of the survey items represents the higher-level factors demonstrated by the survey items. Mathematically, the goal of the EFA is to determine not only the number of factors that underly the observed variables (i.e., items), but also which items load on the higher-level factors, while optimally reproducing the correlation matrix among the observed variables (i.e., items).

3.2.1. Correlation Matrix

First, the correlation matrix of the survey items was calculated and inspected to ensure the data was suitable for an EFA [36]. The survey items’ response options contained an ordered Likert four-point scale, and a polychoric correlation method is used for computation [46,47]. Table 2 shows the results of the polychoric correlation matrix of all 23 survey items. There were a substantial number of correlations above 0.50 between survey items within the same category (e.g., route category). A high correlation between survey items indicates that the items improve the same factor related to the willingness to consider pooled ridesharing. Most survey items had high correlations with items from the same category. Survey items related to the human–machine-interface aspects of pooled ridesharing all had correlations above 0.50 with each other. Survey items related to the routing aspects of pooled ridesharing all had correlations above 0.60 with each other.
There was only one pair of survey items from the same category with a correlation of less than 0.20. Among items related to the service mode of pooled ridesharing, ‘The vehicle is automated and does not have a human driver’ and ‘The vehicle is cleaned/disinfected in between rides’ had a correlation of 0.19. This very low correlation in the same category was a clear indication that they do not belong in the same category and the two items were diverse in their topic. One item was related to driving automation, and the other was related to vehicle cleanliness.

3.2.2. Appropriateness of the Data

To determine if the data were appropriate for an EFA, the Bartlett’s test of sphericity and the Kaiser–Meyer–Olkin test were performed. The result of the Bartlett’s test was statistically significant (χ2(253) = 59,443.32, p < 0.001), which suggests that the correlation matrix amongst the survey items was not an identity matrix. Rather, the survey items were correlated with one another; therefore, the data were appropriate for an EFA. The Kaiser–Meyer–Olkin test was used to examine the MSA of each of the survey items as well as the entire survey sample. All individual survey items had an MSA value 0.90. The overall MSA value for the entire dataset was 0.97, suggesting the sampling adequacy was large enough for an EFA.

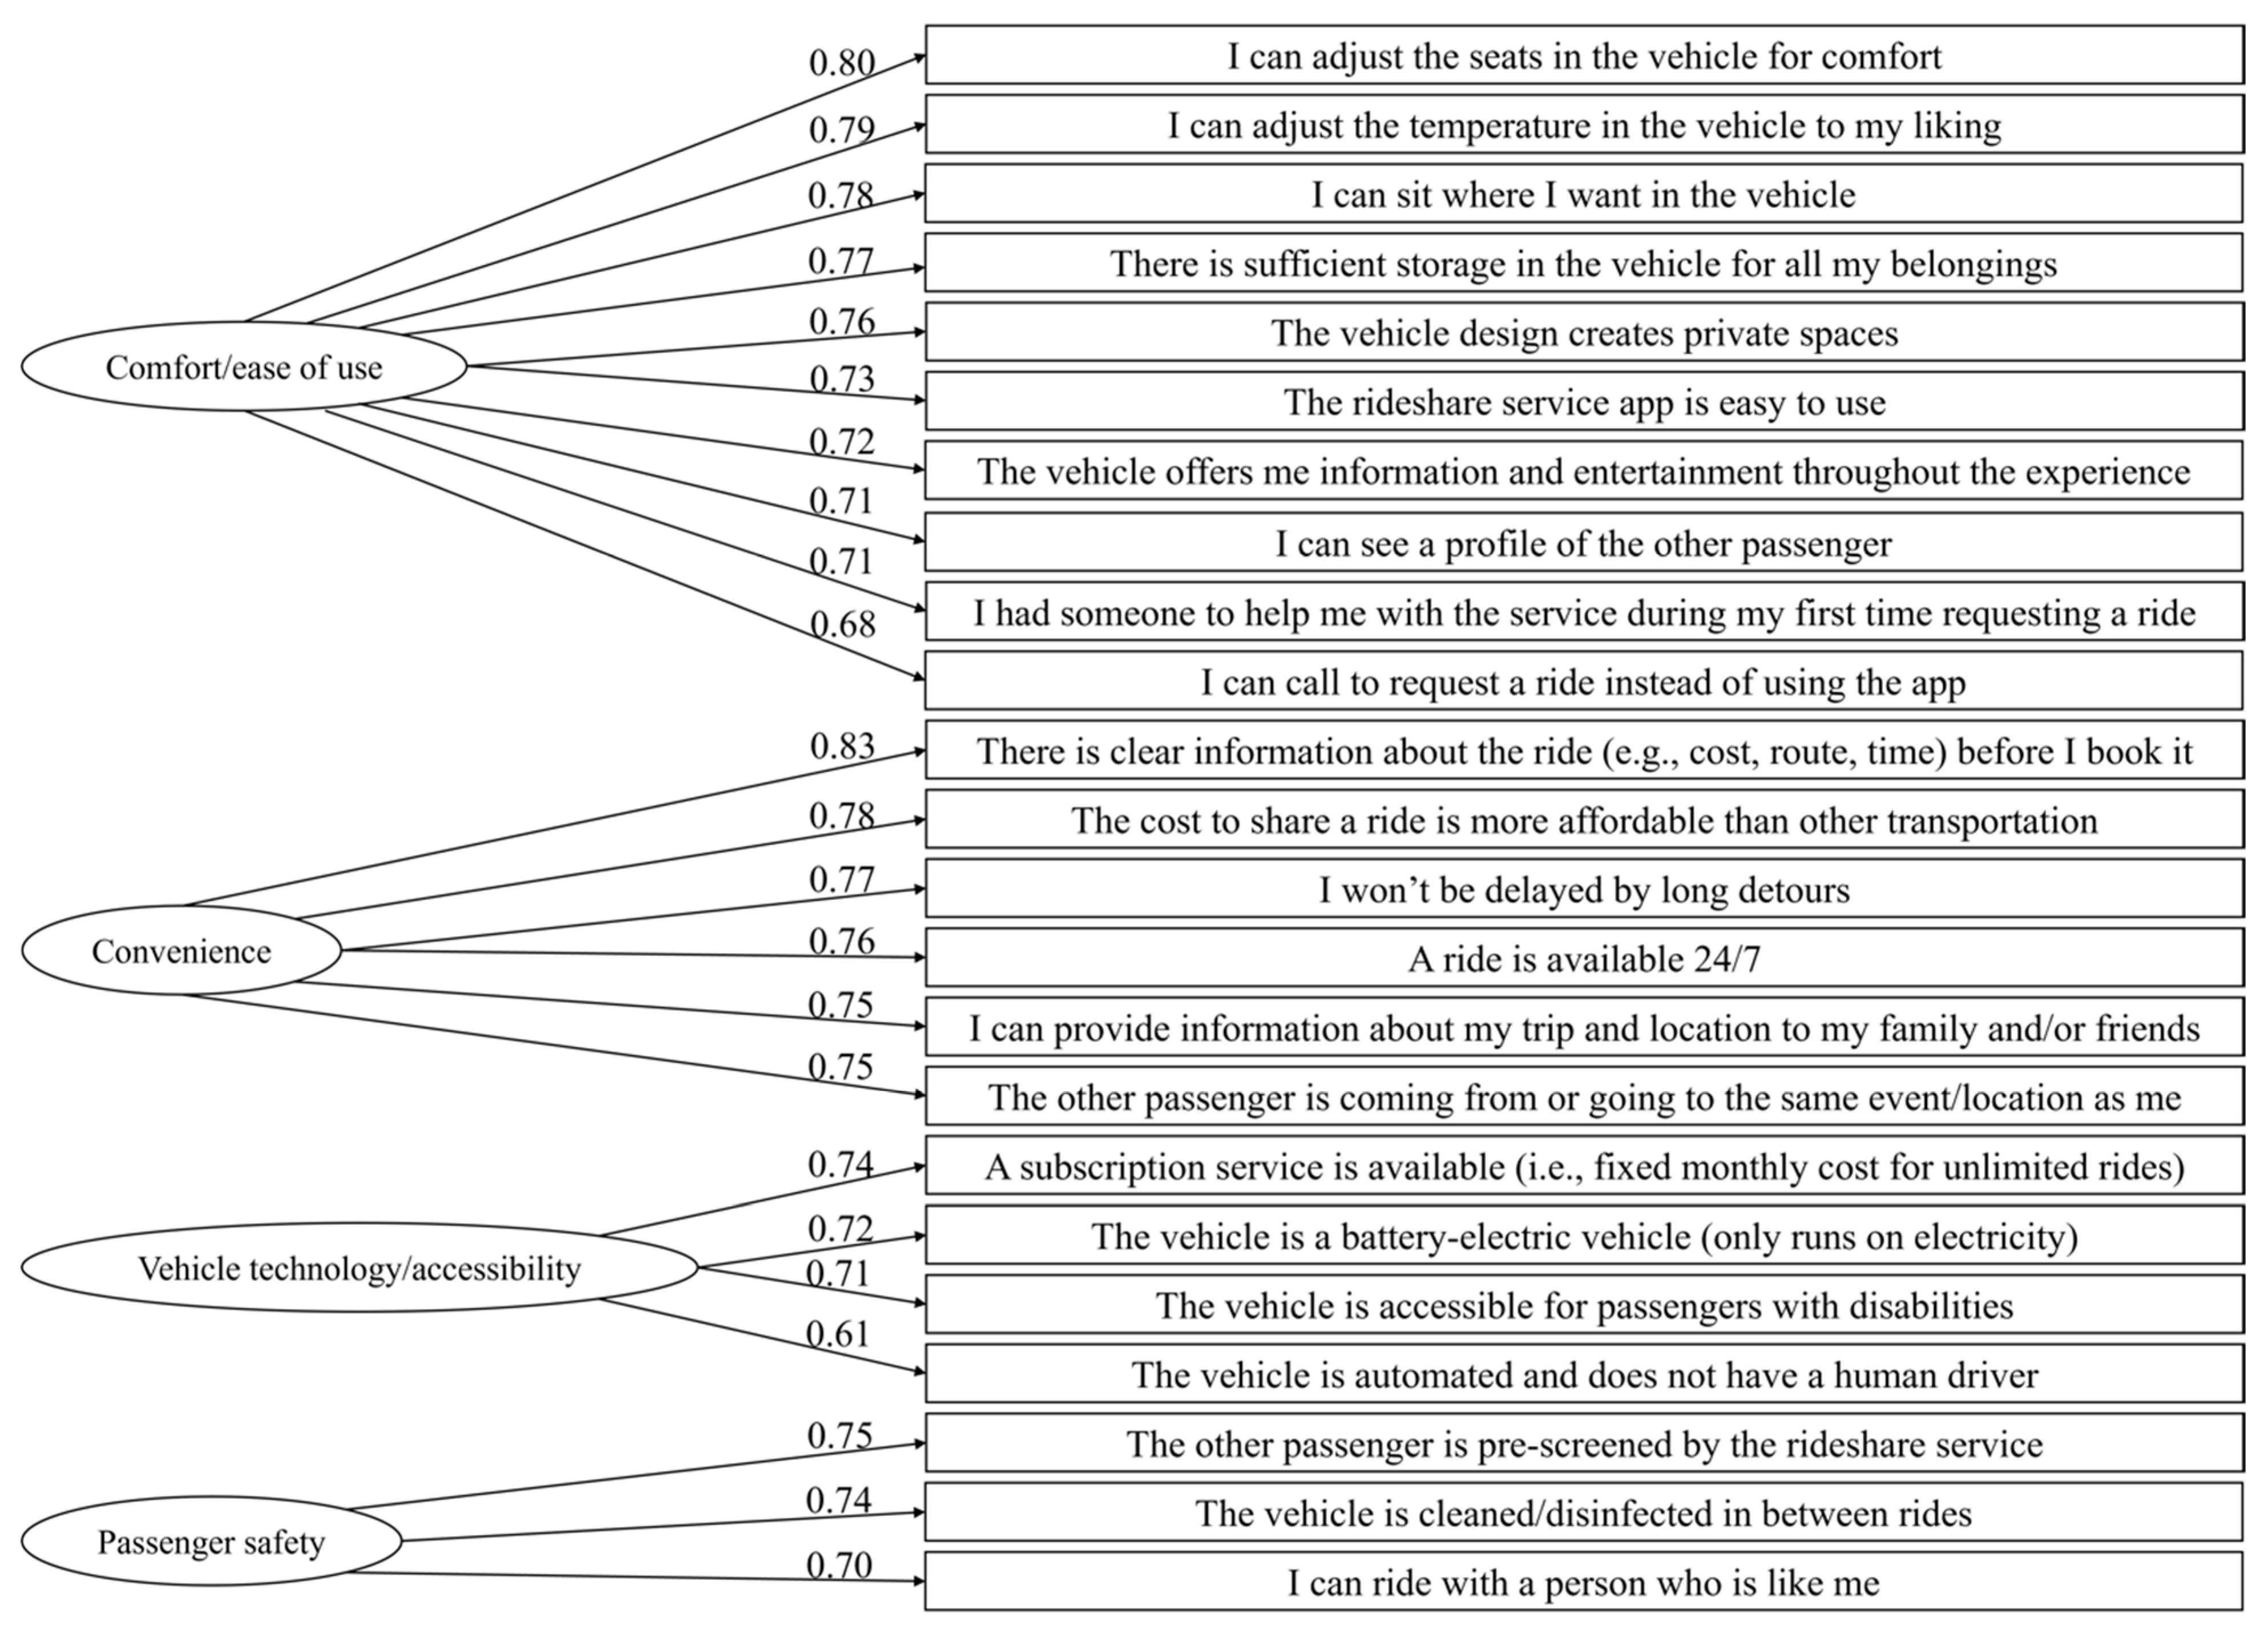
3.2.3. Exploratory Factor Analysis Model

Factor retention is a crucial process in the determination of the EFA model. There is no individual criterion decisive for the number of factors to retain. Therefore, a combination of results based on multiple rules is required for the factor retention process [47]. According to Kaiser’s eigenvalues-greater-than-one rule [37], as there were three eigenvalues greater than 1, no more than three factors should be considered in the factor analysis. With a parallel test [38], the eigenvalues of the survey data were found to drop under simulated data after the sixth factor, limiting the number of factors to retain at six. Combining the findings from both tests, factor analyses were conducted for factor solutions with no more than six factors.
The one- and two-factor solutions were rejected because the factors did not adequately address the concepts that influence participants’ willingness to consider pooled rideshare service; the concepts that influence one’s willingness to consider pooled rideshare service were simply under-represented with the one- and two-factor solutions. The five- and six-factor solutions were rejected because there were factors extracted with too few survey items in these solutions. Typically, at least three measured indicators under a factor are preferable for the statistical identification of a factor [48,49,50]. Factors with fewer than three survey items might be statistically insignificant.
When comparing the three- and four-factor solutions, the meaningful differences were that the items ‘The vehicle is cleaned/disinfected in between rides’, ‘I can ride with a person who is like me’, and ‘The other passenger is pre-screened by the rideshare service’ were isolated from the vehicle technology/accessibility factor and formed a new construct the team named passenger safety in the four-factor solution. When examining the full correlation matrix, ‘The vehicle is cleaned/disinfected in between rides’ had the highest correlation (0.67) with ‘The other passenger is pre-screened by the rideshare service’, and ‘I can ride with a person who is like me’ had the highest correlation (0.58) with ‘The other passenger is pre-screened by the rideshare service’. The strong correlations justify combining these three survey items into the stand-alone passenger safety factor. Furthermore, when these three survey items make up the unique passenger safety factor, there was a clear distinction from the convenience factor.
Therefore, the four-factor solution was determined to be the strongest solution, see Table 3. Using a four-factor solution, all survey items passed the factor loading threshold of 0.35. Field [51] recommended that the factor loadings below 0.30 should not be used and Guadagnoli and Velicer [52] suggested that factors with factor loadings above 0.40 can be considered stable. Hence, a cut-off threshold of 0.35 was used. The 23 survey items explained 64.27% of the total variance. Table 3 displays the full pattern loading matrix from the results of the rotated four-factor solution. For each survey item, a higher factor loading value indicates a higher contribution to the construct.
The four factors can be described as:
(a)
The first factor is Comfort/ease of use. Ten items were clustered under this construct which explained 26.02% of the total variance. The three items with the highest factor loadings included, ‘I can adjust the seats in the vehicle for comfort’ (0.92), ‘I can sit where I want in the vehicle’ (0.86), and ‘I can adjust the temperature in the vehicle to my liking’ (0.84).
(b)
The second factor is Convenience. Six items were included in the convenience factor and explained 18.83% of the total variance. The items with the highest factor loadings included, ‘The cost to share a ride is more affordable than other transportation’, ‘There is clear information about the ride (e.g., cost, route, time) before I book it’, and ‘I won’t be delayed by long detours’ with factors loadings of 0.89, 0.88, and 0.83 respectively.
(c)
The third factor is Vehicle technology/accessibility which included four items and explained 11.32% of the total variance. The items with the highest factor loadings were ‘The vehicle is automated and does not have a human driver’ and ‘The vehicle is a battery-electric vehicle (only runs on electricity)’ with factor loadings of 0.91, and 0.87, respectively.
(d)
The fourth factor is Passenger safety. As described above, three items were included in this factor, which explained 8.10% of the total variance. The item with the highest factor loading was ‘The other passenger is pre-screened by the rideshare service’ (0.77).

3.2.4. Reliability of the Exploratory Factor Analysis

The reliability assessment of the EFA solution was done by obtaining Cronbach’s alpha value for all four factors (see Table 3 note). Cronbach’s alpha value for comfort/ease of use was 0.93, convenience was 0.90, vehicle technology/accessibility was 0.79, and passenger safety was 0.77. All the factors had Cronbach’s alpha value greater than 0.75, indicating high reliability for the factors extracted by EFA.

3.3. Confirmatory Factor Analysis

A CFA was conducted with the remaining 20% of the data to validate the factors suggested by the EFA. For the CFA, maximum likelihood estimation method was used. The CFA results suggested a measurement model based on the pattern matrix, shown in Figure 2. A series of goodness-of-fit metrics were calculated to evaluate the measurement model. The model fit yielded χ2(224) = 4179.27, p < 0.0001. The Root Mean Square Error of Approximation of the model fit was 0.064, which fell between 0.05 and 0.08 and indicated a reasonable approximate fit. Both the Comparative Fit Index and Tucker–Lewis Index of the model fit were above the recommended cut-off value of 0.90, with 0.933 and 0.925, respectively. The goodness-of-fit index was measured at 0.905, which was also above the generally accepted 0.90 cut-off value. With suggestions from multiple metrics, it was concluded that the CFA results supported the four-factor structure.

3.4. Binomial Logistic Regression Model

Because the total sample (N = 5385) can be grouped separately by participants who would-consider-PR and would-not-consider-PR, a binomial logistic regression was conducted using the scores on the four factors as predictors. The Pearson correlations among all four predictors and the willingness to consider PR are reported in Table 4. The initial inspection of the correlations revealed that the passenger safety factor was least correlated with willingness to consider PR (0.28). Vehicle technology/accessibility had the highest correlation with the willingness to consider PR (0.40), followed by comfort/ease of use (0.32) and convenience (0.31).
The regression model was statistically significant (χ2 (4) = 1151.56, p < 0.0005), with a correct classification rate of 69.6% cases. Based on Wald tests, each factor was a statistically significant predictor of willingness to consider PR (see Table 5). The convenience and vehicle technology/accessibility factors were positively related to willingness to consider pooled ridesharing. These two factors had the largest effect on the willingness to consider pooled ridesharing, with vehicle technology/accessibility as the most important. The comfort/ease of use and passenger safety factors were negatively related to willingness to consider pooled ridesharing. These two factors had relatively small effects on the willingness to consider pooled ridesharing, with comfort/ease of use having the smallest effect.

4. Discussion

This study examined 23 survey items that were related to user-centered vehicle design and ridesharing services. The factor structure of these items was investigated using a nationally representative sample of over 5000 respondents. Factor analysis suggested a four-factor solution. We used the four factors (i.e., latent variables) to predict willingness to consider using pooled ridesharing. In contrast to the four factors, the original survey design contained only three categories: the mode category with 7 items, HMI category with 10 items, and route category with 6 items. All of the 23 survey items were retained after factor analyses. Based on a CFA, all item loadings were relatively high (>0.6), and the item groupings remained largely intact. This suggests the efficient process followed in the survey design. The HMI category in the original list was renamed entirely as the comfort/ease of use factor. Similarly, the route category in the original list was renamed as the convenience factor. The mode category in the original list containing seven items was split into two factors, vehicle technology/accessibility and passenger safety. The vehicle technology/accessibility consists of four items and the passenger safety consists of three items. These four factors grouped with loadings give an insight into the relevance of correlation between the items and the importance of factor analysis, which helps to predict willingness to consider pooled ridesharing more accurately.
Comfort/ease of use consisted of 10 survey items that accounted for 26.02% of the total variance. Comfort exhibited a substantial influence on the willingness to consider pooled ridesharing. Survey items related to comfort: ‘I can adjust the seats in the vehicle for comfort’, ‘I can sit where I want in the vehicle’, and ‘I can adjust the temperature in the vehicle to my liking’ received the highest factor loadings. Survey item ‘There is sufficient storage in the vehicle for all my belongings’ related to comfort received high proportions of participants, with 79.1% choosing either ‘Agree’ or ‘Strongly agree’ for willingness to utilize pooled ridesharing. Comfort is the state of ease or well-being of a rider during the commute. Comfort is perceived based on several measures such as feeling if it is safe to ride, traveling in poor weather conditions, reliability, travel time, and ability to carry things on the ride. A previous study found that comfort was significant when selecting the transportation mode [11]. It could be uncomfortable to share a ride if the desired seat location is occupied or if the rider has to sit in the middle seat or have little to no privacy [26]. Survey items related to ease of use were also on the list with considerable influence on the willingness to consider pooled ridesharing. Survey item ‘Rideshare service app is easy to use’ related to ease of use received high proportions of participants, with 78.9% choosing either ‘Agree’ or ‘Strongly agree’ for willingness to utilize pooled ridesharing. Perceived ease of use is based on the benefits of the service and the effort required to use the service. An assessment of the mobile apps shows that the service app’s ease of use can influence the rider’s behavior and intention to use rideshare services [53]. The perceived ease of use directly correlates with the adoption of new technologies or services [54]. Pettigrew et al. [55] suggested that a specific segment of the population will be early adopters of shared autonomous vehicles based on technology acceptance theories [56].
The Convenience factor consisted of six survey items that accounted for 18.83% of the total variance. A convenient ride is a ride in which the vehicle taken is suitable to the needs or purpose of the commute. Convenience is perceived based on several measures, such as the ability to run errands on the way to/from their daily commute, privacy, availability when needed, cost, and travel time. ‘The cost to share a ride is more affordable than other transportation’, ‘There is clear information about the ride (e.g., cost, route, time) before I book it’, and ‘I won’t be delayed by long detours’ had the highest factor loadings and the latter two items received the highest response among participants, with 84% and 81.5, respectively, choosing either ‘Agree’ or ‘Strongly agree’ for willingness to utilize pooled ridesharing. Trip costs should be lower compared to other transportation options to consider use of pooled ridesharing [57]. Travelers who use public transportation perceive that during their commute, the accessibility and long waiting times in their transport is more inconvenient than the time spent inside their transport [11]. The rideshare service has the potential to reduce the inconvenience of accessibility and long waiting time. In the rideshare, the riders spend most of their travel time inside the vehicle so they can use their time more efficiently. Several studies have shown rideshare services can be more convenient than public transport with a similar fee or marginal increase [17,25,58,59,60]. However, Morris et al. [23] argued that travelers would not switch from their current transportation to ridesharing unless there were substantial convenience benefits. The availability of the ridesharing service all the time is an important measure of convenience for acceptance [16,17,59]. Some respondents felt that the rideshare vehicle took too long to pick up other riders, and there was uncertainty about the length of the ride [17]. Transparency in the travel route and effective communication with the riders may improve rider’s perception of their own safety [25,26].
The vehicle technology/accessibility factor consisted of four survey items that accounted for 11.32% of the total variance. Survey items related to vehicle technology, i.e., ‘The vehicle is automated and does not have a human driver’ and ‘The vehicle is a battery-electric vehicle (only runs on electricity)’, received the highest factor loadings. Interestingly, these two items received the lowest proportions of participants response, with 35.1% and 44.9% only, identifying them as ‘Agree’ or ‘Strongly agree’. This inconsistency shows the rider may not perceive these items as essential as the other 23 survey items. However, Gluck et al. [26] predicted that shared autonomous vehicles can provide a more convenient method of transportation for vulnerable populations. This suggests the need for customized features for those riders who can benefit from them, including the aging population and/or individuals with disabilities. This was also reflected in our study, through the survey item ‘The vehicle is accessible for passengers with disabilities’, where 62.2% rated the topic as ‘Agree’ or ‘Strongly agree’ for willingness to utilize pooled ridesharing. Morris et al.’s [23] research showed that environmental consciousness does not play a significant role in pooled rideshare participation. This complements in our survey item ‘The vehicle is a battery-electric vehicle (only runs on electricity)’. Michalak et al. [16] found that pollution reduction was not sufficient for ridesharing participation; rather, the service has to be reliable and satisfactory. As recommended in the previous studies [10,32], a subscription service may significantly impact greater rideshare usage, which was reflected in our survey item ‘A subscription service is available (i.e., fixed monthly cost for unlimited rides)’, with 62.2% rated as ‘Agree’ or ‘Strongly agree’ in importance when considering pooled ridesharing.
The passenger safety factor consisted of three survey items that accounted for 8.10% of the total variance. Safety can significantly influence people’s willingness to consider pooled ridesharing. Survey items related to safety: ‘The other passenger is pre-screened by the rideshare service’ (76.4%) and ‘The vehicle is cleaned/disinfected in between rides’ (82.1%) received the highest factor loadings. In total, 82.1% of participants ‘Agree’ or ‘Strongly agree’ with ‘The vehicle is cleaned/disinfected in between rides’ for willingness to utilize pooled ridesharing, which was the participants’ highest response. As the vehicle is used to commute by several different passengers in a day, there are hygiene and cleanliness issues which must be addressed to provide safe transportation. The safe, clean environment during the ride has become even more important and timely due to the COVID-19 pandemic. The rideshare service companies had an enormous negative impact as a result of the COVID-19 pandemic. Uber earned USD 11.1 billion in revenue in 2020, a 21% decrease compared to the previous year [61]. The US’s Occupational Safety and Health Administration (OSHA) provided COVID-19 guidance for rideshare service companies [62]. The guidelines include service companies’ need to ensure vehicle door handles and interior surfaces are routinely cleaned and disinfected, provide drivers with disinfectants and cleaning supplies, and ensure policies encourage drivers to report any safety and/or health concerns. Therefore, for sustained rideshare service growth, companies need to ensure a safe and clean environment during the ride.
Riders expect the service providers to screen the passengers and match them with passengers of similar profiles [13,15,16,17]. This was reflected in our survey item ‘I can ride with a person who is like me’, with 65.7% of participants responding with ‘Agree’ or ‘Strongly agree’ for willingness to utilize pooled ridesharing.
Transportation network companies (TNCs) are trying to ensure that the rider’s safety is of the utmost priority. Due to several incidents of safety hazards while using ridesharing services, there is a demand from the U.S. public and legislators for the TNCs to enhance the safety for their riders [63]. Personal safety is the most important factor that can cause the riders to distrust the rideshare service [24]. There were safety concerns for the riders of Uber and Lyft, mainly due to individuals posing as drivers or the driver of these companies [63]. Criminals pose as drivers/passengers to take advantage of riders. WhatsMyName Foundation [64], which advertises to improve rideshare safety, has highlighted some of the past incidents, for example: “in March 2019, a female college student was found dead after mistakenly boarding a vehicle, assuming it was an Uber vehicle. In Las Vegas, NV, a woman jumped out of a moving vehicle to escape a fake and threatening driver. In Tuscaloosa, AL, a fake driver took photos of an unconscious woman rider. In Chicago, IL, another fake driver deceived riders for financial gain by saying something went wrong with payments and requesting credit cards during the ride”.
A rider’s safety concern can be attributed to physical assault from other riders, getting sick due to sharing the ride, compromised rider privacy, etc. The variety of concerns highlight the importance of the survey items of this study and its four factors that were focused on user-centered design of the vehicle and services. TNCs have the responsibility to ensure safer and reliable transportation for the rideshare sustained future. Mims et al. [65] completed a comprehensive analysis on passenger discomfort in a vehicle before the COVID-19 pandemic. Some of the important reasons for passenger discomfort were driver distraction, uncleanliness, and smells or odors, specifically cigarettes and body odor. After the COVID-19 pandemic, it became more apparent that TNCs have to prioritize maintaining the vehicle germ free, privacy, and no health hazard caused due to sharing the ride with other passengers and driver. TNCs should ensure the passengers and the driver follow the cleanliness guidelines, good social behavior, and adherence to the rules [10,22]. Mims et al. [65] suggested that cleanliness, odor-free environments, airflow, and ideal temperatures does influence passenger comfort in the vehicle. Therefore, to increase the user acceptance of pooled ridesharing, there is a great opportunity to improve the vehicle interiors and the rideshare service.
The objective of the national study was to determine the main items/factors impacting willingness to consider PR. After exploring the factors using factor analyses, a binomial logistic regression was conducted to determine the four factors that influence willingness to consider pooled ridesharing. The comfort/ease of use factor had lower statistical significance among the would-consider-PR and would-not-consider-PR groups compared to the other three factors. For every unit increase in the comfort/ease of use factor score, there was a 16.0% decreased willingness to consider pooled ridesharing. This indicates that while comfort/ease of use plays a role in an individual’s willingness to consider pooled ridesharing, there are higher priority factors to address for widescale adoption. The passenger safety factor was statistically significant between the would-consider-PR and would-not-consider-PR group. For every unit increase in the passenger safety factor score, there was a 46.8% decreased willingness to consider pooled ridesharing. This indicates that the safety attributes are concerns for those unwilling to consider pooled ridesharing. The convenience factor highlights the difference between the would-consider-PR and would-not-consider-PR group. For every unit increase in the convenience factor score, there was a 156.2% increased willingness to consider pooled ridesharing. Transparent communication to the rider and reliable ride services influences the willingness to share a ride. The vehicle technology/accessibility factor has the highest difference between the would-consider-PR and would-not-consider-PR groups. For every unit increase in the vehicle technology/accessibility factor score, there was a 201.6% increased willingness to consider pooled ridesharing. For the would-consider-PR participants, the monthly subscription services and the accessibility needs for disabilities positively influence an individual to accept a ride.
It is essential to understand that comfort/ease of use and passenger safety factors are important for individuals when considering any form of transportation. However, in a pooled rideshare context, where riders may share the same vehicle space with unknown individuals, comfort and safety are perceived differently. For example, the comfort/ease of use factor incorporates survey items such as ‘I can adjust the seats in the vehicle for comfort’, ‘I can sit where I want in the vehicle’, and ‘I can adjust the temperature in the vehicle to my liking’. While these items contribute to comfort in a traditional, private vehicle setting, they may not be as easily achievable in a pooled rideshare environment. Riders may have to compromise on their preferred seating position in the vehicle, personal space, and/or ideal temperature due to the presence of other passengers. Consequently, individuals who highly value these comfort aspects may be less willing to consider pooled ridesharing, leading to a negative relationship in the model.
Similarly, the negative relationship with the passenger safety factor can be linked to the unique characteristics of pooled ridesharing. While pre-screening of other passengers and cleanliness between rides are perceived as essential safety measures, they might not be sufficient for some potential users. Riders may still be uncomfortable sharing a vehicle with people they do not know, leading to perceptions of reduced personal safety. Additionally, the possibility of being matched with passengers of different profiles than themselves could further exacerbate these safety concerns. Thus, those who have concerns about passenger safety demonstrate a lower willingness to consider pooled ridesharing, thereby contributing to the negative relationship observed in the model.
The inverse relationship with both the comfort/ease of use and passenger safety factors and the willingness to consider PR reflects the critical barriers that service providers must overcome to dramatically increase pooled rideshare usage. This obstacle underscores the challenges of meeting individual preferences and ensuring personal safety in a shared space, highlighting barriers that require further research and consideration by rideshare service providers. Future studies should seek to develop innovative solutions that can cater to individual comfort and safety preferences within a pooled setting, to increase the acceptance of pooled rideshare services and promote wider adoption.

5. Conclusions

This study explored opinions about the user experience design and preferences to address human factor barriers to user acceptance of pooled ridesharing. The questionnaire was deployed nationwide, and responses were collected from 5385 participants. The data were resampled into two datasets for EFA model fitting and CFA validation, respectively. An EFA was conducted to explore factors that focused on user-centered vehicle design and ridesharing services that influenced the willingness to consider pooled ridesharing. Then, using the holdout sample, the CFA was performed to establish the measurement model describing the relationships between factors and survey items. Four factors were extracted after the factor analyses, and all 23 survey items were retained. The factors were named comfort/ease of use, explaining 26.02% of the total variance; convenience, explaining 18.83% of the total variance; vehicle technology/accessibility, explaining 11.32% of the total variance; and passenger safety, explaining 8.10% of the total variance. Determining the four factors influencing willingness to consider pooled ridesharing (PR) using binomial logistic regression suggests that convenience and vehicle technology/accessibility factors have a positive impact. Vehicle technology/accessibility had the highest difference between the would-consider-PR and would-not-consider-PR groups, with 201.6% increased willingness to consider PR, followed by convenience, with 156.2% increased willingness to consider PR. Comfort/ease of use and passenger safety factors were the concerns for sharing a ride. Passenger safety had the highest negative difference between the would-consider-PR and would-not-consider-PR groups, with 46.8% decreased willingness to consider PR, followed by comfort/ease of use, with 16% decreased willingness to consider PR.

6. Future Research

This study examined a subset of a larger survey, specifically Section 4: Optimizing rideshare experience. Future research will explore the potential riders who would/would not consider pooled ridesharing (PR), previous rideshare experiences, as well as preferences of different demographics, socioeconomic backgrounds, and preferences from different geographical locations. An integrated analysis of all of this information can then be used to provide a more comprehensive understanding of the considerations, preferences, and needs of rideshare users, in order to develop a comprehensive model to predict user acceptance of pooled ridesharing.

Author Contributions

Conceptualization, Y.J. and J.O.B.; methodology, J.O.B., R.G., H.S., L.B., K.K. and Y.J.; software, R.G., H.S., E.B.R. and L.B.; validation, J.O.B., P.J.R. and L.B.; formal analysis, Y.J.; investigation, R.G., J.O.B., H.S., P.J.R. and E.B.R.; resources, J.O.B., R.G., H.S., L.B., K.K. and Y.J.; data curation, R.G. and H.S.; writing—original draft preparation, R.G.; writing—review and editing, R.G., J.O.B. and H.S.; visualization, R.G. and H.S.; supervision, J.O.B.; project administration, Y.J.; funding acquisition, Y.J. All authors have read and agreed to the published version of the manuscript.

Funding

This research was funded by the U.S. Department of Energy, grant number DE-EE0009205.

Institutional Review Board Statement

The study was conducted in accordance with the Declaration of Helsinki and approved by the Institutional Review Board (or Ethics Committee) of Clemson University (protocol code IRB2020-412 and date of approval 8 February 2021).

Informed Consent Statement

Informed consent was obtained from all subjects involved in the study.

Data Availability Statement

Data available on request due to restrictions, e.g., privacy or ethical.

Acknowledgments

The authors appreciate the contributions of Casey Jenkins, Lauren Mims, Sarathkrishna, and Timothy Jenkins for their assistance primarily with piloting, participant recruitment in the upstate of South Carolina and data organization. The authors are also grateful to Krishna Murthy Gurumurthy and Joshua Auld from Argonne National Laboratory for their feedback and suggestions throughout the survey design process.

Conflicts of Interest

The authors declare no conflict of interest.

References

  1. SAE. Shared Mobility. 2017. Available online: https://www.sae.org/shared-mobility/ (accessed on 18 November 2020).
  2. Uber. Annual Report. 2019. Available online: https://s23.q4cdn.com/407969754/files/doc_financials/2019/ar/Uber-Technologies-Inc-2019-Annual-Report.pdf (accessed on 5 October 2021).
  3. Uber Statistics. 2021. Available online: https://expandedramblings.com/index.php/uber-statistics/ (accessed on 7 August 2021).
  4. Levosky, A.; Greenberg, A. Organized Dynamic Ride Sharing: The Potential Environment Benefits and the Opportunity for Advancing the Concept. Environ. Prot. 2001, 1, 1–15. [Google Scholar]
  5. Siddiqi, Z.; Buliung, R. Dynamic ridesharing and information and communications technology: Past, present and future prospects. Transp. Plan. Technol. 2013, 36, 479–498. [Google Scholar] [CrossRef]
  6. Uber Navigation. 2019. Available online: https://www.cnbc.com/2019/04/11/uber-paid-google-58-million-over-three-years-for-map-services.html (accessed on 7 July 2021).
  7. Lyft Navigation. 2019. Available online: https://help.lyft.com/hc/ko/articles/115012926407-How-to-change-navigation-settings (accessed on 7 July 2021).
  8. Salomon, I. Telecommunications and travel relationships: A review. Transp. Res. Part A Gen. 1986, 20, 223–238. [Google Scholar] [CrossRef]
  9. Srinivasan, K.; Raghavender, P. Impact of Mobile Phones on Travel: Empirical Analysis of Activity Chaining, Ridesharing, and Virtual Shopping. Transp. Res. Rec. J. Transp. Res. Board 2006, 1977, 258–267. [Google Scholar] [CrossRef]
  10. Tao, C.; Wu, C. Behavioral Responses to Dynamic Ridesharing Services. Area 2008, 2, 1576–1581. [Google Scholar]
  11. Malokin, A.; Circella, G.; Mokhtarian, P.L. How do activities conducted while commuting influence mode choice? Using revealed preference models to inform public transportation advantage and autonomous vehicle scenarios. Transp. Res. Part A Policy Pract. 2019, 124, 82–114. [Google Scholar] [CrossRef]
  12. Krueger, R.; Rashidi, T.H.; Rose, J.M. Preferences for shared autonomous vehicles. Transp. Res. Part C Emerg. Technol. 2016, 69, 343–355. [Google Scholar] [CrossRef]
  13. Gurumurthy, K.M.; Kockelman, K.M. Modeling Americans’ autonomous vehicle preferences: A focus on dynamic ride-sharing, privacy & long-distance mode choices. Technol. Forecast. Soc. Chang. 2020, 150, 119792. [Google Scholar] [CrossRef]
  14. Gangadharaiah, R.; Mims, L.; Jia, Y.; Brooks, J. Opinions from Users Across the Lifespan about Fully Autonomous and Rideshare Vehicles with Associated Features; SAE Technical Paper 2023-01-0673; SAE: Tokyo, Japan, 2023. [Google Scholar] [CrossRef]
  15. Amirkiaee, S.Y.; Evangelopoulos, N. Why do people rideshare? An experimental study. Transp. Res. Part F Traffic Psychol. Behav. 2018, 55, 9–24. [Google Scholar] [CrossRef]
  16. Michalak, S.; Spyridakis, J.; Haselkorn, M.; Goble, B.; Blumenthal, C. Assessing users’ needs for dynamic ridesharing. Transp. Res. Rec. 1994, 1459, 32–38. [Google Scholar]
  17. Sarriera, J.M.; Escovar Álvarez, G.; Blynn, K.; Alesbury, A.; Scully, T.; Zhao, J. To share or not to share: Investigating the social aspects of dynamic ridesharing. Transp. Res. Rec. 2017, 2605, 109–117. [Google Scholar] [CrossRef]
  18. McFarland, M. Uber Eyes Facebook Data to Help You Befriend Riders. 2017. Available online: https://money.cnn.com/2017/02/02/technology/uber-patent-application/index.html (accessed on 22 April 2021).
  19. Gilbertsen, C. Uber Wants to Use Your Facebook Data to Improve UberPool. Available online: https://www.thedrive.com/news/7312/uber-want-to-use-your-facebook-data-to-improve-uberpool (accessed on 25 April 2021).
  20. Hughes, M. Ugh, Uber Wants You to Bond with Your Fellow UberPOOL Passengers. 2017. Available online: https://thenextweb.com/news/ugh-uber-wants-bond-fellow-uberpool-passengers (accessed on 29 April 2021).
  21. Chan, N.D.; Shaheen, S.A. Ridesharing in North America: Past, Present, and Future. Transp. Rev. 2012, 32, 93–112. [Google Scholar] [CrossRef]
  22. Pratt, A.N.; Morris, E.A.; Zhou, Y.; Khan, S.; Chowdhury, M. What do riders tweet about the people that they meet? Analyzing online commentary about UberPool and Lyft Shared/Lyft Line. Transp. Res. Part F Traffic Psychol. Behav. 2019, 62, 459–472. [Google Scholar] [CrossRef]
  23. Morris, E.A.; Pratt, A.N.; Zhou, Y.; Brown, A.; Khan, S.M.; Derochers, J.L.; Campbell, H.; Chowdhury, M. Assessing the Experience of Providers and Users of Transportation Network Company Ridesharing Services; Clemson University: Clemson, SC, USA, 2019; p. 156. [Google Scholar] [CrossRef]
  24. Ma, L.; Zhang, X.; Ding, X.; Wang, G. Risk perception and intention to discontinue use of ride-hailing services in China: Taking the example of DiDi Chuxing. Res. Part F Traffic Psychol. Behav. 2019, 66, 459–470. [Google Scholar] [CrossRef]
  25. Spurlock, C.A.; Sears, J.; Wong-Parodi, G.; Walker, V.; Jin, L.; Taylor, M.; Duvall, A.; Gopal, A.; Todd, A. Describing the users: Understanding adoption of and interest in shared, electrified, and automated transportation in the San Francisco Bay Area. Transp. Res. D Transp. Environ. 2019, 71, 283–301. [Google Scholar] [CrossRef]
  26. Gluck, A.; Boateng, K.; Huff, E.W., Jr.; Brinkley, J. Putting Older Adults in the Driver Seat: Using User Enactment to Explore the Design of a Shared Autonomous Vehicle. In Proceedings of the 12th International Conference on Automotive User Interfaces and Interactive Vehicular Applications, Virtual Event, 21–22 September 2020; pp. 291–300. [Google Scholar] [CrossRef]
  27. HopSkipDrive. 2015. Available online: https://www.hopskipdrive.com/ (accessed on 12 February 2021).
  28. Kango. 2012. Available online: https://www.kangoapp.co/ (accessed on 12 February 2021).
  29. Lift Hero. 2013. Available online: https://www.crunchbase.com/organization/lift-hero (accessed on 12 February 2021).
  30. Uber WAV. 2015. Available online: https://www.uber.com/us/en/ride/uberwav/ (accessed on 13 February 2021).
  31. Lyft WAV. 2015. Available online: https://help.lyft.com/hc/en-us/articles/115013081668-Accessible-vehicle-dispatch (accessed on 13 February 2021).
  32. Maghraoui, O.A.; Vosooghi, R.; Mourad, A.; Kamel, J.; Puchinger, J.; Vallet, F.; Yannou, B. Shared Autonomous Vehicle Services and User Taste Variations: Survey and Model Applications. Transp. Res. Procedia 2020, 47, 3–10. [Google Scholar] [CrossRef]
  33. Hayton, J.C.; Allen, D.G.; Scarpello, V. Factor Retention Decisions in Exploratory Factor Analysis: A Tutorial on Parallel Analysis. Organ. Res. Methods 2004, 7, 191–205. [Google Scholar] [CrossRef]
  34. Bartlett, M.S. A Note on the Multiplying Factors for Various $χ$2 Approximations. J. R. Stat. Soc. Ser. B Methodol. 1954, 16, 296–298. [Google Scholar] [CrossRef]
  35. Kaiser, H.F. An index of factorial simplicity. Psychometrika 1974, 39, 31–36. [Google Scholar] [CrossRef]
  36. Rencher, A.C.; Christensen, W.F. Methods of Multivariate Analysis; John Wiley & Sons, Inc.: Hoboken, NJ, USA, 2012; ISBN 978-1-11-839168-6. [Google Scholar] [CrossRef]
  37. Kaiser, H.F. The Application of Electronic Computers to Factor Analysis. Educ. Psychol. Meas. 1960, 20, 141–151. [Google Scholar] [CrossRef]
  38. Horn, J.L. A rationale and test for the number of factors in factor analysis. Psychometrika 1965, 30, 179–185. [Google Scholar] [CrossRef] [PubMed]
  39. Hendrickson, A.E.; White, P.O. Promax: A quick method for rotation to oblique simple structure. Br. J. Stat. Psychol. 1964, 17, 65–70. [Google Scholar] [CrossRef]
  40. R Core Team. R: A Language and Environment for Statistical Computing; R Core Team: Vienna, Austria, 2022. [Google Scholar]
  41. Revelle, W.R. Psych: Procedures for Personality and Psychological Research; Northwestern University Press: Evanston, IL, USA, 2017. [Google Scholar]
  42. Rosseel, Y. lavaan: AnRPackage for Structural Equation Modeling. J. Stat. Softw. 2012, 48, 1–36. [Google Scholar] [CrossRef]
  43. Brown, T.A.; Moore, M.T. Confirmatory factor analysis. In Handbook of Structural Equation Modeling; The Guilford Press: New York, NY, USA, 2012; pp. 361–379. ISBN 978-1-60623-077-0 (Hardcover). 978-1-4625-0447-3 (PDF). [Google Scholar]
  44. James, G.; Hastie, T.; Tibshirani, R.; Witten, D. An Introduction to Statistical Learning: With Applications in R; Springer: New York, NY, USA, 2013. [Google Scholar]
  45. Domínguez-Almendros, S.; Benítez-Parejo, N.; Gonzalez-Ramirez, A.R. Logistic regression models. Allergol. Immunopathol. 2011, 39, 295–305. [Google Scholar] [CrossRef]
  46. Holgado-Tello, F.P.; Chacón-Moscoso, S.; Barbero-García, I.; Vila-Abad, E. Polychoric versus Pearson correlations in exploratory and confirmatory factor analysis of ordinal variables. Qual. Quant. 2008, 44, 153–166. [Google Scholar] [CrossRef]
  47. Ledesma, R.D.; Ferrando, P.J.; Trógolo, M.A.; Poó, F.M.; Tosi, J.D.; Castro, C. Exploratory factor analysis in transportation research: Current practices and recommendations. Transp. Res. Part F Traffic Psychol. Behav. 2021, 78, 340–352. [Google Scholar] [CrossRef]
  48. Child, D. The Essentials of Factor Analysis; A&C Black: Edinburgh, UK, 2006; p. 180. [Google Scholar]
  49. Fabrigar, L.R.; Wegener, D.T. Exploratory Factor Analysis; Oxford University Press: New York, NY, USA; Oxford, UK, 2012; p. 159. [Google Scholar]
  50. Izquierdo, I.; Olea, J.; Abad, F.J. Exploratory factor analysis in validation studies: Uses and recommendations. Psicothema 2014, 26, 395–400. [Google Scholar] [CrossRef]
  51. Field, A. Discovering Statistics Using IBM SPSS Statistics; SAGE Publications, Inc.: Thousand Oaks, CA, USA, 2013. [Google Scholar]
  52. Guadagnoli, E.; Velicer, W.F. Relation of Sample Size to the Stability of Component Patterns. Psychol. Bull. 1988, 103, 265–275. [Google Scholar] [CrossRef]
  53. Lo, F.Y.; Yu, T.H.K.; Chen, H.H. Purchasing intention and behavior in the sharing economy: Mediating effects of APP assessments. J. Bus. Res. 2020, 121, 93–102. [Google Scholar] [CrossRef]
  54. Abraham, H.; Lee, C.; Brady, S.; Fitzgerald, C.; Mehler, B.; Reimer, B.; Coughlin, J. Autonomous Vehicles and Alternatives to Driving: Trust, Preferences, and Effects of Age. In Proceedings of the Transportation Research Board 96th Annual Meeting, Washington, DC, USA, 8–12 January 2017. [Google Scholar]
  55. Pettigrew, S.; Dana, L.M.; Norman, R. Clusters of potential autonomous vehicles users according to propensity to use individual versus shared vehicles. Transp. Policy 2019, 76, 13–20. [Google Scholar] [CrossRef]
  56. Venkatesh, V.; Davis, F.D. Theoretical extension of the Technology Acceptance Model: Four longitudinal field studies. Manag. Sci. 2000, 46, 186–204. [Google Scholar] [CrossRef]
  57. Wang, Z.; Chen, X.; Chen, X.M. Ridesplitting is shaping young people’s travel behavior: Evidence from comparative survey via ride-sourcing platform. Transp. Res. D Transp. Environ. 2019, 75, 57–71. [Google Scholar] [CrossRef]
  58. Contreras, S.D.; Paz, A. The effects of ride-hailing companies on the taxicab industry in Las Vegas, Nevada. Transp. Res. Part A Policy Pract. 2018, 115, 63–70. [Google Scholar] [CrossRef]
  59. Moody, J.; Middleton, S.; Zhao, J. Rider-to-rider discriminatory attitudes and ridesharing behavior. Transp. Res. Part F Traffic Psychol. Behav. 2019, 62, 258–273. [Google Scholar] [CrossRef]
  60. Shaheen, S.; Cohen, A.; Farrar, E. Mobility on Demand; IGI Global: Hershey, PA, USA, 2020; ISBN 1700000152. [Google Scholar] [CrossRef]
  61. Uber Revenue and Usage Statistics. 2022. Available online: https://www.businessofapps.com/data/uber-statistics/ (accessed on 22 January 2022).
  62. OSHA. OSHA COVID-19 Guidance; OSHA: Washington, DC, USA, 2021. [Google Scholar]
  63. H.R.4686-116th Congress (2019–2020): Sami’s Law. Available online: https://www.congress.gov/bill/116th-congress/house-bill/4686,2020 (accessed on 19 September 2021).
  64. WhatsMyName Foundation. WhatsMyName Foundation. 2019. Available online: https://www.whatsmyname.org/ (accessed on 20 September 2021).
  65. Mims, L.K.; Gangadharaiah, R.; Brooks, J.; Su, H.; Jia, Y.; Jacobs, J.; Mensch, S. What Makes Passengers Uncomfortable In Vehicles Today? An Exploratory Study of Current Factors that May Influence Acceptance of Future Autonomous Vehicles; SAE Technical Paper 2023-01-0675; SAE: Tokyo, Japan, 2023. [Google Scholar] [CrossRef]
Figure 1. Summary of the responses to the survey items from the total sample (N = 5385).
Safety 09 00036 g001
Figure 2. Measurement model obtained from the CFA.
Safety 09 00036 g002
Table 1. Original category and survey items from optimizing rideshare experience (Section 4).
Original CategoryCategory StatementSurvey ItemItem Name
ModeThinking about certain aspects of the vehicle or other riders using the rideshare service, please state how much you agree or disagree with the following statements: I would be more likely to choose a pooled rideshare if…The vehicle is automated and does not have a
human driver
Mode_VehAutomated
ModeThe vehicle is a battery-electric vehicle (only runs on electricity)Mode_VehElectric
ModeThe vehicle is cleaned/disinfected in between ridesMode_VehCleaned
ModeThe vehicle is accessible for passengers with
disabilities
Mode_DisabilityAccess
ModeI can ride with a person who is like me Mode_Co-riderLikeMe
ModeThe other passenger is pre-screened by the rideshare serviceMode_Prescreen
ModeA subscription service is available (i.e., fixed monthly cost for unlimited rides)Mode_Subscription
HMIConsidering how you might interact with the rideshare vehicle or service, please state how much you agree or disagree with the following statements: I would be more likely to choose a pooled rideshare if…The rideshare service app is easy to useHMI_AppEaseOfUse
HMII can adjust the temperature in the vehicle to my
liking
HMI_Temperature
HMII can see a profile of the other passengerHMI_SeeProfile
HMII can adjust the seats in the vehicle for comfortHMI_AdjustSeat
HMIThe vehicle design creates private spacesHMI_PrivateSpace
HMII can call to request a ride instead of using the appHMI_CallToRequest
HMIThere is sufficient storage in the vehicle for all my belongingsHMI_StorageSpace
HMII can sit where I want in the vehicle HMI_SitWhereIWant
HMIThe vehicle offers me information and
entertainment throughout the experience
HMI_Infotainment
HMII had someone to help me with the service during my first time requesting a rideHMI_SomeoneToHelp
RoutePlease state how much you agree or disagree with the following statements: I would be more likely to choose a pooled rideshare if…The cost to share a ride is more affordable than other transportationRoute_Affordable
RouteA ride is available 24/7Route_Available24/7
RouteThe other passenger is coming from or going to the same event/location as meRoute_NearbyRiders
RouteI can provide information about my trip and
location to my family and/or friends
Route_LocationShare
RouteThere is clear information about the ride (e.g., cost, route, time) before I book itRoute_RideInformation
RouteI won’t be delayed by long detoursRoute_NoDelay
Table 2. Polychoric correlation matrix of all variables.
Mode_VehAutomatedMode_VehElectricMode_VehCleanedMode_DisabilityAccessMode_Co-riderLikeMeMode_PrescreenMode_SubscriptionHMI_AppEaseOfUseHMI_TemperatureHMI_SeeProfileHMI_AdjustSeatHMI_PrivateSpaceHMI_CallToRequestHMI_StorageSpaceHMI_SitWhereIWantHMI_InfotainmentHMI_SomeoneToHelpRoute_AffordableRoute_Available24/7Route_NearbyRidersRoute_LocationShareRoute_RideInformationRoute_NoDelay
Mode_VehAutomated1.00
Mode_VehElectric0.681.00
Mode_VehCleaned0.190.381.00
Mode_DisabilityAccess0.430.540.541.00
Mode_Co-riderLikeMe0.450.510.530.551.00
Mode_Prescreen0.300.400.670.510.581.00
Mode_Subscription0.530.590.430.610.540.471.00
HMI_AppEaseOfUse0.300.400.550.490.480.530.481.00
HMI_Temperature0.400.460.510.500.550.520.500.601.00
HMI_SeeProfile0.400.440.510.480.580.600.490.570.621.00
HMI_AdjustSeat0.360.430.520.510.540.510.520.600.750.591.00
HMI_PrivateSpace0.400.460.540.500.560.560.480.580.670.640.671.00
HMI_CallToRequest0.350.420.450.510.510.430.500.520.580.530.610.561.00
HMI_StorageSpace0.300.390.550.490.510.540.470.680.670.580.700.640.581.00
HMI_SitWhereIWant0.340.420.540.490.570.520.460.630.700.610.710.680.600.671.00
HMI_Infotainment0.510.560.420.540.560.430.580.550.660.610.640.640.580.580.631.00
HMI_SomeoneToHelp0.390.460.450.550.540.480.540.570.600.570.610.580.650.590.580.631.00
Route_Affordable0.240.360.530.400.460.530.410.590.480.460.480.470.410.550.490.420.461.00
Route_Available24/70.280.380.540.480.470.530.470.600.530.490.530.520.470.600.540.480.510.661.00
Route_NearbyRiders0.300.400.520.430.540.550.430.560.510.530.510.530.480.550.530.470.510.640.611.00
Route_LocationShare0.280.380.600.500.500.570.460.570.510.550.530.530.450.550.520.500.510.610.610.611.00
Route_RideInformation0.160.310.610.410.460.580.390.630.500.480.530.500.430.590.510.400.460.730.680.650.681.00
Route_NoDelay0.170.270.570.370.420.540.340.570.480.430.490.480.400.560.500.360.420.660.640.640.620.711.00
Table 3. Standardized loadings (pattern matrix) of the 23 survey items on the four factors.
Comfort/
Ease of Use
ConvenienceVehicle Technology/
Accessibility
Passenger Safety
I can adjust the seats in the vehicle for comfort0.920.00−0.07−0.02
I can sit where I want in the vehicle0.860.01−0.120.06
I can adjust the temperature in the vehicle to my liking0.840.010.01−0.03
There is sufficient storage in the vehicle for all my belongings0.750.22−0.15−0.01
The vehicle design creates private spaces0.72−0.03−0.010.14
The vehicle offers me information and entertainment throughout the experience0.72−0.050.34−0.17
I can call to request a ride instead of using the app0.710.000.1−0.07
I had someone to help me with the service during my first time requesting a ride0.620.080.18−0.07
I can see a profile of the other passenger0.51−0.010.080.24
The rideshare service app is easy to use0.500.39−0.060.00
The cost to share a ride is more affordable than other transportation−0.080.890.09−0.06
There is clear information about the ride (e.g., cost, route, time) before I book it0.000.88−0.120.09
I won’t be delayed by long detours0.010.83−0.10.05
A ride is available 24/70.130.710.09−0.07
The other passenger is coming from or going to the same event/location as me0.070.650.140.00
I can provide information about my trip and location to my family and/or friends0.030.570.090.17
The vehicle is automated and does not have a human driver−0.03−0.040.91−0.15
The vehicle is a battery-electric vehicle (only runs on electricity)−0.100.050.870.00
A subscription service is available (i.e., fixed monthly cost for unlimited rides)0.120.050.570.10
The vehicle is accessible for passengers with disabilities0.14−0.010.390.30
The other passenger is pre-screened by the rideshare service−0.050.120.000.77
The vehicle is cleaned/disinfected in between rides0.050.18−0.130.72
I can ride with a person who is like me0.18−0.010.320.35
Note. The variance explained for the four constructs were 26.02%, 18.83%, 11.32%, and 8.10%, respectively. Cronbach’s alpha for each construct were 0.93, 0.90, 0.79, and 0.77, respectively. For each item, the highest standardized loading appears in bold font.
Table 4. Pearson correlation matrix of four factors and willingness to consider PR.
Comfort/
Ease of Use
ConvenienceVehicle Technology/
Accessibility
Passenger Safety
Convenience0.78
Vehicle technology/accessibility0.790.56
Passenger safety0.840.830.72
Willingness to consider PR0.320.310.400.28
Table 5. Binomial logistic regression result of the four factors.
BStandard ErrorWald
(χ2 (1))
Odds
Ratio
Odds Ratio
95% CI
(Lower, Upper)
Comfort/
ease of use
−0.17 *0.075.80.8400.7, 0.9
Convenience0.94 ***0.06204.22.5622.3, 2.9
Vehicle technology/
accessibility
1.10 ***0.05380.53.0162.7, 3.4
Passenger safety−0.63 ***0.0769.80.5320.5, 0.6
Note. *  p < 0.05, ***  p < 0.001.
Disclaimer/Publisher’s Note: The statements, opinions and data contained in all publications are solely those of the individual author(s) and contributor(s) and not of MDPI and/or the editor(s). MDPI and/or the editor(s) disclaim responsibility for any injury to people or property resulting from any ideas, methods, instructions or products referred to in the content.

