
Prevalence and Characteristics of Ambulance Collisions, a Systematic Literature Review


Abstract
:1. Introduction
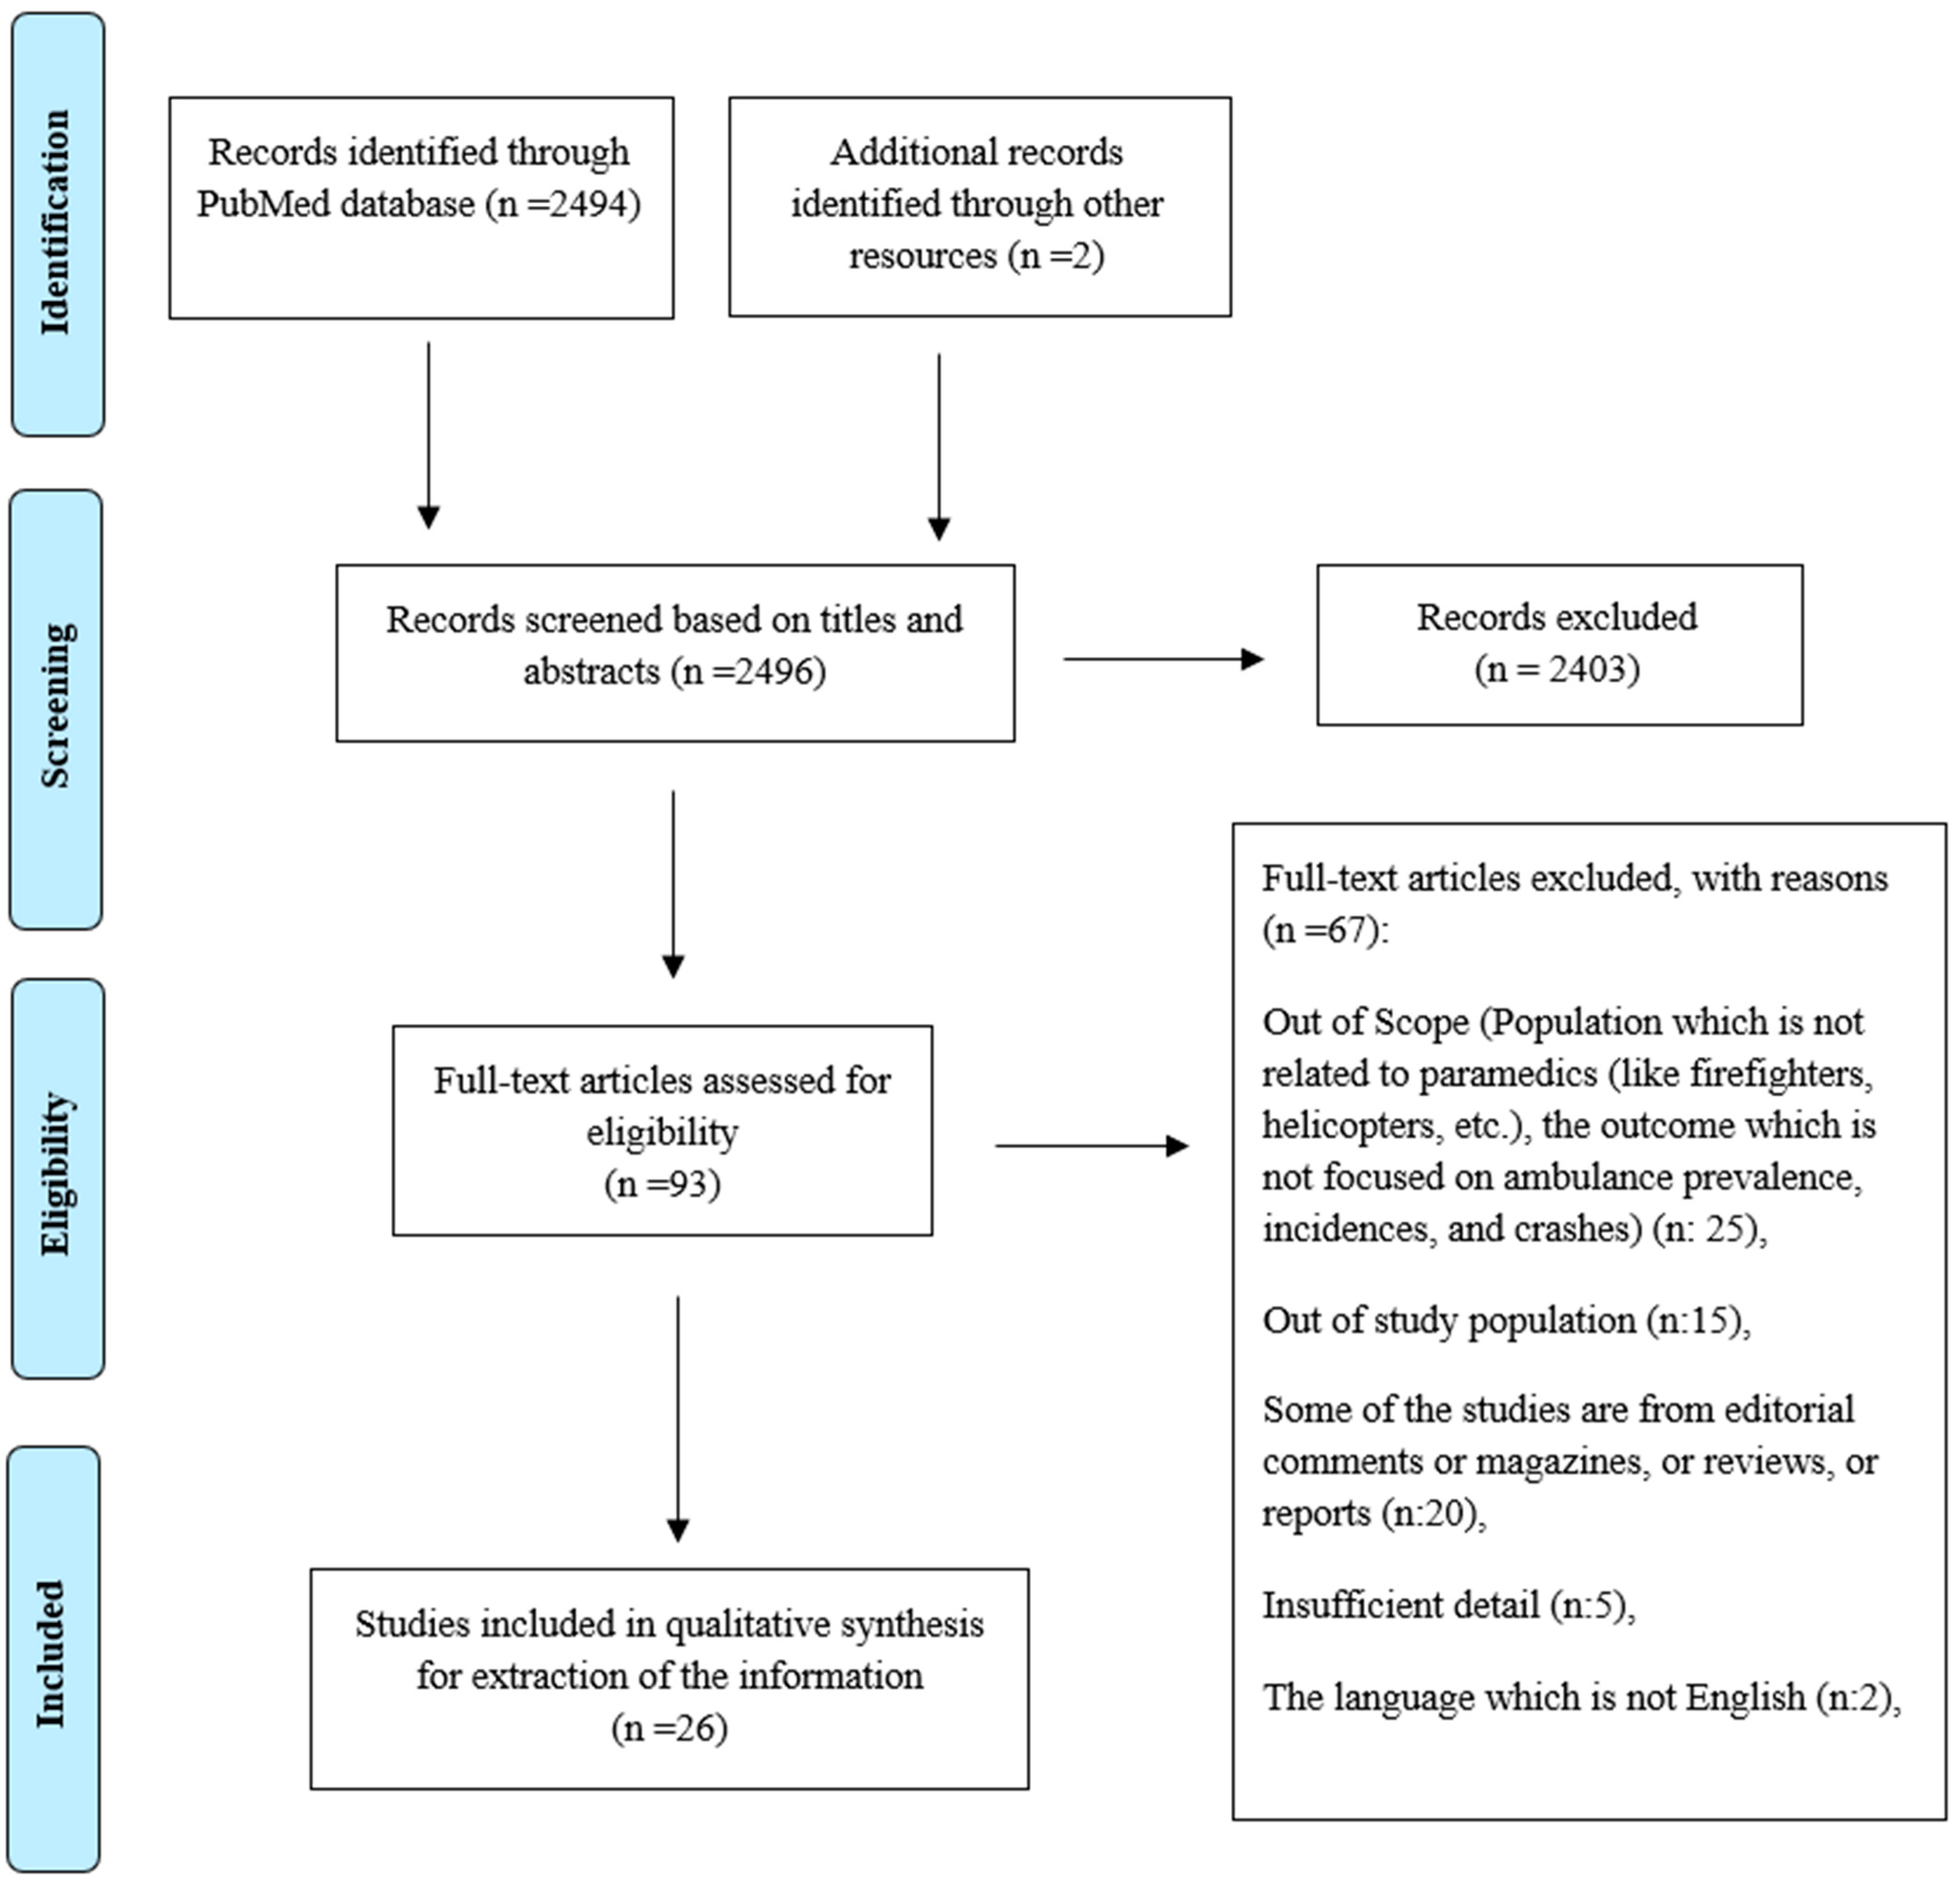
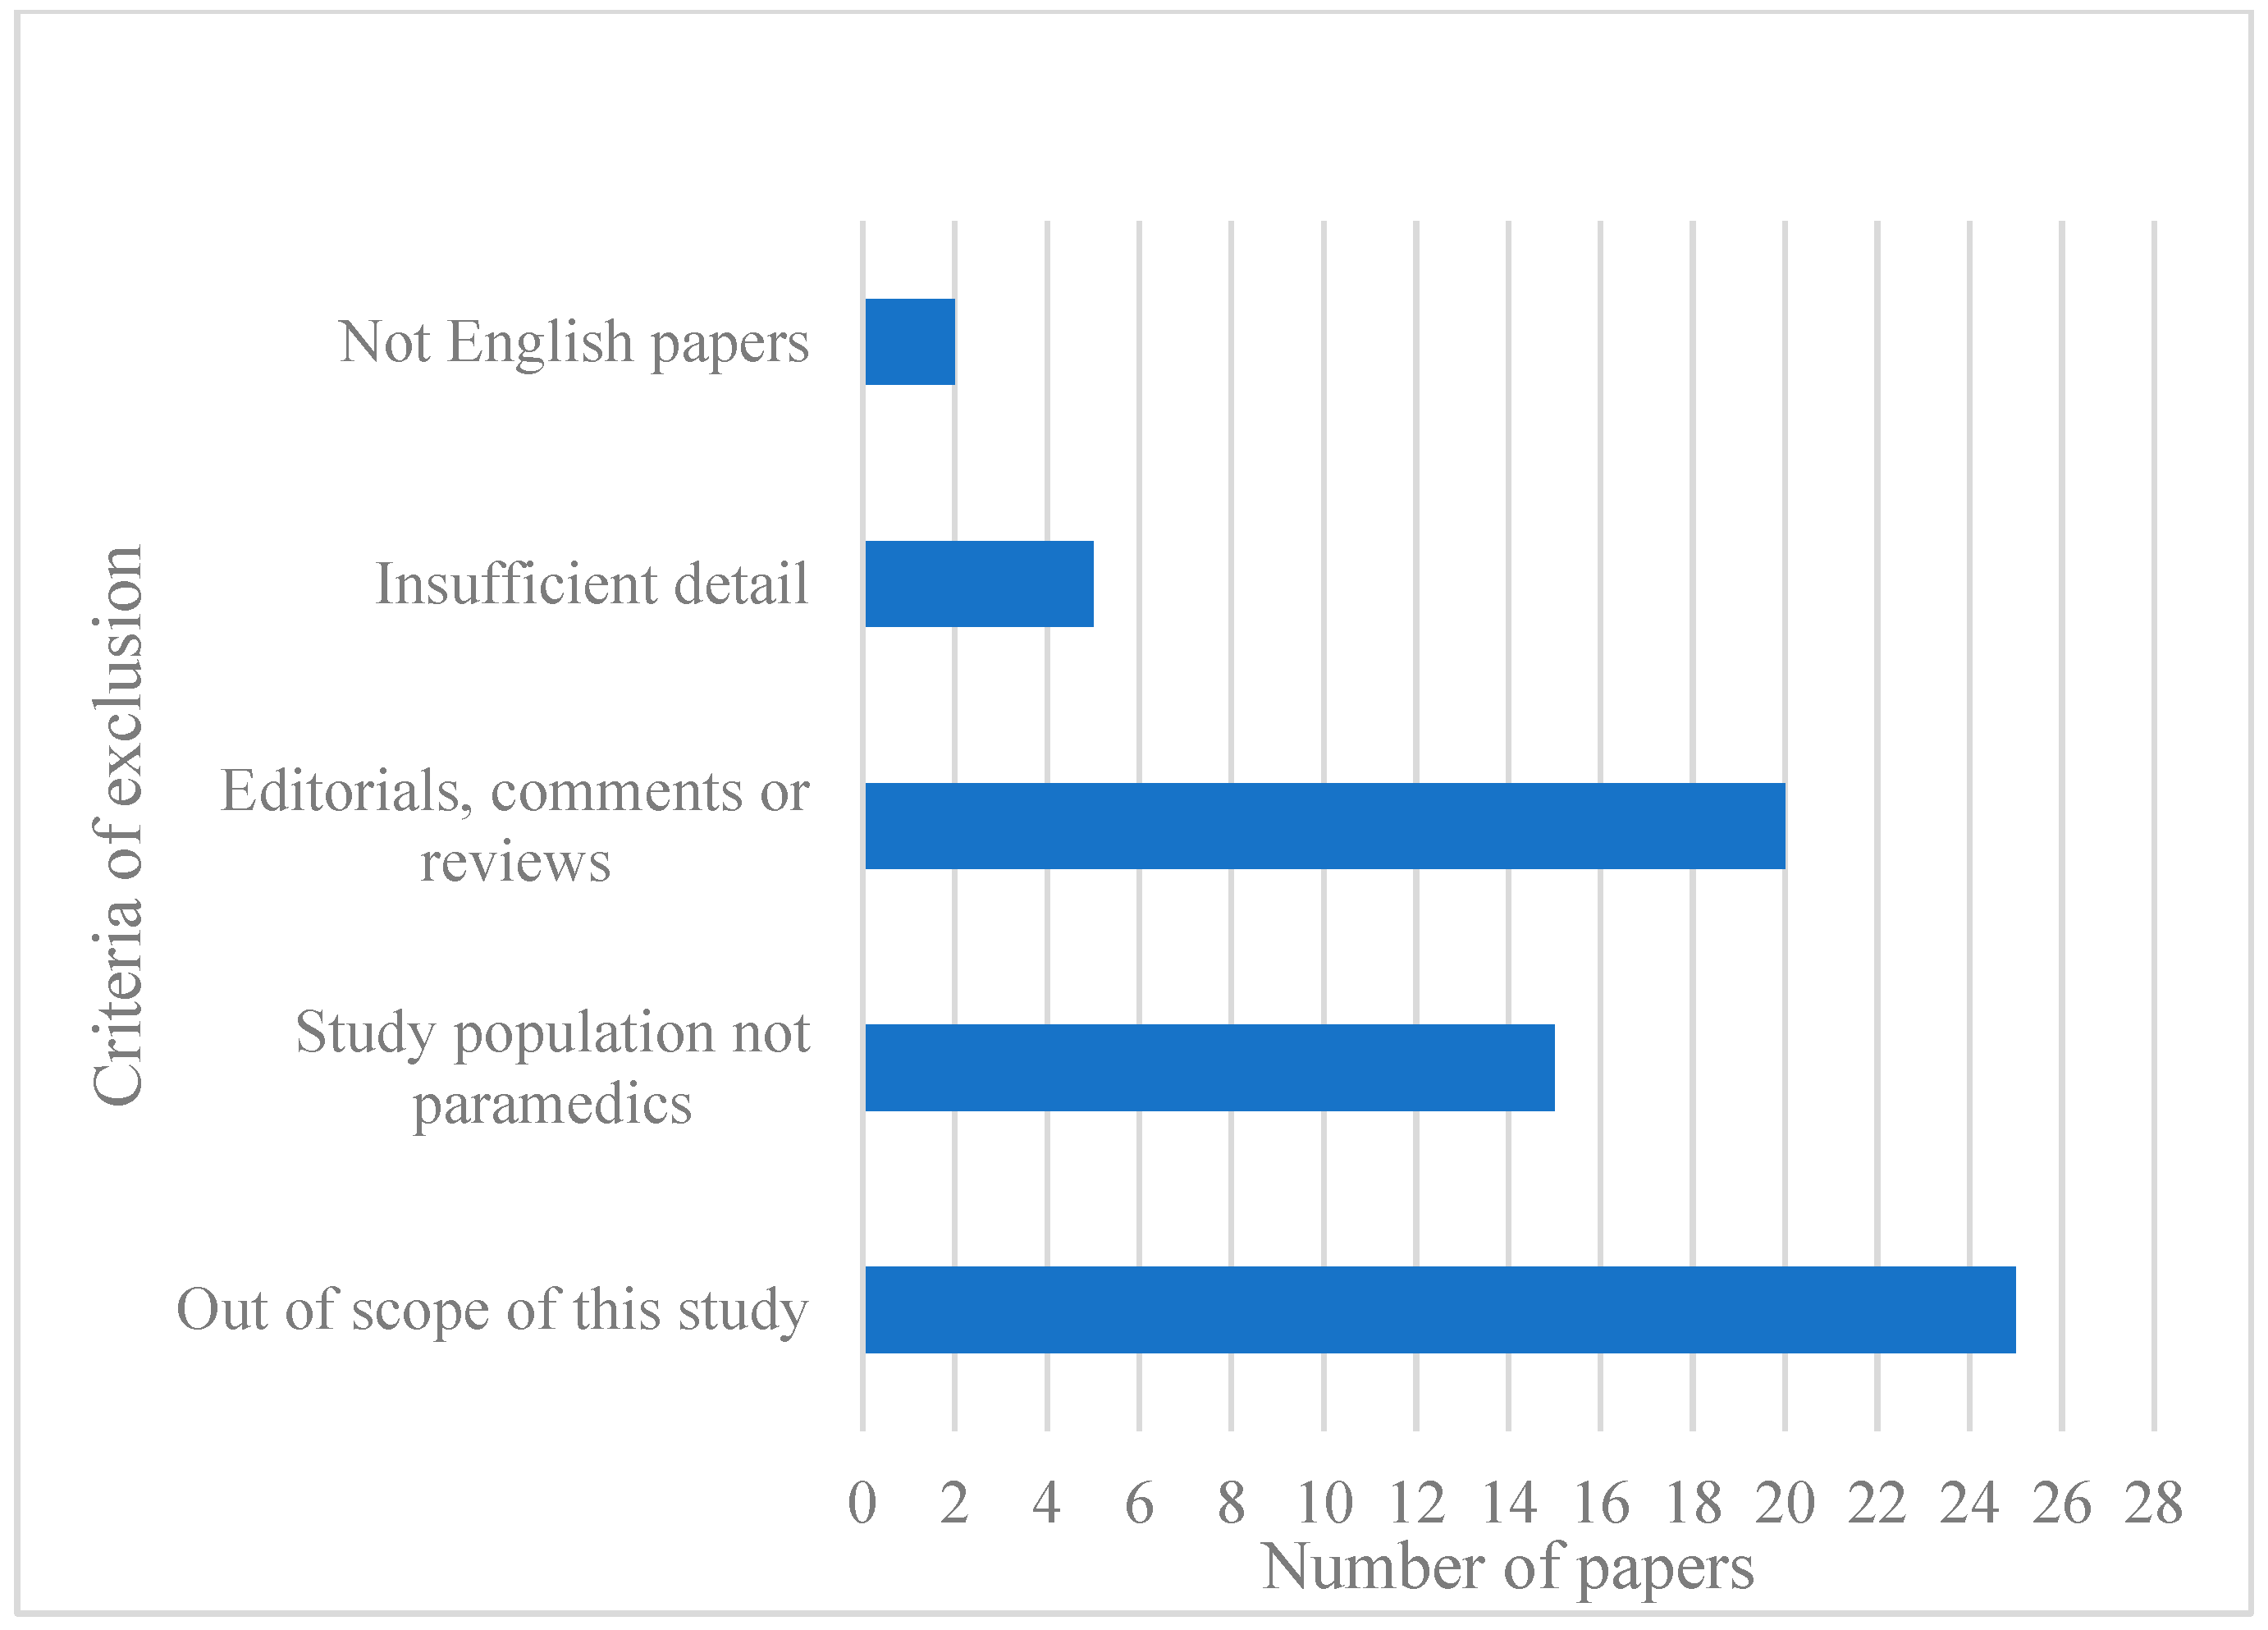
2. Method
3. Results
3.1. Prevalence of Collisions
3.2. Characteristics of Drivers
3.2.1. Age and Experience
3.2.2. Sex
3.2.3. History of Collisions
3.2.4. Traffic Citation
3.2.5. Seat Belts
3.2.6. Liability of Collision
3.3. Collision Characteristics
3.3.1. Time of Day/Day of the Week
3.3.2. Type of Collision
3.3.3. Transportation Mode
3.3.4. Type of Environment
3.4. Weather Conditions
3.5. Response Mode/Lights and Sirens
4. Discussion
5. Conclusions
Author Contributions
Funding
Institutional Review Board Statement
Informed Consent Statement
Data Availability Statement
Acknowledgments
Conflicts of Interest
Appendix A

| Author | Findings |
|---|---|
| Chiu P.W. et al., 2018 [11] | From January 2011 to October 2016, 715 ambulance collisions resulted in 8 deaths and 1844 injuries. On average, one ambulance collision happened for every 8598 ambulance runs. Such collisions were 1.7 times more likely to result in fatality and 1.9 times more likely to involve injuries compared to overall traffic collisions. Sex: Fatal collisions: Male = 100%. Non-fatal collisions: Male = 681 (96.2%) and female = 27 (3.8%). Time of day/Day of the week: Fatal collisions: 2 (25%) from 4 p.m. to 8 p.m., and 3 (37.5%) from 8 p.m. to 12 a.m. Non-fatal collisions: 199 (28.1%) from 8 a.m. to 12 p.m. and 148 (20.9%) from 12 p.m. to 4 p.m. Transportation mode: Fatal collisions: Motorcycles = 8 (88.9%) and vehicles = 1 (11.1%). Non-fatal collisions: motorcycles = 488 (63.3%) and vehicles = 283 (36.7%). There were only 1 ambulance in 13 (1.8%) non-fatal collisions and 2 ambulances in 1 (0.1%) non-fatal collision. Type of Environment: Fatal collisions: 8 (100%) happened on urban roads and 5 (62.5%) occurred at 4-point intersections. Non-fatal collisions: 529 (74.8%) happened on urban roads and 463 (65.5%) occurred at 4-point intersections. |
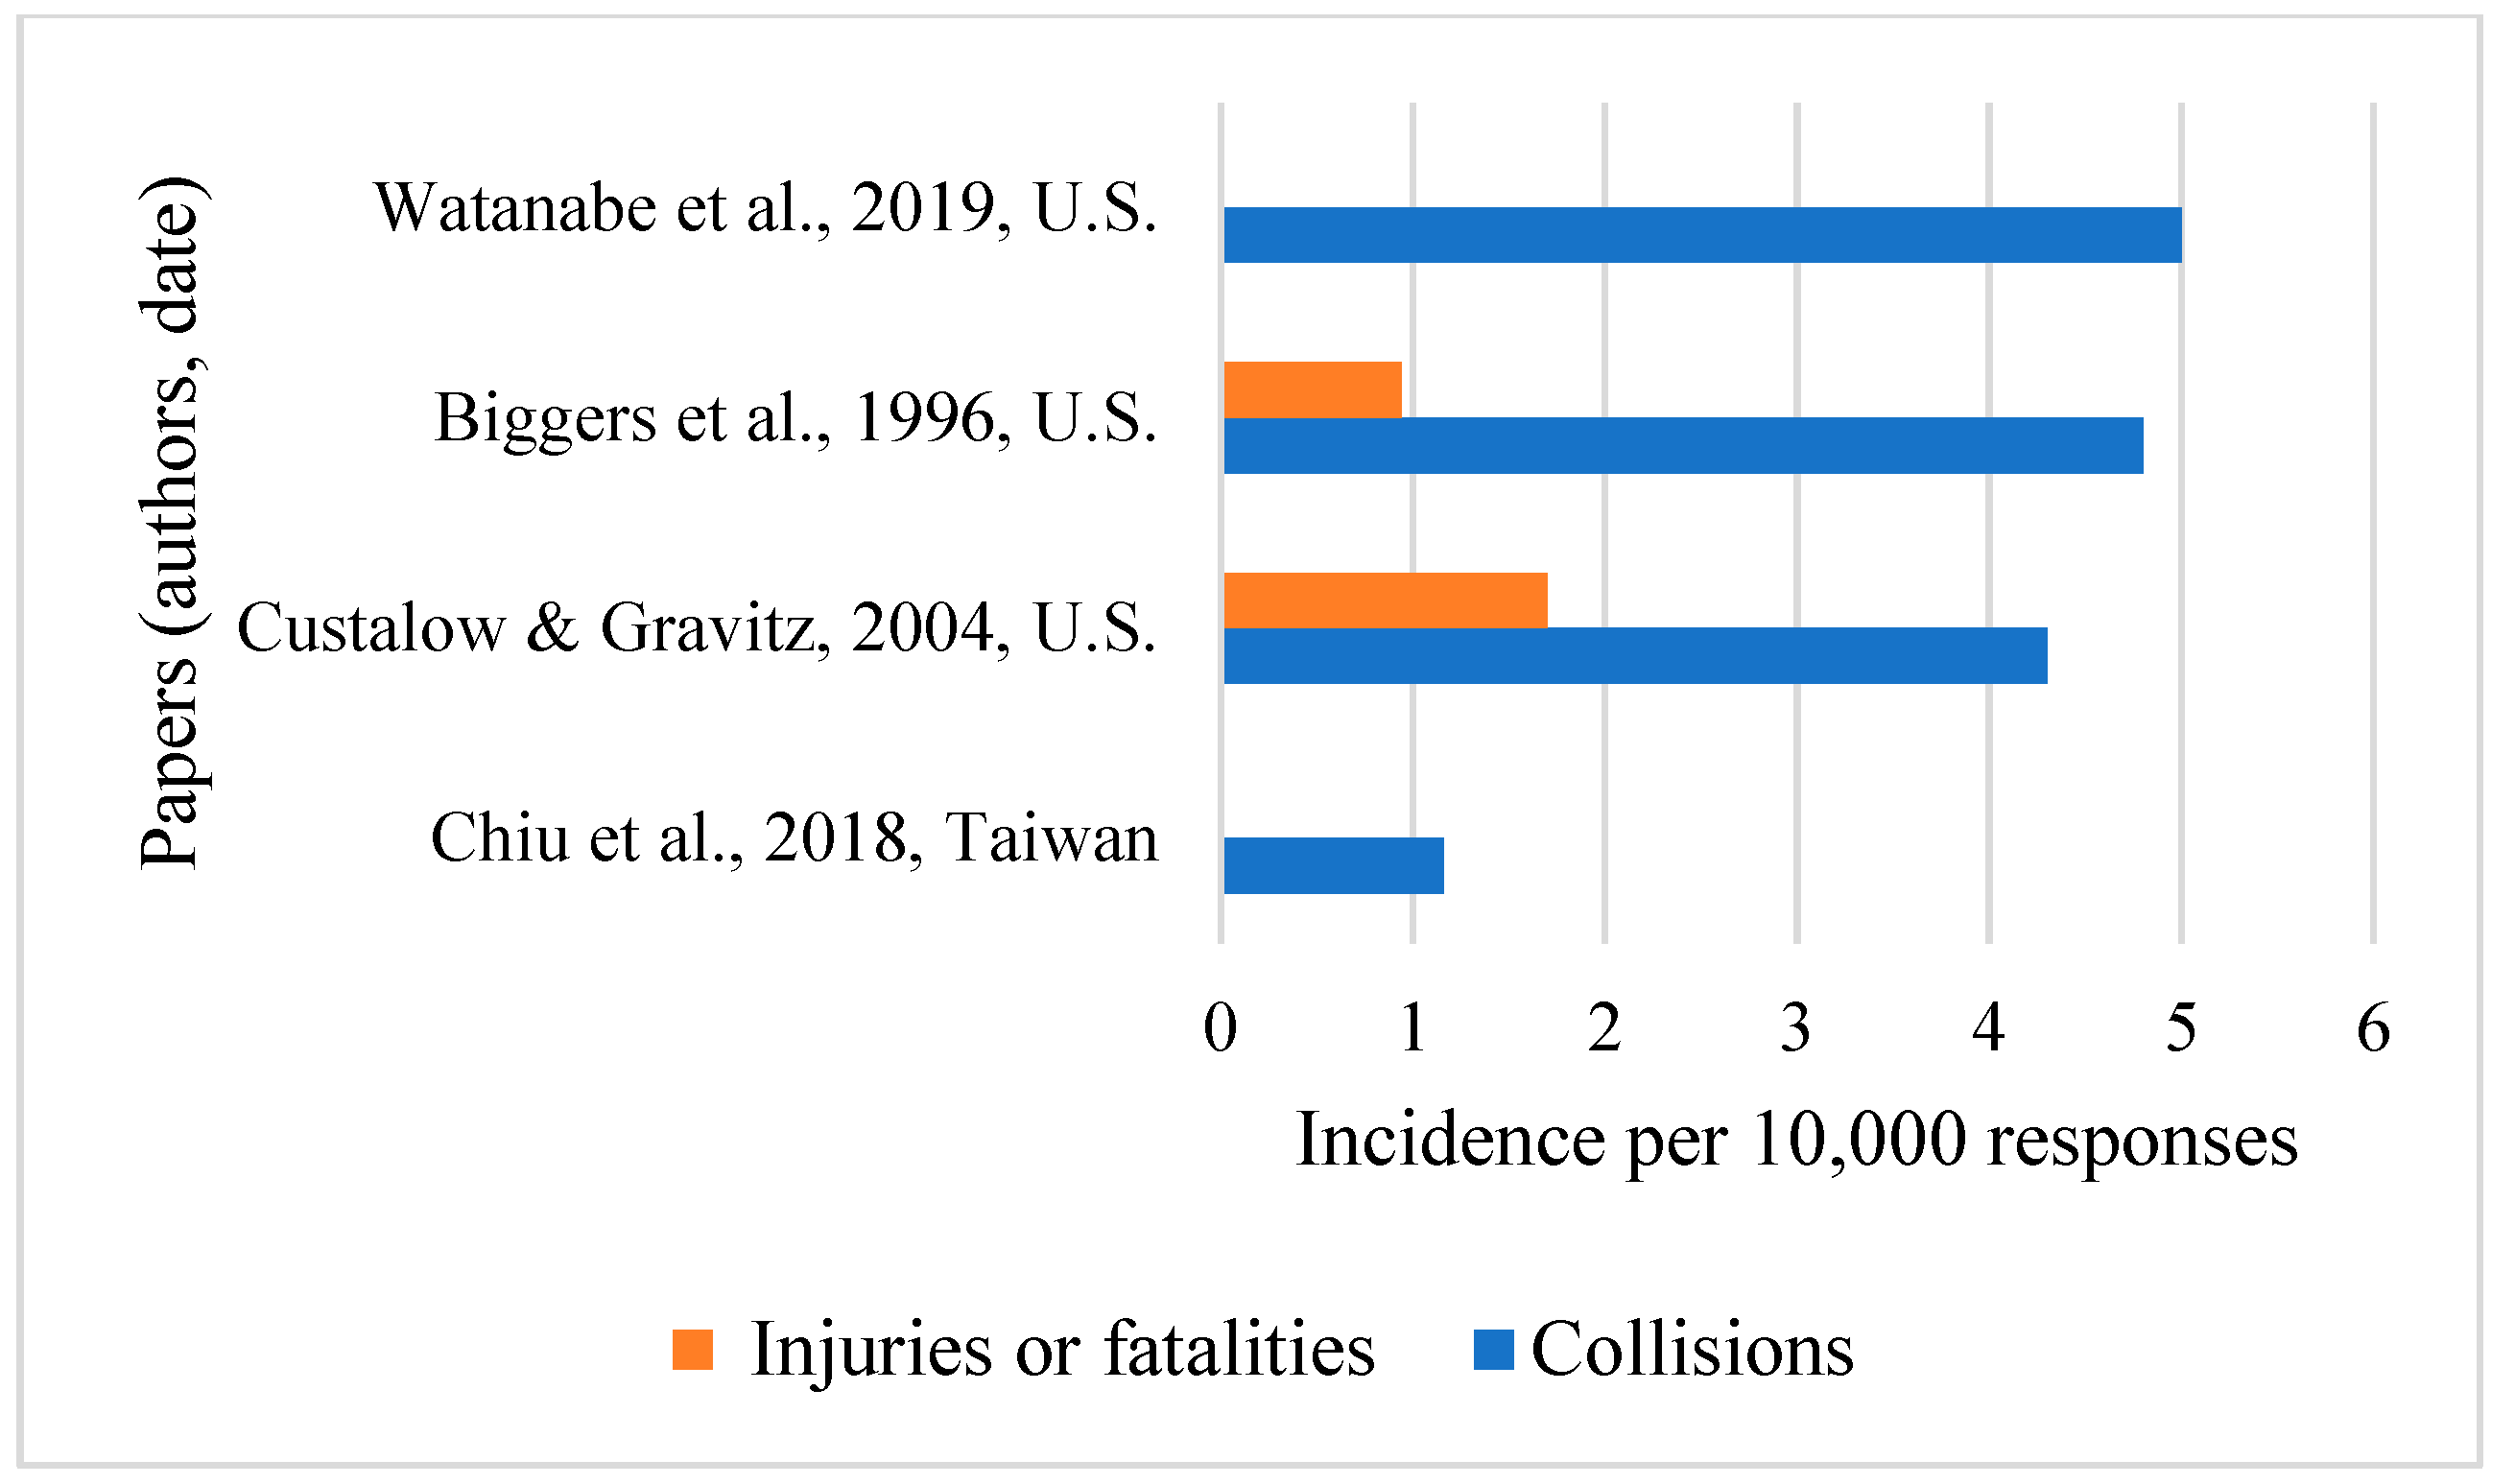
| Custalow C.B., Gravitz C.S. 2004 [24] | From 1989 to 1997, 39 injuries (81 dead or injured) and 167 non-injury-causing collisions resulted from 4.3 collisions and 1.7 injuries or fatalities occurred per 10,000 responses (0.02%). Of these, 192 (93%) were moving collisions and 14 (7%) occurred while the ambulance was parked. Age: mean = 32 and standard deviation = 6.6. Sex: male = 157 (82%) and female = 35 (18%). History of collisions: Emergency drivers had a history of multiple collisions in 71% of cases. Citation of the civilian driver: Impaired civilian drivers can increase the odds ratio of injury-causing collisions by 6.1 (p < 0.05). Type of Environment: 57.9% of fatal collisions happened at intersections. Intersections can increase the odds ratio of injury-causing collisions by 4.3 (p < 0.05). Most fatal collisions happened on roads with speed limits of less than 50 mph; 87.2% of fatal crashes occurred on the straight segments of the roadway. Weather condition: There is no statistical difference between emergency and non-emergency responses by weather and road surface conditions; 79.8% of fatal crashes happened when the sky was clear (67.9% of fatal collisions occurred on dry roadways) and 5.5% of collisions occurred when there was snow or ice. Response mode/Lights and sirens: Warning lights and sirens (WLSs) were involved in 91% of response mode collisions. |
| Pirrallo R.G., Swor R.A. 1994 [25] | There were 109 fatal ambulance collisions (including 126 deaths) during the study period. The trend of fatal collisions when responding to emergency calls decreased while that for non-emergency calls increased. Traffic citation: When ambulance drivers are responding to an emergency call, they may commit a traffic violation more than in non-emergency modes (88.2% vs. 11.8%, respectively). Time of day/Day of the week: Emergency use (EU): 37.6% of fatal crashes occurred in the afternoon (12:00–18:00) and 15.6% happened at night. Non-emergency use (NEU): Most fatal crashes occurred in poor light conditions. There is no statistical difference between EU and NEU among different days of the week or seasons. Fatal collisions happened more in spring and summer compared to other seasons. The highest number of fatal collisions happened on Saturday (19.3%) and Monday (18.3%) and the lowest happened on Tuesday (9.2%). Transportation mode: Vehicles were involved in 92 (84.4%) of fatal collisions and non-motor vehicle users (most commonly pedestrians) were involved in 17 (15.6%) of fatal crashes. Type of traffic collision: Angle collisions = 72.8% and striking another vehicle = 74.3%. Model of car: There is no statistical difference between EU and NEU among years of manufacture. Response mode/Lights and sirens: EU = 75 (69%) and NEU = 34 (31%) fatal crashes. |
| Bentley M.A., Levine R. 2016 [26] | The percentage of “excellent” health in paramedics was 38.5% in 1999 which decreased to 32.2% in 2008. Sleeping problems (20–27%), back problems (20–24%), and hearing problems (7–10%) are among the top health issues. Sleepiness: 8.0% of ambulance drivers faced difficulty in driving for short distances and 17.5% for long distances. Seat belt: 75.8% of EMS professionals declared that their organization has a written seat belt policy, and 66.3% confirmed that enforcement of this policy was “very strict” or “somewhat strict”. Front seat: 65.1% wear a seat belt, and patient compartment: 3.1% wear a seat belt. There was a 15.1% and 10% increase in using a seat belt for the front seat for work-related and non-work-related trips, respectively, from 2002 and 2008. |
| Ray A.F., Kupas D.F. 2005 [15] | Ambulances, with 2038 collisions, are more often involved in injuries (76%) compared to other similar-sized vehicles (61%). Time of day/Day of the week: There is a higher number of collisions in evenings and on weekends compared to other times. Transportation mode: Pedestrian involvement is rare (<5%). Type of traffic collision: Almost half of the collisions are angle collisions (45%). Type of environment: Ambulances are more often involved in collisions at four-way intersections (43% vs. 23%, p = 0.001) and at traffic signals (37% vs. 18%, p = 0.001) compared to other similar-sized vehicles. |
| Becker L.R. et al., 2003 [27] | An estimated 37,132 ambulance vehicles were involved in 305 fatal and 36,693 non-fatal ambulance crashes between 1988 and 1997. This resulted in 0.24 emergency vehicle occupant (EVO) fatalities per fatal ambulance crash and 0.28 injured EVOs per injury-causing ambulance crash. Seat belt: The risk of being killed or injured is 3.77 (p < 0.009) and 6.49 (p < 0.0001) times lower for restrained ambulance occupants. The probability of being killed versus not injured for rear occupants was 5.32 times higher than for front seat occupants (p < 0.0001). Response mode/Lights and sirens: The probability of being killed or severely injured for non-emergency trips is significantly higher than for emergency trips. |
| Clawson J.J. et al., 1997 [28] | In 73 surveys, 60 collisions were found with a mean of 0.82 (per polled paramedic); 78% (57) of paramedics reported either being involved in a collision or witnessing at least one wake-effect collision. Years of experience: Min = 3, max = 12, and mean = 8.1. |
| Ray A.M., Kupas D.F. 2007 [29] | There were 311 ambulance crashes in rural areas and 1434 in urban areas between January 1997 and December 2001. Liability of collision: Urban collisions = 93% and rural collisions = 75%. There is a low percentage (<1%) of using alcohol and/or drugs in both urban and rural areas. Time of day/Day of the week: There is no difference between the time and day of rural and urban collisions. Type of traffic collision: Angled collisions with other vehicles are more common in urban compared to rural areas (54% vs. 19%, p < 0.0001). However, striking a fixed object is more common in rural compared to urban areas (33% vs. 7%, p < 0.0001). Transportation mode: Collisions involving more than 1 vehicle (88% vs. 56%, p < 0.0001) and more than 4 people (35% vs. 23%, p < 0.0001) are more in urban compared to rural areas. Pedestrians are involved in less than 5% of collisions in both urban and rural areas. For almost half of the rural crashes, only the ambulance is involved. Type of environment: Crashes are more likely to occur at intersections (67% vs. 26%, p < 0.0001) or at a stop sign or signal (53% vs. 14%, p < 0.0001) in urban than rural areas. There is no difference in injury severity in urban and rural areas. Weather conditions: Adverse weather conditions: Crashes on snowy roads (13% vs. 5%, p <0.0001) and at night without light (25% vs. 4%, p <0.0001) are more common in rural compared to urban areas. Urban crashes happen frequently in rainy weather on wet roads. Non-adverse weather conditions: Collisions mostly happen on dry roads. |
| Gałązkowski R. et al., 2015 [30] | There were 32 ambulance collisions in 2008 and this number reduced to 5 collisions in 2012, resulting in 5 deaths and 120 injured in total. Age: Less than 30 years old. Sex: Male = 80% and female = 20% The trend of females involved in collisions increased in the last two years (2011–2012). Time of day/Day of the week: Working days = 120 injuries and non-working days = 33 injuries. The number of collisions on working days was two times more than on weekends. Response mode/Lights and sirens: Trips caring for a patient = 29%. |
| Sanddal T.L. et al., 2010 [21] | There were 79 (17%) fatalities, 279 (60%) injuries, and 108 (23%) non-injury-causing collisions in the studied period. This resulted in 99 deaths for ambulance occupants and 883 deaths for civilian drivers. The probability of being killed by civilian drivers is higher than the probability of being killed by paramedics. Liability of collision: Ambulance drivers were responsible in 29 cases (6%) and over the legal limit for alcohol use in 7 cases (2%). Citations of civilian drivers: Civilian drivers were cited in 39 (8%) collisions. Time of day/Day of the week: The highest percentage of collisions (n = 100 out of 320) happened between 12:00 and 17:59 and, after that, 85 crashes occurred between 06:00 and 11:59. Although there is no statistical difference (p = 0.201) between monthly variations, January (n = 60), May (n = 51), and December (n = 47) had more collisions compared to other months. Type of traffic collision: Striking another vehicle or object = 150 (32%) and being struck by another vehicle = 209 (45%). Rollovers happened in 27 (14%) of 196 intersection crashes and 49 non-intersection crashes. Type of environment: Urban = 382 (82%) and rural = 84 (18%). Regarding urban collisions, 196 happened at intersections, and in 35% of them, ambulances struck another vehicle. Weather conditions: 51 (out of 54, with reported weather) collisions happened in adverse conditions, including 14 rain, 6 fog, 10 slippery, 1 whiteout/blizzard, 6 wet and icy, and 13 ice and snow. Response mode/Lights and sirens: Using emergency warning devices = 80% of reported cases (resulting in injuries or fatalities). Responding to an emergency = 68% of reported cases, returning from a call = 12% of reported cases, and routine matters = 21% of reported cases. Caring for no patient = 52% of reported cases and caring for one or more patients = 48% of reported cases. |
| Biggers W.A., Jr. et al., 1996 [31] | There were 86 ambulance collisions that resulted in 3.2 collisions per 100,000 miles driven or 4.8 collisions per 10,000 responses in 1993. These collisions led to 0.64 injuries per 100,000 miles driven or 0.94 injuries per 10,000 responses. There were no fatalities. History of collisions: Drivers with a history of ambulance collisions were involved in 33% of collisions. Five drivers, with prior ambulance collisions, were involved in fifteen (88.2%) injuries. Liability of collision: Ambulance drivers were not responsible of collisions in 68.7% of all cases, and they were liable of collisions in only 21.2% of cases. There was no difference between the responsibility and irresponsibility of ambulance drivers regarding collision severity. Citations of civilian drivers: Civilian drivers received 16 (88.8%) citations. Time of day/Day of the week: There was no difference between day and night or weekend and weekday regarding collision severity. Twenty-four collisions (33.33%) happened on Friday. Type of traffic collision (or mechanism of collision): The most common type involved backing up of the ambulance. Type of environment: 8% (n = 6) of collisions happened at controlled intersections and 85.1% of collisions (n = 63) occurred at other places. There was no statistical relation betweenthe collision occurred at an intersection and the severity of collisions. Response mode/Lights and sirens: 50% of collisions (n = 37) occurred during WLSs, resulting in 2.06 collisions per 10,000 responses. There was no statistical relation between using WLSs and the severity of collisions. |
| Fournier M. et al., 2013 [32] | Seat belt: 77 (72%) of emergency medical service (EMS) personnel used seat belts at departure. Fourteen (14%) EMS personnel wore seat belts and thirty-three (31%) stood up during patient transport. Stretcher belts and vacuum stretchers were used with the patient in 37 (35%) and 49 (46%) cases. |
| Saunders C.E., Heye C.J. 1994 [17] | From June 1989 to August 1991, 135 collisions happened, resulting in 13.3 collisions per 100,000 miles traveled. Liability of collision: WLSs: Failure to yield = 58.1% and inattention = 22.6%. No WLSs: Inattention = 41% and failure to yield = 4.7%. Ambulance drivers were liable in 48.9% of collisions with inattention as the primary cause of collisions. In cases of unsafe backing up, ambulance drivers were responsible for 67% of collisions. Type of traffic collision: The following movements were happening at the time of collision: Forward = 33.3%, stationary = 20.7%, backing up = 11.1%, turning = 17.7%, “squeezing” an ambulance between two other vehicles = 7.4%, and slowing, passing, and parking = 9.6%. Speed: In 89.6% of collisions, the speed was <20 mph, resulting in minor damage. Of collisions, 10.4% happened at moderate speed (21–45 mph), resulting in moderate or major damage in 33.33% of cases; 22.5% of WLS and 5.5% of non-WLS collisions happened at moderate speed. Type of environment: Urban street = 78.5%, parking or hospital lot = 20.8%, and freeway = 0.7%. Vehicle was en route, either to the scene or to the hospital = 50% and at the scene, at the hospital, or waiting for a call = 50% Weather condition: Clear weather and daylight = 68.1%, dark = 28.1%, and rain or light precipitation = 3.7%. Response mode/Lights and sirens: WLS calls = 45.9 collisions per 100,000 ambulance runs, resulting in an injury rate of 1.46 per 100,000 runs or 0.05 injuries per WLS collision. All patient-related collisions (10 out of 31 WLS collisions) happened when WLSs were used. There were 68.1 collisions per 100,000 journeys to the hospital with WLSs compared to 42.6 per 100,000 journeys en route to the call with WLSs. Non-WLS calls = 27.0 collisions per 100,000 ambulance runs, resulting in an injury rate of 22.2 per 100,000 runs or 0.48 injuries per WLS collision. All non-WLS collisions (n = 37) resulted in minor damage. There was no significant difference between WLS and non-WLS trips regarding the frequency of collisions. |
| Kahn C.A. et al., 2001 [33] | There were 339 ambulance crashes and 1.78 crashes per 1,000,000 persons over 18 years of age, resulting in 405 deaths and 838 injuries from 1987 to 1997 for the 50 states of the U.S. and the District of Columbia. Traffic citations: Ambulance drivers were cited for lane, signaling, turning, and intersection control violations in 16% of fatal collisions. There is no difference between fatal emergency and non-emergency crashes regarding citations. History of collisions: 41% of ambulance drivers had a previous collision, suspension, and/or motor vehicle citation. Seat belts: Use of the rear compartment can increase the odds of incapacitating and fatal injuries to 2.7 (95% CI 2.0–3.7) compared to the front seat. Unrestrained occupants have increased odds of incapacitating and fatal injuries of 2.5 (95% CI 1.8–3.6) compared to properly restrained occupants. Unrestrained rear occupants have increased odds of incapacitating and fatal injuries of 2.8 (95% CI 1.8–4.2) compared to unrestrained front occupants. Time of day/Day of the week: 39% of collisions happened from 12:00 p.m. to 6:00 p.m. There is no significant variation by year (p = 0.33), season (p = 0.74), or day of the week (p = 0.57). Transportation mode: Occupants of other vehicles accounted for 78% of fatalities. Thirty pedestrians and one bicyclist accounted for 9% of all fatalities. Type of traffic collision: Striking another vehicle = 80% and angle collisions = 56%. Fatal collisions are more common in emergency mode at intersections (p < 0.001), at an angle (p < 0.001), and with another motor vehicle (p < 0.001) compared to non-emergency mode. Type of environment: Straight roads = 86% and intersection = 53%. Weather condition: Dry roads = 69% and during clear weather = 77%. Response mode/Lights and sirens: 60% of collisions (n = 202) and 58% of fatal crashes (n = 233) happened during emergency use. |
| Weiss S.J. et al., 2001 [34] | There were 183 ambulance crashes, 2.6 persons/crash, resulting in 55 injury-causing collisions, 1.4 people/injury-causing crash, over the study period. This resulted in 78 injured people, 46% in rural areas and 54% in urban areas, and no deaths. Traffic citation: Ambulance and civilian drivers were cited more in urban areas. Seat belt: 80% of occupants (out of 484) were wearing seat belts. Those who did not use seat belts were more often injured in rural areas compared to urban areas. Time of day/Day of the week: There is no significant difference between urban and rural areas regarding weekday versus weekend, or day versus night. Type of traffic collision: Rural ambulances were significantly more likely to have an impact at the front while urban ambulances were more likely to have back-end collisions. There was an equal chance to be impacted on the side for rural and urban areas. Type of environment: Urban areas = 115 (out of 183) collisions or 19 collisions/million persons/year, resulting in 28 injury-causing collisions. In rural areas = 68 (out of 183) collisions or 8 collisions/million persons/year, resulting in 27 injury-causing collisions. The ambulance was more likely to be damaged, disabled, or towed in rural areas. |
| Schwartz R.J. et al., 1993 [35] | During the 6 months of the study period, 4.1% (439 in total) of paramedics were involved in a collision, resulting in 9.9 collisions/100 full-time equivalent (FTE)/year. Six injuries (out of eighteen collisions) occurred in the studied period. Age: Mean = 35. Sex: Male = 71% and female = 29%. Seat belt: Sixty-six percent of the drivers stated they were wearing their seat belts. Response mode/Lights and sirens: 10 (55.6%) collisions occurred while traveling to the scene, 4 (22.2%) while transporting the patient, and 4 (22.2%) at other times. |
| Watanabe B.L. et al., 2019 [16] | Response phase: 4.6 collisions per 100,000 trips without WLSs and 5.4 collisions per 100,000 with WLSs. Transport phase: 7 collisions per 100,000 trips without WLSs and 17.1 collisions per 100,000 with WLSs. |
| Lai Y.L. et al., 2018 [36] | Although there were 56 ambulance crashes in Taiwan from 2011 to 2015, the trend of the crashes did not increase while the number of an emergency call increased. Time of day/Day of the week: 29% of collisions occurred from 16:00–20:00 and 27% from 08:00–12:00. Type of environment: Most collisions happened in urban areas; 48% of collisions with motorists happened at intersections while passing red lights. |
| Yilmaz A. et al., 2016 [3] | Ambulance collisions resulted in 41.3% of work-related injuries (WRIs). In order, traffic collisions (31.9%), needlestick injuries (16.0%), ocular exposure to bodily fluids (15.4%), and sharp injuries (9.8%) are the most common mechanisms of WRI. |
| Reichard A.A., Jackson L.L. 2010 [2] | In 2000 and 2001, 123,900 injuries happened to emergency responders (3% of the total work-related injuries). Emergency medical services (EMSs) were involved in 18% (21,900) of these injuries, resulting in 4.9 injuries per 100 EMS workers; 8% of sprains and strains were caused by vehicle collisions. Age: <25 years old = 25% of EMS injuries. |
| Gülen B. et al., 2016 [4] | Of WRIs, 81.4% were due to ambulance collisions that led to the death of 3 paramedics and 7 civilian drivers. Transportation mode: In 53.6% of all cases, ambulances struck another vehicle. Response mode/Lights and sirens: 733 paramedics (81.4%) were involved in at least 1 collision while on duty. |
| Studnek J.R., Fernandez A.R. 2008 [37] | EMS professionals with sleep problems were more likely to be involved in a crash than those who did not face this problem (14.9% vs. 7.5%, respectively) The risk of collisions for those who had sleep problems within the last 12 months or spent more time in an ambulance was higher than for others. Age: Mean = 31.0 ± 8.2 The likelihood of being involved in a collision increased when decreasing the ambulance driver age by five years. |
| Larmon B. et al., 1993 [38] | Seat belt: Front seat: Most respondents use safety belts during emergency and non-emergency runs. Rear seat: No significant difference between respondents use of safety belts during emergency and non-emergency runs. |
| Tennyson J., Maranda L., Darnobid A. 2015 [39] | No clear benefit and increased risk when using WLSs are not related to a reduction of the use of WLSs by the surveyed providers. Response mode/Lights and sirens: More than 80% of ambulance trips were made with WLSs in the surveyed group. It was found that paramedics know the risk of WLSs and having a history of collisions did not significantly affect their belief in the risk of using WLSs. |
| Ersoy G. et al., 2012 [40] | From 1996 to 2005, 15 deaths (out of 21 cases) happened on the day of the collision and 6 (40%) deaths caused by ambulance collisions were found among the forensic medical reports. Age: Mean = 47. Paramedics were aged 0–92 years. Type of collision: Crashes of two vehicles = 12 (57.14%), rollovers = 4 (19.05%), run off road = 1 (4.76%), and unknown = 4 (19.05%). Type of environment: Highways out of cities = 14 (66%), roads in cities = 6 (29%), and unknown scene = 1 (5%). Response mode/Lights and sirens: Transport from the scene to the health center = 6 patients (29%) and transport from one health center to another one= 15 patients (71%). |
| Maguire B.J. et al., 2002 [41] | According to the Census of Fatal Occupational Injuries (CFOI), 67 (74%) EMS fatalities were caused by traffic collisions and 46 of these paramedics were driving at the time of collision. According to the National Emergency Medical Services Memorial Service (NEMSMS), 52 (74%) EMS fatalities were caused by transportation-related incidents and 33 (47%) of them were associated with ground vehicle crashes or pedestrian fatalities. Response mode/Lights and sirens: 6 (out of 33) EMS fatalities identified from NEMSMS were struck by moving vehicles; 5 were caring for patients, and 1 was listed as “other”. |
References
- European Agency for Safety and Health at Work (EU-OSHA). Commuting Accidents. 2019. Available online: Oshwiki.org (accessed on 19 April 2023).
- Reichard, A.A.; Jackson, L.L. Occupational injuries among emergency responders. Am. J. Ind. Med. 2010, 53, 1–11. [Google Scholar] [CrossRef] [PubMed]
- Yilmaz, A.; Serinken, M.; Dal, O.; Yaylacı, S.; Karcioglu, O. Work-related Injuries Among Emergency Medical Technicians in Western Turkey. Prehosp. Disaster Med. 2016, 31, 505–508. [Google Scholar] [CrossRef]
- Gülen, B.; Serinken, M.; Hatipoğlu, C.; Özaşır, D.; Sönmez, E.; Kaya, G.; Akpınar, G. Work-related injuries sustained by emergency medical technicians and paramedics in Turkey. Turk. J. Trauma Emerg. Surg. 2016, 22, 145–149. [Google Scholar]
- Heightman, A. Crew & Patient Safety Receive High Priority. JEMS J. Emerg. Med. Serv. 2006, 31, 114. [Google Scholar]
- Heightman, A. Protect your rear. Putting your best lights forward. JEMS J. Emerg. Med. Serv. 2009, 34, 12. [Google Scholar]
- Nordberg, M. In Winter Park, employee safety comes first. Emerg. Med. Serv. 2006, 35, 79. [Google Scholar]
- Nordberg, M. Driving online. Internet-based program for emergency vehicle safe operations now available. Emerg. Med Serv. 2006, 35, 40. [Google Scholar] [PubMed]
- Sagarra, S.E. New ambulance design aims to improve safety. EMS World 2015, 44, 42–44. [Google Scholar]
- Savolainen, P.T.; Dey, K.C.; Ghosh, I.; Karra, T.L.; Lamb, A. Investigation of Emergency Vehicle Crashes in the State of Michigan; Nextrans Center (US): West Lafayette, IN, USA, 2009. [Google Scholar]
- Chiu, P.-W.; Lin, C.H.; Wu, C.L.; Fang, P.H.; Lu, C.H.; Hsu, H.C.; Chi, C.H. Ambulance traffic accidents in Taiwan. J. Formos. Med. Assoc. 2018, 117, 283–291. [Google Scholar] [CrossRef]
- Fetto Law Group. Statistics on Emergency Vehicle Accidents in the United States. 2019. Available online: https://www.fettolawgroup.com/Personal-Injury-Blog/ (accessed on 19 April 2023).
- Maguire, B.J.; Hunting, K.L.; Guidotti, T.L.; Smith, G.S. Occupational Injuries among Emergency Medical Services Personnel. Prehosp. Emerg. Care 2005, 9, 405–411. [Google Scholar] [CrossRef]
- Sanddal, N.D.; Albert, S.; Hansen, J.D.; Kupas, D.F. Contributing Factors andIssues Associated with Rural Ambulance Crashes: Literature Review andAnnotated Bibliography. Prehosp. Emerg. Care 2008, 12, 257–267. [Google Scholar] [CrossRef]
- Ray, A.F.; Kupas, D.F. Comparison of Crashes Involving Ambulances with Those of Similar-Sized Vehicles. Prehos. Emerg. Care 2005, 9, 412–415. [Google Scholar] [CrossRef]
- Watanabe, B.L.; Patterson, G.S.; Kempema, J.M.; Magallanes, O.; Brown, L. Is Use of Warning Lights and Sirens Associated with Increased Risk of Ambulance Crashes? A Contemporary Analysis Using National EMS Information System (NEMSIS) Data. Ann. Emerg. Med. 2019, 74, 101–109. [Google Scholar] [CrossRef]
- Saunders, C.E.; Heye, C.J. Ambulance Collisions in an Urban Environment. Prehosp. Disaster Med. 1994, 9, 118–124. [Google Scholar] [CrossRef] [PubMed]
- Lebeau, M.; Duguay, P. Le Coût des Accidents Routiers au Travail Survenus au Québec de 2001 à 2015; Institut de Recherche Robert-Sauvé en Santé et en Sécurité du Travail: Montréal, QC, Canada, 2021. [Google Scholar]
- National Highway Traffic Safety Administration (NHTSA). Estimate of Crashes Involving Emergency Vehicles by Year, Emergency Vehicle and Emergency Use, 2001–2010. General Estimates System (GES). Fatality Analysis Reporting System (FARS); National Highway Traffic Safety Administration (NHTSA): Washington, DC, USA, 2010.
- American Medical Association. Principles of Medical Ethics of the American Medical Association; American Medical Association: Chicago, IL, USA, 1903. [Google Scholar]
- Sanddal, T.L.; Sanddal, N.D.; Ward, N.; Stanley, L. Ambulance Crash Characteristics in the US Defined by the Popular Press: A Retrospective Analysis. Emerg. Med. Int. 2010, 2010, 525979. [Google Scholar] [CrossRef]
- White, J. PubMed 2.0. Med. Ref. Serv. Q. 2020, 39, 382–387. [Google Scholar] [CrossRef] [PubMed]
- Kmet, L.M.; Cook, L.S.; Lee, R.C. Standard Quality Assessment Criteria for Evaluating Primary Research Papers from a Variety of Fields; Alberta Heritage Foundation for Medical Research: Edmonton, AB, Canada, 2004. [Google Scholar]
- Custalow, C.B.; Gravitz, C.S. Emergency medical vehicle collisions and potential for preventive intervention. Prehosp. Emerg. Care 2004, 8, 175–184. [Google Scholar] [CrossRef] [PubMed]
- Pirrallo, R.G.; Swor, R.A. Characteristics of Fatal Ambulance Crashes During Emergency and Non-emergency Operation. Prehosp. Disaster Med. 1994, 9, 125–132. [Google Scholar] [CrossRef]
- Bentley, M.A.; Levine, R. A National Assessment of the Health and Safety of Emergency Medical Services Professionals. Prehosp. Disaster Med. 2016, 31, S96–S104. [Google Scholar] [CrossRef] [PubMed]
- Becker, L.; Zaloshnja, E.; Levick, N.; Li, G.; Miller, T. Relative risk of injury and death in ambulances and other emergency vehicles. Accid. Anal. Prev. 2003, 35, 941–948. [Google Scholar] [CrossRef]
- Clawson, J.J.; Martin, R.L.; Cady, G.A.; Maio, R.F. The Wake-Effect—Emergency Vehicle-Related Collisions. Prehosp. Disaster Med. 1997, 12, 41–44. [Google Scholar] [CrossRef]
- Ray, A.M.; Kupas, D.F. Comparison of Rural andUrban Ambulance Crashes in Pennsylvania. Prehosp. Emerg. Care 2007, 11, 416–420. [Google Scholar] [CrossRef]
- Gałązkowski, R.; Binkowska, A.; Samoliński, K. Occupational injury rates in personnel of emergency medical services. Ann. Agric. Environ. Med. 2015, 22, 680–684. [Google Scholar] [CrossRef]
- Biggers, W.A.; Zachariah, B.S.; Pepe, P.E. Emergency Medical Vehicle Collisions in an Urban System. Prehosp. Disaster Med. 1996, 11, 195–201. [Google Scholar] [CrossRef]
- Fournier, M.; Chenaitia, H.; Masson, C.; Michelet, P.; Behr, M.; Auffray, J.-P. Crew and Patient Safety in Ambulances: Results of a Personnel Survey and Experimental Side Impact Crash Test. Prehosp. Disaster Med. 2013, 28, 370–375. [Google Scholar] [CrossRef]
- Kahn, C.A.; Pirrallo, R.G.; Kuhn, E.M. Characteristics of fatal ambulance crashes in the United States: An 11-year retrospective analysis. Prehosp. Emerg. Care 2001, 5, 261–269. [Google Scholar] [CrossRef]
- Weiss, S.J.; Ellis, R.; Ernst, A.A.; Land, R.F.; Garza, A. A comparison of rural and urban ambulance crashes. Am. J. Emerg. Med. 2001, 19, 52–56. [Google Scholar] [CrossRef]
- Schwartz, R.J.; Benson, L.; Jacobs, L.M. The Prevalence of Occupational Injuries in EMTs in New England. Prehosp. Disaster Med. 1993, 8, 45–50. [Google Scholar] [CrossRef] [PubMed]
- Lai, Y.-L.; Chou, Y.-H.; Chang, L.-C. An intelligent IoT emergency vehicle warning system using RFID and Wi-Fi technologies for emergency medical services. Technol. Health Care 2018, 26, 43–55. [Google Scholar] [CrossRef]
- Studnek, J.R.; Fernandez, A.R. Characteristics of Emergency Medical Technicians Involved in Ambulance Crashes. Prehosp. Disaster Med. 2008, 23, 432–437. [Google Scholar] [CrossRef] [PubMed]
- Larmon, B.; LeGassick, T.L.; Schriger, D.L. Differential front and back seat safety belt use by Prehosp. care providers. Am. J. Emerg. Med. 1993, 11, 595–599. [Google Scholar] [CrossRef] [PubMed]
- Tennyson, J.; Maranda, L.; Darnobid, A. Knowledge and Beliefs of EMS Providers toward Lights and Siren Transportation. WestJEM 2015, 16, 465–471. [Google Scholar] [CrossRef] [PubMed]
- Ersoy, G.; Ersoy, O.; Yuksekbas, O.; Kurnaz, G.; Akyildiz, E.U.; Ekemen, S. Why did the patient die? The relationship between ambulance accidents and death of patients: Forensic medical issues. J. Forensic Leg. Med. 2012, 19, 474–479. [Google Scholar] [CrossRef] [PubMed]
- Maguire, B.J.; Hunting, K.L.; Smith, G.S.; Levick, N.R. Occupational fatalities in emergency medical services: A hidden crisis. Ann. Emerg. Med. 2002, 40, 625–632. [Google Scholar] [CrossRef] [PubMed]
- Sterud, T.; Ekeberg, Ø.; Hem, E. Health status in the ambulance services: A systematic review. BMC Health Serv. Res. 2006, 6, 82. [Google Scholar] [CrossRef]
- Wiwekananda, K.S.S.; Hamukti, R.P.; Yogananda, K.S.S.; Calisto, K.E.; Utomo, P.S. Understanding factors of ambulance delay and crash to enhance ambulance efficiency: An integrative literature review. J. Community Empower. Health 2020, 3, 213. [Google Scholar] [CrossRef]


| Number | Author/s | Year | Study Title | Country | Method | Studied Period | Quality * |
|---|---|---|---|---|---|---|---|
| 1 | Chiu P.W. et al. | 2018 | Ambulance traffic accidents in Taiwan [11] | Taiwan | Descriptive analysis and two-sample t-tests | 1 January 2011–31 October 2016 | 0.88 |
| 2 | Custalow C.B., Gravitz C.S. | 2004 | Emergency medical vehicle collisions and potential for preventive intervention [24] | U.S. | Multiple logistic regression model | 1989–1997 | 0.93 |
| 3 | Pirrallo R.G., Swor R.A. | 1994 | Characteristics of fatal ambulance crashes during emergency and non-emergency operation [25] | U.S. | Descriptive analysis and statistical tests (Pearson χ2 test) | 1987–1990 | 0.9 |
| 4 | Bentley M.A., Levine R. | 2016 | A National Assessment of the Health and Safety of Emergency Medical Services Professionals [26] | U.S. | Average, weighted percentages, and 95% confidence interval (CI) analysis | Questionnaires; 1999–2008 | 0.78 |
| 5 | Ray A.F., Kupas D.F. | 2005 | Comparison of crashes involving ambulances with those of similar-sized vehicles [15] | U.S. | Chi-square and Fisher’s exact tests | 1997–2001 | 0.9 |
| 6 | Becker L.R. et al. | 2003 | Relative risk of injury and death in ambulances and other emergency vehicles [27] | U.S. | Ordinal logistic regression analyses | 1988–1997 | 0.83 |
| 7 | Clawson J.J. et al. | 1997 | The wake-effect—emergency vehicle-related collisions [28] | U.S. | Mean values and 95% CIs | Questionnaires; 1996 | 0.68 |
| 8 | Ray A.M., Kupas D.F. | 2007 | Comparison of rural and urban ambulance crashes in Pennsylvania [29] | U.S. | Chi-square and Fisher’s exact tests | 1997–2001 | 0.88 |
| 9 | Gałązkowski R. et al. | 2015 | Occupational injury rates in personnel of emergency medical services [30] | Poland | Descriptive analysis | 1 January 2008–31 December 2012 | 0.7 |
| 10 | Sanddal T.L. et al. | 2010 | Ambulance Crash Characteristics in the US Defined by the Popular Press: A Retrospective Analysis [21] | U.S. | Descriptive analysis and two-sample t-tests | 1 May 2007–30 April 2009 | 0.93 |
| 11 | Biggers W.A., Jr. et al. | 1996 | Emergency medical vehicle collisions in an urban system [31] | U.S. | Chi-square and Fisher’s exact tests | 1993 | 0.95 |
| 12 | Fournier M. et al. | 2013 | Crew and patient safety in ambulances: results of a personnel survey and experimental side impact crash test [32] | France | Frequency, percentages, and median with interquartile range | Survey; January 2007–December 2007 | 0.66 |
| 13 | Saunders C.E., Heye C.J. | 1994 | Ambulance collisions in an urban environment [17] | U.S. | Retrospective analysis, CI analysis | June 1989–August 1991 | 0.85 |
| 14 | Kahn C.A. et al. | 2001 | Characteristics of fatal ambulance crashes in the United States: an 11-year retrospective analysis [33] | U.S. | Pearson χ2 tests and logistic regression | 1987–1997 | 0.93 |
| 15 | Weiss S.J. et al. | 2001 | A comparison of rural and urban ambulance crashes [34] | U.S. | Two-tailed chi-square or Fisher’s exact test, odds ratio and 95% CIs | 1993–1997 | 0.95 |
| 16 | Schwartz R.J. et al. | 1993 | The prevalence of occupational injuries in EMTs in New England [35] | U.S. | Descriptive analysis | Questionnaires; 1990 | 0.82 |
| 17 | Watanabe B.L. et al. | 2019 | Is Use of Warning Lights and Sirens Associated with Increased Risk of Ambulance Crashes? A Contemporary Analysis Using National EMS Information System (NEMSIS) Data [16] | U.S. | Multivariable logistic regression | 2016 | 0.98 |
| 18 | Lai Y.L. et al. | 2018 | An intelligent IoT emergency vehicle warning system using RFID and Wi-Fi technologies for emergency medical services [36] | Taiwan | Descriptive analysis | 2011–2015 | 0.58 |
| 19 | Yilmaz A. et al. | 2016 | Work-related Injuries Among Emergency Medical Technicians in Western Turkey [3] | Turkey | Descriptive analysis | Interviews; 2015 | 0.8 |
| 20 | Reichard A.A., Jackson L.L. | 2010 | Occupational injuries among emergency responders [2] | U.S. | Classical variances of a stratified sample and 95% CIs | 2000–2001 | 0.8 |
| 21 | Gülen B. et al. | 2016 | Work-related injuries sustained by emergency medical technicians and paramedics in Turkey [4] | Turkey | Kruskal–Wallis, chi-square, and Mann–Whitney U tests with Bonferroni correction | Questionnaire; March 2014–July 2014 | 0.7 |
| 22 | Studnek J.R., Fernandez A.R. | 2008 | Characteristics of emergency medical technicians involved in ambulance crashes [37] | U.S. | Multivariable logistic regression, fractional polynomials, and Hosmer–Lemeshow and Wald chi-square tests | 2004 | 0.86 |
| 23 | Larmon B. et al. | 1993 | Differential front and back seat safety belt use by prehospital care providers [38] | U.S. and Canada | Mean, standard deviation, percentage, and kappa statistic | Survey; February 1991–December 1991 | 0.94 |
| 24 | Tennyson J., Maranda L., Darnobid A. | 2015 | Knowledge and Beliefs of EMS Providers toward Lights and Siren Transportation [39] | U.S. | Kolmogorov–Smirnov and Mann–Whitney U tests and histograms | Survey; 2014 | 0.95 |
| 25 | Ersoy G. et al. | 2012 | Why did the patient die? The relationship between ambulance accidents and death of patients: forensic medical issues [40] | Turkey | Descriptive analysis | 1996–2005 | 0.55 |
| 26 | Maguire B.J. et al. | 2002 | Occupational fatalities in emergency medical services: a hidden crisis [41] | U.S. | Descriptive analysis | 1992–1997 | 0.7 |
| Variables | Sub-Category | Survey/Questionnaire (SQ) | Data (D) * | Total |
|---|---|---|---|---|
| Outcomes n (%) | Collisions and/or Injury and/or Mortality | 5 (19% **) | 15 (58%) | 20 (77%) |
| Independent n (%) | Drivers’ Characteristics (age, sex, experience, etc.) | 4 (15%) | 14 (54%) | 18 (69%) |
| Collision Characteristics | 4 (15%) | 9 (35%) | 13 (50%) | |
| Vehicle Characteristics | 0 (0%) | 1 (4%) | 1 (4%) | |
| Environment | 3 (12%) | 9 (35%) | 12 (46%) | |
| Response mode | 2 (8%) | 9 (35%) | 11 (42%) |
Disclaimer/Publisher’s Note: The statements, opinions and data contained in all publications are solely those of the individual author(s) and contributor(s) and not of MDPI and/or the editor(s). MDPI and/or the editor(s) disclaim responsibility for any injury to people or property resulting from any ideas, methods, instructions or products referred to in the content. |
© 2023 by the authors. Licensee MDPI, Basel, Switzerland. This article is an open access article distributed under the terms and conditions of the Creative Commons Attribution (CC BY) license (https://creativecommons.org/licenses/by/4.0/).
Share and Cite
Delavary, M.; Ghayeninezhad, Z.; Lavallière, M. Prevalence and Characteristics of Ambulance Collisions, a Systematic Literature Review. Safety 2023, 9, 24. https://doi.org/10.3390/safety9020024
Delavary M, Ghayeninezhad Z, Lavallière M. Prevalence and Characteristics of Ambulance Collisions, a Systematic Literature Review. Safety. 2023; 9(2):24. https://doi.org/10.3390/safety9020024
Chicago/Turabian StyleDelavary, Milad, Zahra Ghayeninezhad, and Martin Lavallière. 2023. "Prevalence and Characteristics of Ambulance Collisions, a Systematic Literature Review" Safety 9, no. 2: 24. https://doi.org/10.3390/safety9020024