1. Introduction
Globally, motor vehicle crashes are estimated to account for 1.3 million fatalities each year [
1]. In the U.S., where fatal crashes are documented in the Fatality Analysis and Reporting System (FARS), the National Highway Traffic Safety Administration (NHTSA) reports that there were 38,824 fatalities in 2020, the highest recorded since 2007 [
2]. Through the analysis of police crash reports, it has been estimated that driver behavior is a critical factor in 90% of motor vehicle crashes [
3]. This has also been found in naturalistic driving research [
4,
5], where drivers are recorded using in-vehicle cameras while operating their own vehicles for an extended period. These studies have shown that drivers engage in distracting activities around 50% of the time while they are driving [
4,
6,
7]. Distracting activities collectively are associated with a twofold increase in crash risk relative to model driving (OR = 2.0, 95% CI: 1.8–2.4), where drivers are alert, attentive, and sober [
4].
Distracted driving that results from interacting with technology is of keen interest because of how both in-vehicle technology and driver behavior are evolving. In their seminal study on the prevalence and risk of activities relative to model driving, Dingus et al. [
4] found that interacting with a handheld mobile phone occurs 6% of the time, and has a risk that is 3.6 times higher than model driving (95% CI: 2.9–4.5). This risk is significantly impacted by tasks that involve substantial visual-manual interaction. For instance, dialing on a handheld phone was found to have a risk that is 12.2 times higher than model driving (95% CI: 5.6–26.4), texting on a handheld phone has a risk that is 6.1 times higher than model driving (95% CI: 4.5–8.2), and reaching for a handheld phone has a risk that is 4.8 times higher than model driving (95% CI: 2.7–8.4). Other mobile phone tasks such as browsing and talking have risks that are 2.7 (95% CI: 1.5–5.1) and 2.2 (95% CI: 1.6–3.1) times higher than model driving, respectively.
Dingus et al. [
4] also investigated the risk of interacting with an in-vehicle infotainment system. They found that adjusting an in-vehicle radio has a risk that is 1.9 times higher than model driving (95% CI: 1.2–3.0). This provides an important comparison because both the Alliance of Automobile Manufacturers [
8] (who are now called the Alliance for Auto Innovation) and NHTSA [
9] set manual radio tuning as the benchmark task for assessing a task’s visual demands. This was done because radio tuning is prevalent in vehicles, it was available in vehicles before the digital age, and the resultant distraction was considered reasonable for a driver to experience while driving. In general, both NHTSA and the Alliance have taken the position that a task that has similar or lower crash risk when compared to tuning a radio is reasonably safe [
9,
10]. Dingus et al. [
4] found that adjusting the climate controls has a risk that is 2.3 times higher than model driving (95% CI: 1.1–5.0), and that adjusting non radio/climate controls (such as using a touchscreen interface) has a risk that is 4.6 times higher than model driving (95% CI: 2.9–7.4). This higher risk relative to tuning a radio suggests that touchscreen interface complexity, particularly for touchscreens that existed at the time, may be a factor.
The above risk estimates are influenced by the severity of the crashes included in the analysis [
10,
11], the type of driving selected as a baseline comparison [
10], and how many tasks occur alongside the task of interest [
12]. Generally, analyzing just severe crashes instead of severe and minor crashes together (or even including near-crashes in the analysis) leads to a higher but less precise risk estimate [
11,
13]. Furthermore, analyzing crash risk relative to model driving (where drivers are alert, attentive, and sober) will inflate risk estimates compared to when analyzing crash risk relative to general driving (where all tasks other than the task in question are included in the baseline). This is important to consider when comparing safety measures across studies [
14]. In a follow-up study, Dingus et al. [
10] later performed two analyses that: (1) analyzed more severe crashes (by only analyzing injurious and property-damage crashes, as well as police-reportable crashes, and omitting tire strike crashes) and (2) investigated the risks of secondary tasks relative to all driving. They found that conversing on a mobile phone and adjusting the radio were not associated with an increased crash risk. They also found that the risk of conversing on a mobile phone was lower than tuning a radio. The study concluded that tasks that are predominantly cognitive interactions are not associated with an increased crash risk. Taken together, these findings support a direction that has been taken to promote natural voice interfaces as a means to enable a way to interact with technology while driving that poses acceptable levels of distraction to the vast majority of drivers.
It is important to minimize the distraction potential of any technology used while driving. This is particularly true as infotainment systems continue their digital transformation. Simplicity and familiarity are key design principles to follow, as this can make infotainment systems less confusing to drivers and less demanding [
15]. As stated above, both NHTSA and the Alliance specify limits on an infotainment system task’s visual demands. However, there are limitations to the application of these guidelines to interface design. First, the guidelines do not account for the visual demands of short tasks performed in sequence. Antecedent and dependent tasks linked together [
16] can lead to extended total eyes-off-road time durations. Second, the guidelines do not account for the visual demands of a short task performed in repetition. Third, they do not address drivers looking for the next best available option when a task is truncated to meet the guideline criteria. For instance, a Google study found that users do not stop browsing Android Auto™ when they reach the end of a list; they instead look for the next best available option by revisiting previous browsed items. Finally, placing restrictions on infotainment system design can lead drivers to use their smartphone instead to complete a task, which, as noted, comes with a higher risk. A holistic approach to minimizing driver distraction is needed.
One way that in-vehicle infotainment systems can reduce driver distraction is through attention management [
17]. Attention management is the consideration of how attention is allocated to the road over space and time [
18,
19,
20,
21]. The concept originated from a number of studies that used glance-based algorithms to assess the combined effects of glance duration and glance frequency over time in predicting safety outcomes [
7,
21,
22,
23,
24,
25,
26,
27,
28]. The premise is as follows. Glancing away from the road to perform a task degrades drivers’ situation awareness. Situation awareness [
29] as applied to driving can be thought of as the knowledge of what is around the vehicle, how objects are moving, and whether collision potential is increasing [
30]. It is the ability to recognize and avoid conflict scenarios. Looking back at the road rebuilds situation awareness. In exploring the application of the AttenD algorithm, Seaman et al. [
30] describe what attention to the road is needed for full situation awareness. They summarize that it takes approximately 0.2 s of on-road viewing to establish basic perception of a scene (or Level 1 awareness) [
31]. It takes on the order of 0.5–1.5 s to establish Level 2 awareness (i.e., comprehension) such that a driver is appropriately responsive to bottom-up cues that signal a potential impending hazard [
31,
32]. Finally, it takes on the order of 4–6 s to establish Level 3 awareness (i.e., prediction) in order to appropriately detect hazards using both bottom-up and top-down cueing [
30,
33]. Long glances back to the road have been found to be critical for maintaining good vehicle control and recognizing unfolding conflicts [
34,
35,
36]. Therefore, drivers making long glances to the road build and maintain situation awareness, which helps them observe cues of potential or emerging conflict scenarios so that they can be avoided. Situation awareness is a key aspect of defensive driving, where crashes are prevented by avoiding conflict scenarios.
Purpose
The purpose of this study was to investigate whether long on-road glances taken in the middle of an infotainment system browsing task could improve drivers’ situation awareness and lead to improved response performance to a surprise event presented immediately after browsing ended. Based on the research described above, one would expect that as drivers perform a browsing task, their awareness of the objects around them, how they move, and whether a conflict will occur degrades. In theory then, drivers temporarily pausing browsing to make long glances back at the road should help them rebuild situation awareness. If drivers are successful at rebuilding situation awareness during this pause, then they should be more aware of what could happen around them upon completing the task, and thus be better at responding to a conflict that occurs afterwards. In general, this study was designed to help investigate the role of Level 3 situation awareness in both conflict and crash avoidance. Note, this study did not directly measure situation awareness using traditional methods [
37]. Instead, it investigated drivers’ self-reporting of hazard awareness and response performance to a surprise event. The hypotheses and analyses were guided by situation awareness principles.
2. Materials and Methods
2.1. Approach
The study consisted of a controlled test track evaluation using an instrumented vehicle. A total of 32 drivers completed a two-hour drive while an experimenter sat in the front passenger seat. Participants performed a series of infotainment system secondary tasks using Android AutoTM. Upon completing the final task, a surprise event was presented that required the drivers to detect and respond to an in-path hazard. Their awareness of the hazard and response performance were then measured.
2.2. Participant Demographics
A total of 16 females and 16 males participated in the study. Their ages ranged from 20 to 65 years (mean of 41 years). Few participants (5 of 32) reported using Android AutoTM (manufactured by Google, Mountain View, CA, USA). Due to COVID-19, participants wore a mask during the entire study. A plastic divider was also added between the driver and the in-vehicle experimenter.
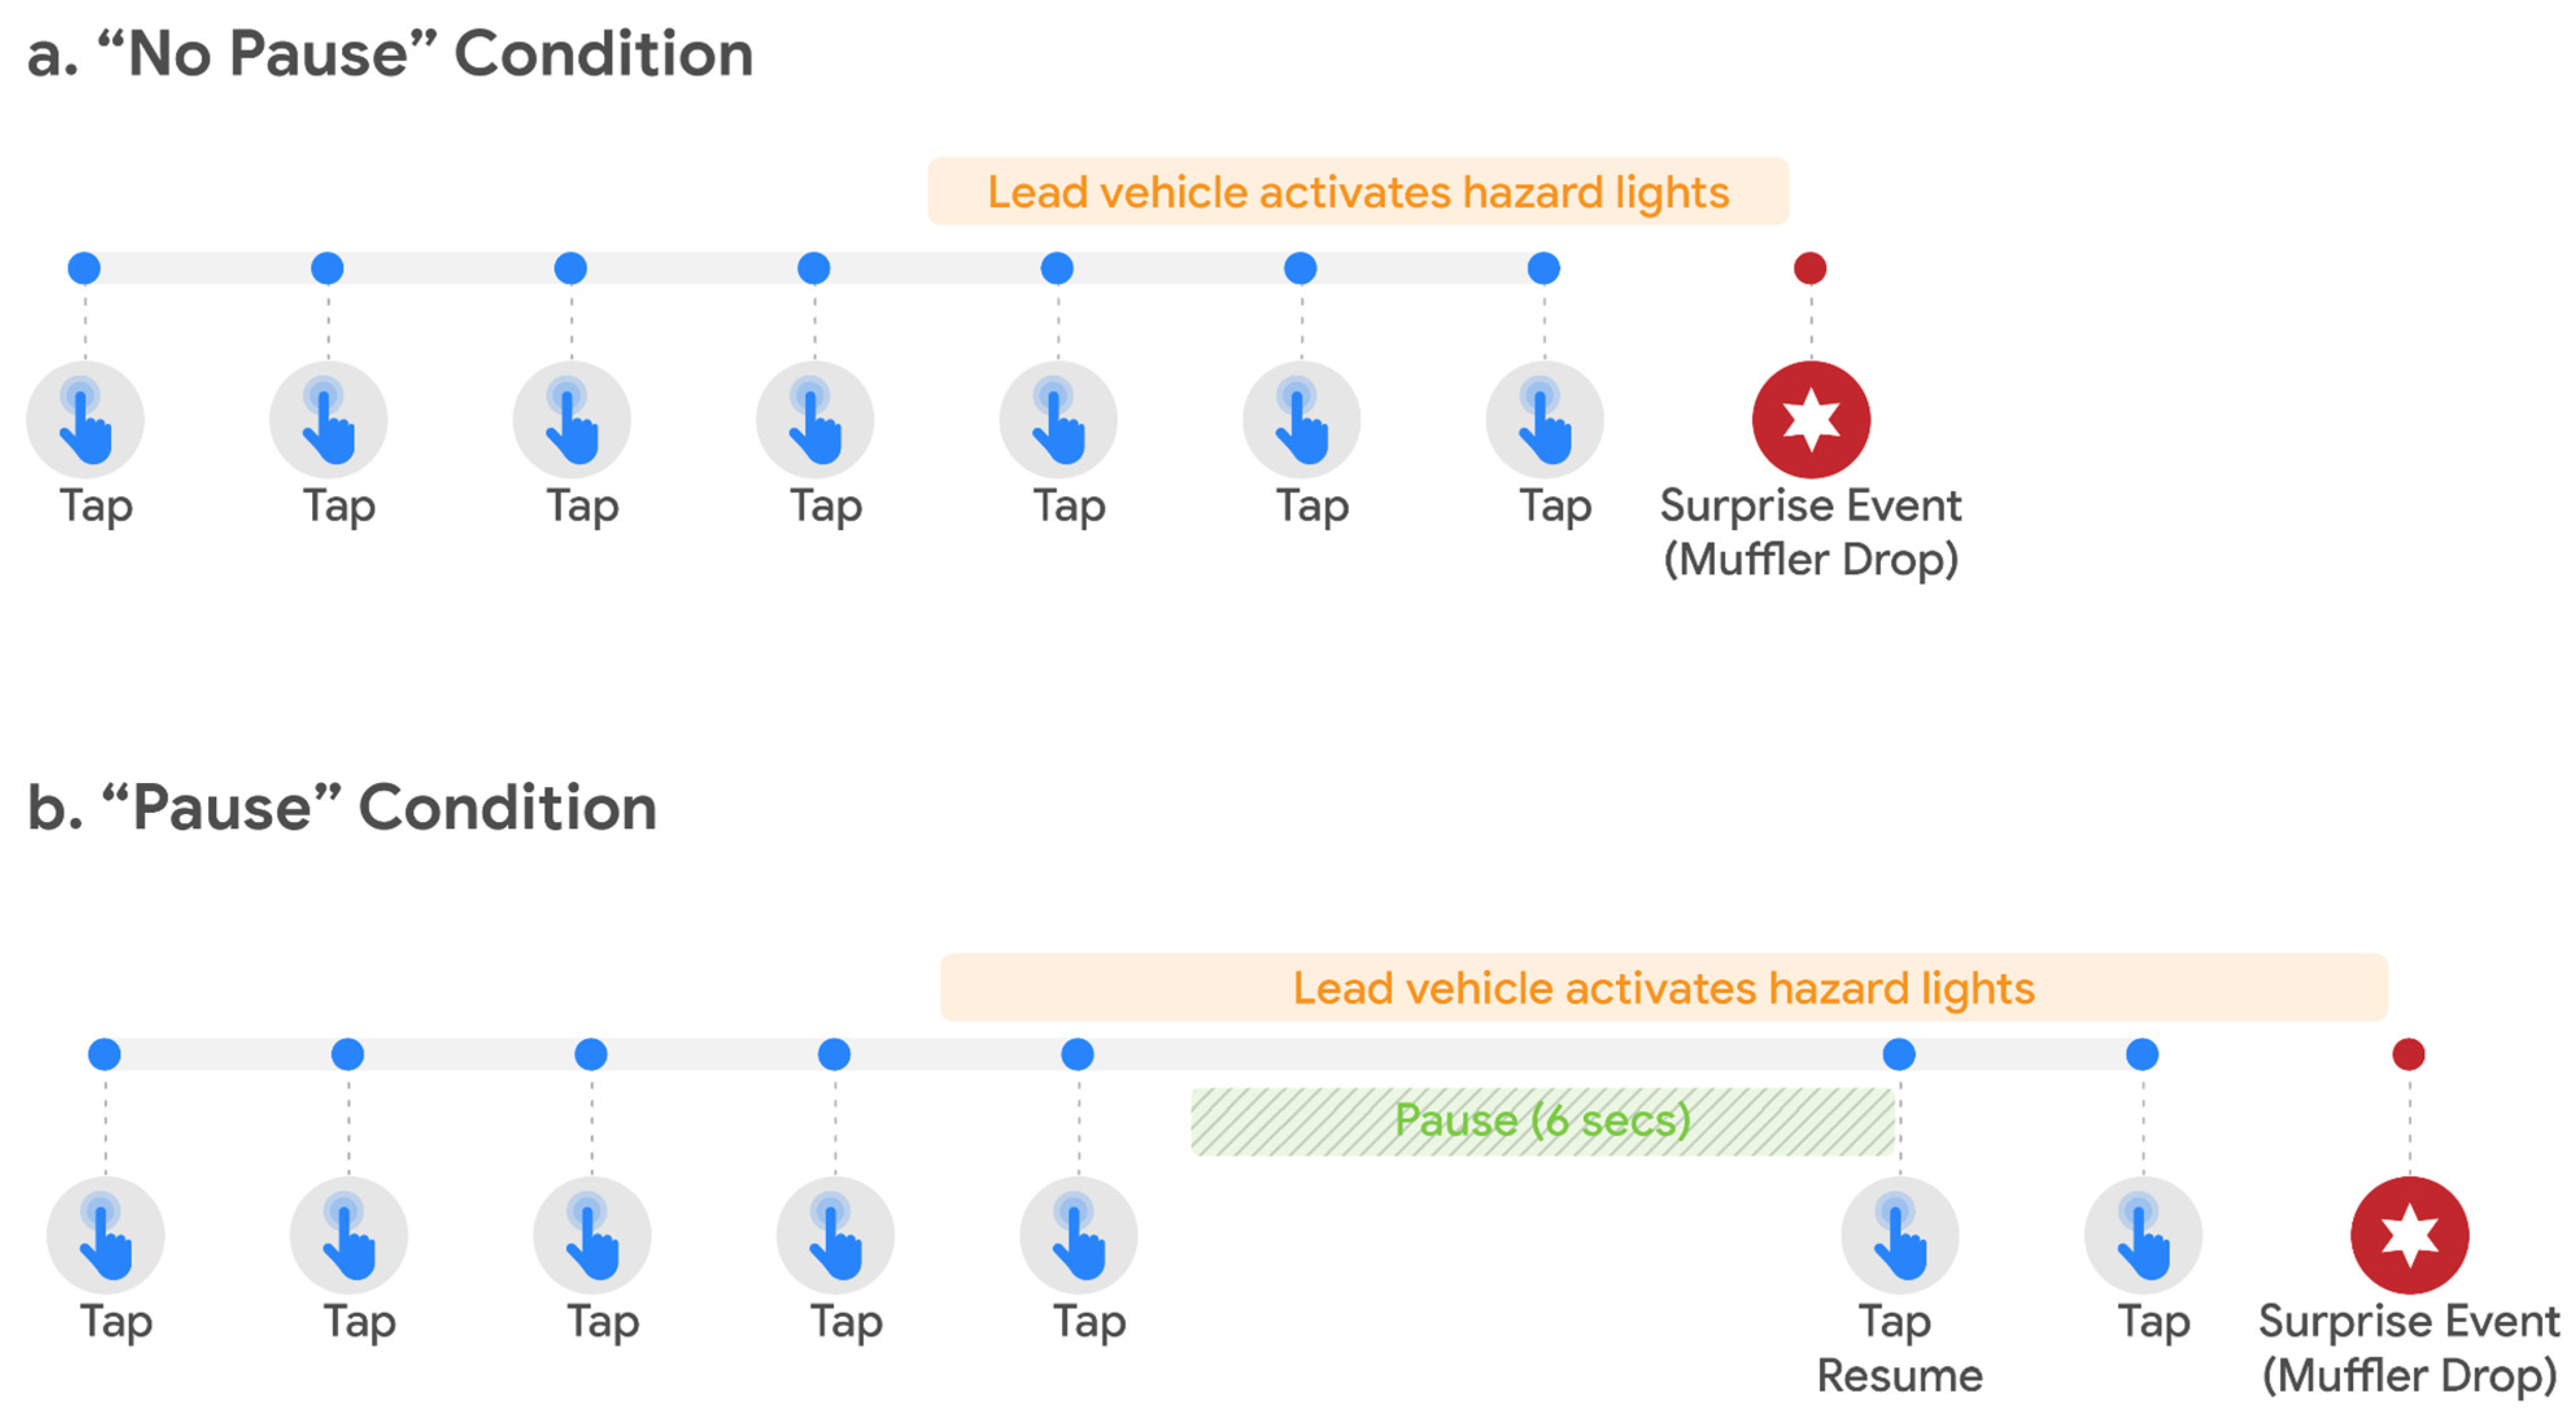
2.3. Study Design
Drivers were assigned to one of two groups (“Pause” and “No Pause”) prior to being exposed to the surprise event. The study varied whether or not task interactions were temporarily paused for a period of 6 s (“Pause” condition) or drivers were allowed to complete the task without interruption. This one-factor between-subjects experimental design was used to investigate whether pausing mid-task affected drivers’ awareness of and response to an in-path hazard.
2.4. Study Vehicles
The study vehicle, a 2019 Chevrolet Malibu, was equipped with a Data Acquisition System (DAS) capable of recording a variety of data, both electronic and video, in real time from a suite of sensors and cameras inconspicuously mounted within the vehicle. Driving performance data were sampled at a rate of 30 Hz throughout the study session. The vehicle was also outfitted with a supplemental passenger-side brake pedal accessible to the front-seat experimenter. This pedal was connected directly to the vehicle’s primary brake pedal through a cable and afforded researchers the ability to slow or stop the vehicle as needed. Cameras placed within the vehicle cab captured views of the forward road scene, driver face, and over-the shoulder cabin views, among others (refer to
Figure 1). Recorded video was time-stamped to synchronize views with the data stream.
A second study vehicle was used to stage a car-following scenario and the surprise event scenario. After being cued by the in-vehicle experimenter, the lead vehicle deployed a realistic foam rubber muffler from beneath it to present a realistic in-path hazard (refer to
Figure 2).
2.5. Study Task
The infotainment system task consisted of tapping through a popular media app’s menu in Android AutoTM to search for a specific playlist. Android AutoTM was used because it allowed digital media from the mobile device to be browsed and played by swiping and tapping on the display. The task comprised the same incremental steps for each participant:
Start from app home screen;
Driver selects “Your Library” menu item (4th item in list);
Driver selects “Playlists” menu item (1st item in list);
Driver scrolls to select “Dance Music” (7th item in list);
Driver taps on “Dance Music” to complete the task.
Participants were first shown how to complete this task in a stationary vehicle. Following an introduction to the driving route on the test track, participants were given opportunities to practice the task while operating the vehicle in motion. This multi-step task took 11 s on average to complete while driving. The mobile phone was not used during the task and remained stored during the drive.
2.6. Dependent Variables
In order to assess driver situation awareness, the dependent measures of interest were drivers’ precautionary behavior, level of surprise to the hazard, response time, response magnitude, and avoidance outcomes.
2.7. Study Procedures
Participants were screened to ensure that they met the study eligibility criteria (e.g., licensed drivers, regular smartphone user, etc.). Upon arriving at the test site, they completed an Informed Consent form and underwent simple vision and hearing screening tests. Study participants were informed that the purpose of the study was to evaluate a mobile application allowing drivers to interact with phone applications while driving. Participants were provided with an overview of the Android AutoTM task to be performed while driving. They then practiced this task once while stopped and 3 times while driving on the test track. The test track used was the Virginia Smart Road, a 2.2 mile long closed-course test track built to Virginia Department of Transportation standards. All participants were brought to a uniform level of mastery so that individuals were able to understand and complete the task without error. The study session lasted approximately 1.5 h.
Participants were accompanied by an in-vehicle experimenter responsible for setting-up the trials and instructing drivers when to execute and perform the tasks. All trials were initiated with the driver in position (driving at speed with cruise control set to 35 mph) with both hands on the steering wheel and their gaze forward. Drivers in the “Pause” group were trained to stop or interrupt their interactions in response to an audible tone, with the pause interval lasting 6 s. Drivers were cued to resume the task via a second distinct audible chime. Drivers in this “Pause” group were specifically instructed to look forward during the pause interval; this instruction was intended to assess the impact of a pause interval under favorable conditions and reduce variability among drivers. The surprise event trial (where a muffler was dropped), occurred approximately 15–20 min into the test session. All drivers completed the secondary task and were looking forward when the muffler was dropped into the vehicle’s path. Drivers were immediately debriefed to gather impressions of how prepared they were to detect and respond to the hazard.
2.8. Surprise Event Scenario
The surprise event was carefully scripted to provide opportunities for observant drivers to detect the emerging hazard situation as it unfolded and appropriately respond to the subsequent imminent threat. The lead vehicle, driven by an experimenter tasked with maintaining a 2–3 s following distance from the participant’s vehicle, activated its hazard lights soon after the driver initiated the infotainment system task. The intention was to provide a meaningful cue that a disruption could occur. Once the participant completed the secondary task, the in-vehicle experimenter remotely triggered the lead vehicle to drop the muffler around 1 s after the driver had returned their gaze back to the road. All drivers were looking forward when the muffler drop was initiated.
Figure 3 outlines the series of events drivers experienced during the surprise event trial.
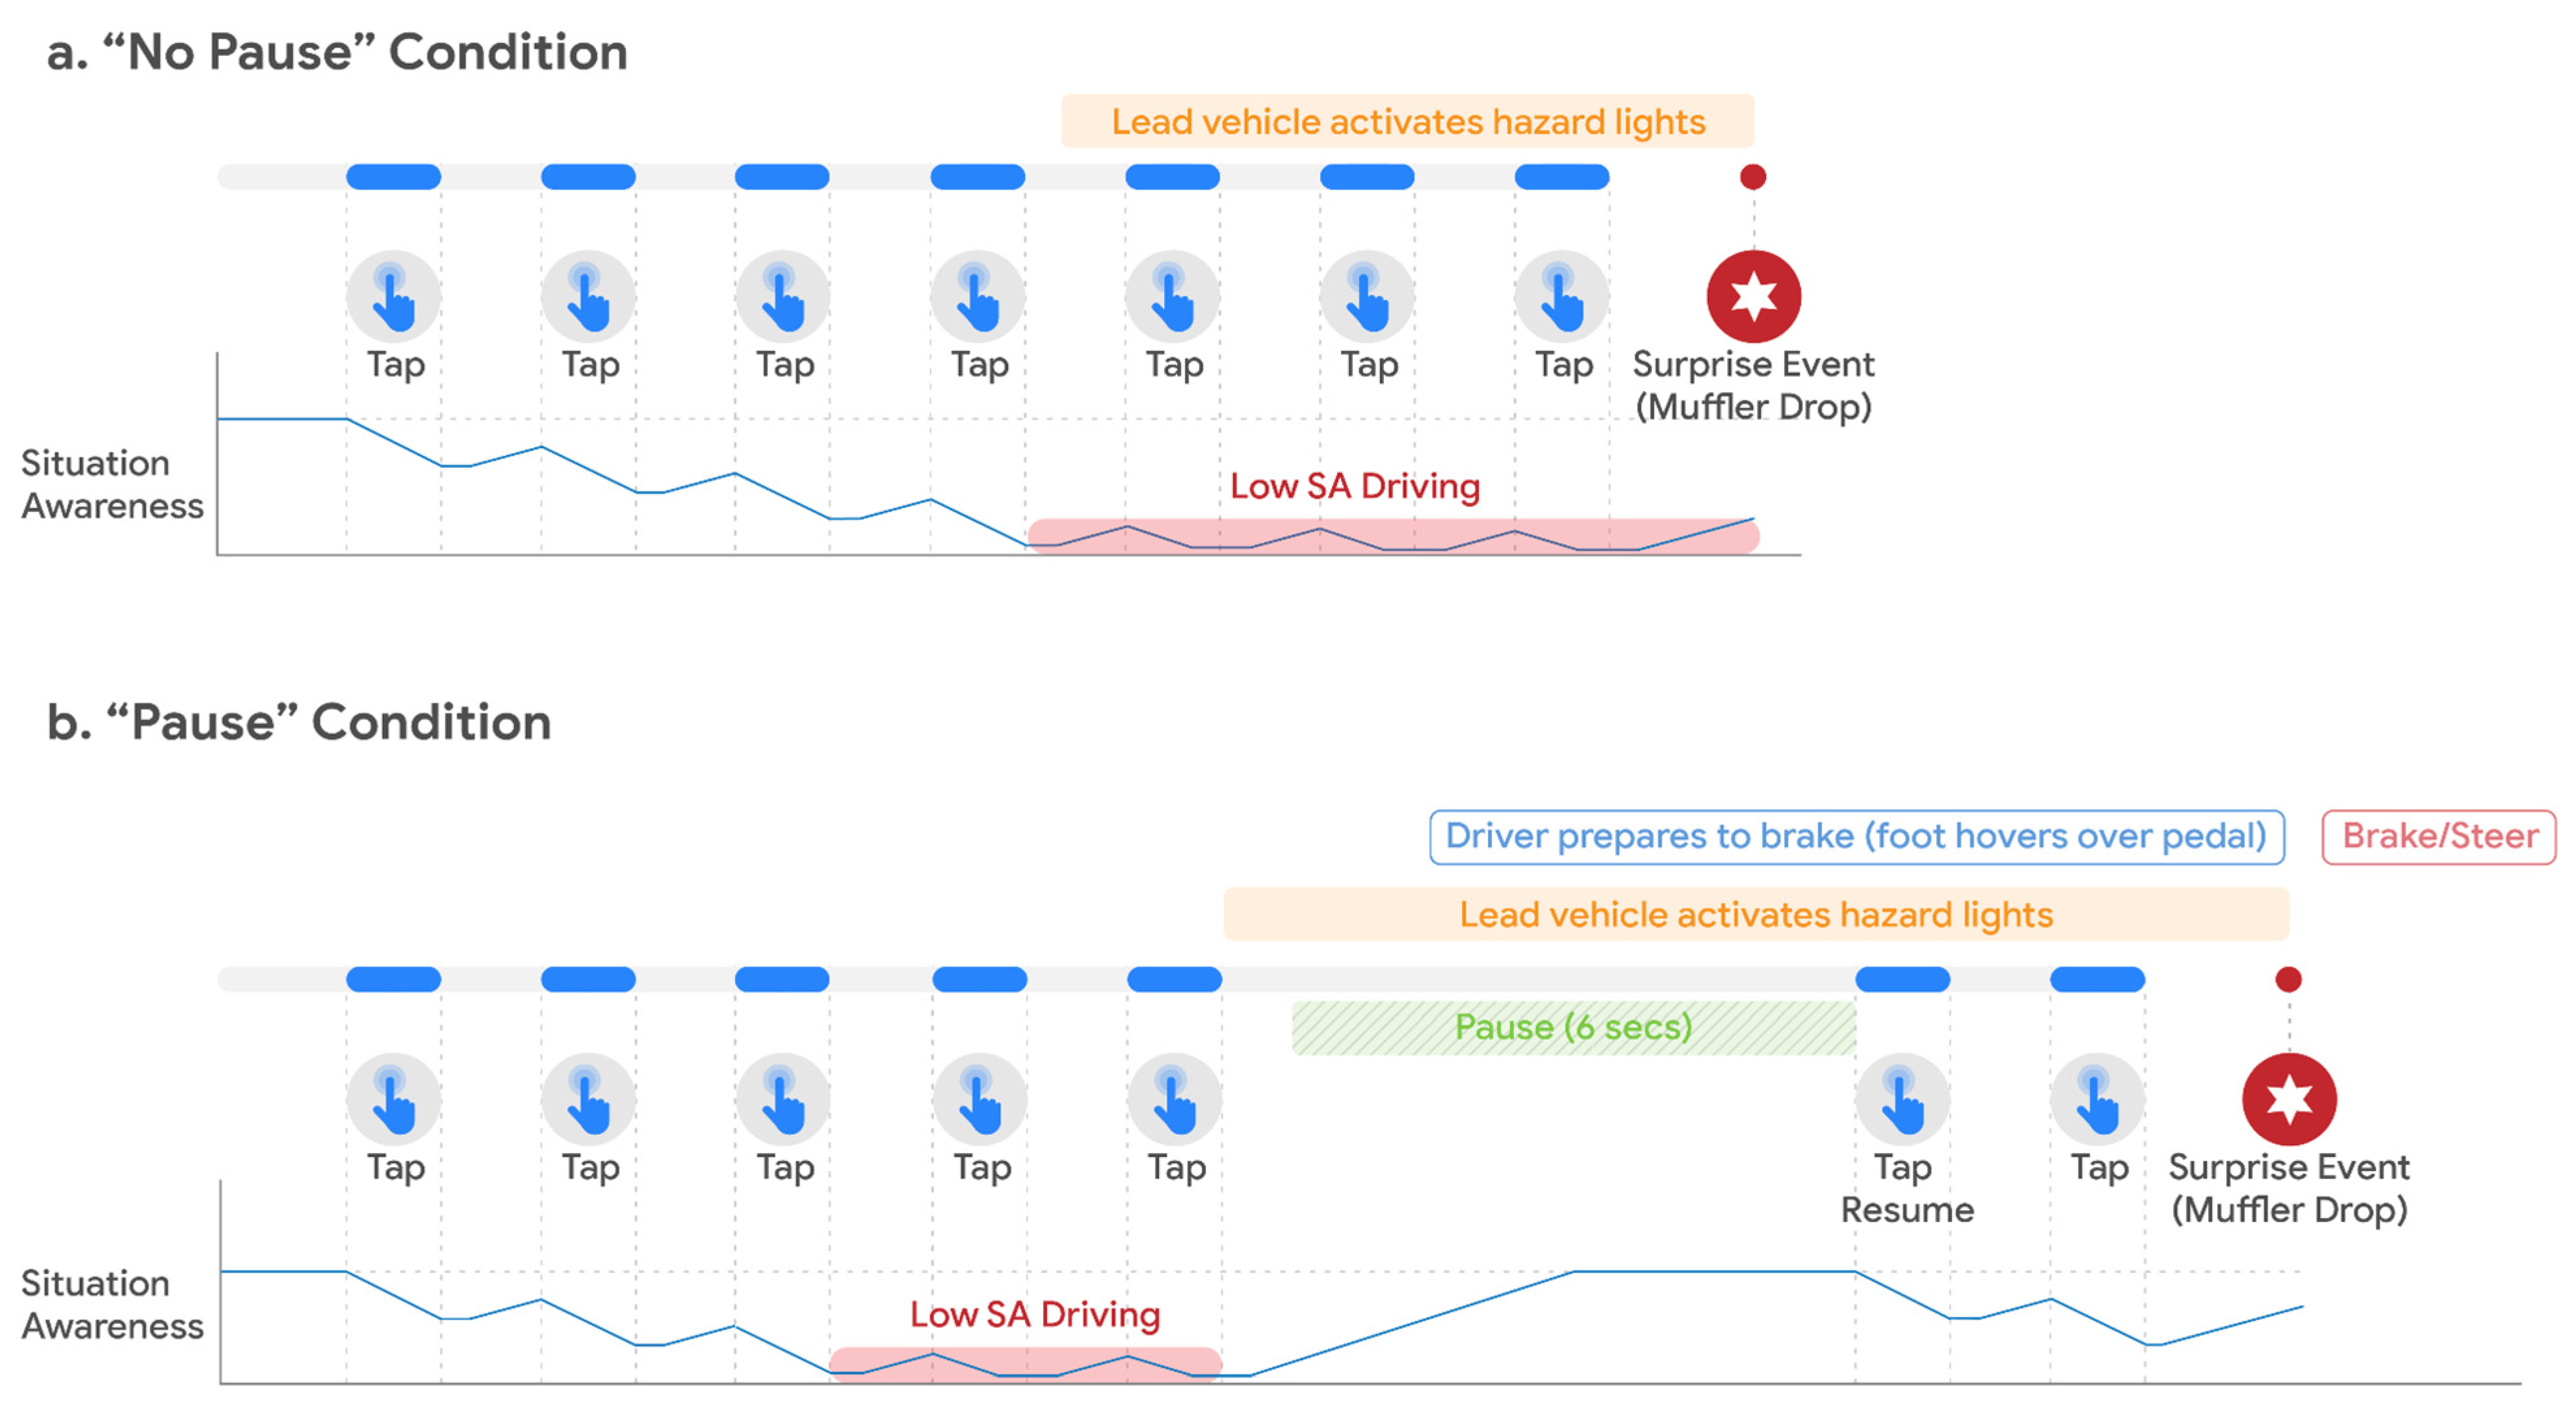
2.9. Hypothesis
Looking away from the road during a task degrades situation awareness of potential hazards. Long glances back to the road rebuild this awareness. Pausing mid-task to look back at the road theoretically serves two purposes: (1) it reduces the amount of time spent driving with low situation awareness, and (2) it leads to a higher level of situation awareness at the end of the task.
Figure 4 below plots drivers’ expected level of situation awareness relative to the experimental conditions. At the onset of this study, pausing mid-task was expected to lead to: (a) greater hazard awareness, (b) more precautionary behavior, (c) faster responses to the surprise event, and (d) a lower collision rate.
4. Discussion
In general, this study shows that interrupting infotainment system tasks by having drivers temporarily pause their interaction to look back at the road can increase situation awareness. Although increased situation awareness did not necessarily translate into greater avoidance outcomes or faster responses, drivers in the “Pause” condition tended to be more aware of the hazard lights, less surprised by the muffler hazard, and had less urgent, more measured responses (see
Table 1 for a summary comparison of the results). Drivers in the “Pause” condition were observed to have significantly lower magnitude inputs for both braking and steering relative to their “No Pause” counterparts. These measured responses could benefit transportation safety by reducing the chance of a loss of control avoidance maneuver and by imposing less drastic actions on downstream or adjacent traffic.
To compare, Seaman et al. [
30] found that drivers that experienced a 6-s open, 2-s closed occlusion interval while driving a simulated vehicle exhibited better lane keeping and fewer simulated crashes with a lead vehicle compared to drivers in a 2-s open, 2-s closed occlusion interval. They speculate that the longer on-road glances made by the drivers in the 6-s/2-s occlusion interval allowed them to see upstream traffic beginning to decelerate, which allowed them to better anticipate that the lead vehicle would also brake. This study combined with the current study supports the premise that being aware of upstream traffic conditions can help drivers prepare for proximal conflicts.
What were drivers who took a 6-s pause in browsing able to detect that the drivers in the “No Pause” condition missed? Vision science indicates that drivers use both foveal and peripheral vision to quickly get the gist of a visual scene [
38]. Drivers across both experimental conditions were observed to make short glances to the road in between taps to the display. These glances allowed them to perceive the presence of a lead vehicle, their following distance, and optic rate of flow (to gauge their position in the lane and travel speed). While much information from the periphery is retained during these short glances, some is lost, particularly details of individual objects in the scene [
38]. We believe that drivers in the “Pause” condition were able to use both their Useful Field of View and peripheral vision to scan various aspects of the forward road scene, foveate on the flashing hazard lights, and retain visual information that built up their spatial awareness that the situation could change. In contrast, many drivers in the “No Pause” condition likely missed the hazard lights because their on-road glances were short, they did not give time to scan the broader road scene, there was no expectation that they would need to foveate on the hazard lights, and the low hazard light conspicuity from daylight conditions likely did not grab their attention.
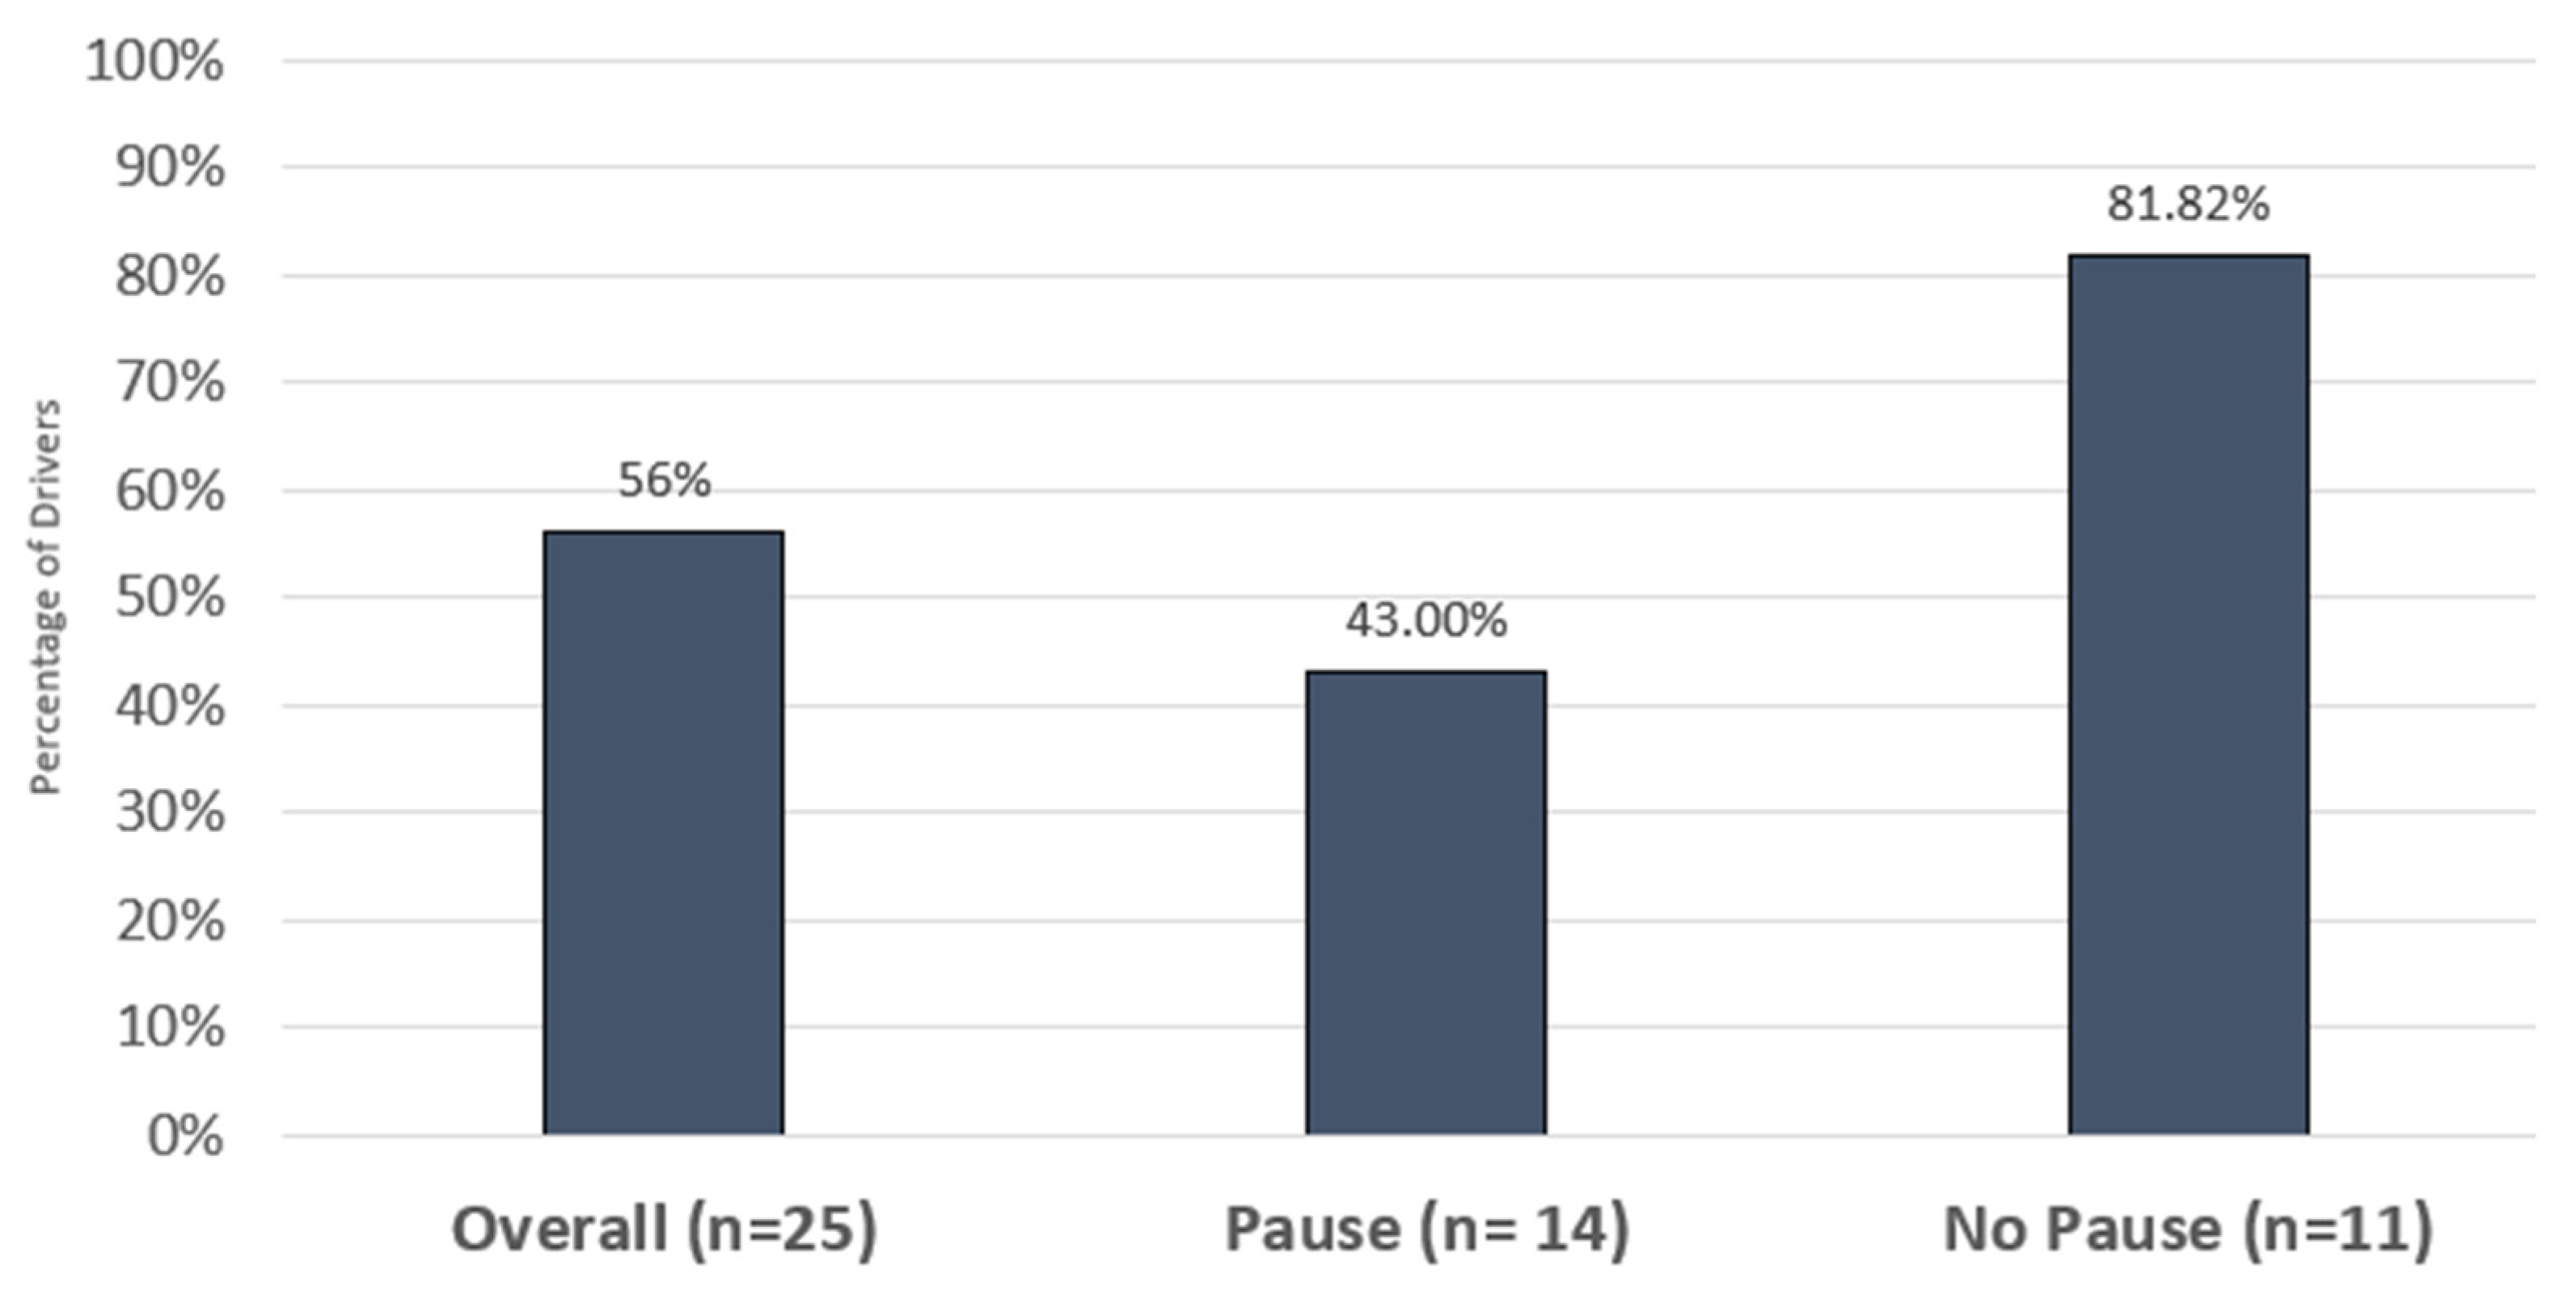
Another finding worth discussing is that all drivers in the “No Pause” condition steered or braked in response to the muffler drop, while 79% of drivers in the “Pause” condition steered or braked in response to the muffler drop. It is interesting that 21% in the “Pause” condition did not attempt an avoidance maneuver. These drivers lifted their foot up and/or covered the brake pedal, but did not brake. They reported that they thought they could drive over the muffler. This may be because they watched the lead vehicle drive over the muffler. It is unclear whether greater hazard awareness and less surprise led these drivers to think they could drive over the muffler. It would be interesting to compare drivers’ response performance to larger hazards to see if a lack of response resulted from a decision to drive over the muffler vs. indecision to brake or steer. To compare, Fitch et al. [
39] dropped a large box (larger than the muffler) in front of visually distracted drivers using a similar scenario. However, that scenario unfolded slightly slower, and drivers received an audible forward collision avoidance system alert when the box landed. Drivers in this study had more steering and fewer collisions (
Table 2). Less than 6% had no braking or steering, presumably because they could not react in time. This suggests that most of the 21% of drivers that hit the muffler in the current study made a purposeful decision to drive over it. We suspect drivers would have behaved differently in the study if a larger object had been presented.
The findings from this study can help inform an overall approach to driver distraction mitigation. It has been established that the longer drivers look away from the road, the more likely they are to miss cues of an unfolding hazard [
7]. The NHTSA and Alliance guidelines promote bounding the visual demands of an infotainment system to limit this risk [
8,
9]. However, because off-road glances can be made for a variety of reasons, including looking at brought-in devices, passengers, and external objects, drivers’ visual attention should be managed holistically. Systems that promote short off-road glances, as well as the rebuilding of situation awareness at the appropriate time and driving context, can support improved vehicle control and hazard response. This is the role that Driver Attention Support and Safeguards (DASSs) can play.
The DASS concept is not new. In 2006, Toyota introduced a driver monitoring system that audibly alerts drivers when they may not have been looking at the road. More recently, DASSs have received wide attention because drivers have been observed to take long off-road glances when using partially automated driving systems. This extreme behavior has led to driver monitoring requirements in the Euro NCAP [
40]. The value that DASSs can provide, however, goes beyond driver operation of L2 automation. Just like ADAS can detect and respond to changes in the road and help drivers avoid conflict scenarios, DASSs can help manual drivers stay aware of changing road conditions and avoid encountering conflict scenarios before an avoidance maneuver is necessary. The integration of driver monitoring systems (that use interior sensors to estimate driver attention) with workload management systems (that use exterior sensors to estimate driving difficulty) stand to be a viable way to incorporate driving context into driver attention management. Coughlin et al. [
41] describe how such a system can adjust interface characteristics, driver feedback, and Advanced Driver Assistance System (ADAS) operation to generate optimal driver attention to the road and well-being.
Gaze-based DASSs stand to be the most accurate by tracking both lizard gaze patterns (where the eyes move while the head is stationary) and owl gaze patterns (where the head moves while the eyes are stationary) [
42]. For this reason, the Euro NCAP driver monitoring test protocol will require gaze tracking. Legacy cars that do not have gaze nor head trackers can still employ DASS principles, however. For instance, Android Auto™ employs a temporary browsing restriction when the number of taps on the screen exceeds a set threshold over a period of time. The temporary lockout reminds drivers to look back at the road to rebuild their situation awareness before the system unlocks, presents a chime, and allows the task to continue.
Adding DASSs does not mean any task or feature should be allowed while driving. Designers should minimize the demands of secondary tasks. However, instead of restricting access to content (which fails to stop drivers from browsing as they search for the next best option), such tasks should promote the division of tasks into a series of shorter subtasks separated by temporary restrictions that promote long on-road glances. A task’s visual demands can also be reduced by allowing subsequent executions of the task to be done in fewer steps via shortcuts, such as a “recent tasks” or “favorite tasks” menu option. This way, driver attention management enables slack in the system experience while still promoting shorter tasks.
In the long run, DASS feedback can coach drivers on how to manage their attention to and away from the road. Drivers can learn when to perform non-driving tasks and how to pace non-driving tasks with long pauses. Doing so can help them maintain better awareness of potential conflict scenarios so that they can be avoided altogether. This education is an important component to reducing crash risk, as age effects have been found with driver engagement in secondary tasks. Guo et al. [
43,
44] found that secondary-task-induced distraction posed a consistently higher threat for drivers younger than 30 when compared with middle-aged drivers. This suggests driving experience can moderate the inherent risk, perhaps because experienced drivers are better suited to select when and where to perform secondary tasks. On the other hand, it is important to continually assess the effectiveness of DASS systems in case technological coaching just leads to behavioral adaptation with no increase in safety.
As vehicles become more automated, a deeper consideration for how drivers interleave attention to and away from the road when performing non-driving tasks will be required. In applying a framework on task interruptions to conditional automated vehicles, Janssen et al. [
45] state that drivers need time to reacquaint with the driving task after task interruption. The amount of time needed depends on the complexity of the traffic situation and whether the driver has been keeping track of the driving environment before having to reorient to it. They suggest that it might not be realistic to expect human drivers to immediately respond correctly to a system-initiated request to transfer control. As such, a DASS in a highly automated vehicle will not be successful if it treats a system-initiated request to transfer control as a single stage event. Rather, the system will need to remain aware of the driving context and the drivers’ state to be most effective.
5. Limitations
This study took place on a controlled test track. Drivers were instructed when to perform the infotainment task. The manner in which they performed the task may not actually reflect how they perform the task when driving their own vehicle on public roads, where the stresses of life and traffic conditions can impact their behavior.
This study was performed during the COVID-19 pandemic. Several precautions were taken to avoid viral transmission, including having participants wear a face mask. This may have impacted how they performed the infotainment secondary task, their monitoring of the road, and avoidance maneuver performance.
Regarding the orchestration of the study. The muffler drop scenario was challenging to coordinate. The experimenters had to coordinate the task start, hazard light activation, task pause, muffler drop, and the proper placement of the muffler in the lane. These elements did not always align, and trials had to be dropped from the analysis as a result. Future studies will need to consider the likelihood of invalid trials in balancing the experimental design, as well as planning/budgeting driver recruitment.
Furthermore, drivers in this study had multiple crash avoidance options: they could have stopped, swerved left, swerved right, gone straight, or some combination of these maneuvers. Although testing took place on a two-lane road, the right shoulder was wide enough to allow a right swerve if a driver desired to do so. The available options make it hard to determine whether drivers truly made the right choice. Future research may want to follow a similar approach while limiting the available options drivers can take to avoid a crash to just one (something that might be safer to test in a driving simulator). It is certainly challenging to find valid outcome variables in traffic safety studies.


