Article

Development and Reliability Review of an Assessment Tool to Measure Competency in the Seven Elements of the Risk Management Process: Part Two—Evaluation of the Individual Results from the RISKometric Tool

1
The School of Systems Engineering, College of People, Technology and Systems, Brisbane, QLD 4000, Australia
2
The School of Engineering, Sichuan Normal University, Chengdu 610021, China
3
Sustainable Minerals Institute (SMI), University of Queensland, Brisbane, QLD 4072, Australia
*
Author to whom correspondence should be addressed.
Safety 2022, 8(4), 71; https://doi.org/10.3390/safety8040071
Submission received: 14 March 2020 / Revised: 26 September 2022 / Accepted: 26 September 2022 / Published: 12 October 2022

Abstract

:
This study aims to test further the RISKometric previously developed by the authors. This paper is the second of three studies: it compares individuals’ RISKometric results in the first study with their performance in a risk scenario exercise in this second study; so, providing a reliability review for the RISKometric. A risk scenario exercise was developed that required participants to individually undertake a risk management process on a realistic, potentially hazardous event involving working at heights during simultaneous operations. Two observers assessed their responses, rating the participants’ competence in each of the seven risk management process elements. Twenty-six participants individually undertook the risk scenario exercise, known as round one. Analyses found that participants’ individual competence ratings given to them (by observers) when undertaking the risk scenario exercise were strongly and positively associated with the competence ratings given to them by their peers and downline colleagues in the RISKometric in an earlier study; for each of the seven elements in this second study. This finding supports the RISKometric as a useful tool for rating the competency of individuals in the seven elements of the risk management process. Work was also undertaken in preparation for a planned future third study whereby eight participants of the original 26 were selected to individually undertake the risk scenario exercise again to determine any difference in ratings, e.g., if there was a learning effect. The analysis found no significant difference over the two rounds.

1. Introduction

1.1. Background

People continue to be seriously and fatally injured at work because of workplace risks not being in a managed and controlled state. This is despite the enormous time and effort put into formal and informal risk management activities at regulatory, industry and organisational (including site-based) levels. As noted by Marling et al. [1], identifying potential deficits in current risk management practice that underpins work health and safety (WHS) efforts, particularly in high-risk industries, is therefore important.
The study of safety has increasingly focused on establishing safe systems of work and how people work within the boundaries of those systems. Human variability and our ability to adapt to a situation are now upheld as assets rather than liabilities to managing safety. Borys and Leggett [2] described this as a key characteristic of the current safety “era”. Pillay et al. [3] suggest that people play a vital role in the proper functioning of modern technological systems because of their ability to adapt. Yet harnessing peoples’ abilities and competence within work environments is exceedingly difficult, for example, implicit knowledge extraction from operators, Pillay et al. [3]. The knowledge held by individuals in work teams can go unrealised when it is stored tacitly or implicitly. Such knowledge is informal, learnt through on the job experience and hard to codify. Accessing it is especially critical for high-risk organisations that rely on teams to develop and assess safety knowledge. Providing opportunities to share and integrate individual member’s expertise is important (Lewis [4]).
When conducted competently, the risk management process, with its seven interdependent elements (Standards Australia and Standards New Zealand [5]), requires input from personnel at the organisation’s strategic, tactical, and operational levels. People in teams making decisions to manage and control risk are crucial considerations in WHS management systems and programmes, (Standards Australia and Standards New Zealand [5]). Yet, in practice, in our experience, there are many times when risk management is undertaken individually or by a couple of people rather than in a formal team.
Lyon and Hollcroft [6] caution that this can lead to inadequate risk management outcomes, including the failure to identify or fully manage/control some hazards. They also suggest that individuals working alone are less likely to consider the combined whole system risk, although this is also a potential failure for teams. They argue that organisations that do not use a well-rounded risk forum team (to capture a broader spectrum of risks) limit outcomes and can severely impact the ability to manage critical risks (Lyon and Hollcroft [6]).
As documented by Mathieu et al. [7], many definitions and taxonomies of work teams have been put forward by researchers. However, Reason and Anderson [8] define a work team simply as a group of somewhere between two and 12 individuals performing a common task, albeit with specialist roles. They generally have a well-defined brief and are temporary in nature, disbanding when the task is finished (Guzzo and Dickson [9]). A key advantage of using teams in risk management is that the ‘collective mind’ can prevent a bad decision from being made (Sasou and Reason [10]). Houghton et al. [11] discuss several biases that can impact the processes that individuals and teams use in managing risk, such as “small numbers”, the illusion of “control” and “overconfidence” while others have found that teams reduce decision-making errors or biases (Cooper et al. [12], Feeser and Willard [13] and McCarthy et al. [14]).
The composition of work teams has been gaining the interest of organisational psychologists; for example, one area of focus has been the attributes of team members and the impact of those combinations on process and outcomes (Mathieu et al. [7]), with research indicating it is of vital importance to performance (Guzzo and Dickson [9]). There appears to be two schools of thought about the composition of work teams. One view is that teams should be homogenous, and the other, that they should be heterogeneous, or what van Knippenberg and Schippers [15] refer to as similarity and diversity in attributes.
Mello and Ruckes [16] differentiate homogenous teams as those that share similar attributes. In contrast, heterogeneous teams are different in terms of background and experience in what Harrison et al. [17] confer as two domains: demographic and functional. van Knippenberg and Schippers [15] and Harrison et al. [17] define several categories within these domains, but the key characteristics most pertinent to the current study include professional development, education and organisational tenure (presumably in terms of duration and occupation). As such, the focus is on the functional domain. van Knippenberg and Schippers [15] suggest that organisations increasingly foster and use cross-functional and diverse work teams.
Hoffman and Maier [18] advocate that heterogeneity is a better criterion for assembling groups. It allows the work team to draw on different backgrounds and experiences and put forward better decision-making options. van Knippenberg et al. [19] agrees and argues further that the larger pool of resources that comes with heterogeneity may assist with dealing with non-routine problems, or what Mello and Ruckes [16] and Carrillo and Gromb [20] label as dynamic and uncertain situations. Mello and Ruckes [16] also concur and add that heterogeneous teams have advantages when the decisions’ stakes are high. Bantel and Jackson [21] and Madjuka and Baldwin [22] claim that this diversity in work teams is correlated with higher performance and innovation, or what Jackson et al. [23] call creativity. Guzzo and Dickson [9] also assert that heterogeneous teams perform better for cognitive, innovative and challenging tasks.
When using risk management to manage WHS in high-risk industries, where choices can critically impact safety and cause serious injury and/or loss of life, it could be argued that having a heterogeneous team is important. It is further hypothesised here that a collectively-optimised team in the seven elements of the risk management process can lead to better outcomes in the risk management process (i.e., outcomes that do not lead to serious injury or loss of life).

1.2. Research Programme

The first of our series of studies (Marling et al. [1]) developed a 360° performance review tool (given the industry-friendly title—RISKometric) to assess individuals’ competency in each of the risk management process elements. It was the first step in determining if a team, collectively-optimised in the risk management process elements, could complete a risk scenario exercise better than less optimised teams. The RISKometric garnered feedback from individuals, peers, upline, and downline colleagues. Consistent with other studies, results showed that feedback from peers and downline colleagues was less favourable than feedback given by upline colleagues and participants on their performance (self). One explanation for the high ratings of self and upline colleagues was that leniency or halo effects affected their feedback. Self-ratings, as might be expected, are especially prone to these effects (Fox et al. [24]; McEvoy and Beatty [25]; Atkins and Wood [26]). Study 1 results also showed that feedback from peers and downline colleagues was significantly and positively correlated, which supported evidence in the literature regarding reliable sources of feedback. Prior research has found that the feedback from downline colleagues and peers is more similar to objective measures of performance because their high level of interaction in tasks and activities allows them to assess better a person’s competencies and performance (Bettenhausen and Fedor [27]; Fedor et al. [28]; Wexley and Klimoski [29]; Kane and Lawler [30]; Murphy and Cleveland [31]; Cardy and Dobbins [32]).
This second study, described here, was undertaken to bolster confidence in using the RISKometric to eventually guide the formation of risk forum teams where, jointly the group has high competency levels in all the risk management process elements. In this second study, participants’ individual performances in a realistic risk scenario exercise are compared to their first study RISKometric ratings (self, peers, and upline and downline work colleagues).
The study put all participants (n = 26) individually through a realistic risk scenario exercise (Part A). Then, eight were randomly selected from those participants to be a control group to individually undertake the risk scenario again to determine if there was a learning effect on undertaking the risk scenario exercise a second time (Part B). Including the control group was a prelude to a planned future third study to examine a potential advantage of conducting the risk scenario exercise as a team compared to an individual.
This study reports:
  • The development of the risk scenario exercise;
  • The degree of association between RISKometric and individual risk scenario exercise ratings (Part A);
  • The degree of association between the control group’s risk scenario exercise ratings (Part B).

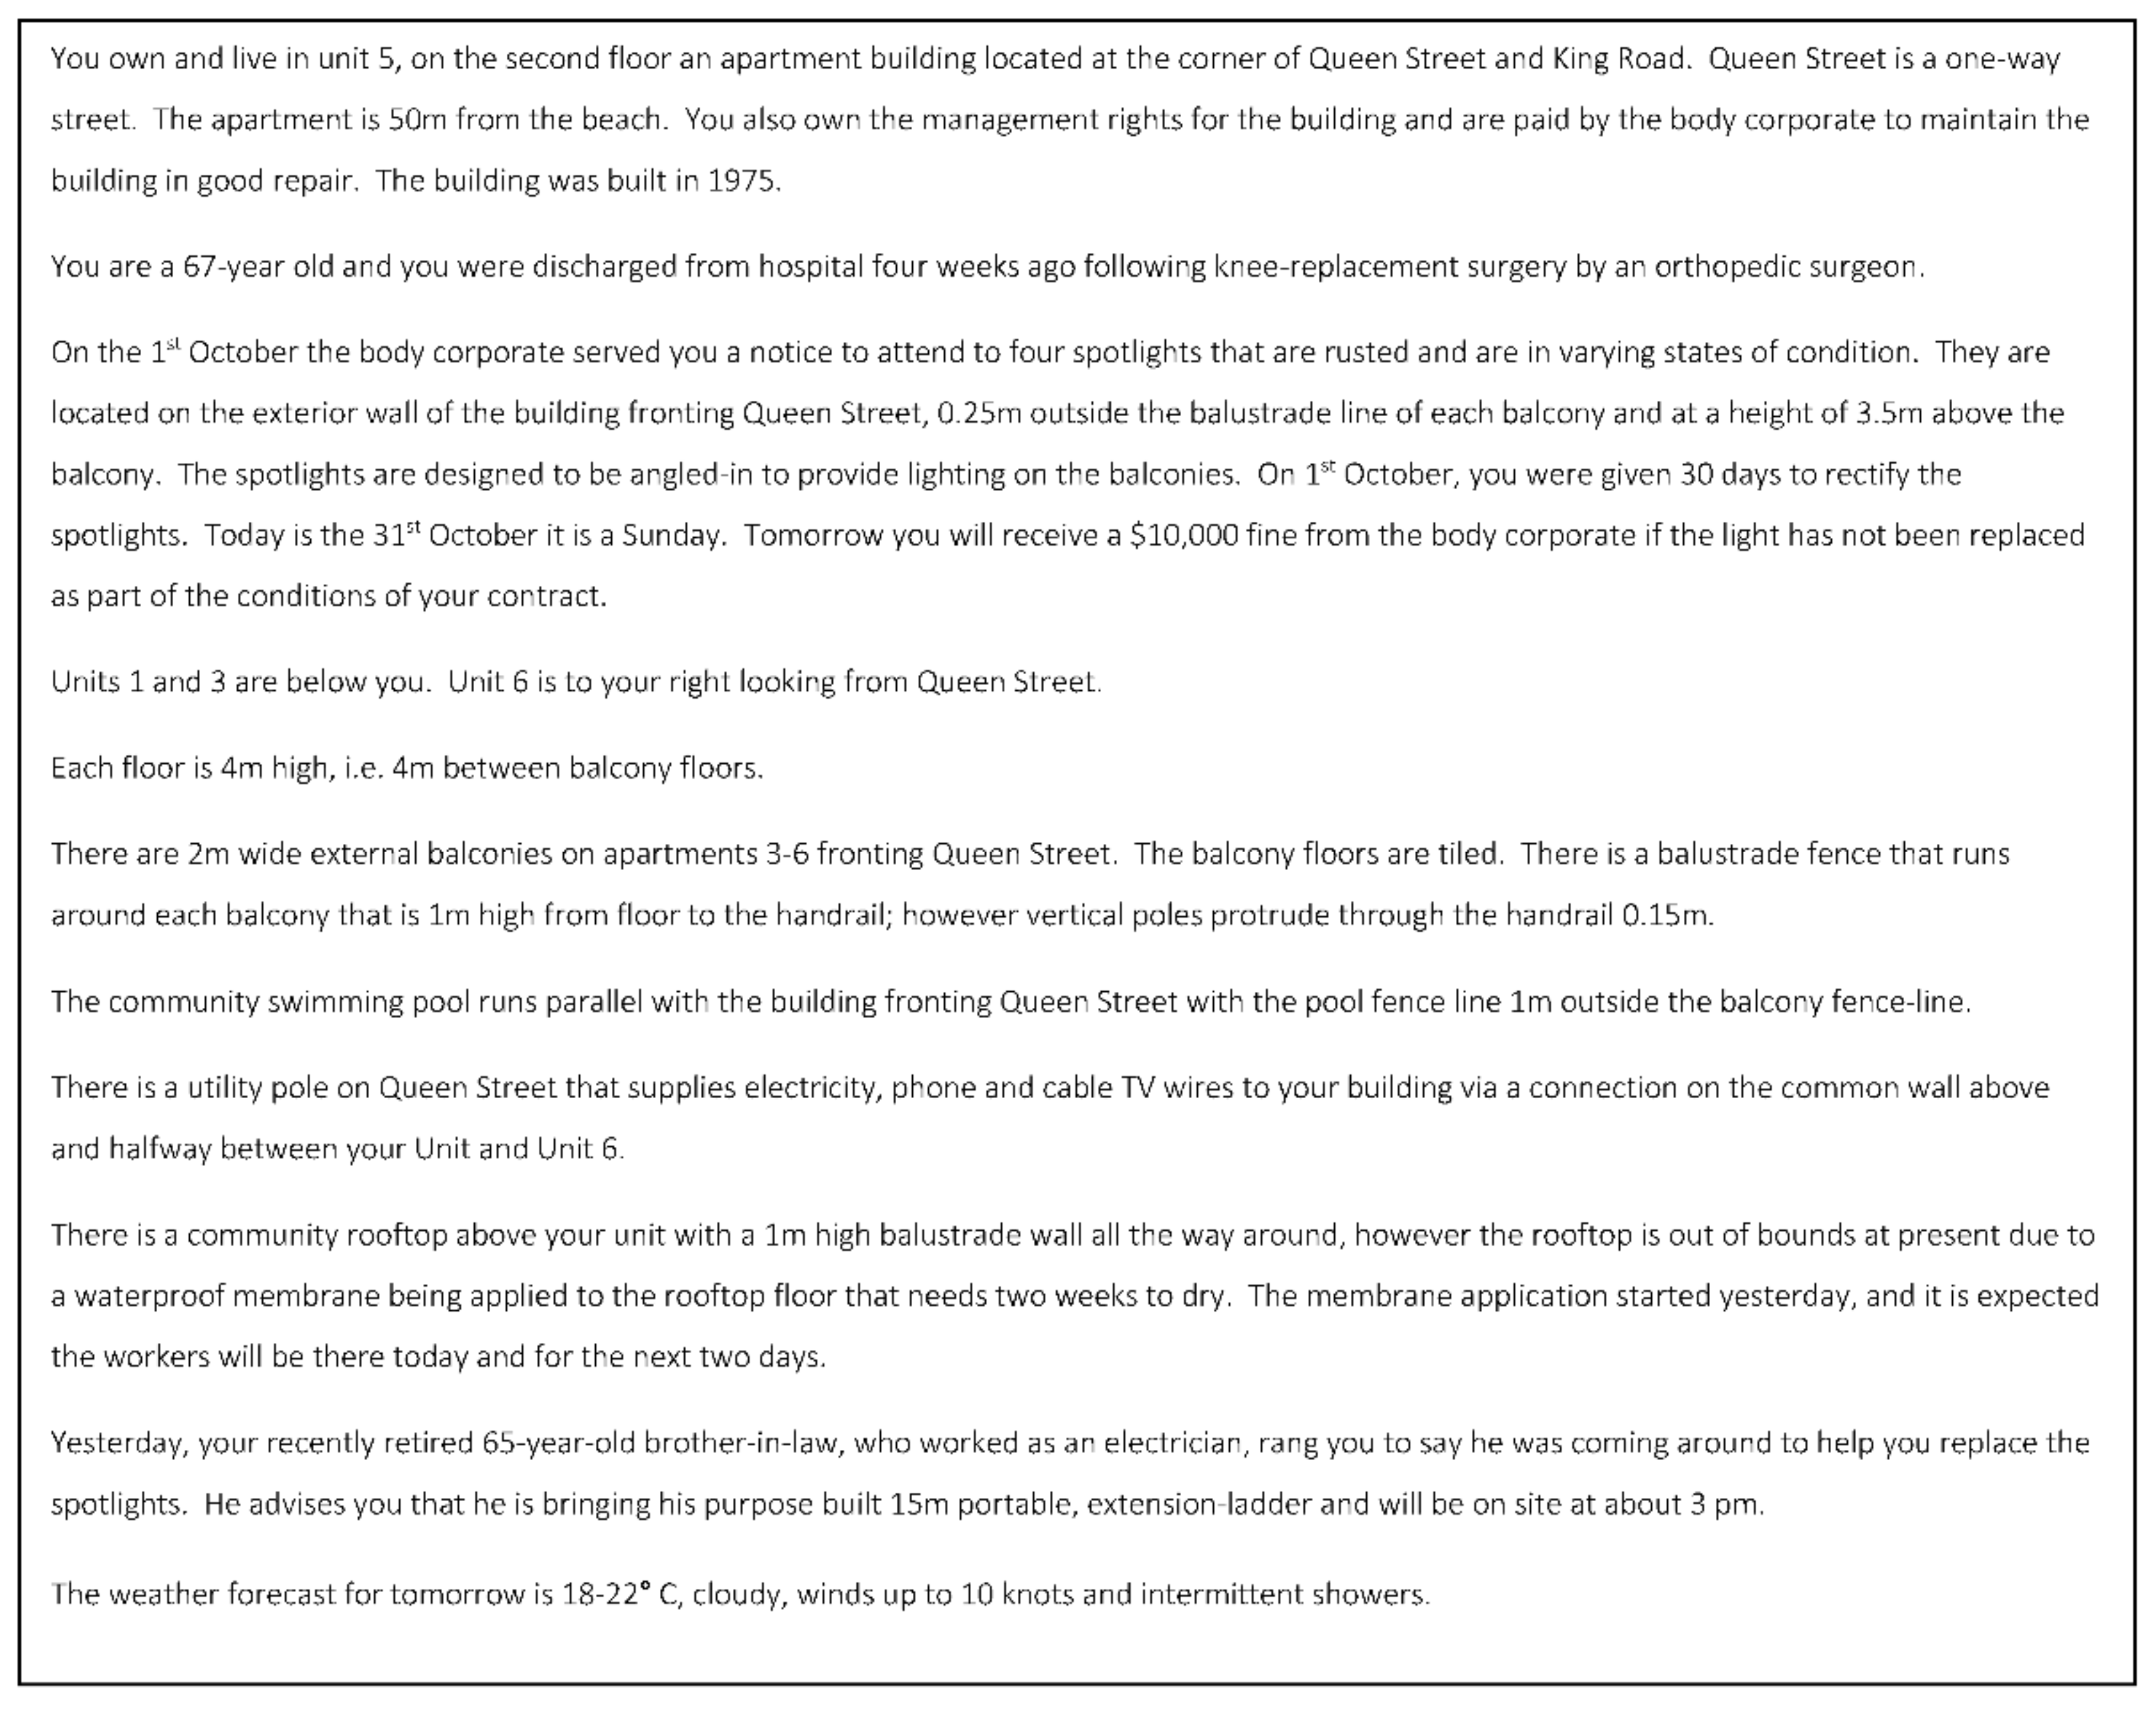
1.3. Scenario Planning Tasks

Scenario planning tasks are commonly used in organisations as risk management tools (Burt et al. [33]). They involve considering (or visualising) an event or condition in terms of its possible consequences and the responses that could be made to prevent, mitigate, or benefit from it. Schwartz [34], van der Heijden [35] and de Geus [36] all support that learning is a crucial outcome of scenario planning, and Chermack [37] adds that performance improvement should be another outcome. In particular, tasks facilitate adaptive organisational learning and organisational anticipation about uncertain events (van der Heijden et al. [38]). Marsh [39] discusses uncertainty as not knowing the issues, trends, decisions, and events that will unfold in the future. Chermack [37] suggests that scenario planning is a method of ordering one’s perceptions about the future based on decisions that could be made. It is a technique to improve strategic planning and van der Heijden [35] calls it a strategic conversation for learning. It can assist decision-makers in seeing things differently, broadening their understanding and consequently enhancing their planning ability (Burt and Chermack [40]).
The risk scenario exercise developed by the principal author for this second study met Burt and Chermack’s [40] two principles regarding creating a scenario-planning event. Firstly, the scenario outlines the permutations of uncertainties and the development of a resolution to bring the scenario to a successful end. Secondly, the scenario defines the current situation and the impact of these events on the future. These principles help participants make sense of “what was”, “what is” and “what could be”, noting that for the “what could be” component, there could be a number of them based on a series of outcomes that have not yet manifested. The scenario should account for how the “what could be” develops. This was left to the participants to develop as part of their work in the risk scenario exercise in the current context. Burt et al. [32] claim that at this stage, the participants are required to make their implied knowledge evident to others in developing the interconnecting uncertainties and given in a dynamic environment to cultivate plausible outcomes and solutions.
This second study aims to test further the RISKometric that was developed and discussed as part of the first study (Marling et al. [1]), comparing individual RISKometric results with individual performances in undertaking a realistic risk scenario exercise.

2. Materials and Methods

2.1. Participants

The original group of 26 participants from the first study (Marling et al. [1]) completed Part A of the current study. Their ages ranged from 28 to 64 years (M = 49.65 years, SD = 12.10 years), and there were 22 males and four females. They had a collective experience of 802 years in risk management (M = 30.84 years, R = 36 years, SD = 12.66), noting that they had been practising risk management in their vocations for a minimum of eight years. The participants were from the five tiers of various organisations conducting high-risk activities, e.g., mining, construction and transport, namely board members/senior executives (n = 3); senior managers (n = 9); middle managers (n = 4); supervisors/foremen/team leaders (n = 6), and operators/workers (n = 4).
Of that original group of 26 participants, eight were randomly selected to also participate in Part B of the current study—which was, to retake the risk scenario exercise after a period of eight months. They are known here as the control group and the purpose of their inclusion in the current study was to determine if there was a difference in undertaking the risk scenario exercise a send time, e.g., an improved rating may indicate there is a learning effect on an individual basis. Their results are described in the current study, as it is part of the incremental process of validating the original RISKometric measure (Study 1). Part A of the current study aims to test whether performance in the RISKometric is associated with performance in a realistic risk scenario; and Part B acts as a benchmark to compare the results of a future study involving the remaining participants in a teams-based risk scenario exercise (i.e., Study 3). Part B, therefore, is used as an estimate of what the team-based groups may have achieved had they simply repeated the risk scenario exercise individually. The control group’s (n = 8) ages ranged from 22 to 65 years (M = 54.1 years, SD = 12.7 years), and there were seven males and one female. They had a collective experience of 283 years in risk management (M = 35.4 years, R = 38 years, SD = 12.7). The participants were from three organisational tiers, namely board members/senior executives (n = 2); senior managers (n = 3); and supervisors/foremen/team leaders (n = 3).
The University of Queensland Human Ethics Committee approved the procedures of this study. The participants came from a group of people with professional ties to the researcher. They were selected on a stratified basis by the researcher on a convenience basis, i.e., known to the researcher and presumed willing to assist objectively (Sincero [41]).

2.2. Procedure and Material

The risk scenario exercise is outlined in Figure 1 and Figure 2.
The risk scenario used in the exercise involved a generic hazardous task rather than one specific to a mine or construction site. In this way, the task was more likely to be familiar to all participants. Although participants mainly had a mining or construction background, not all of them had worked in both environments.
The critical hazards in the scenario were working at heights and simultaneous operations (i.e., the concurrent execution of more than one task). These were selected based on the findings of studies conducted by Marling [42], which identified them as commonly occurring mechanisms of injury and fatality.
As participants’ performance was assessed in terms of the seven elements of the risk management process (As defined in Marling et al. [42], however, see Table 1 for an example of criteria for E1 “establishing the context”), the following complexities were added to the scenario so that competencies could be shown in each element:
  • E1 “establishing the context” competency was tested using ownership, roles, and scope issues to establish appropriate stakeholders and legal and regulatory frameworks.
  • E2 “risk identification” competency was tested using downside and upside (opportunities) risks, competing trade and infrastructure requirements, multiple consequences and other ambiguities such as fitness for work. Additions also included some consideration of financial penalties and compressed timeframes and some unknowns with weather conditions.
  • E3 “risk analysis” competency was measured by including a range of likelihood of events and the multiple consequences that could result from the hazards.
  • E4 “risk evaluation” competency was measured on factors such as comparison of the estimated levels of risk against the benchmark criteria, consideration of the balance between potential benefits and adverse outcomes and determining if the risk is acceptable or tolerable and mitigation and priorities to “so far as reasonably practicable” principles.
  • E5 “risk treatment” competency was measured in terms of tolerating, treating, terminating or transferring the risk in combination with the methodology to get the job done. Due to the multiple ways to undertake the task (e.g., by fixed or extending ladder, platform ladder, trestle ladder, scaffolding, elevated work platforms), this was the most extensive set of criteria for consideration. However, all elements in the risk management process were given an equal rating.
  • E6 “communication and consultation” competency was measured to determine who should be engaged and relevant information sources.
  • E7 “monitor and review” competency was measured to check that controls were in place and establish their efficiency for the given scenario.
A pilot study tested the risk scenario exercise for syntax and format, and some minor word changes were applied as a result of that pilot study. Eight participants completed the pilot test, and none had been involved in the previous studies, nor were they involved in any subsequent studies. Their ages ranged from 26 to 66 years (M = 49.50 years, SD = 12.72 years), and there were six males. There were representatives from each of the five management levels, namely: board members/senior executives (n = 1); senior managers (n = 3); middle managers (n = 2); supervisors/foremen/team leaders (n = 1), and operators/workers (n = 1).
They had extensive WHS and risk management experience and had a collective experience of 238 years in risk management (M = 29.75 years, R = 33 years, SD = 12.74) and had been practising risk management in their vocations for a minimum of six years.
In response to Burt et al.’s (2006) [33] concerns regarding scenario-planning tasks—that they generally lack a well-defined set of criteria on which to assess, the researcher designed an extensive assessment criterion to measure the participants’ performance. The detail of the criteria is too large to include in this paper; however, Table 1 is a summary of critical aspects considered for E1 “establishing the context”. Each of the seven risk management process elements was broken into measurable sub-components as detailed by Marling [1]. Each sub-component was assessed according to whether nil, partial or full evidence of the competency was sighted. Then, competence in the overall element was rated according to Marling [42]. This rating scale is the same as that used in the RISKometric in the first study (Marling et al. [1]).
The 26 participants were sent an email with the risk scenario description, the supporting illustration and risk scenario exercise instructions. Participants were given the following instructions:
  • Read the risk scenario narrative concerning the supporting diagram;
  • Undertake a risk assessment by any means you want—but you must do it without assistance from another person;
  • You can take notes and use other resources to complete the risk assessment;
  • You do not have to finish the task in one sitting;
  • While undertaking the task, record your thought processes and decisions either using the camera or your voice recorder on your computer;
  • It is important that you verbalise your thoughts and decisions while undertaking the task;
  • Once finished, send the voice/video file to the researcher, and
  • The process should not take more than 30 min, based on eight people completing a pilot risk scenario exercise with an average completion time of 27 min.
Participants were all busy people in their day jobs, and as such, they were requested to deliver their opinions by video or voice recording using their computers. However, some submitted a written response only, perhaps because of their technical limitations.
Participants’ results were sent back to the researcher in the following formats:
  • Twenty submitted video files (8 with supporting notations);
  • Four submitted voice files (2 with supporting notations), and
  • Two submitted written responses only.
Participants’ responses were assessed by two observers—the principal author and an independent risk expert. Each of them had at least 35 years of experience in risk management, that would have included frequent exposure to scenarios similar to the one developed for this study across multiple industries. The second observer was used to overcome any potential bias that might result from the researcher knowing the participants in their working environments. As previously described, each participant was rated for their competence in the seven elements of the risk management process. After the observers had given ratings, they met and agreed upon a joint final rating for each participant’s elements.
Approximately eight months after first completing the risk scenario exercise, the control group completed it a second time (Part B), using the same testing procedure, observers and assessment procedure. This time spanned the second study and a future study (third study), also known as rounds one and two.

2.3. Analysis Strategy

There are many ways to analyse the developed scenario, but this study aims to explore further the individual results to validate the RISKometric. The participants’ RISKometric ratings and risk scenario exercise ratings were compared for each of the seven risk management process elements.
A Spearman rank-order correlation coefficient test was conducted for ratings given for each of the seven elements to determine the consistency of ratings across the two observers (i.e., inter-rater reliability).
The raw data for the individual results, including the control group in the first round for the control group for the first and second rounds, can be found in Marling [42].
Inter-rater correlations were conducted for results from:
  • First-round completion of the risk scenario exercise (n = 26 participants), and
  • Second-round completion of the risk scenario exercise by the control group (n = 8).
Wilcoxon signed-rank tests were undertaken to determine whether the control group participants’ performance in the seven elements of the risk management process differed across rounds one and two. A statistical improvement over time (i.e., eight months interval) would indicate a learning effect, an outcome that needed to be considered when interpreting the experimental group’s results over time.

3. Results

3.1. The First Round of Individual Risk Scenario Exercise Results (n = 26)

3.1.1. Inter-Rater Reliability

Table 2 shows the medians and interquartiles for competency ratings for each of the risk management process elements as rated by the two observers. Wherever the observers were used to rate participants’ responses, and their ratings differed, the observers reviewed the participants’ responses again and rerated them. Where responses remained different, the observers reviewed their notes together and came to a consensus. In all cases, an agreement was achieved.
The Spearman rank-order correlation coefficient test showed that a strong positive relationship existed between the median ratings (collapsed across the seven elements) given by observers’ (rs = 0.955, p = 0.001) and that the correlation was statistically significant at the 0.01 level (2-tailed).

3.1.2. Comparison of the First-Round Individual Risk Scenario Exercise Results with Study 1 Results (n = 26)

Table 3 shows the medians (and interquartiles) for competency ratings given to participants in the risk scenario exercise and their earlier RISKometric results; for each of the seven elements of the risk management process. Table 3 also includes the three ratings given by participants’ colleagues and the participant’s self-rating (as reported in the RISKometric, Marling et al., 2020 [1]) and the agreed-upon rating provided by the two observers in the risk scenario exercise.
For all seven elements, ratings given by peers and downline colleagues (in the RISKometric) are similar to the agreed-upon ratings given by observers in the risk scenario exercise. Across all elements, ratings provided by self and upline colleagues are elevated compared to other ratings (as partly described in Marling et al. [1]).
For each element, the agreed-upon risk scenario exercise rating was found to be strongly and positively correlated with the ratings given by peers and downline colleagues in the RISKometric (as described in more detail below). This outcome builds on the key result from Marling et al. [1]—that showed a similar result.
The risk identification and analysis elements also found that the agreed-upon risk scenario exercise rating was significantly and positively related to the upline colleague ratings.

3.2. Risk Scenario Exercise Results, Round One and Two, Control Group (n = 8)

3.2.1. Inter-Rater Reliability—The Control Group—Round Two

Table 4 shows the medians (and interquartiles) for competency ratings for rounds one and two for the control group, for each element as rated by the two observers. The raw data in Marling [42] shows that observers rated each participant (across the seven elements) within one point of each other; except for one rating, that being a participant for the sixth element, ‘communication and consultation’ where the ratings differed by two points, a three and a one. The Spearman rank-order correlation coefficient test showed that a strong positive relationship existed between the median ratings (collapsed across the seven elements) given by observers’ (rs = 0.936, p = 0.002) and that the correlation is statistically significant at the 0.01 level (2-tailed).

3.2.2. Comparison of the Control Group’s Risk Scenario Exercise Results across Rounds One and Two (n = 8)

Table 5 shows the median (and interquartiles) for the agreed-upon competency ratings given for control group participants for rounds one and two; for the seven elements of the risk management process.
The raw difference data in Marling [42] shows that all ratings between rounds were within one point of each other except for four, where one participant had a decrease in two points in element four, one participant had a reduction in two in elements two and six and one participant had an increase in two in element five.
Wilcoxon signed-rank tests were conducted to determine if median agreed upon competency ratings differed across rounds for any of the seven elements. Results showed that ratings did not significantly differ across rounds.

4. Discussion

The primary aim of this study was to provide preliminary evidence for the adequacy of the RISKometric tool to assess individuals’ competency in the seven elements of the risk management process. Individuals’ results in a risk scenario exercise involving working at heights and simultaneous operations were compared with their earlier RISKometric results. The observers’ averaged ratings from the former scale were strongly and positively correlated with those of the ratings given by peers and downline colleagues who evaluated the participants in the RISKometric. This outcome was consistent across all seven elements of the risk management process.
In real terms, this finding provides initial evidence supporting the RISKometric as a tool to predict performance in a simulated risk management exercise. Additionally, in so doing, it could be considered a useful tool to define competency levels in each of the risk management process elements and be used to assemble risk management teams that are collectively optimised in those elements leading to better outcomes from the risk management process. Further testing with larger samples and in-field risk assessments is required to validate further the usefulness of the RISKometric.
The current study provided extra information about the RISKometric. It showed that ratings given by peers and downline colleagues, but not that of upline colleagues and self, were correlated with task performance. Other studies conducted on 360° assessment tools have similarly shown feedback from peers and downline colleagues to assess a person’s competencies and performance more realistically (Bettenhausen and Fedor [27]; Fedor et al. [28]; Wexley and Klimoski [29]; Kane and Lawler [30]; Murphy and Cleveland [31]; Cardy and Dobbins [32]).
A secondary aim related to the broader investigation involving the first study (Marling et al. [1]), this study and a future study (third study) was to determine whether risk scenario competency ratings for the control group differed over time. Participants in the control group completed the risk scenario exercise on two occasions, separated by an eight-month interval. Outcomes showed that competency ratings were not significantly different across the two rounds and, therefore, did not appear to benefit from any learning effect. The future study aims to determine if a team, collectively-optimised in the risk management process elements, could complete the risk scenario exercise better than less optimised teams. To do so, the current experimental group will be divided into three teams with varying levels of competence and redo the risk scenario exercise (after an eight-month interval) in their groups. Each group’s performance and the control group’s performance will be compared. It is hypothesised that the collectively-optimised group will perform better than other groups; based on the group’s composition rather than a potential learning effect.
The RISKometric is a tool to assess the competence of workers on the seven elements of the risk management process, using feedback from peers and upline and downline colleagues. Ensuring its validity began in its early stages of development. Before developing the RISKometric, as reported in Marling et al. [43], the authors used the Delphi technique with 23 risk experts to create, over two iterations, plain English definitions (PEIs) for each of the seven elements of the risk management process. It is also important to note that these were further validated by 24 operators/workers as being suitable for use at the operational end of the business. It is a tool that could be used to develop teams that are collectively optimised in competence in the seven elements of the risk management process. It is anticipated that this tool, supported by the set of PEIs, could also be used in organisations to promote better awareness of the meaning of the risk management process elements.
There are three potential limitations of this study. First, as noted in Section 3.1, the participants did not comprise a fully representative random sample. Second, as indicated in Section 3.2, one scenario was used for the risk assessment, so potentially different scenarios could produce slightly different results. Third, not all participants followed the request to supply their opinions on recorded voice or video format; two were written submissions only, resulting in a mixed-media format for analysis, but primarily addressed by using two observers.

5. Conclusions

Risk management is an essential proactive approach to achieving safe outcomes and as such, measuring people’s competence in the seven elements of risk management is vitally important. To date, few measures exist to do that, and this work is the first step in providing such a measure.
This research provides a method for evaluating individual performance in a risk assessment scenario against perceived performance by upline, peers, downline and self. The outcome was that the observers’ averaged ratings from the former scale were strongly and positively correlated with those of the ratings given by peers and downline colleagues who evaluated the participants in the RISKometric. This outcome was consistent across all seven elements of the risk management process.
The next step is to conduct a third study that compares the results of individuals in this control group with those of individuals performing the same task in a group where all members are cumulatively competent across the seven elements. This future study (third study) aims to test the adequacy of the RISKometric further to assess individuals’ competency in the seven elements of the risk management process at a collective or group level.

Author Contributions

Conceptualization, G.M.; Formal analysis, G.M.; Investigation, G.M.; Methodology, G.M.; Supervision, T.H. and J.H.; Writing—original draft, G.M.; Writing—review and editing, G.M. All authors have read and agreed to the published version of the manuscript.

Funding

This research received no external funding.

Institutional Review Board Statement

The study was conducted under the approval of the University of Queensland Ethics Committee (protocol code 2009001137 and date of approval 21 July 2009).

Informed Consent Statement

Informed consent was obtained from all subjects involved in the study.

Data Availability Statement

The data presented in this study are available on request from the corresponding author. The data are not publicly available due to privacy.

Conflicts of Interest

The authors declare no conflict of interest.

References

  1. Marling, G.J.; Horberry, T.; Harris, J. Development and reliability of an assessment tool to measure competency in the seven elements of the risk management process: Part one—The RISKometric. Safety 2020, 7, 1. [Google Scholar] [CrossRef]
  2. Borys, D.; Else, D.; Leggett, S. The fifth age of safety: The adaptive age? J. Health Saf. Res. Pract. 2009, 1, 19–27. [Google Scholar]
  3. Pillay, M.; Borys, D.; Else, D.; Tuck, M. Safety Culture and Resilience Engineering—Exploring Theory and Application in Improving Gold Mining, Safety. In Proceedings of the Gravity Gold Conference/BALLARAT, Ballarat, VIC, Australia, 21–22 September 2010. [Google Scholar]
  4. Lewis, K. Knowledge and Performance in Knowledge-Worker Teams: A Longitudinal Study of Transactive Memory Systems. Manag. Sci. 2004, 50, 1519–1533. [Google Scholar] [CrossRef]
  5. ISO 31000:2009; Risk Management—Principles and Guidelines. Standards Australia: Sydney, NSW, Australia; Standards New Zealand: Wellington, New Zealand, 2009.
  6. Lyon, B.K.; Hollcroft, B. Risk Assessments Top 10 Pitfalls & Tips for Improvement, December. Professional Safety. J. Am. Soc. Saf. Eng. 2012, 57, 28–34. [Google Scholar]
  7. Mathieu, J.; Maynard, M.T.; Rapp, T.; Gilson, L. Team Effectiveness 1997–2007: A Review of Recent Advancements and a Glimpse into the Future. J. Manag. 2008, 34, 410–476. [Google Scholar] [CrossRef] [Green Version]
  8. Reason, J.; Andersen, H.B. Errors in a team context. Mohawc Belg. Workshop, 1991. [Google Scholar]
  9. Guzzo, R.A.; Dickson, M.W. Teams in organizations: Recent research on performance and effectiveness. Psychology 1995, 47, 307–338. [Google Scholar] [CrossRef] [PubMed]
  10. Sasou, K.; Reason, J. Team errors: Definition and taxonomy. Reliab. Eng. Syst. Saf. 1999, 65, 1–9. [Google Scholar] [CrossRef]
  11. Houghton, S.M.; Simon, M.; Aquino, K.; Goldberg, C.B. No Safety in Numbers Persistence of Biases and Their Effects on Team Risk Perception and Team Decision Making. Team Organ. Manag. 2000, 25, 325–353. [Google Scholar]
  12. Cooper, A.C.; Woo, C.Y.; Dunkelberg, W.C. Entrepreneurs’ perceived chance of success. J. Bus. Ventur. 1988, 3, 97–108. [Google Scholar] [CrossRef]
  13. Feeser, H.R.; Willard, G.E. Founding strategy and performance: A comparison of high and low growth high tech firms. Strateg. Manag. J. 1990, 11, 87–98. [Google Scholar] [CrossRef]
  14. McCarthy, S.M.; Schoorman, F.D.; Cooper, A.C. Reinvestment decisions by entrepreneurs: Rational decision-making or escalation of commitment? J. Bus. Ventur. 1993, 8, 9–24. [Google Scholar] [CrossRef]
  15. Van Knippenberg, D.; Schippers, M.C. Workgroup diversity. Annu. Rev. Psychol. 2007, 58, 515–541. [Google Scholar] [CrossRef] [Green Version]
  16. Mello, A.S.; Ruckes, M.E. Team Composition. J. Bus. 2006, 79, 1019–1039. [Google Scholar] [CrossRef]
  17. Harrison, D.A.; Price, K.H.; Bell, M.P. Beyond relational demography: Time and the effects of surface- and deep-level diversity on work group cohesion. Acad. Manag. J. 1998, 41, 96–107. [Google Scholar]
  18. Hoffman, R.L.; Maier, N.R.F. Quality and acceptance of problem solutions by members of homogeneous and heterogeneous groups. J. Abnorm. Soc. Psychol. 1961, 62, 401–407. [Google Scholar] [CrossRef] [PubMed]
  19. Van Knippenberg, D.; De Dreu CK, W.; Homan, A.C. Work group diversity and group performance: An integrative model and research agenda. J. Appl. Psychol. 2004, 89, 1008. [Google Scholar] [CrossRef]
  20. Carrillo, J.D.; Gromb, D. Culture in Organisations: Inertia and Uniformity; Discussion Paper # 3613; Centre for Economic Policy Research: London, UK, 2002. [Google Scholar]
  21. Bantel, K.; Jackson, S. Top management and innovations in banking: Does the composition of the top team make a difference? Strateg. Manag. J. 1989, 10, 107–124. [Google Scholar] [CrossRef]
  22. Madjuka, R.J.; Baldwin, T.T. Team-based employee involvement programs: Effects of design and administration. Pers. Psychol. 1991, 44, 793–812. [Google Scholar] [CrossRef]
  23. Jackson, S.E.; May, K.E.; Whitney, K. Understanding the dynamics of configuration in decision making teams. In Team Effectiveness and Decision Making in Organizations; Jossey-Bass: San Francisco, CA, USA, 1995. [Google Scholar]
  24. Fox, S.; Caspy, T.; Reisler, A. Variables affecting leniency, halo and validity of self-appraisal. J. Occup. Organ. Psychol. 1994, 67, 45–56. [Google Scholar] [CrossRef]
  25. McEvoy, G.; Beatty, R. Assessment centres and subordinate appraisal of managers: A seven-year longitudinal examination of predictive validity. Pers. Psychol. 1989, 42, 37–52. [Google Scholar] [CrossRef]
  26. Atkins, P.W.B.; Wood, R.E. Self-versus others’ ratings as predictors of assessment center ratings: Validation evidence for 360-degree feedback programs. Pers. Psychol. 2002, 55, 871–904. [Google Scholar] [CrossRef]
  27. Bettenhausen, K.; Fedor, D. Peer and upward appraisals: A comparison of their benefits and problems. Group Organ. Manag. 1997, 22, 236–263. [Google Scholar] [CrossRef]
  28. Fedor, D.; Bettenhausen, K.; Davis, W. Peer reviews: Employees’ dual roles as raters and recipients’. Group Organ. Manag. 1999, 24, 92–120. [Google Scholar] [CrossRef]
  29. Wexley, K.; Klimoski, R. Performance appraisal: An update. In Research in Personnel and Human Resources; Rowland, K., Ferris, G., Eds.; JAI Press: Greenwich, CT, USA, 1984. [Google Scholar]
  30. Kane, J.; Lawler, E. Methods of peer assessment. Psychol. Bull. 1978, 8, 555–586. [Google Scholar] [CrossRef]
  31. Murphy, K.; Cleveland, J. Performance Appraisal: An Organizational Perspective; Allyn & Bacon: Boston, MA, USA, 1991. [Google Scholar]
  32. Cardy, R.; Dobbins, G. Performance Appraisal: Alternative Perspectives; South-Western Publishing: Cincinnati, OH, USA, 1994. [Google Scholar]
  33. Burt, G.; Wright, G.; Bradfield, R.; Cairns, G.; van der Heijden, K. Limitations of PEST and its derivatives to understanding the environment: The role of scenario thinking in identifying environmental discontinuities and managing the future. Int. Stud. Manag. Organ. 2006, 36, 78–97. [Google Scholar]
  34. Schwartz, P. The Art of the Long View; Doubleday: New York, NY, USA, 1991. [Google Scholar]
  35. Van der Heijden, K. Scenarios, the Art of Strategic Conversation; John Wiley: Chichester, UK, 1996. [Google Scholar]
  36. De Geus, A. Planning as learning. Harv. Bus. Rev. 1988, 66, 70–74. [Google Scholar]
  37. Chermack, T.J. Studying scenario planning: Theory, research suggestions, and hypotheses. Technol. Forecast. Soc. Chang. 2005, 72, 59–73. [Google Scholar] [CrossRef]
  38. Van der Heijden, K.; Bradfield, R.; Burt, G.; Cairns, G.; Wright, G. The Sixth Sense: Accelerating Organisational Learning with Scenarios; John Wiley: Chichester, UK, 2002. [Google Scholar]
  39. Marsh, B. Using scenarios to identify, analyze, and manage uncertainty. In Learning from the Future; Fahey, L., Randall, R.M., Eds.; John Wiley: Chichester, UK, 1998; pp. 40–53. [Google Scholar]
  40. Burt, G.; Chermack, T.J. Learning with Scenarios: Summary and Critical Issues. Adv. Dev. Hum. Resour. 2008, 10, 285–295. [Google Scholar] [CrossRef] [Green Version]
  41. Sincero, S.M. Methods of Survey Sampling. 2015. Available online: https://explorable.com/methods-of-survey-sampling (accessed on 1 April 2021).
  42. Marling, G.J. Optimising Risk Management Team Processes. Ph.D. Thesis, The University of Queensland, Brisbane, Australia, 2015. [Google Scholar]
  43. Marling, G.J.; Horberry, T.; Harris, J. Development and validation of plain English interpretations of the seven elements of the risk management process. Safety 2019, 5, 75. [Google Scholar] [CrossRef]
Figure 1. The risk scenario description.
Safety 08 00071 g001
Figure 2. The risk scenario description supporting illustration.
Safety 08 00071 g002
Table 1. Criteria for E1 “establishing the context”.
General CriteriaSpecific CriteriaObjective Evidence (0/P/F)Score (0–5)
Did the participant identify the affected parties and the parties that affect the task?
  • Was the overall scope of work confirmed (tasks and start/finish time)?
  • Who may directly or indirectly affect or be affected:
    body corporate
    neighbours, same level and below, and in pool area
    electricity supplier
    telephone company
    cable TV company
    people undertaking rooftop work
    visitors, e.g., for private visitors for residents, postman, other tradesmen, etc.
    any other parties who may directly or indirectly affect or be affected
Did the participant identify the appropriate legal frameworks?
  • WHS Act and Regulations
  • Electrical Safety Act and Regulations
  • Any relevant codes of practice
  • Any relevant standards
  • Body corporate rules
Did the participant identify the criteria that risks will be evaluated against?
  • Define what to use, i.e., likelihood/exposure/consequence
  • Design ranking
  • Determine intervention levels, e.g., low, moderate, high and extreme, and management action plans
Note: 0 depicts no evidence (scored as 0), P depicts partial evidence (scored between 2 and 4 based on the amount of evidence), and F depicts full evidence (scored as 5).
Table 2. Medians and interquartiles competence ratings given by two observers for the seven elements of the risk management process (all participants).
ElementMedianQuartile Array 1 (Q1)Quartile Array 3 (Q3)
ObserverO1 O1 O1
O2 O2 O2
E1—“establishing the context”2.00 1.00 3.00
2.00 1.00 3.00
E2—“risk identification”3.00 2.00 4.00
3.00 2.00 4.00
E3—“risk analysis”2.00 1.00 2.75
1.00 0.25 2.00
E4—“risk evaluation”0.00 0.00 2.00
1.00 0.00 2.00
E5—“risk treatment”2.00 1.00 2.75
2.00 1.00 3.00
E6—“communication and consultation”1.00 0.00 2.75
1.00 0.00 2.00
E7—“monitor and review”0.00 0.00 1.00
0.00 0.00 1.00
Note: O1 and O2 represent the two observer raters; numerals represent medians and interquartile ratings.
Table 3. Correlation coefficient, medians and interquartiles RISKometric (self, upline, peer and downline) and risk scenario exercise competence ratings for the seven elements of the risk management process.
ElementCorrelation Coefficient (r)MedianQuartile Array 1 (Q1)Quartile Array 3 (Q3)
Context
Self0.0743.002.254.00
Upline0.3913.003.004.00
Peers0.864 **2.001.003.00
Downline0.953 **2.002.003.00
Exercise12.001.003.00
Risk identification
Self0.2253.003.004.00
Upline0.5084.003.004.00
Peers0.891 **2.002.003.00
Downline0.908 **3.002.004.00
Exercise13.002.004.00
Risk analysis
Self0.1103.002.254.00
Upline0.626 **4.002.004.00
Peers0.922 **1.001.002.00
Downline0.943 **1.501.002.75
Exercise11.001.002.00
Risk evaluation
Self0.1893.002.004.00
Upline0.3293.002.504.00
Peers0.763 **1.001.002.00
Downline0.987 **1.501.002.00
Exercise11.000.002.00
Risk treatment
Self0.0033.003.004.00
Upline0.2863.002.004.00
Peers0.804 **2.001.002.00
Downline0.867 **2.001.003.00
Exercise12.001.003.00
Communication and consultation
Self−0.2113.002.004.00
Upline0.2664.002.504.00
Peers0.676 **1.001.002.00
Downline0.846 **1.001.002.00
Exercise11.000.002.00
Monitoring and reviewing
Self−0.2473.002.004.00
Upline0.3153.002.004.00
Peers0.690 **1.001.002.00
Downline0.751 **1.001.001.75
Exercise10.000.001.00
Note. ** is p < 0.01. Note: self, upline, peer and downline represent the rating in the RISKometric, exercise represents the agreed scores by the two observers, both as reported in Marling et al. [1].
Table 4. Medians and interquartiles of competency of the control group for each of the elements of the risk management process as rated by the two observers in round two.
ElementMedianQuartile Array 1 (Q1)Quartile Array 3 (Q3)
ObserverO1O1O1
O2O2O2
E1—“establishing the context”2.001.003.00
2.001.002.00
E2—“risk identification”3.002.003.25
2.002.003.00
E3—“risk analysis”1.000.001.00
1.000.001.25
E4—“risk evaluation”0.000.000.00
0.000.000.25
E5—“risk treatment”1.501.002.25
2.002.003.00
E6—“communication and consultation”0.000.001.00
0.500.001.00
E7—“monitor and review”0.000.000.00
0.000.000.25
Note: O1 and O2 represent the two observer raters; numerals represent medians and interquartile ratings.
Table 5. Medians and interquartiles agreed upon competency ratings for rounds one and two for the control group for the seven elements of the risk management process.
ElementMedianQuartile Array 1 (Q1)Quartile Array 3 (Q3)
RoundR1R1R1
R2R2R2
E1—“establishing the context”1.501.003.00
2.001.002.00
E2—“risk identification”3.002.003.25
2.002.003.00
E3—“risk analysis”1.000.751.00
1.000.001.00
E4—“risk evaluation”0.500.001.00
0.000.000.25
E5—“risk treatment”1.501.002.25
2.001.753.00
E6—“communication and consultation”0.000.000.50
0.000.001.00
E7—“monitor and review”0.000.000.25
0.000.000.25
Note: R1 and R2 represent the two different rounds; numerals represent medians and interquartile ratings.
Publisher’s Note: MDPI stays neutral with regard to jurisdictional claims in published maps and institutional affiliations.

