Article

Development and Reliability Review of an Assessment Tool to Measure Competency in the Seven Elements of the Risk Management Process: Part Three—Evaluation of the Group Results from the RISK Tool

1
School of Systems Engineering, College of People, Technology and Systems, Spring Hill 4000, Australia
2
School of Safety Engineering, Sichuan Normal University, Chengdu 410065, China
3
Sustainable Minerals Institute, The University of Queensland, St Lucia 4072, Australia
*
Author to whom correspondence should be addressed.
Safety 2024, 10(1), 29; https://doi.org/10.3390/safety10010029
Submission received: 14 June 2023 / Revised: 16 January 2024 / Accepted: 19 January 2024 / Published: 14 March 2024
(This article belongs to the Special Issue Risk and Safety Analysis of Industry)

Abstract

:
This study used ratings to form teams of participants with different risk management competence levels to determine if a collectively optimised team performed a risk management exercise better than a marginally or a sub-optimised team. This paper also determined whether team performance was better than individual performance on a risk management exercise. An experimental group was split into three teams of six participants based on their individual risk scenario exercise outcomes. The collectively optimised team had at least one member rated as having some high-level or expert competency in one of the seven risk management process elements. So, jointly, the group had this competency level in all elements. Similarly, the marginally optimised team’s members were rated as having just above average or high-level competency in the seven elements. Likewise, the sub-optimised team’s members were rated as having just above average competency, just below average, or no competency in the seven elements. Each team undertook the risk scenario exercise, and two observers rated their performances, as recorded on a video camera. The results were that the collectively optimised team performed better in each of the seven risk management elements than the other teams (the marginally optimised or the sub-optimised team). However, a significant difference was only evident between the collectively optimised and sub-optimised teams across all elements. Also, the teams performed better in each of the seven elements than individuals. These results imply that a team collectively optimised in the seven elements of the risk management process can better perform a risk management process than a sub-optimised team. These competency outcomes could be used to assemble risk management teams that are collectively optimised, leading to better results from the risk management process.

1. Introduction

Typically, individuals instead of teams undertake risk management for work health and safety (WHS) issues within organisations [1]. The organisation does not assess their competence in the risk management process’s seven elements, individually or collectively. This omission can lead to poor outcomes in the risk management process [1]. Additionally, risk management/assessment is not being optimally performed, in part due to unbalanced teams [1].
This paper is the third of three studies. The assumptions underlying the first study (Marling et al. [2]) and the second study (Marling et al. [3]) are that:
  • risk management for WHS is often conducted in an ad hoc manner by individuals or teams who are not competent in the seven elements of risk management, and these likely compromise outcomes, which is especially critical in high-risk industries;
  • risk management for WHS is better undertaken in teams that are collectively optimised according to competence in the seven elements of the risk management process;
  • to recruit/select a collectively optimised team, a tool is required to measure an individual’s competence in the seven elements of the risk management process.
The seven elements of the risk management process are as follows [1,2,3]:
  • Establishing the context;
  • Risk identification;
  • Risk analysis;
  • Risk evaluation;
  • Risk treatment;
  • Communication and consultation;
  • Monitoring and reviewing.

1.1. Work Teams?

As documented by Mathieu et al. [4], many definitions and taxonomies of work teams have been put forward by researchers, such as Kozlowski and Bell [5], Cohen and Baily [6], Devine [7], Hackman [8] and Sundstrom [9]. However, Reason and Anderson ([10], p. 1) define a work team simply as:
“a group of somewhere between two and 12 individuals performing a common task, albeit with specialist roles”.
Risk management forums certainly fall within the confines of this definition.
Guzzo and Dickson [11] define three types of teams assembled for the specific purpose of generating solutions. Known as problem-solving teams (as used in this study), the three categories are quality circles, task forces and autonomous work teams. Quality circles are teams focusing on product quality by reducing defects (error rates, etc.) and generally have a longer time horizon to meet their brief. Task forces are teams with a well-defined brief that are temporary, disbanding when the task is accomplished. Autonomous work groups are self-managed teams that generally perform planning and scheduling tasks. Taskforce teams perhaps best characterise risk forums, which meet on a transitory basis and have a clear mandate.

1.2. The Benefits and Limitations of Using Teams in the Workplace

Sasou and Reason [12] outline the advantages of using teams in the workplace and propose that the key benefit is providing mutual aid that can enhance the economy and efficiency in tasks. More specifically, they assert that this ‘collective mind’ can prevent a poor decision from being made to risk management. Bernsen and Reason [13] also discuss a work team comprising two to twelve people and performing a common task that may include expert roles. Salas et al. [14] add that work teams should be adaptable and share a common goal. This is further supported by a systematic review and meta-analysis by McKewan et al., [15], focused on controlled interventions to improve teamwork behaviours and team performance.
Finley [16] suggests that work teams become problematic when they are an odd gathering of incompatible personalities, resulting in communication difficulties Hogan et al. [17] note that work teams do not operate in a vacuum but within the framework of larger organisations that hold these teams accountable. Measuring performance and monitoring the results of teamwork are used to hold teams accountable. This is further supported by Hackman and Katz [18], who explored the effectiveness of teamwork interventions, considering both team and individual behaviours, cognitions and affective states.

1.3. Consideration of Biases in Work Teams

Houghton et al. [19] discuss biases that can impact individuals’ and teams’ processes in managing risk, such as ‘small numbers’, the ‘illusion of control’ and ‘overconfidence’, while others have found that teams reduce decision-making errors or biases. A study by Kaplan et al. [20] discusses in depth well-known behavioural and organisational biases that cause novel risks to go unrecognised and unmitigated. Cooper et al. [21], Feeser and Willard [22] and McCarthy et al. [23] contend that adding people to a decision process is likely to protect against biases. However, Houghton et al. [19] find the contrary. Tversky et al. [24] label the ‘small numbers’ bias as an event when an individual systematically relies on a small sample of information to make decisions, incorrectly assuming that the information is typical of the entire population of events. Langer [25] defines the ‘illusion of control’ bias as an event that occurs when individuals overrate the extent to which their skill can increase the probability of success. Houghton et al. [19] also contend that the ‘illusion of control’ bias can happen at both a work team and individual level. Russo and Schoemaker [26] determined that the ‘overconfidence’ bias is an individual’s failure to recognise ambiguity associated with the problem compared to their current knowledge.
Consequently, the research of Houghton et al. [19] also suggests that ‘overconfidence’ bias can occur both at a work team and individual level. Supporting this principle for personal biases also to be team biases, Sasou and Reason [12] label biases as errors and claim that a ‘team error’ is one form of ‘human error’ made when people work in teams. They further classify these as ‘individual errors’ and ‘shared errors’. Petriglieri and Wood [27] claim that you cannot be part of a work team and not be affected by its dynamics. Again, this is further supported by the previous review and analysis by McEwan et al. [27], which focused on controlled interventions to improve teamwork behaviours and team performance. Blanding [28] discusses research that demonstrates that compiling a multitude of separate estimations, regardless of the lack of expertise or knowledge of the individuals making them, can unexpectedly lead to accurate and effective results.

1.4. Assembling Work Teams—Homogeneous vs. Heterogeneous Teams

The composition of workgroups, or what Guzzo and Dickson [11] and Sundstrom et al. [29] call work teams, has gained organisational psychologists’ interest over the last three decades. One area of focus has been team members’ attributes and the impact of those combinations on processes and outcomes (Mathieu et al. [4]), with research indicating that this is of vital importance to performance (Guzzo and Dickson [11]).
There are two schools of thought about the composition of work teams. One view is that teams should be homogeneous, and the other view is that they should be heterogeneous, or what van Knippenberg and Schippers [30] refer to as similarity and diversity in attributes. Mello and Ruckes [31] differentiate homogeneous teams as those with similar attributes. In contrast, heterogeneous teams are different in terms of background and experience, in what Harrison et al. [32] confer as two domains: demographic and functional. van Knippenberg and Schippers [30] and Harrison et al. [32] define several categories within these domains. The key characteristics most pertinent to this study include professional development, education and organisational tenure (presumably in duration and occupation). As such, the focus is on the functional domain. van Knippenberg and Schippers [30] suggest that organisations increasingly foster and use cross-functional and diverse work teams.
Hoffman and Maier [33] advocate that heterogeneity is a better criterion for assembling groups. It allows the work team to draw different backgrounds and experiences and put forward better decision-making options. van Knippenberg et al. [34] agree and argue further that the larger pool of resources that comes with heterogeneity may assist with dealing with non-routine problems, or what Mello and Ruckes [31] and Carrillo and Gromb [35] label as dynamic and uncertain situations. Mello and Ruckes [31] also concur and add that heterogeneous teams have advantages when the decision stakes are high. Bantel and Jackson [36] and Madjuka and Baldwin [37] claim that this diversity in work teams is correlated with higher performance and innovation, or what Jackson et al. [38] call creativity. Guzzo and Dickson [11] also assert that heterogeneous teams perform better at more cognitively demanding, innovative and challenging tasks. Madjuka and Baldwin [37] also claim that the greater access to information, the more positively related team effectiveness becomes. Jackson et al. [38] also found empirical evidence of a positive link between diversity and team effectiveness.
In contrast, van Kippenberg and Schippers [30], Brewer [39], Brewer and Brown [40] and Tajfel and Turner [41] discuss the issue of homogeneous teams tending to trust and cooperate and thus function more smoothly. O’Reilly et al. [42] take this further when expressing that homogeneous teams operate with higher cohesion, and Murnighan and Conlon [43] claim they have higher performance. Campion et al. [44] claim that team size positively relates to team effectiveness and not heterogeneity. O’Reilly and Flatt [45] and Ancona and Caldwell [46] conclude that there is empirical evidence of poorer performance by heterogeneous teams. Triandas et al. [47] sum up that, while heterogeneous teams are generally suitable for performance, there are problems with interaction and cohesion. van Kippenberg and Schippers [30] caution that more significant characteristic dissimilarity does not mean greater team diversity, an example being a sole female in a team not making the team gender-heterogeneous.
There is no firm conclusion regarding whether homogeneous or heterogeneous groups perform better. As discussed above, heterogeneous teams may be better in particular circumstances, such as with non-routine problems and in dynamic and uncertain situations or when the outcome of decisions can have serious consequences. This study concerns the risk management of WHS in high-risk industries, where choices can critically impact safety and cause serious injury and/or loss of life. Therefore, it could be argued that having a heterogeneous team, but one where together they are collectively optimised in the seven elements of the risk management process, can lead to better outcomes in the risk management process (i.e., outcomes that do not lead to serious injury or loss of life).
Based on the above, the researchers contend that inefficient and ineffective use of personnel in the risk management process in WHS may hinder outcomes. The risk management process (formal and informal) is often undertaken in an ad hoc manner when, in fact, to be carried out thoroughly requires input from competent personnel at strategic and operational levels. An important intervention that may improve risk management outcomes is the use of heterogeneous yet collectively competent risk forum teams; however, to date, to the researchers’ knowledge, the effectiveness of such teams in risk management in WHS has not been tested.

2. Aim

Having established in the second study that the individual ratings from the RISKometric have a significant positive relationship with the individual ratings of the risk scenario exercise (Marling et al. [3]), this third study aims to determine if teams collectively competent in risk management perform a WHS task better than less competent teams and, also, whether team performance is better than individual performance in completing a risk management exercise.

3. Method

3.1. Background to Previous Study Methods

In the first study (Marling et al. [2]), a 360° performance measure was developed, which gathered feedback to assess participants’ competence in the seven elements of the risk management process. Participants, their peers and upline and downline colleagues all gave feedback. It was found that the feedback from peers and downline colleagues strongly and positively correlated. To determine this feedback’s integrity, it was compared with participants’ performance in a risk scenario exercise described in Marling et al. [3]. Participants’ performance in the risk scenario exercise was rated against the risk management process’s seven elements. These ratings were strongly and positively correlated with the prior ratings given by peers and downline colleagues (in the 360° RISKometric).
Table 1 describes the relationship between the three studies.

3.2. Introduction to This Study’s Methods

This current study uses the information about the risk management competency of participants (from the first study (Marling et al. [2] and the second study (Marling et al. [3]) to form teams that differ according to risk management competency to primarily test whether a collectively competent team performs the risk scenario exercise better than other less competent teams.

3.3. Participants

The 18 participants comprise a subset of those 26 who undertook the RISKometric and risk scenario exercise in the first study (Marling et al. [2]) and the second study (Marling et al. [3]). This subset is arranged into three teams of six people, as discussed in Section 3.2. Demographic details of the teams are shown in Table 2.
Participants were provided with The University of Queensland’s (St Lucia, Australia) ethics information and agreed to proceed with those principles. None of the participants was paid or reimbursed for participating in this study. The participants came from a group of people with professional ties to the researcher. As such, they are not a fully representative random sample; however, they are a sample of experienced risk professionals who are independent of the research.

3.4. Procedure and Material

3.4.1. Team Selection

Twenty-six individuals were randomly placed into experimental and control groups. The control group undertook the risk scenario exercise individually on two occasions (as described in Marling et al. [3]). Those in the experimental group were assigned into teams based on their individual risk scenario exercise ratings. Three teams were formed based on the optimisation of the highest personal rating within the team such that (see Figure 1, Figure 2 and Figure 3):
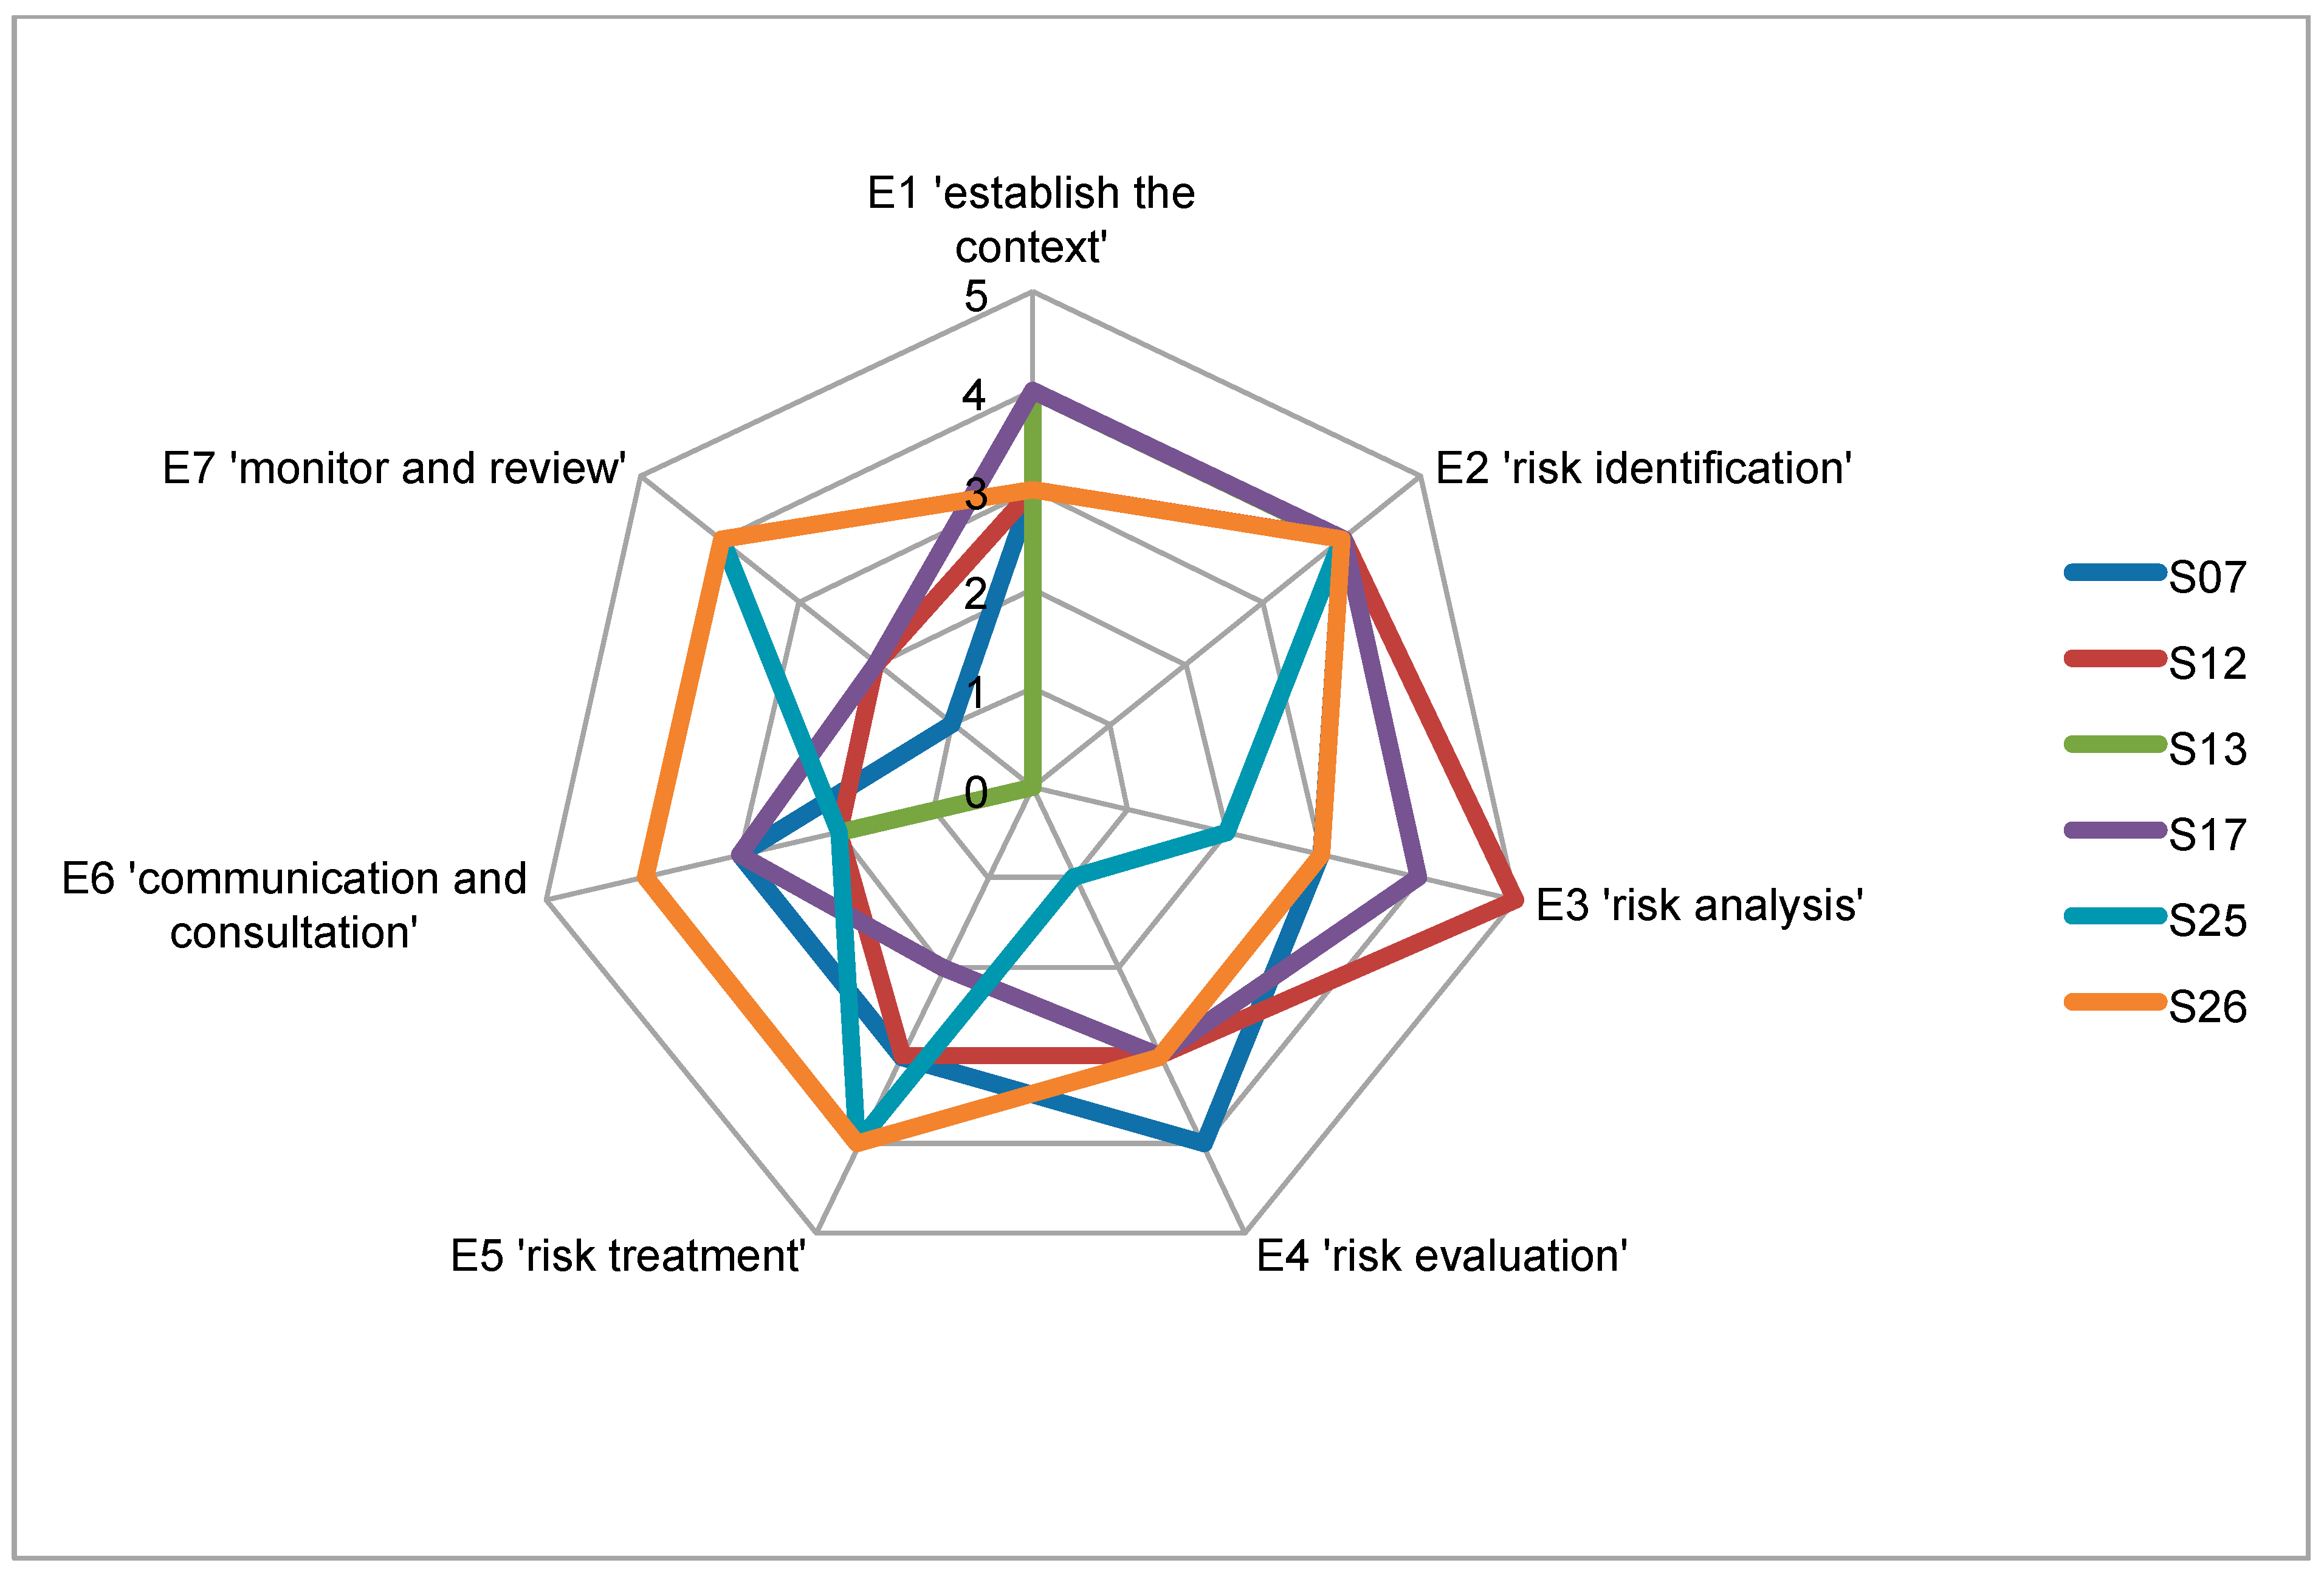
  • Team A, the collectively optimised team, had at least one person who was rated as having some high level (4) or expert level (5) competency per element;
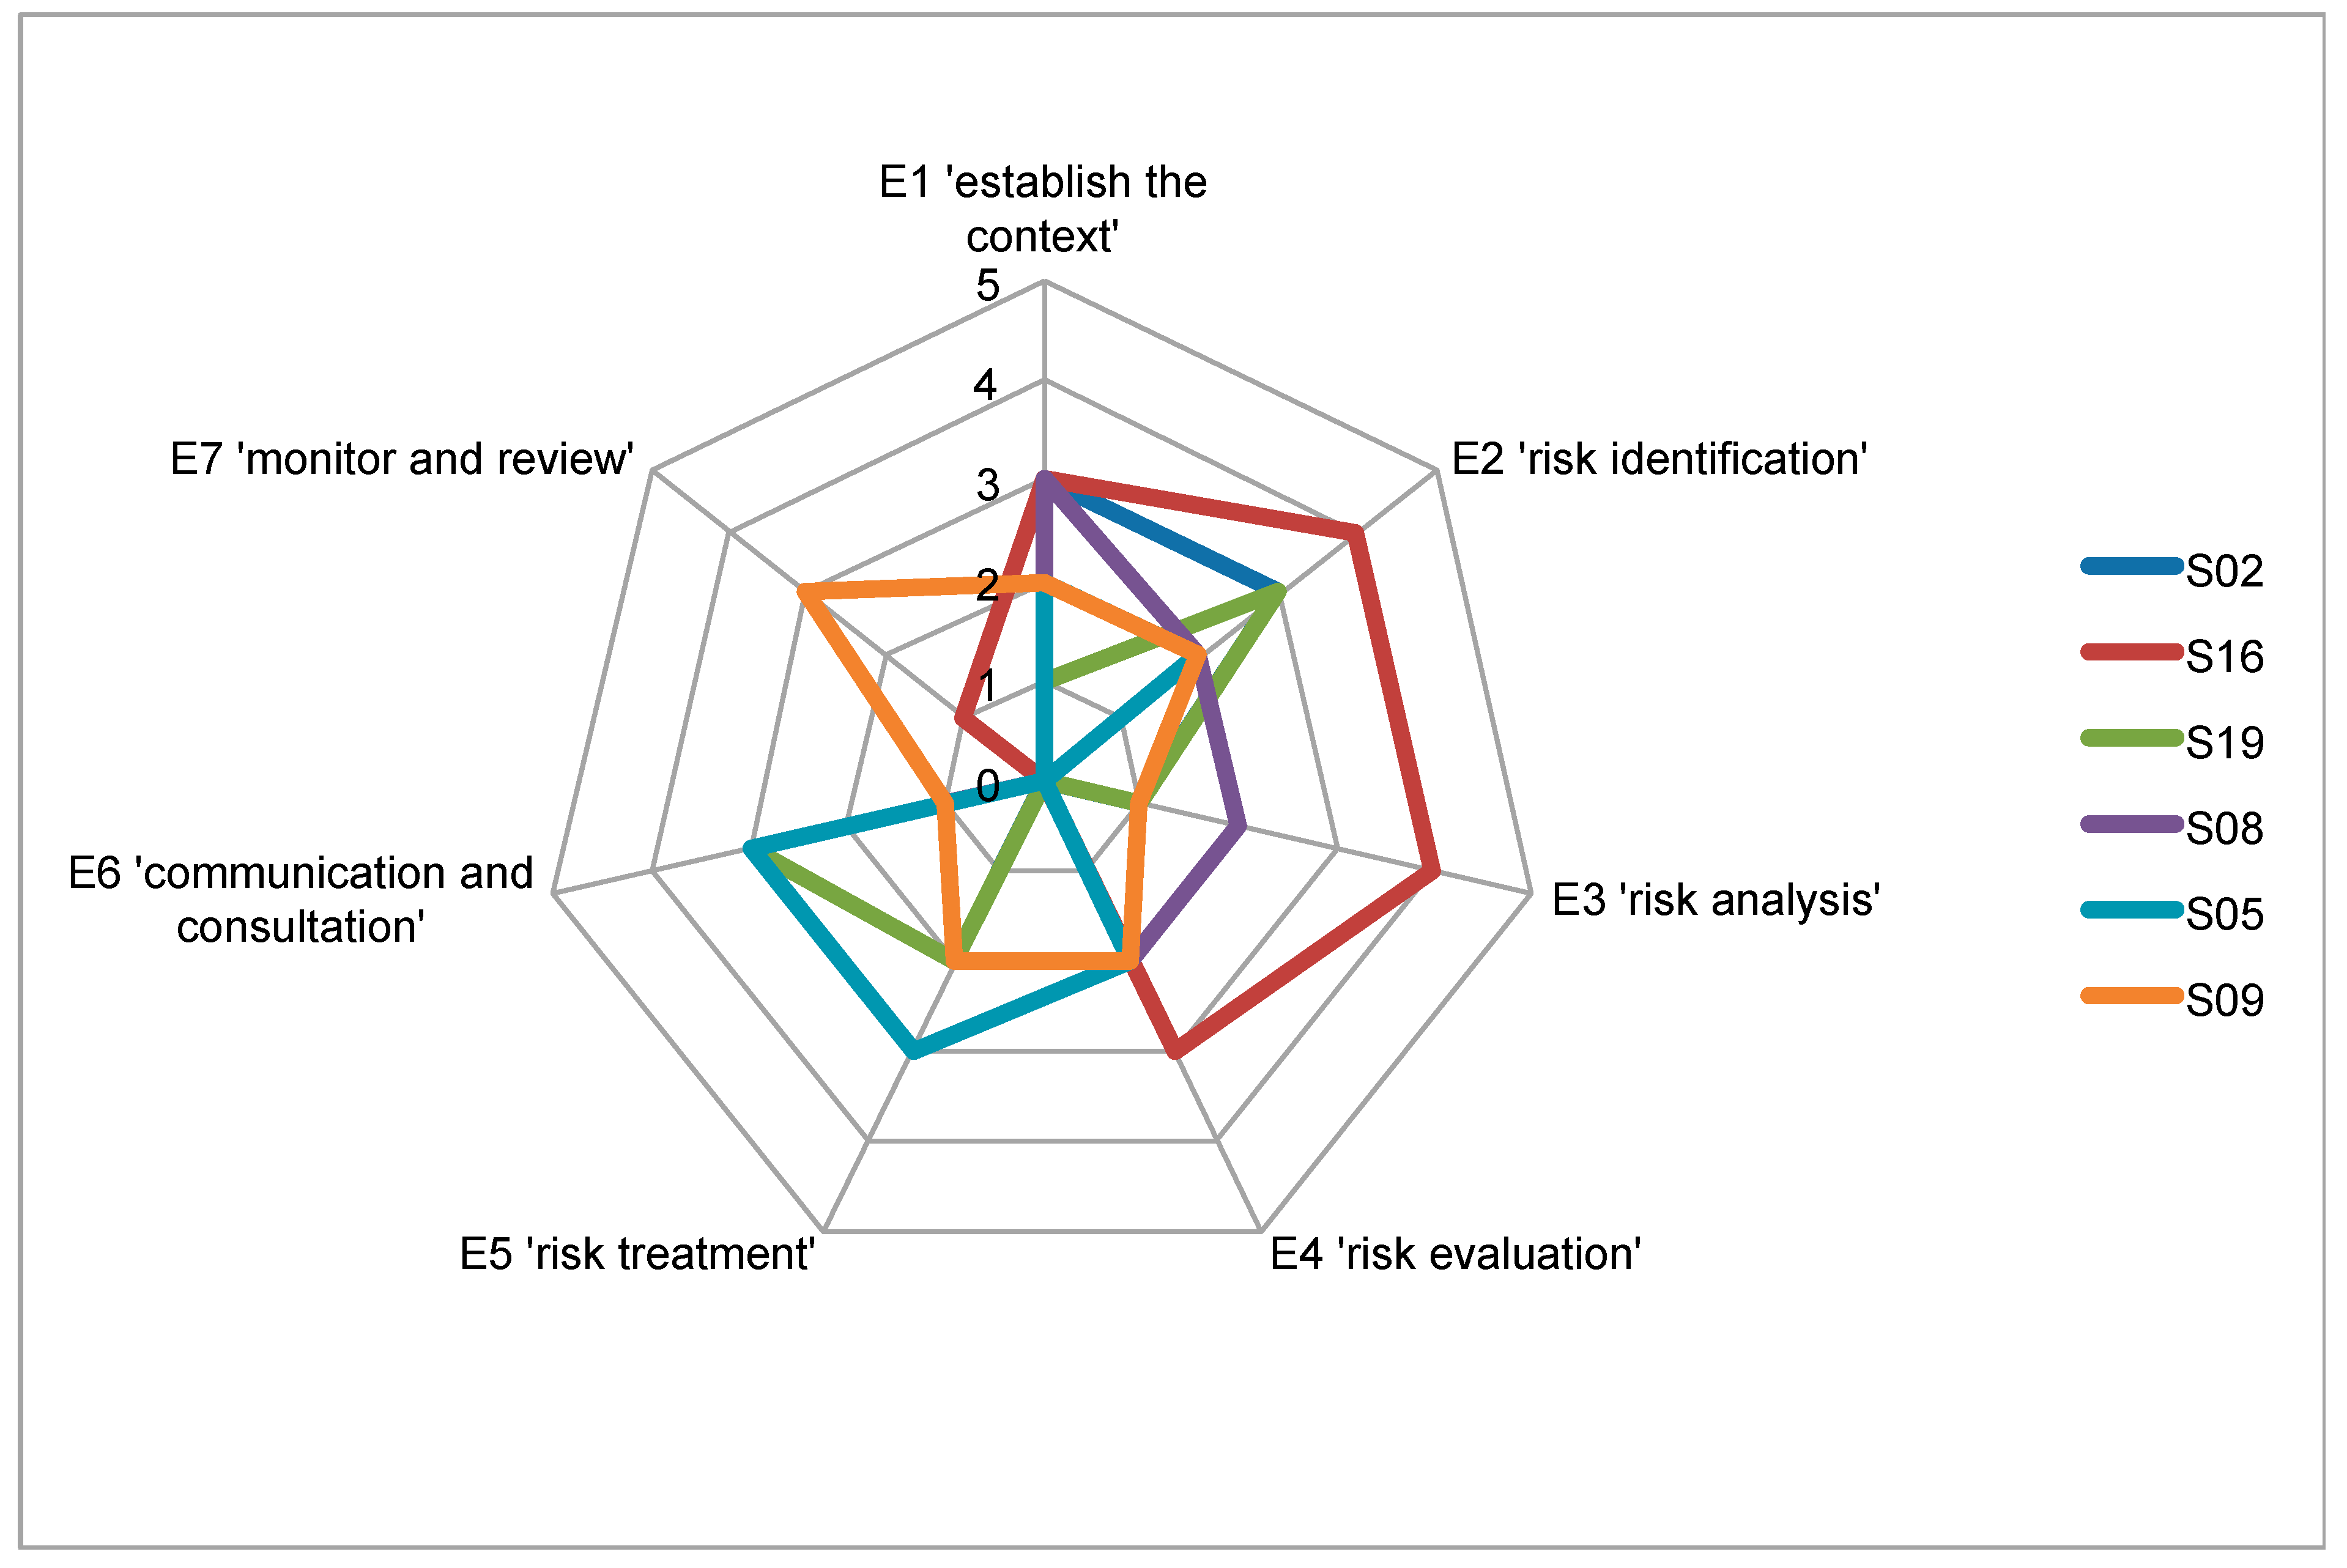
  • Team B, the marginally optimised team, had at least one person who was rated as having some high level (4) or just above average (3) competency per element;
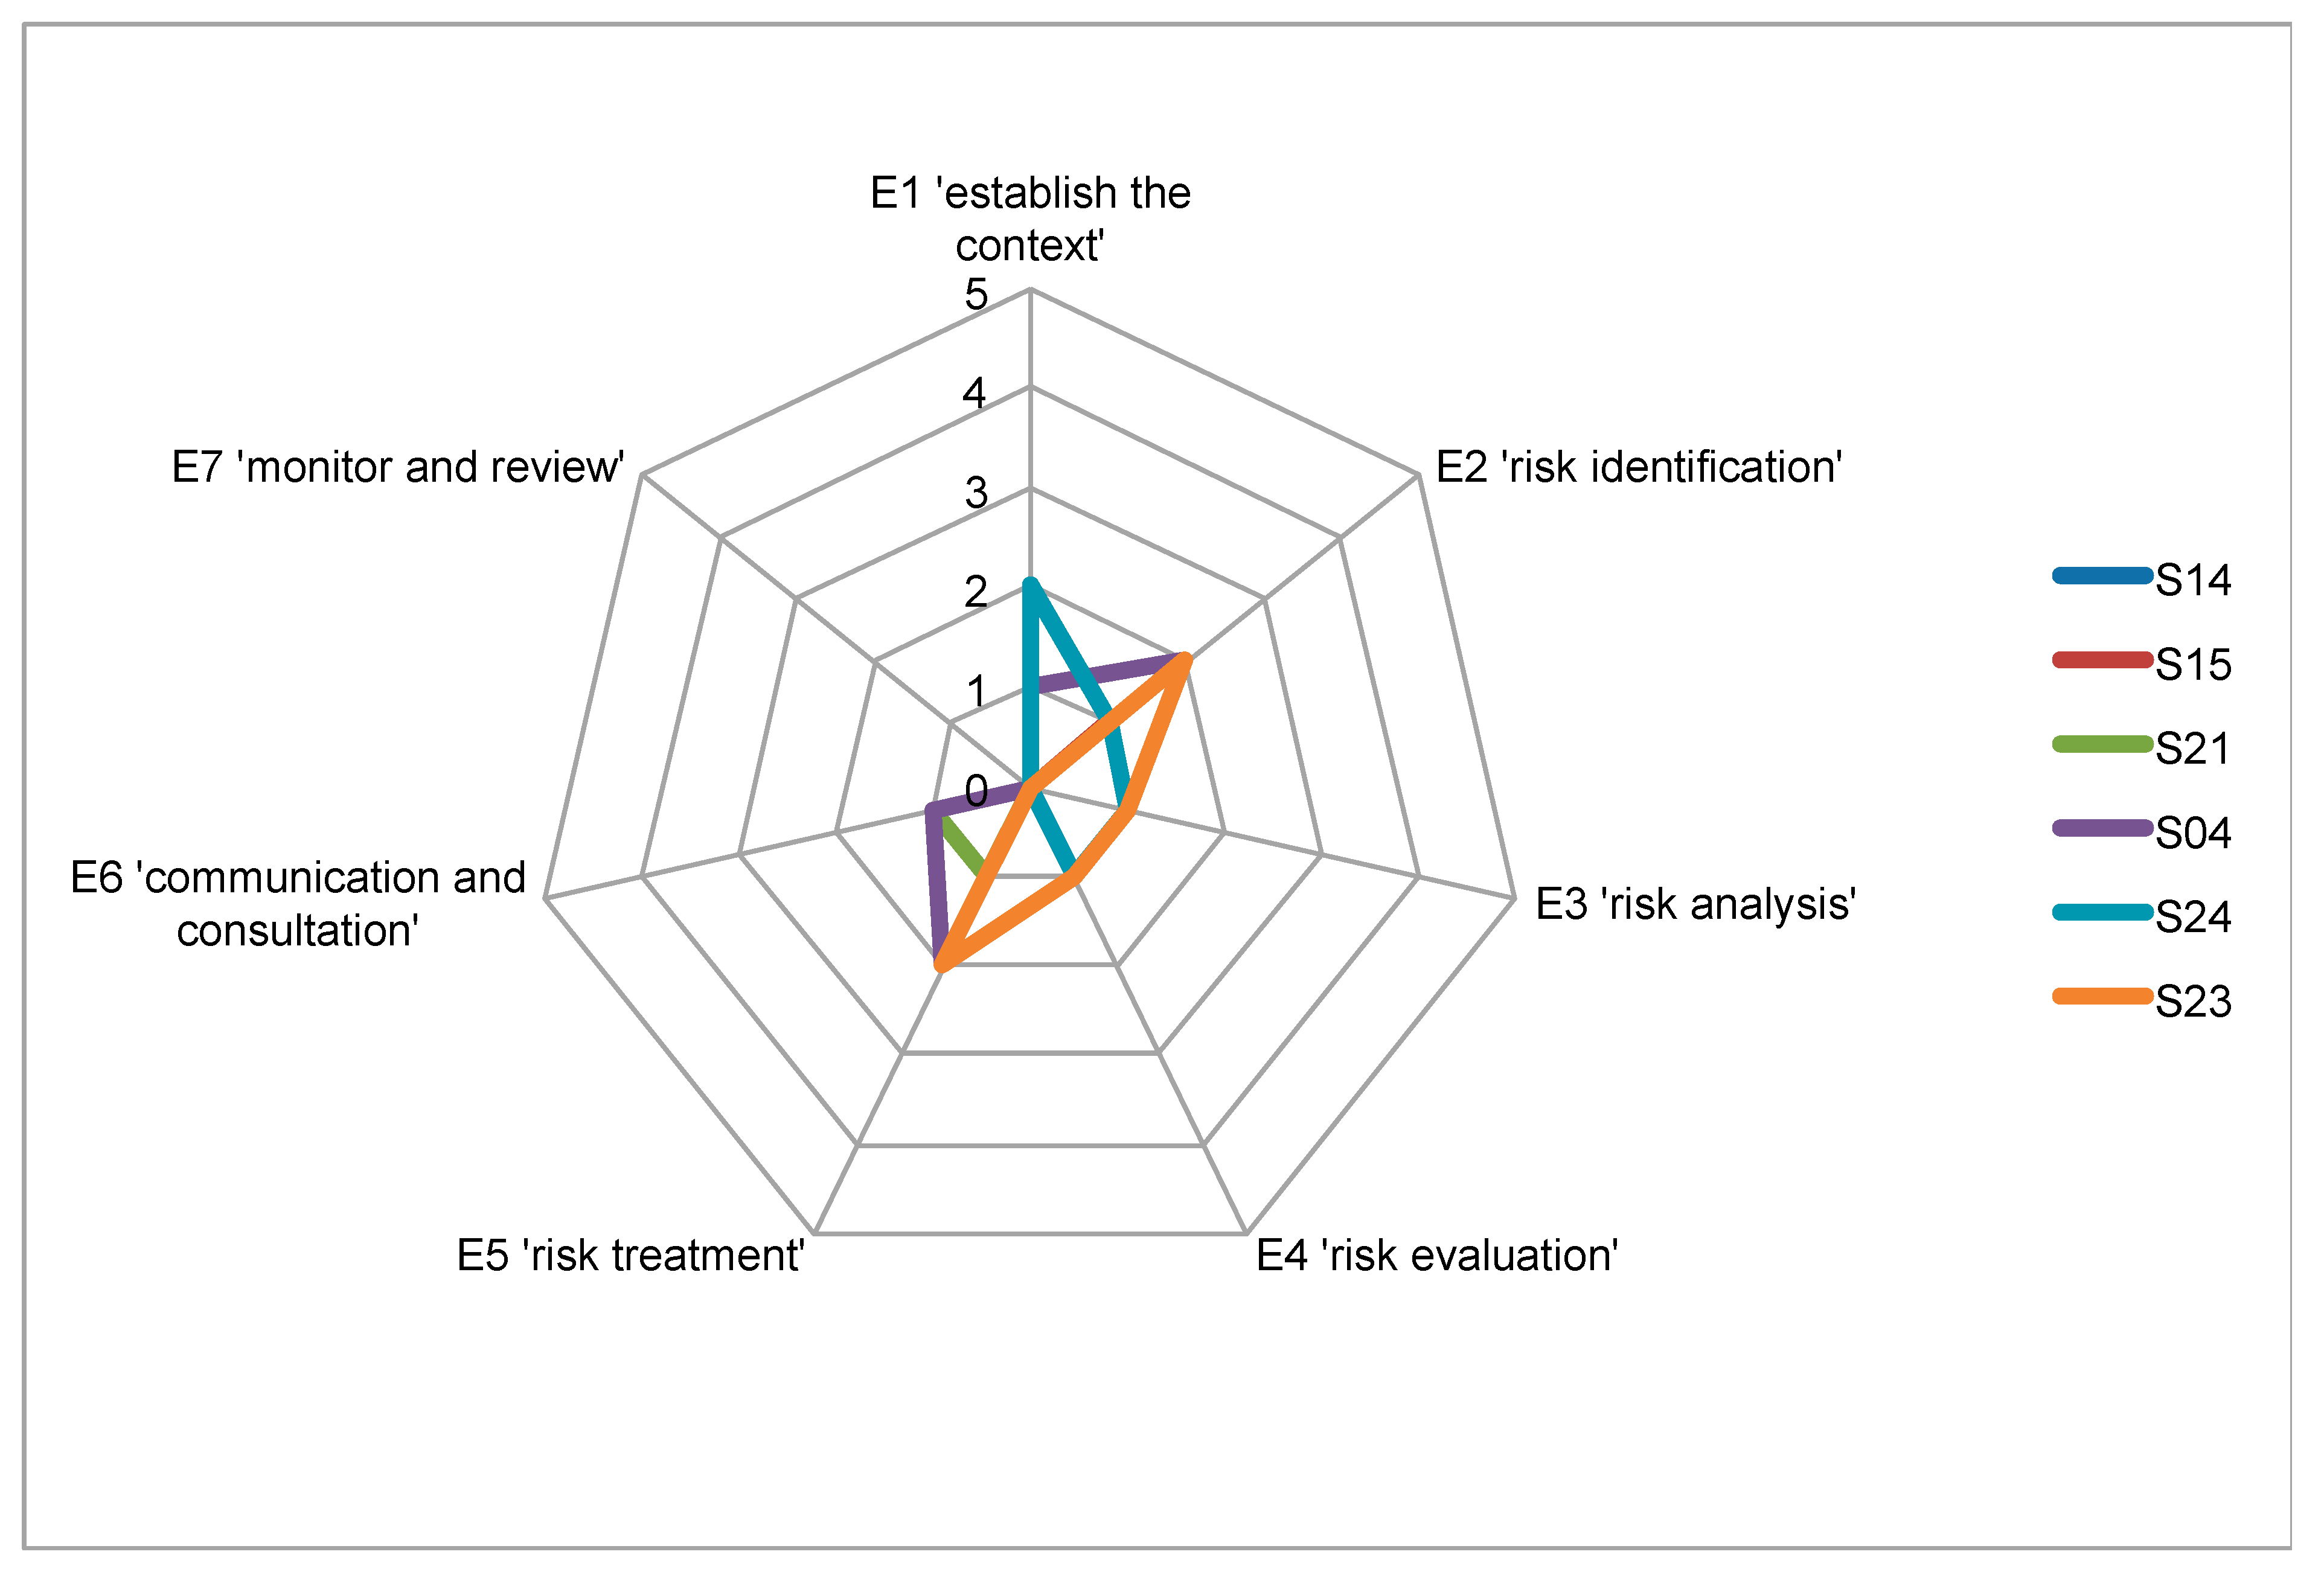
  • Team C, the sub-optimised team, comprised people whose ratings ranged from no competency (0) to just below average competency (2) per element.
The bands are based on the six-point rating scale (0–5) used to assess participants’ performance in both the RISKometric and the risk scenario exercise—see the methods of this study and Marling et al. [3] for a list of points on the scale.
Kruskal–Wallis tests show that the three teams and the control group did not differ according to general risk management experience (H(3) = 0.994, p = 0.803), working at heights risk management experience (H(3) = 0.679, p = 0.878), nor experience at working at heights (H(3) = 0.676, p = 0.879).
The teams were split into three equally sized teams because unequal-sized teams may have led to some inconsistencies across team dynamics.

3.4.2. Team Exercise

The participants were sent a list of potential dates for their team’s risk scenario exercise, and a testing date was set based on this feedback.
The procedures for running the risk scenario exercise were the same for each team. An independent facilitator was appointed whose role was to undertake the following tasks:
  • welcome participants on arrival;
  • be a neutral guide, focussing on group etiquette only, and not provide risk management content information, e.g., the facilitator encouraged the input of all team members, kept the team on task and reduced distractions and reminded the team about time limits, appropriate language and respect for others’ opinions.
As discussed earlier, the facilitator was not a research team member, to ensure that biases are not inadvertently introduced into the process. The facilitator was chosen for her robust set of facilitation skills but had no experience facilitating risk forums to ensure biases are not inadvertently introduced into the process.
As the individuals did not know each other predominately, there was an initial ten-minute ‘meet and greet’ session between the facilitator and participants. The participants were then taken into the testing room, where a member of the research team provided the following information:
  • Emergency management procedures.
  • Facility and comfort arrangement familiarity.
  • Participants would complete the same risk scenario exercise they had previously completed (Marling et al. [3]), but this time as a team. Each participant was given a copy of the scenario narrative and the associated diagram.
  • They could use the computer in the room to search for any reference material.
  • They could use the whiteboard and butcher’s paper to assist them.
  • As previously advised, the forum would be filmed (at this point, the video recording commenced).
  • Participants were asked to affirm verbally that they were aware of the ethical considerations and were willing to proceed on that basis, including their right to withdraw from the risk scenario exercise at any time for any reason.
  • Participants were told that they might find it helpful to spend the first five minutes determining the process they would use to complete the risk scenario exercise (i.e., a meta-process). Houghton et al. [18] suggest that establishing procedures (presumably for the team process) may counter biases, rather than relying on the possible benefit of purely being a team negating these biases.
The researcher then left the room, advising that he would be outside and available to clarify the risk scenario exercise or matters in the description or supporting diagram, but not on any risk management process or problem-solving issues. The facilitator then commenced the session.
At the end of the 60 min session, the participants were allowed to ask questions and were thanked for participating.
The participants, facilitator, and one of the observers (i.e., not in the research team) were all blind to the competency level of the groups.

3.5. Analysis Strategy

The same assessment tool used in the second study (Marling et al. [3]) was used to rate the teams’ risk scenario exercise performance through video review. Two observers rated the participants using these criteria, the researcher being one of them. A second independent observer was used to remove any bias the researcher may have had by knowing the participants in their working environments. Inter-rater reliability between observers was tested using the Spearman rank-order correlation coefficient test. The observers then negotiated an agreed-upon team rating for each of the seven elements.
The Kruskal–Wallis H test, also known as the ‘one-way ANOVA on ranks’, was used to determine if teams’ experience in working at heights, undertaking risk management activities for working at height and undertaking risk management activities for other general risk management activities differed. For completeness, the control group was included in the comparison. Field’s study [48] was used as a guide for undertaking two inferential statistical analysis tests. The Kruskal–Wallis H test is a rank-based nonparametric test used to determine if there are statistically significant differences between two or more groups of an independent variable on a continuous or ordinal dependent variable. The test was run three times against each of the experience dimensions.
A series of independent samples of Kruskal–Wallis H tests were performed to determine if teams’ risk scenario performance differed across the seven risk management elements. The test was run seven times—separately for each element. Because there were three teams where a significant overall difference existed, post hoc tests were run that involved comparing the medians of all combinations of pairs of the groups (i.e., a pairwise comparison).
A series of Wilcoxon signed-rank tests were undertaken to determine if participants’ performances changed when undertaking the risk scenario exercise alone compared to in teams. The test was run seven times (i.e., for each element in the combination of individual vs. team).

4. Results

4.1. Inter-Rater Reliability Testing

Table 3 shows the median and interquartile competency ratings, collapsed across all seven elements of the risk management process, as given by the two observers. This table highlights the similarity in the overall mean rating given by observers. Table A1 in Appendix A provides extra information regarding observers’ ratings for individual elements and participants. Table 3 also shows that ratings were similar across observers, as they rate each participant within one point of each other.
The Spearman rank-order correlation coefficient test finds that observers’ overall mean ratings are strongly and positively associated (rs = 0.840, p < 0.001) and that the correlation is significant at the 0.01 level (2-tailed).

4.2. Team Performance

This section aims to determine if a collectively competent team performed the risk scenario exercise better than other less competent teams. The following sections give results from the descriptive and inferential statistics for each risk management process element.

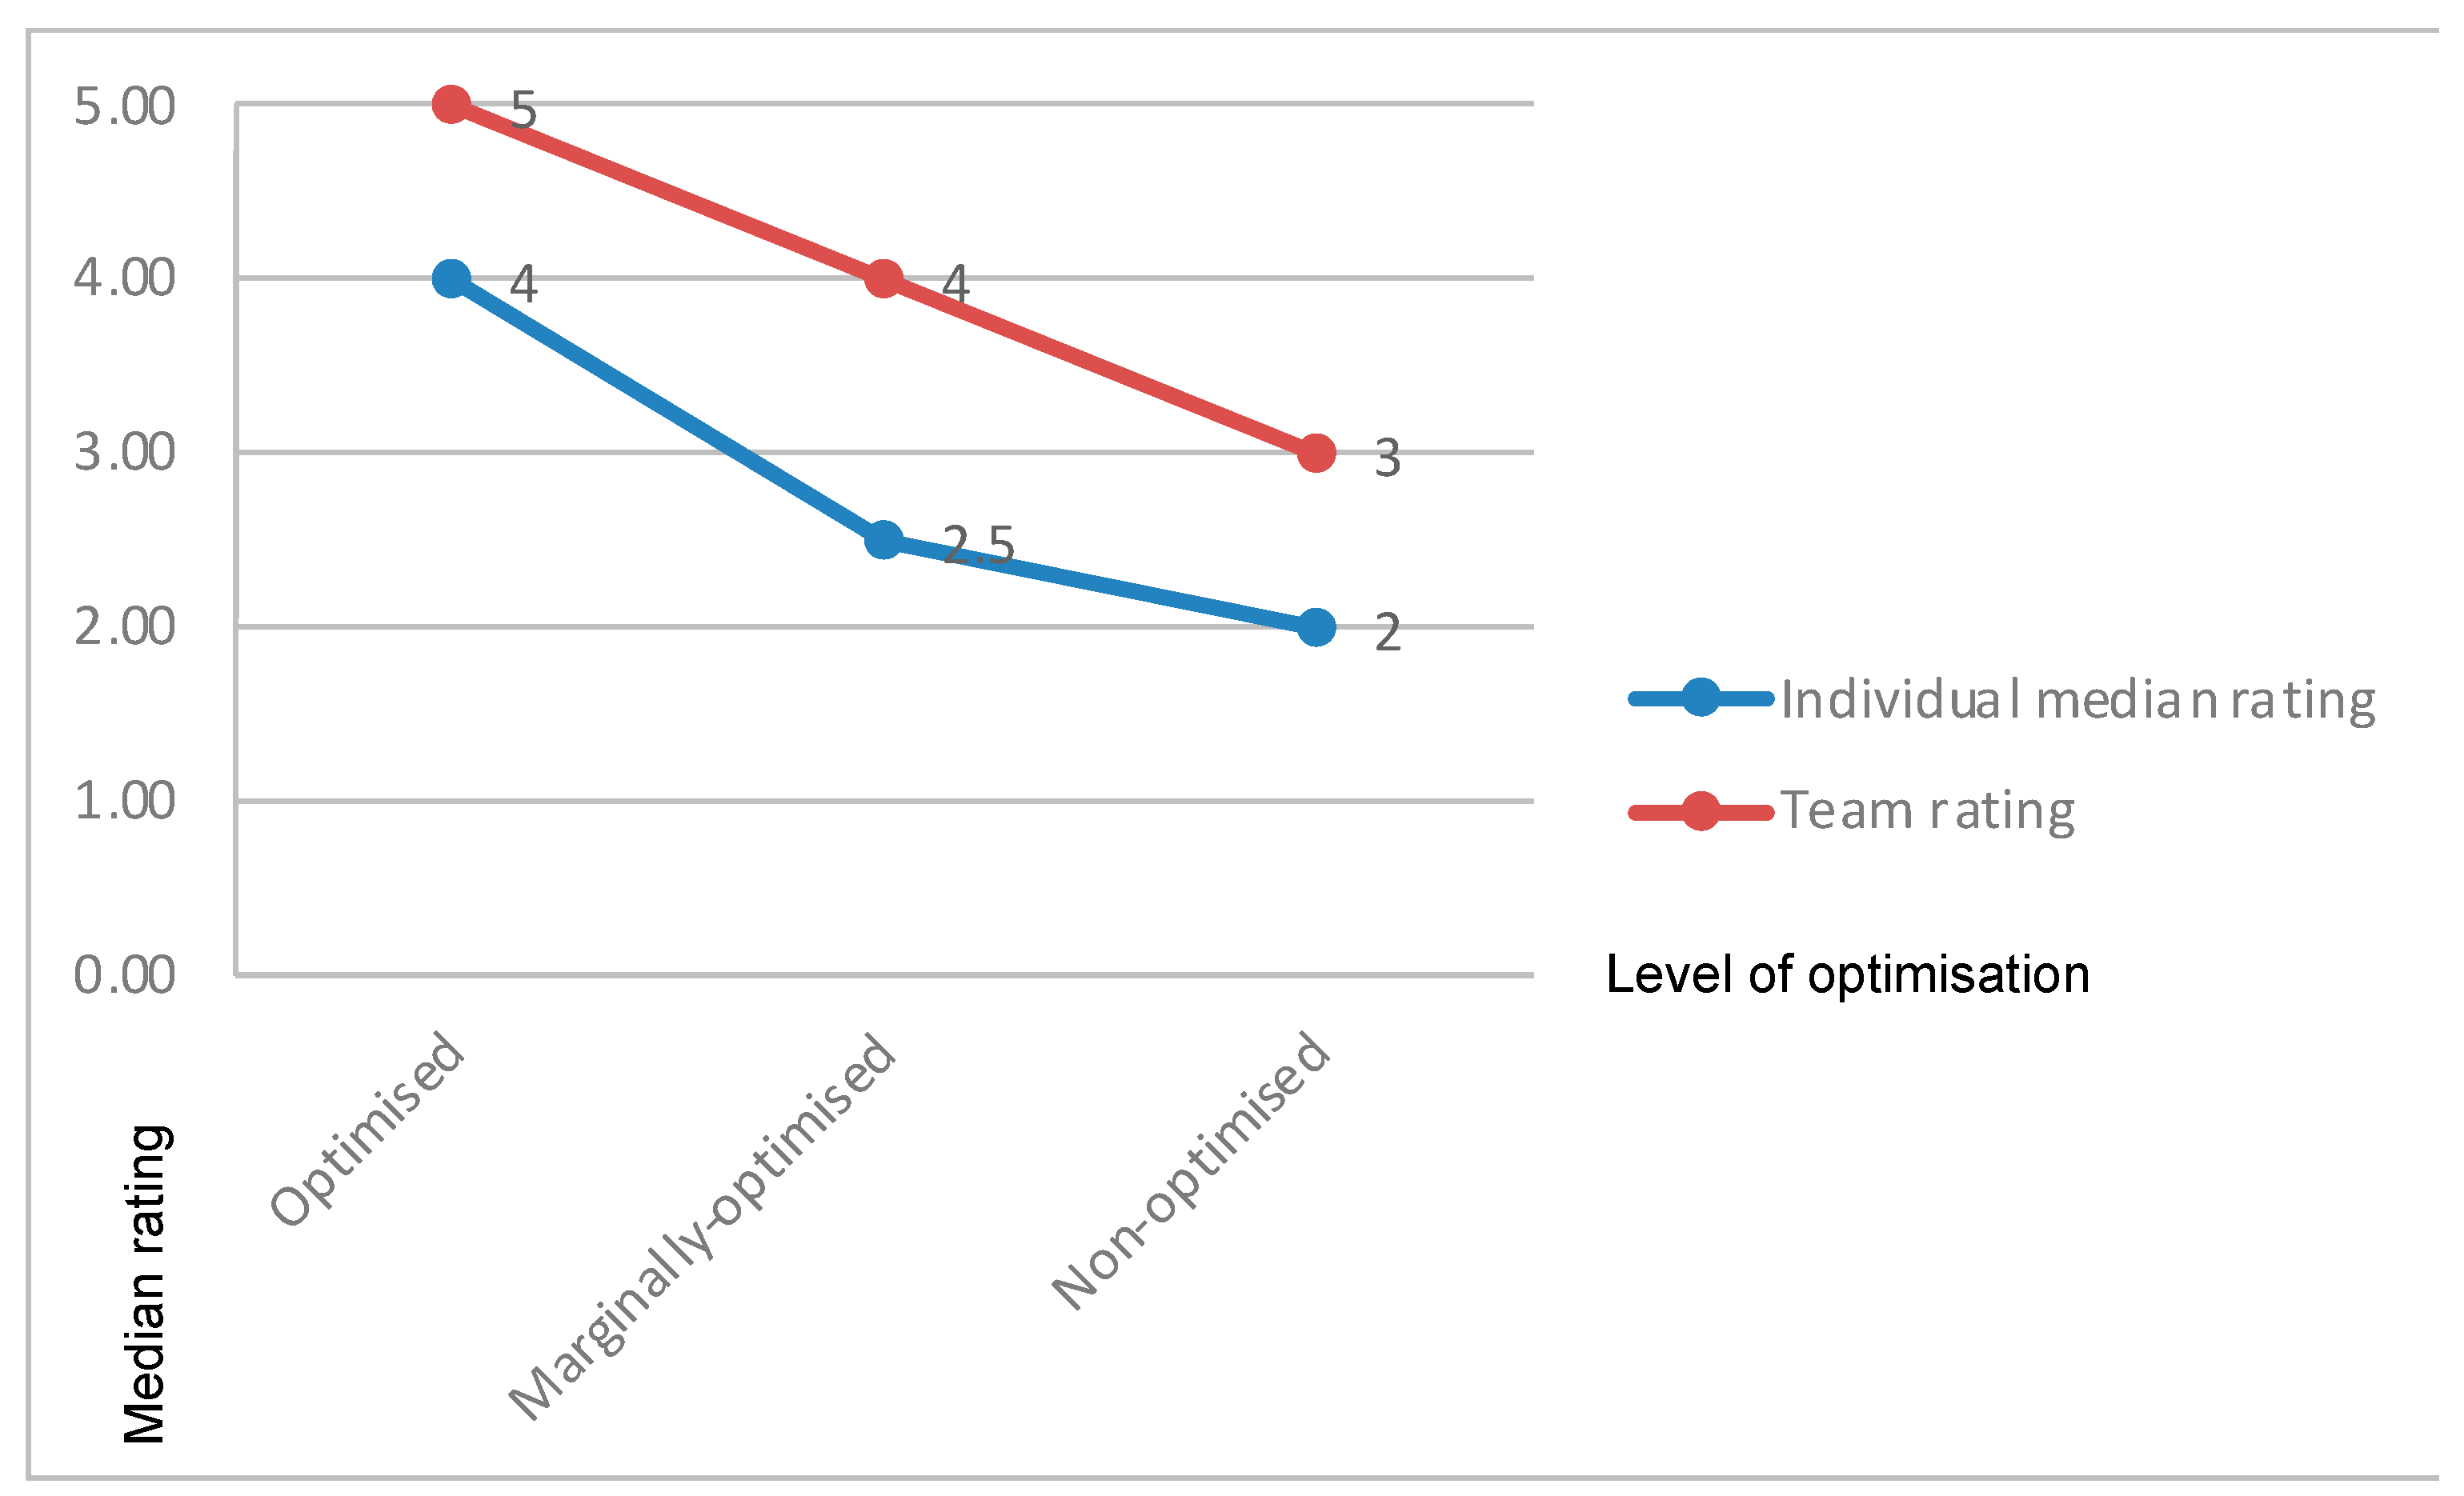
4.2.1. E1 ‘Establishing the Context’

Figure 4 illustrates the median ratings given to participants when completing the risk scenario exercise alone compared to completing it in their team. Participants’ E1 ratings were better when working in teams than when working alone. The collectively optimised team’s E1 rating was better than the marginally optimised and sub-optimised teams.
The Kruskal–Wallis test found a significant difference in the three teams’ E1 ratings, H(2), T = 17, p < 0.001. Post hoc tests (adjusting for the number of tests) showed that there was a significant difference between the collectively optimised team (MDN = 5.00) and the sub-optimised team (MDN = 2.00), T = 4.12, p < 0.001. There was no significant difference between the collectively optimised team and the marginally optimised team (MDN = 4.00, T = 2.06, p = 0.12) or between the marginally optimised team and the sub-optimised team (T = 2.06, p = 0.12).
The Wilcoxon test confirmed that participants’ E1 ratings were significantly better when they conducted the task in a team (MDN = 4.00), compared to when they completed it individually (MDN = 2.50), Z = −3.71, p < 0.001.

4.2.2. E2 ‘Risk Identification’

Figure 5 illustrates the median ratings given to participants when completing the risk scenario exercise alone compared to completing it in their team. Participants’ E2 ratings were better when working in teams than when working by themselves. The collectively optimised team’s E2 performance was better than that of the marginally optimised and sub-optimised teams.
The Kruskal–Wallis test found a significant difference in the three teams’ E2 ratings, H(2), T = 17, p < 0.001. Post hoc tests (adjusting for the number of tests) showed that the collectively optimised team’s ratings (MDN = 5.00) were significantly different to the sub-optimised team’s ratings (MDN = 3.00), T = 4.12, p < 0.001. There was no significant difference between the collectively optimised team and the marginally optimised team (MDN = 4.00, T = 2.06, p = 0.12) or between the marginally optimised team and sub-optimised team (T = 2.06, p = 0.12).
The Wilcoxon test confirmed that participants’ E2 ratings were significantly better when they conducted the task in a team (MDN = 4.00) compared to completing it individually (MDN = 2.50), Z = −3.79, p < 0.001.

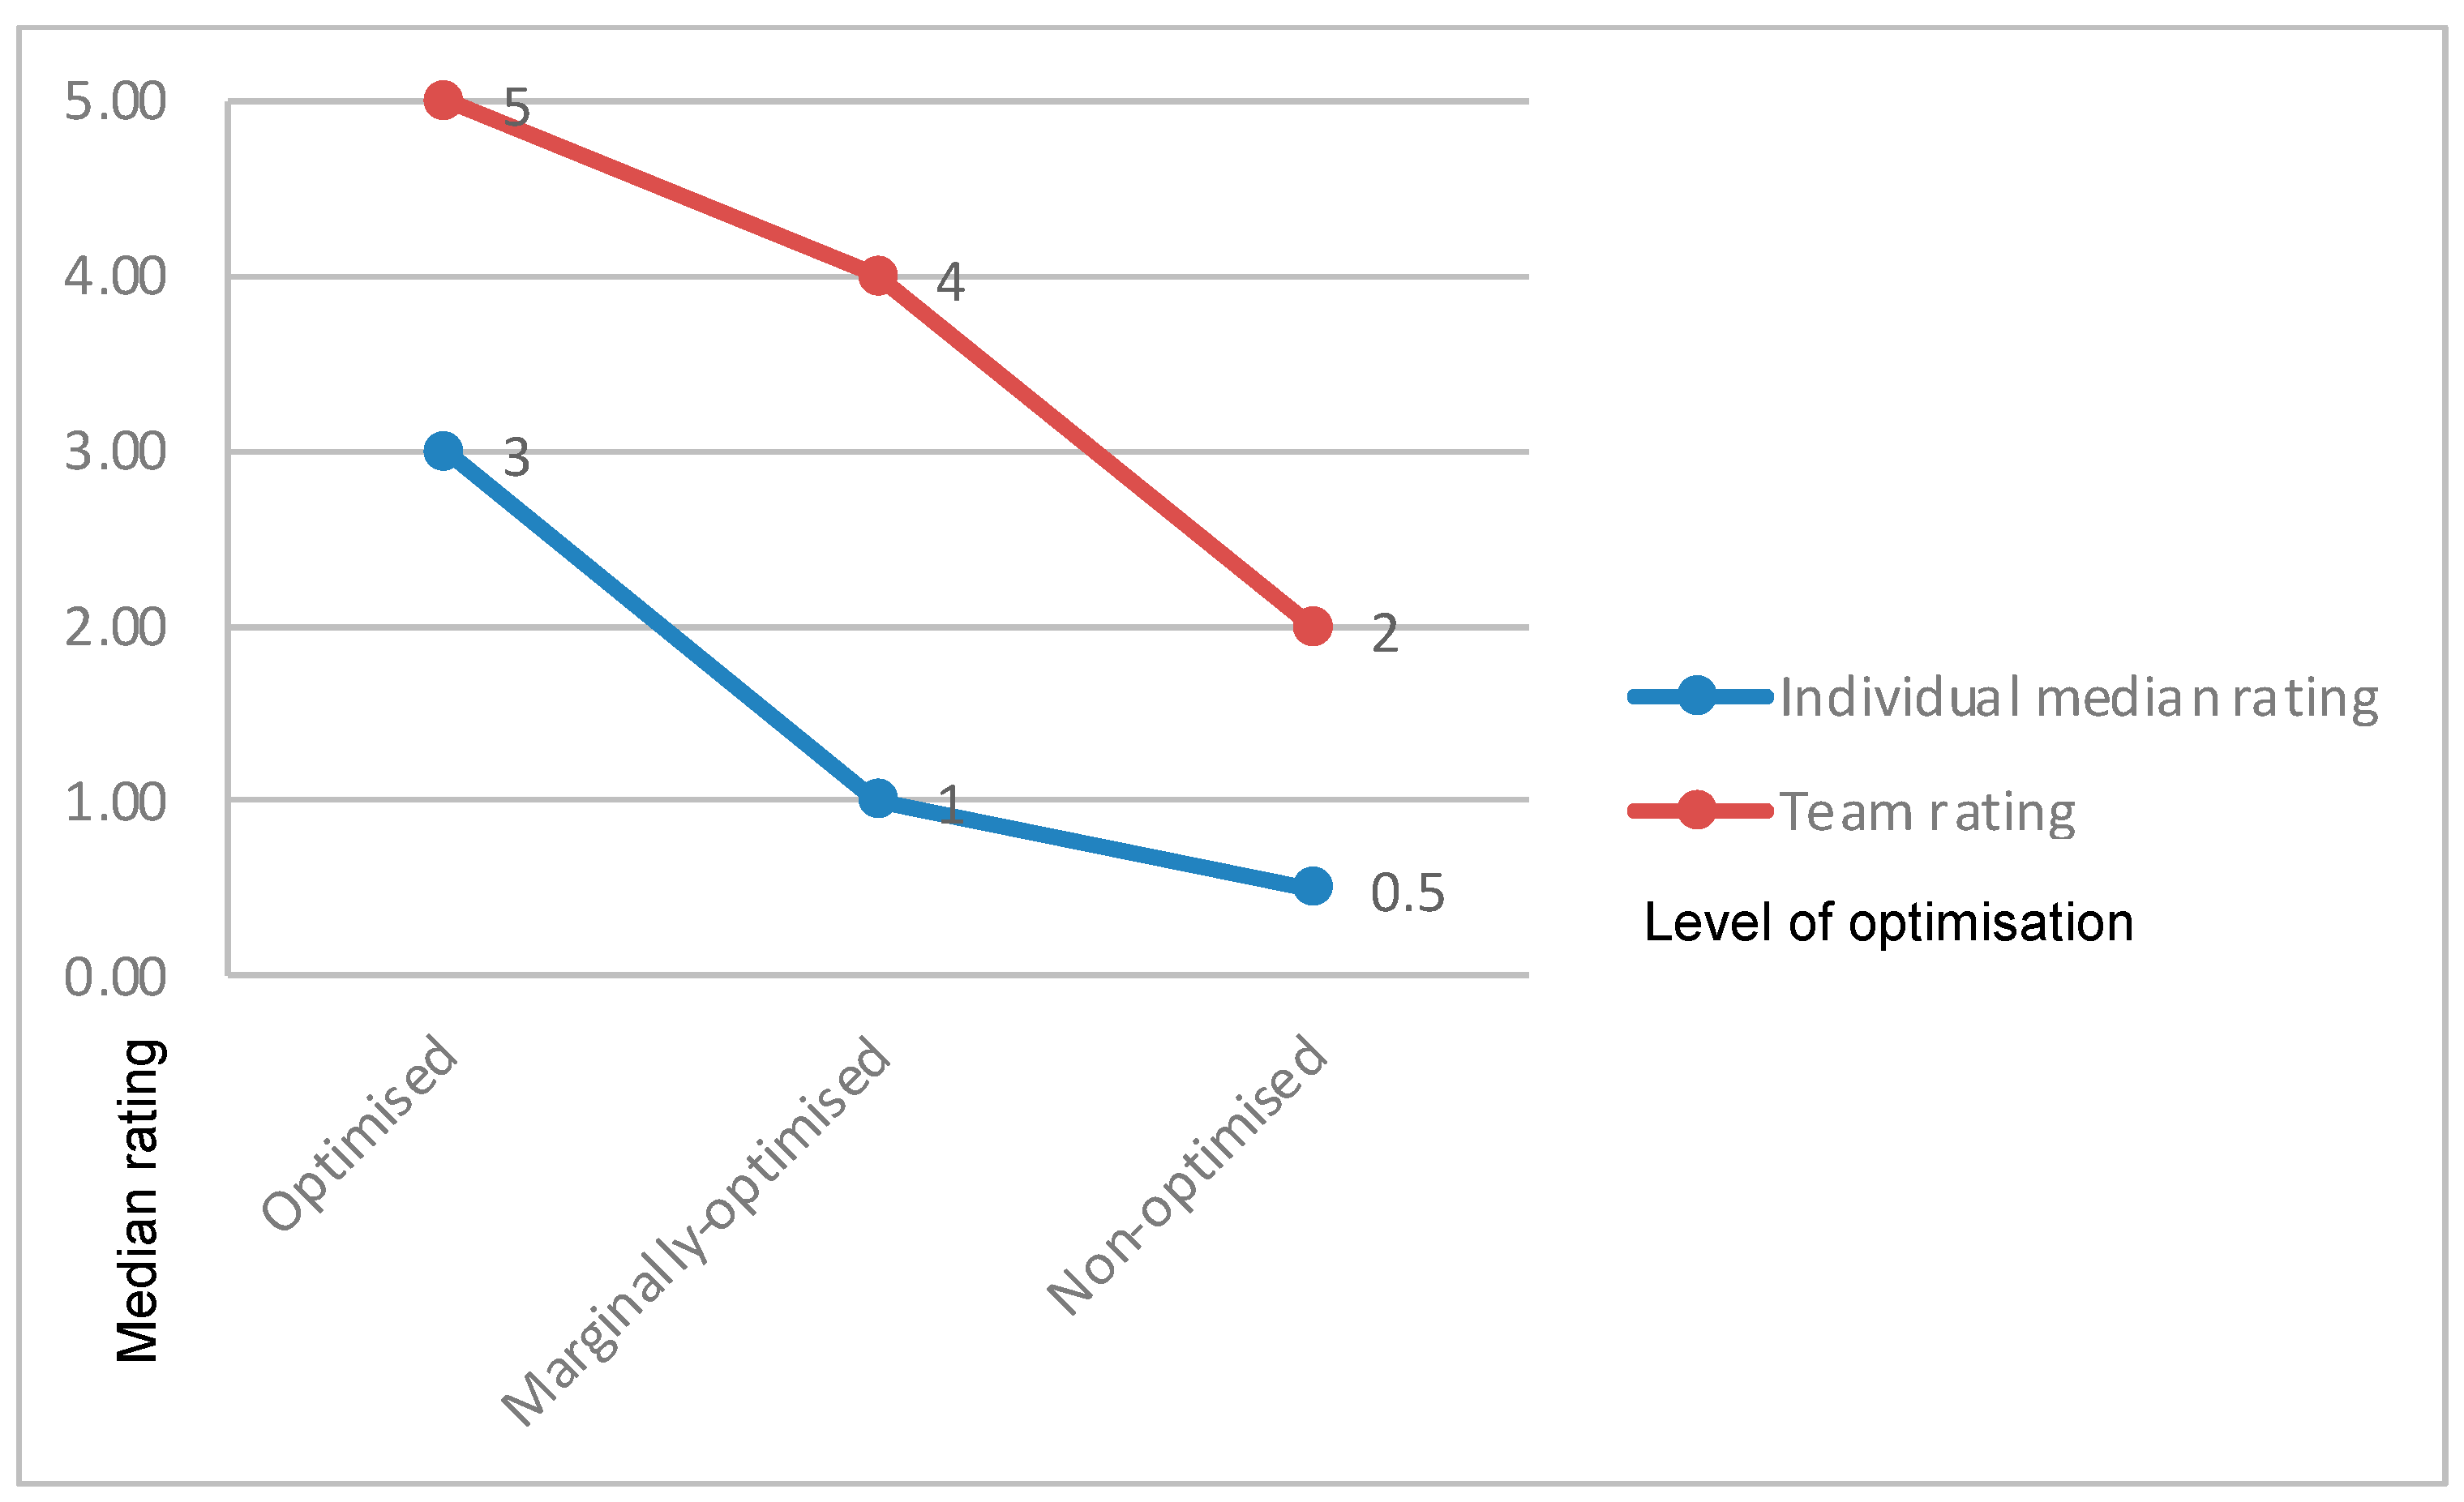
4.2.3. E3 ‘Risk Analysis’

Figure 6 illustrates the median ratings given to participants when completing the risk scenario exercise alone compared to completing it in their team. Participants’ E3 ratings were better when working in teams than alone. The collectively optimised team’s E3 ratings were better than that of the marginally optimised and sub-optimised teams.
The Kruskal–Wallis test found a significant difference between the three teams’ E3 ratings, H(2), T = 17, p < 0.001. Post hoc tests (adjusting for the number of tests) showed that there was a significant difference between the collectively optimised team (MDN = 5.00) and the sub-optimised team (MDN = 2.00), T = 4.12, p < 0.001. There was no significant difference between the collectively optimised team and the marginally optimised team (MDN = 4.00, T = 2.06, p = 0.12) or between the marginally optimised team and sub-optimised team (T = 2.06, p = 0.12).
The Wilcoxon test confirmed that participants’ E3 ratings were significantly higher when they conducted the task in a team (MDN = 4.00) compared to completing it individually (MDN = 1.00), Z = −3.56, p < 0.001.

4.2.4. E4 ‘Risk Evaluation’

Figure 7 illustrates the median ratings given to participants when completing the risk scenario exercise alone compared to completing it in their team. Participants’ E4 ratings were better when working in teams than when working alone. The collectively optimised team’s E4 performance was better than that of the marginally optimised and sub-optimised teams.
The Kruskal–Wallis test found a significant difference between the three teams’ E4 ratings, H(2), T = 17, p < 0.001. Post hoc tests (adjusting for the number of tests) showed that there was a significant difference between the collectively optimised team (MDN = 4.00) and the sub-optimised team (MDN = 3.00), T = 3.57, p = 0.001 and also between the marginally optimised team (MDN = 4.00) and the sub-optimised team (T = 3.57, p = 0.001). There was no significant difference between the collectively optimised and marginally optimised teams (T = 1.00, p = 1.00).
The Wilcoxon test confirmed that participants’ E4 ratings were significantly higher when they conducted the task in a team (MDN = 4.00) compared to completing it individually (MDN = 2.00), Z = −3.68, p < 0.001.

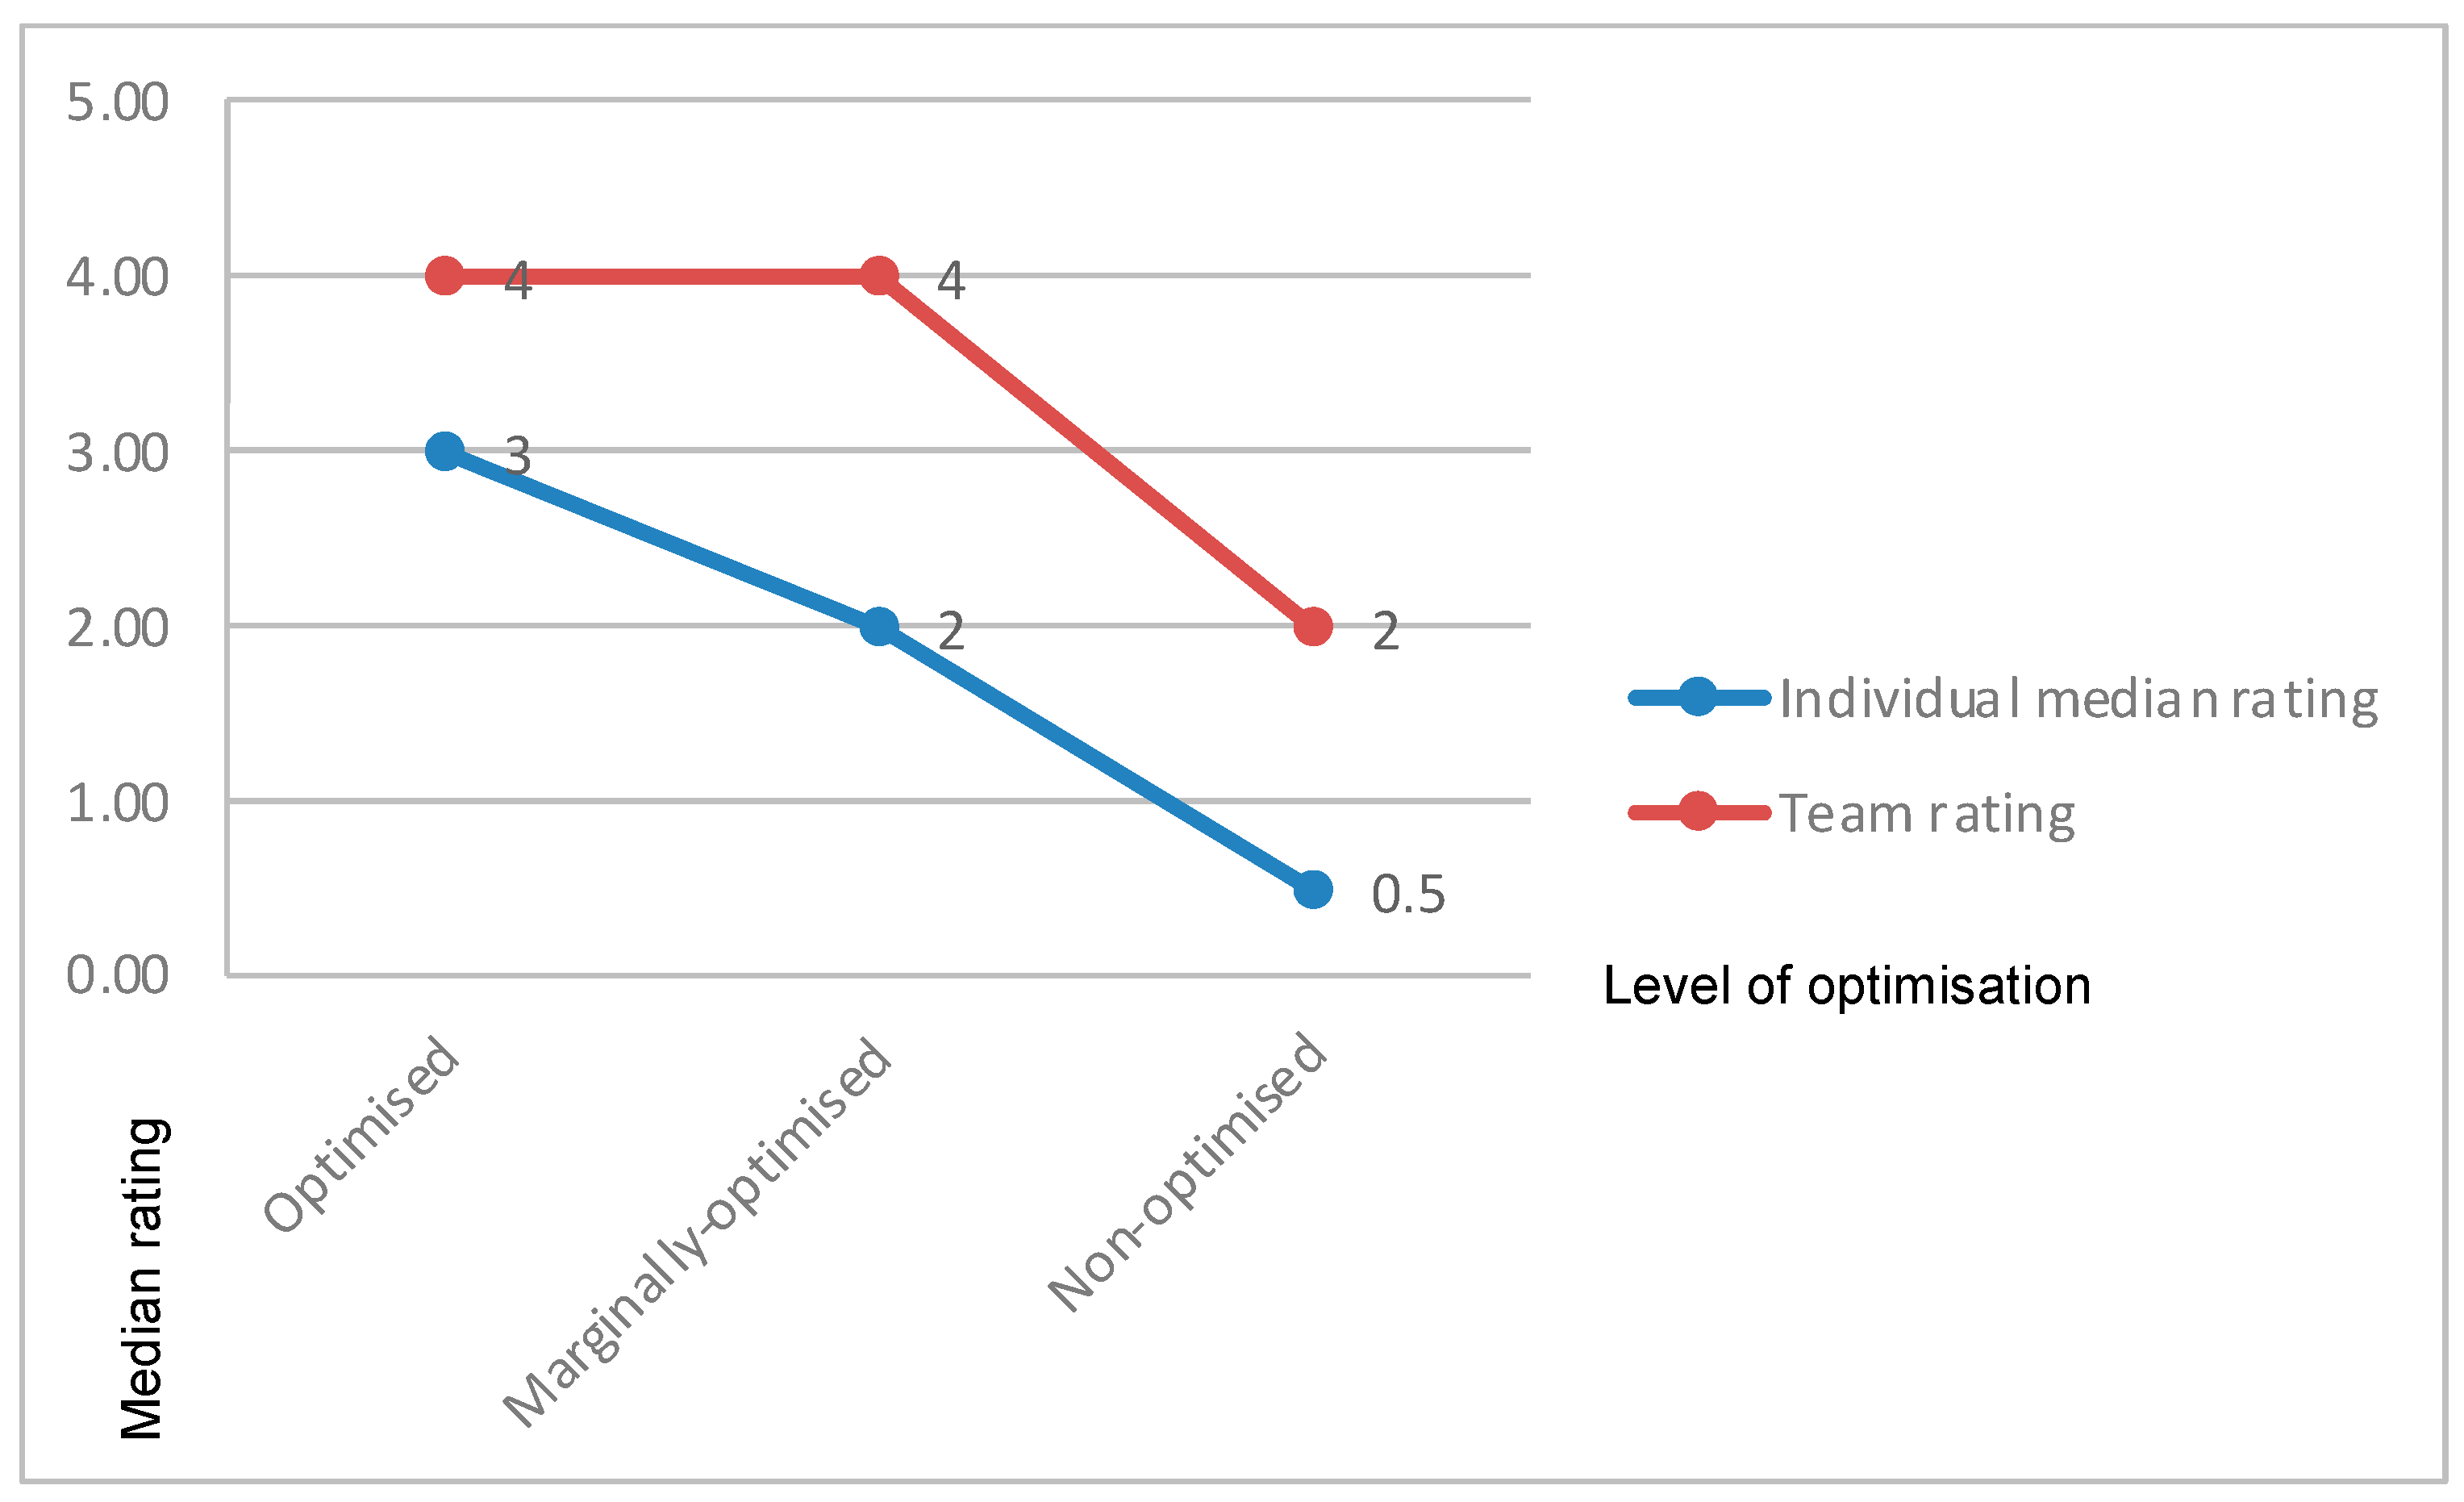
4.2.5. E5 ‘Risk Treatment’

Figure 8 illustrates the median ratings given to participants when completing the risk scenario exercise alone compared to completing it in their team. Participants’ E5 ratings were better when working in teams than when working alone. The collectively optimised team’s E5 ratings were better than that of the marginally optimised and sub-optimised teams’ ratings.
The Kruskal–Wallis test found a significant difference in the three teams’ E5 ratings, H(2), T = 17, p < 0.001. Post hoc tests (adjusting for the number of tests) showed that there was a significant difference between the collectively optimised team (MDN = 5.00) and the sub-optimised team (MDN = 3.00), T = 3.57, p = 0.001 and between the collectively-optimised team (MDN = 3.00) and the marginally optimised team (T = 3.57, p = 0.001). There was no significant difference between the marginally optimised and sub-optimised teams (T = 1.00, p = 1.00).
The Wilcoxon test confirmed that participants’ E5 ratings were significantly better when they conducted the task in a team (MDN = 3.00) compared to completing it individually (MDN = 2.00), Z = −3.70, p < 0.001.

4.2.6. E6 ‘Communication and Consultation’

Figure 9 illustrates the median ratings given to participants when completing the risk scenario exercise alone compared to completing it in their team. Participants’ E6 ratings were better when working in teams than when working alone. The collectively optimised team’s E6 ratings were better than that of the marginally optimised and sub-optimised teams.
The Kruskal–Wallis test found a significant difference in the three teams’ E6 ratings, H(2), T = 17, p < 0.001. Post hoc tests (adjusting for the number of tests) found a significant difference existed between the collectively optimised team (MDN = 5.00) and the sub-optimised team (MDN = 2.00), T = 4.12, p < 0.001. There was no significant difference between the collectively optimised team and the marginally optimised team (MDN = 4.00, T = 2.06, p = 0.12) or between the marginally optimised team and sub-optimised team (T = 2.06, p = 0.12).
The Wilcoxon test confirmed that participants’ E6 ratings were significantly higher when they conducted the task in a team (MDN = 3.00, SD = 1.28) compared to completing it individually (MDN = 1.00), Z = −3.44, p < 0.001.

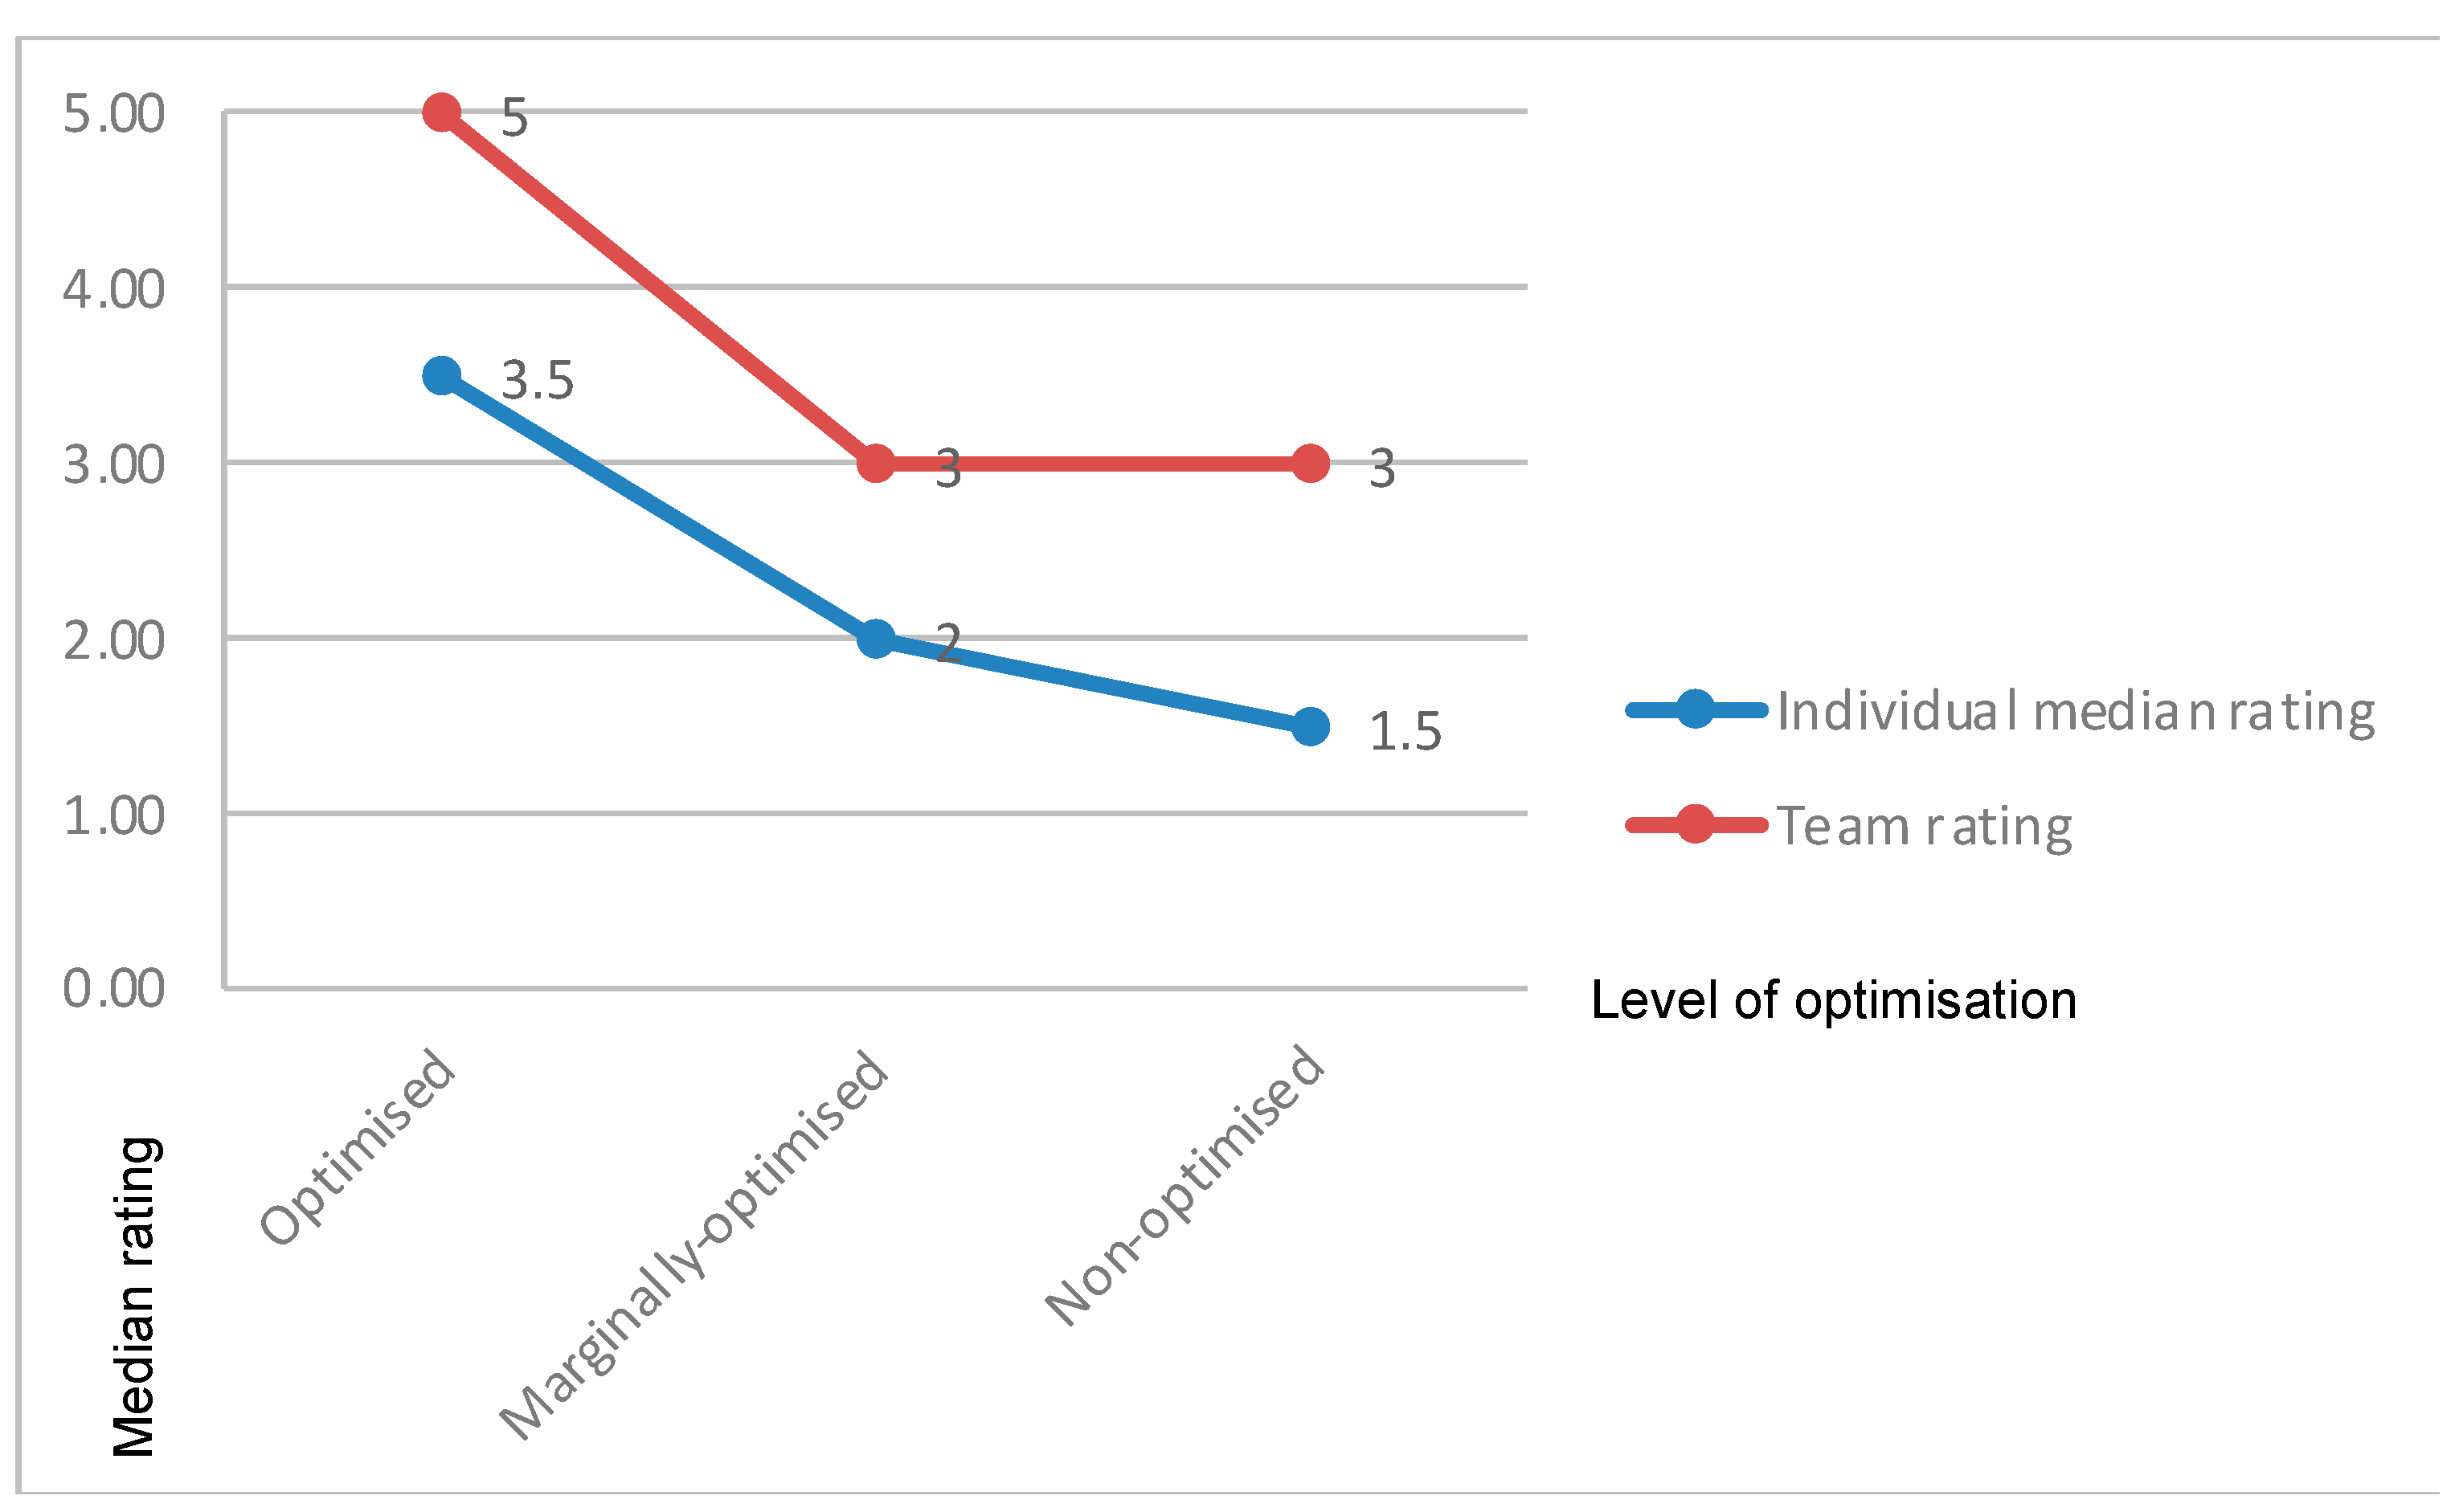
4.2.7. E7 ‘Monitor and Review’

Figure 10 illustrates the median ratings given to participants when completing the risk scenario exercise alone compared to completing it in their team. Participants’ E7 ratings were better when working in teams than when working alone. The collectively optimised team’s E7 ratings were better than that of the marginally optimised and sub-optimised teams.
The Kruskal–Wallis test found a significant difference in the three teams’ E7 ratings, H(2), T = 17, p < 0.001. Post hoc tests (adjusting for the number of tests) showed that a significant difference existed between the collectively optimised team (MDN = 4.00) and the sub-optimised team (MDN = 1.00), T = 4.12, p < 0.001. There was no significant difference between the collectively optimised team and the marginally optimised team (MDN = 3.00, T = 2.06, p = 0.12) or between the marginally optimised team and the sub-optimised team (T = 2.06, p = 0.12).
The Wilcoxon test confirmed that participants’ E7 ratings were significantly higher when they conducted the task in a team (MDN = 3.00, SD = 1.28) compared to completing it individually (MDN = 0.00), Z = −3.45, p < 0.001.

5. Discussion

This study aimed to determine if a team collectively competent in risk management performed a WHS risk management exercise better than less optimised teams and whether teams performed this task better than individuals.
A collectively optimised team was formed by selecting participants with a high competency level in all seven elements of the risk management process. Typically, individuals in this team were highly competent in three or four elements.
This study shows that the collectively optimised team performed the task better than the other teams (marginally optimised, sub-optimised) across every element. While the median rank ratings for the seven elements were elevated for the collectively optimised team compared to other teams, a significant difference only existed between the collectively optimised and sub-optimised teams’ performance in all seven elements. The collectively optimised team’s performance was only significantly better than that of the marginally optimised team in one element—the risk treatment element. The marginally optimised team’s performance was only significantly better than that of the sub-optimised team on the risk evaluation element.
Interestingly, the collective risk experience medians could explain the difference in performance between the sub-optimised and marginally optimised teams, and in the sub-optimised and collectively optimised teams. That said, it does not explain the difference in performance between the marginally optimised, sub-optimised and collectively optimised teams, with the collective risk experience medians for each of these teams being the same.
The collectively optimised team’s improved performance cannot be explained due to differences in experience at working at heights, experience conducting working at heights risk management or general risk management processes. No significant difference was found between teams’ mean years of experience on these factors. The study also used two observers to rate teams’ performances, whose ratings were strongly and positively correlated (r = 0.84), suggesting that the ratings were less amenable to bias.
This study also shows that participants’ ratings were significantly better when they performed the risk scenario exercise in teams than when they undertook it themselves. It could be argued that this improvement was due to a learning effect, due to the same test being completed on two occasions (despite an eight-month break). However, the control group undertook the task (albeit alone) on two occasions with the same interval, and their ratings did not significantly improve over time (see the second study (Marling et al. [3]) for a description).
Risk management for WHS issues is best conducted in teams because a collective mind (of experts) can better ensure that the causes and consequences of a potentially hazardous event are identified and suitably controlled to minimise risk to an acceptable level Greizinger, T. [49]). This is particularly true in specific contexts, such as with non-routine problems and in dynamic and uncertain situations where cross-functional and diverse work teams are better placed to manage the varied and complex associated factors (van Knippenberg and Schippers [30]). However, there is a gap in the empirical literature to support using teams to undertake risk management in WHS. To the authors, research lacks the benefits of using teams and the type of teams to use when undertaking risk management in WHS. This information could better inform organisations’ risk management practices.
This study provides evidence showing that teams’ risk management outcomes are better than that of individuals. It also shows that a collectively competent team performs significantly better in all the elements of the risk management process, including establishing the context, risk identification, risk analysis, risk evaluation, risk treatment, communication and consultation and monitoring and reviewing. The difference in performance was particularly evident between the optimised and sub-optimised teams. An implication is that it would be better for organisations to carefully assemble teams based on individuals’ risk management competence, rather than simply assembling ad hoc teams on the fly.
Note that there is a ceiling effect for the collectively optimised team: their team competency rating could not exceed some of their highest individual ratings. A pleasing aspect for all teams is that their team competency rating for each element of the risk management process equalled or excelled their highest personal competency rating; however, a significant improvement was observed, compared to the team’s median.
The first study (Marling et al. [2]), the second study (Marling et al. [3]) and this third study have tested the hypothesis that risk management is best conducted in carefully formed teams, with members that are collectively competent in the seven elements of the risk management process. A tool must be developed to assess individuals’ risk management competence to form such a team. The first study (Marling et al. [2]) described the creation of such a tool. The success of this team exercise was based on a tool that could form a collectively optimised team. Therefore, this third study bolsters the 360° performance tool’s veracity, named here the RISKometric.
An interesting aside from the demographics outlined in Table 2, in Section 3.1, is that team A, the collectively optimised team, were significantly younger (on average). They had less experience in risk management than the other two teams. A reason for this might be that younger people generally have been exposed to the risk management standards earlier in their careers and are not conditioned to ‘old school’ methods of managing risk, but instead take a systematic approach to engaging the seven risk management process elements.
In this third study, evidence supports the aim to determine that teams that are collectively competent (or proficient) in the seven elements of the risk management process can control and manage risks better than less optimised teams or people working individually. McEwan et al.’s study [15] further supports this, emphasising that the efficacy of teamwork interventions is often measured by the extent to which teams achieve their pre-set objectives. This aligns with this study’s focus on collective competence in risk management.
So, putting all the evidence together from Marling et al. [3] and this study results in the observation that teams collectively optimised (or competent) in the seven elements of the risk management process can perform risk management better than less optimised teams (i.e., marginally optimised and sub-optimised or people working individually).

6. Overall Outcomes and Recommendations for Future Work

In response to the deficiency found in organisations regarding the ineffective use of personnel to conduct the risk management process (Emery [50]; Trist [51]; Hayes [52]; Flin et al. [53]; Lyon and Hollcroft [54]) a method was developed to help form teams of individuals who are collectively competent in the seven elements of the risk management process. As part of this process, a means to assess individuals’ competence in the seven elements of the risk management process was developed (RISKometric), by Marling et al. [2,3].
This final study was then undertaken, to test whether performance in a risk management scenario was better if conducted in teams than when undertaken by individuals. This study also tested whether performance differed according to whether teams were collectively, marginally or sub-optimised in competency (regarding the seven elements).
Utilising the RISKometric, peers and upline and downline colleagues provided feedback to establish the competency of 26 participants in each of the elements of the risk management process. Participants also offered self-ratings. It was found that the ratings given by peers and downline colleagues were strongly and positively correlated for each of the participants across the seven elements of the risk management process, with correlations ranging between r = 0.43 and 0.90. Prior research has indicated that the ratings given by downline colleagues in 360° performance tools are generally more correlated with actual performance, thereby indicating more robust reliability (Marling et al. [2,3]).
To compare these participants’ ratings in an actual risk management exercise, Marling et al. [3] developed and described a scenario involving working at heights and simultaneous operations. The same 26 participants completed the risk scenario exercise individually. The results were then assessed independently by two observers, who rated participants’ competence in applying the seven risk management process elements to the scenario. The observers’ ratings achieved high inter-rater reliability. Notably, observers’ ratings were highly correlated with those previously given to participants (by peers and downline colleagues) when undertaking the 360° performance tool. Therefore, evidence was found that the 360° performance tool (RISKometric) results corresponded with actual performance (as measured by the risk scenario exercises).
This part of this evaluation was to determine whether teams (of varying competence levels), as opposed to individuals, performed better in the risk scenario exercise. All 26 individuals repeated the risk scenario exercise eight months after initially completing the task; 18 were formed into three teams of six, and the other eight undertook it individually. In assessment one, participants’ performance was rated using the same method (and the same observers).
The performance of the eight participants who undertook the exercise individually on both occasions (i.e., the control group) remained stable across time, with no significant difference between round one and two ratings (Marling et al. [3]).
The three teams were assembled based on competency ratings in the first risk scenario exercise. The collectively optimised team was assembled such that at least one participant had the highest rating in each of the seven elements of the risk-managed process. The marginally optimised team ratings were in the mid-ranges for each element, and the sub-optimised team had the lowest ranges.
For each of the seven elements, it was found that team performance (round two) was better than individual performance (round one) (Marling et al. [3]). The collectively optimised team also performed better in all seven elements than the others (marginally optimised, sub-optimised). However, these differences were only significant between the optimised and sub-optimised teams.
A learning effect could not explain how team performance was significantly better than individual performance, despite the participants undertaking the task on two occasions (Marling et al. [2,3]). The control group also completed the exercise twice (at the same interval), and their performance remained stable over time (Marling et al. [2,3]).

6.1. Recommendations for Future Work

Future work may include enriched research participation for the RISKometric and introducing smart data capture and analysis for the RISKometric.

6.1.1. Further Research Regarding the Use of Teams to Conduct the Risk Management Process

An essential outcome of this research is that teams provide better risk management outputs than individuals. This represents preliminary findings, and further evidence is required to support this premise. Further evidence that supports the benefits of using teams may incentivise organisations to alter their practices for risk management. Another associated area of research is to define when teams should be used; for example, should teams always be used in the informal (operational) aspects of work, or is it acceptable to keep with the current practice of undertaking the risk management practice individually?

6.1.2. RISKometric

Although the study focused on high-risk industries, there was high participation in the mining and construction industries (i.e., 57% of participants) (Marling et al. [3]). Future work could include a focus on high-risk industries other than mining and construction.
Increasing the data size and ensuring the sample is truly random may confirm, or otherwise, the RISKometric findings of this small and non-representative sample. As part of this enriched participation, consideration could be given to including stratified studies, to reflect potential differences in countries, ethnicity, gender, industries and levels in the organisation.
The study involved a vertical slice of feedback within the organisation where the participant worked (i.e., upline and downline colleagues and peers). There may be merit in gathering data about risk competence from diagonal sources. Often, in risk forums, people come together from other business areas, so upline or downline colleague or peer feedback from individuals from other divisions/departments (i.e., a diagonal slice) may add valuable insight regarding a person’s competency in the seven elements of the risk management process. It may also be advantageous to consider soliciting feedback from colleagues outside the work environment. For example, suppose a person belonged to a woodwork club, football club or parachuting group. In that case, colleagues from those groups may be able to provide insight into managing the risk that is not observable at work.
The data collection for the RISKometric was simple enough on SurveyMonkeyTM; however, the analysis would be time-consuming for organisations. Perhaps the data collection and analysis could be undertaken through an application on a smart device, such as a phone or a tablet. The back-end analysis could be conducted on an online database and analysed by logging into the website with a username and password. This would allow administrators and individuals to view the results through their usernames and passwords. The individuals could then carry this history with them as they move from job to job. This simplified data collection would allow risk forum participants to access the RISKometric, activated at the end of each risk forum so that an individual’s competency results could be dynamically updated; thus, improvements or otherwise could be tracked to identify where a star performer could be a mentor for an element of the process or where someone struggling might require mentoring/training in an element of the process. The database could also be used to identify an individual’s frequency of participating in risk forums for any high-risk activities and participating in general risk forums. This could be integrated with the RISKometric data so that, at the press of a button, the most appropriate people can be assembled at short notice to form a collectively optimised risk management team or at least flag if the members used were marginally optimised or sub-optimised. Access to this technology could speed up risk team assembly in both the office and the field.
The risk scenario exercise developed for this research was limited to a few high-risk activities, mainly ‘working at height’ and ‘simultaneous operations’ (Marling et al. [3]). Perhaps a suite of risk scenario exercises and rating criteria should be developed, to further confirm an individual’s competency in each of the seven elements of the risk management process. These scenarios could also be used as a refresher/training tool for high-risk activities. Furthermore, the risk scenario exercises could be scoped for domains other than WHS, including but not limited to finance, information technology, security, environmental and social.
In further research, the focus could be on assessing the risks associated with major accident scenarios. Applying algorithms and their methods in WHS, such as the risk matrix, offers a straightforward approach to evaluating specific hazards, including falls from heights, crushing, cutting, and many others.
In the earlier exploratory work in study one, Marling et al. [2] had a much larger sample size than in study two (Marling et al. [3]). As such, the analysis in study one could be stratified by level in the management hierarchy. A more granular analysis could be undertaken with a larger dataset for the RISKometric at an industry and management hierarchy level. Also, with a larger dataset, the analysis could be conducted on different team makeups, i.e., a few expert competency people with mainly low to no levels of competency, or vice versa, and could review if, in a longitudinal study, these team makeups can assist as a training ground to increase the competency for those with lower levels of competency in any of the elements of the risk management process.
There was a strong and positive association between the peer and downline colleagues’ ratings in the RISKometric and the risk scenario exercise results (Marling et al. [2,3]). As such, using simple averages demonstrated a scaling effect that could be useful, but this could be misleading from a true statistical point of view. With a larger dataset, further analyses could be undertaken to determine a scaling factor between the risk competency perception of peers, upline and downline colleagues and self-rating, with the actual performance of the various levels of the management hierarchy in risk forums.

7. Conclusions

Since the 1970s, risk management has been a process used to help people make better decisions. However, with the confusion about the definitions of the seven elements of the risk management process compounded by the non-optimisation of teams with a collective competence in those seven elements, risk management outcomes have been less than satisfactory. Studies one (Marling et al. [2]) and two (Marling et al. [3]) deliver an emerging tool (the RISKometric) that can identify where people are competent in each of the seven elements of the risk management process. Additionally, this information can help assemble teams that are collectively competent in those seven elements of the risk management process. The outcome is that team performance in risk management is better than individual performance and even better than a collective of individuals, when the team has been collectively optimised for competence in the seven elements of the risk management process.
With the recent focus on managing the triple bottom line of time, cost and quality, the importance of collectively managing WHS risk cannot be over-emphasised (Zou and Sunindijo [55]). This research can be seen as the first step for widespread use in collectively optimising risk management teams across many industries, not just the mining and construction industry, where much of the research is focused. Many of these industries have an unrealistic vision of ‘zero-harm’, which Burnham [56] describes as counterproductive to WHS efforts. Using the RISKometric may help move them to the realm of making sense of risk and integrating appropriate risk-taking within their business operations.

Author Contributions

Conceptualization, G.M.; formal analysis, G.M.; investigation, G.M.; methodology, G.M.; supervision, T.H. and J.H.; writing—original draft, G.M.; writing—review and editing, G.M. All authors have read and agreed to the published version of the manuscript.

Funding

This research received no external funding.

Institutional Review Board Statement

The study was conducted under the approval of the University of Queensland Ethics Committee (protocol code 2009001137 and date of approval 21 July 2009).

Informed Consent Statement

Informed consent was obtained from all subjects involved in the study.

Data Availability Statement

The data presented in this study are available on request from the corresponding author. The data are not publicly available due to privacy.

Conflicts of Interest

The authors declare no conflicts of interest.

Appendix A

Table A1. Results of the risk scenario exercise undertaken by all teams, as rated by O1 and O2 and then agreed.
Group CodeElement 1Element 2Element 3Element 4Element 5Element 6Element 7
O1O2AO1O2AO1O2AO1O2AO1O2AO1O2AO1O2A
Group A555545555444555455444
Group B434344444344333434333
Group C222433222222343222111
Note: Element 1, Element 2…. Element 7 represents the seven elements of the risk management process. O1 and O2 represent the two observer raters. A represents the final agreed rating.

References

  1. Marling, G.J. Optimising Risk Management Team Processes. Ph.D. Thesis, University of Queensland, Brisbane, Australia, 2015. [Google Scholar]
  2. Marling, G.J.; Horberry, T.; Harris, J. Development and reliability of an assessment tool to measure competency in the seven elements of the risk management process: Part one—The RISKometric. Safety 2020, 7, 1. [Google Scholar] [CrossRef]
  3. Marling, G.; Horberry, T.; Harris, J. Development and Reliability Review of an Assessment Tool to Measure Competency in the Seven Elements of the Risk Management Process: Part Two—Evaluation of the Individual Results from the RISKometric Tool. Safety 2022, 8, 71. [Google Scholar] [CrossRef]
  4. Mathieu, J.; Maynard, M.T.; Rapp, T.; Gilson, L. Team Effectiveness 1997–2007: A Review of Recent Advancements and a Glimpse into the Future. J. Manag. 2008, 34, 410–476. [Google Scholar] [CrossRef]
  5. Kozlowski, S.W.J.; Bell, B.S. Work groups and teams in organizations. In Handbook of Psychology: Industrial and Organizational Psychology; Borman, W.C., Ilgen, D.R., Klimoski, R.J., Eds.; Wiley: London, UK, 2003; Volume 12, pp. 333–375. [Google Scholar]
  6. Cohen, S.G.; Bailey, D.E. What makes teams work: Group effectiveness research from the shop floor to the executive suite. J. Manag. 1997, 23, 239–290. [Google Scholar] [CrossRef]
  7. Devine, D.J. A review and integration of classification systems relevant to teams in organizations. Group Dyn. Theory Res. Pract. 2002, 6, 291–310. [Google Scholar] [CrossRef]
  8. Hackman, R. Groups that Work and Those that Don’t; Jossey-Bass: San Francisco, CA, USA, 1990. [Google Scholar]
  9. Sundstrom, E. The challenges of supporting work team effectiveness. In Supporting Work Team Effectiveness; Sundstrom, E., Associates, Eds.; Jossey-Bass: San Francisco, CA, USA, 1999; pp. 3–23. [Google Scholar]
  10. Reason, J.; Andersen, H.B. Errors in a Team Context; Mohawc Belgirate Workshop: Belgirate, Italy, 1991. [Google Scholar]
  11. Guzzo, R.A.; Dickson, M.W. Teams in organizations: Recent research on performance and effectiveness. Annu. Rev. Psychol. 1996, 47, 307–338. [Google Scholar] [CrossRef] [PubMed]
  12. Sasou, K.; Reason, J. Team errors: Definition and taxonomy. Reliab. Eng. Syst. Saf. 1999, 65, 1–9. [Google Scholar] [CrossRef]
  13. Bernsen, N.O.; Reason, J. Errors in a Team Context; Mohawc Belgirate Workshop: Belgirate, Italy, 1993. [Google Scholar]
  14. Salas, E.; Dickinson, T.L.; Converse, S.A. Toward an Understanding of Team Performance and Training. In Teams: Their Training and Performance; Swezey, R.W., Salas, E., Eds.; Ablex: Norwood, NJ, USA, 1992; pp. 3–29. [Google Scholar]
  15. McEwan, D.; Ruissen, G.R.; Eys, M.A.; Zumbo, B.D.; Beauchamp, M.R. The Effectiveness of Teamwork Training on Teamwork Behaviors and Team Performance: A Systematic Review and Meta-Analysis of Controlled Interventions. PLoS ONE 2017, 12, e0169604. [Google Scholar] [CrossRef]
  16. Hackman, J.R.; Katz, N. Group behavior and performance. In Handbook of Social Psychology, 5th ed.; Fiske, S.T., Gilbert, D.T., Lindzey, G., Eds.; John Wiley & Sons: West Sussex, UK, 2010; Volume 2, pp. 1251–1280. [Google Scholar]
  17. Finley, H.R.A.M. The New Why Teams Don’t Work. 2011. Available online: www.readhowyouwant.com (accessed on 11 March 2023).
  18. Hogan, R.; Raza, S.; Driskell, J.E. Personality, Team Performance, and Organizational Context. In Psychology and Productivity; Springer: Boston, MA, USA, 1988; pp. 93–103. [Google Scholar]
  19. Houghton, S.M.; Simon, M.; Aquino, K.; Goldberg, C.B. No Safety in Numbers: Persistence of Biases and Their Effects on Team Risk Perception and Team Decision Making. Group Organ. Manag. 2000, 25, 325–353. [Google Scholar] [CrossRef]
  20. Kaplan, R.S.; Leonard, D.; Mikes, A. Novel Risks; Working Paper Summaries, Working Knowledge; Harvard Business School: Boston, MA, USA, 27 March 2020. [Google Scholar]
  21. Cooper, A.C.; Woo, C.Y.; Dunkelberg, W.C. Entrepreneurs’ perceived chance of success. J. Bus. Ventur. 1988, 3, 97–108. [Google Scholar] [CrossRef]
  22. Feeser, H.R.; Willard, G.E. Founding strategy and performance: A comparison of high and low growth high tech firms. Strategy Manag. J. 1990, 11, 87–98. [Google Scholar] [CrossRef]
  23. McCarthy, S.M.; Schoorman, F.D.; Cooper, A.C. Reinvestment decisions by entrepreneurs: Rational decision-making or escalation of commitment? J. Bus. Ventur. 1993, 8, 9–24. [Google Scholar] [CrossRef]
  24. Tversky, A.; Kahneman, D. Judgment under uncertainty: Heuristics and biases. Science 1974, 185, 1124–1131. [Google Scholar] [CrossRef] [PubMed]
  25. Langer, E.J. The illusion of control. J. Pers. Soc. Psychol. 1975, 32, 311–328. [Google Scholar] [CrossRef]
  26. Russo, J.E.; Schoemaker, P.J.H. Managing overconfidence. Sloan Manag. Rev. 1992, 33, 7–17. [Google Scholar]
  27. Petriglieri, G.; Wood, J.D. The invisible revealed: Collusion as an entry to the team unconscious. Trans. Anal. J. 2003, 33, 332–343. [Google Scholar]
  28. Blanding, M. Crowdsourcing Is Helping Hollywood Reduce the Risk of Movie-Making; Working Paper Summaries, Working Knowledge; Harvard Business School: Boston, MA, USA, 2019. [Google Scholar]
  29. Sundstrom, E.; De Meuse, K.P.; Futrell, D. Work Teams: Applications and effectiveness. Am. Psychol. 1990, 45, 120–133. [Google Scholar] [CrossRef]
  30. van Knippenberg, D.; Schippers, M.C. Workgroup diversity. Annu. Rev. Psychol. 2007, 58, 515–541. [Google Scholar] [CrossRef]
  31. Mello, A.S.; Ruckes, M.E. Team Composition. J. Bus. 2006, 79, 1019–1039. [Google Scholar] [CrossRef]
  32. Harrison, D.A.; Price, K.H.; Bell, M.P. Beyond relational demography: Time and the effects of surface- and deep-level diversity on work group cohesion. Acad. Manag. J. 1998, 41, 96–107. [Google Scholar] [CrossRef]
  33. Hoffman, R.L.; Maier, N.R.F. Quality and acceptance of problem solutions by members of homogeneous and heterogeneous groups. J. Abnorm. Soc. Psychol. 1961, 62, 401–407. [Google Scholar] [CrossRef]
  34. van Knippenberg, D.; De Dreu, C.K.W.; Homan, A.C. Work group diversity and group performance: An integrative model and research agenda. J. Appl. Psychol. 2004, 89, 1008. [Google Scholar] [CrossRef]
  35. Carrillo, J.D.; Gromb, D. Culture in Organisations: Inertia and Uniformity; Discussion Paper # 3613; Centre for Economic Policy Research: London, UK, 2002. [Google Scholar]
  36. Bantel, K.; Jackson, S. Top management and innovations in banking: Does the composition of the top team make a difference? Strateg. Manag. J. 1989, 10, 107–124. [Google Scholar] [CrossRef]
  37. Madjuka, R.J.; Baldwin, T.T. Team-based employee involvement programs: Effects of design and administration. Pers. Psychol. 1991, 44, 793–812. [Google Scholar] [CrossRef]
  38. Jackson, S.E.; May, K.E.; Whitney, K. Understanding the dynamics of configuration in decision making teams. In Team Effectiveness and Decision Making in Organizations; Jossey-Bass: San Francisco, CA, USA, 1995; pp. 204–261. [Google Scholar]
  39. Brewer, M.B. In-group bias in the minimal intergroup situation: A cognitive-motivational analysis. Psychol. Bull. 1979, 86, 307–324. [Google Scholar] [CrossRef]
  40. Brewer, M.B.; Brown, R.J. Intergroup relations. In Handbook of Social Psychology, 2nd ed.; Gilbert, D.T., Fiske, S.T., Eds.; McGraw-Hill: New York, NY, USA, 1998; Volume 4, pp. 554–594. [Google Scholar]
  41. Tajfel, H.; Turner, J.C. The social identity theory of intergroup behavior. In Psychology of Intergroup Relations; Worchel, S., Austin, W., Eds.; Nelson Hall: Chicago, IL, USA, 1986; pp. 7–24. [Google Scholar]
  42. O’Reilly, C.A.; Caldwell, D.F.; Bennett, W.P. Work Group Demography, Social Integration, and Turnover. Admin. Sci. Q. 1989, 34, 21–37. [Google Scholar]
  43. Murnighan, J.K.; Conlon, D.E. The dynamics of intense work groups: A study of British string quartets. Admin. Sci. Q. 1991, 36, 165–168. [Google Scholar] [CrossRef]
  44. Campion, M.A.; Medsker, G.J.; Higgs, C. Relations between work group characteristics and effectiveness: Implications for designing effective work groups. Pers. Psychol. 1993, 4, 823–847. [Google Scholar] [CrossRef]
  45. O’Reilly, C.A.; Flatt, S. Executive Team Demography, Organisational Innovation and Firm Performance; University of California: Berkeley, CA, USA, 1989; (Unpublished manuscript). [Google Scholar]
  46. Anocona, D.G.; Caldwell, D.F. Demography and design: Predictors of new product team performance. Organ. Sci. 1992, 3, 321–341. [Google Scholar] [CrossRef]
  47. Triandis, H.C.; Kurowski, L.L.; Gelfand, M.J. Workplace diversity. In Handbook of Industrial and Organizational Psychology, 2nd ed.; Consulting Psychologists Press: Palo Alto, CA, USA, 1994; Volume 4, pp. 769–827. [Google Scholar]
  48. Field, A. Discovering Statistics Using IMB SPSS Statistics; Sage Publications Ltd.: London, UK, 2012. [Google Scholar]
  49. ERM Initiative Faculty; Greizinger, T. Collaborative Risk Management Fundamentals. N.C. State Poole College of Management, Enterprise Risk Management Initiative. 2013. Available online: https://erm.ncsu.edu/library/article/collaborative-risk-management-fundamentals (accessed on 11 March 2023).
  50. Emery, F.E. Characteristics of socio-technical systems. In The Emergence of a New Paradigm of Work; ANU/CCE: Canberra, Australia, 1959. [Google Scholar]
  51. Trist, E. Occasional Paper 2: The Evolution of Socio-Technical Systems: A Conceptual Framework and an Action Research Project; Ontario Ministry of Labour: Toronto, ON, Canada, 1981. [Google Scholar]
  52. Hayes, J. Safety Decision Making in High Hazard Organisations at the Production/Maintenance Interface—A Literature Review; Australian National University: Canberra, Australia, 2006. [Google Scholar]
  53. Flin, R.; O’Connor, P.; Critchon, M. Safety at the Sharp End: A Guide to Non-Technical Skills; Ashgate Publishing Ltd.: Hampshire, UK, 2008. [Google Scholar]
  54. Lyon, B.K.; Hollcroft, B. Risk Assessments Top 10 Pitfalls & Tips for Improvement. Prof. Saf. Dec. 2012, 57, 28–34. [Google Scholar]
  55. Zou, P.X.W.; Sunindijo, R.Y. Skills for managing safety risk, implementing safety task, and developing positive safety climate in construction project. Autom. Constr. 2013, 34, 92–100. [Google Scholar] [CrossRef]
  56. Burnham, M. Targeting zero. Prof. Saf. 2015, 60, 40–45. [Google Scholar]
Figure 1. Comparative competency ratings of participants in team A. Note: S07, S12…… S26 represent individual participants (subjects).
Safety 10 00029 g001
Figure 2. Comparative competency ratings of participants in team B. Note: S02, S05…… S19 represent individual participants (subjects).
Safety 10 00029 g002
Figure 3. Comparative competency ratings of participants in team C. Note: S04, S14…… S23 represent individual participants (subjects), and due to similar median ratings, their plots overlap; however, the graph indicates all cohorts of this group performed poorly.
Safety 10 00029 g003
Figure 4. Individual and team median competency ratings for the ‘establishing the context’ element.
Safety 10 00029 g004
Figure 5. Individual and team median competency ratings for the risk identification element.
Safety 10 00029 g005
Figure 6. Individual and team median competency ratings for the risk analysis element.
Safety 10 00029 g006
Figure 7. Individual and team median competency ratings for the risk evaluation element.
Safety 10 00029 g007
Figure 8. Individual and team median competency ratings for the risk treatment element.
Safety 10 00029 g008
Figure 9. Individual and team median competency ratings for the communication and consultation element.
Safety 10 00029 g009
Figure 10. Individual and team median competency ratings for the monitor and review element.
Safety 10 00029 g010
Table 1. Overview of Marling et al.’s series of studies [2,3] to develop and evaluate RISKometric.
Study 1Study 2Study 3
Participants262626
AimDevelop and evaluate an assessment tool to assess the competence of individuals in different elements of the risk management process.Compare individuals’ RISKometric results with their performance in a risk scenario exercise; so, providing a reliability review for the RISKometric (n = 18).
Identify if performance in Risk Scenario Exercise remains stable over time (n = 8)
Determine if a team collectively competent in risk management would perform a risk scenario exercise better than less optimised teams (n = 18)
Determine whether teams performed this task better than individuals (n = 26).
MaterialsRISKometric RISKometric
Risk scenario exercise
RISKometric (used to form groups)
Risk scenario exercise
Outcome focusIndividual differenceIndividual difference
Individual difference across time
Group difference
Group vs. individual difference
Outcome measureEvaluation ratings (0–5) given by participant, peer, upline and downline colleaguesCorrelation between RISKometric ratings and risk scenario exercise performance (as evaluated by two observers)Risk scenario exercise performance (as evaluated by two observers)
ReferenceMarling et al. [2]Marling et al. [3]Current study
Note. Marling et al. [2], Marling et al. [3], tested to determine if group improvements (in Study 3) could be explained by completing the scenario on two occasions.
Table 2. Demographic detail for each of the teams.
Team ATeam BTeam C
Risk management experience
Collective136 years203 years178 years
M20.00 years34.50 years34.50 years
R8–44 years25–43 years8–44 years
Interquartile 19.75 years27.50 years24.25 years
Interquartile 233.25 years39.25 years35.75 years
Interquartile range23.50 years11.75 years11.50 years
Age
M40.50 years54.00 years51.50 years
R29–61 years43–60 years28–62 years
Interquartile 130.00 years46.25 years42.50 years
Interquartile 254.00 years58.00 years54.50 years
Interquartile range24.00 years11.75 years12.00 years
Level
Board manager/senior executive010
Senior manager232
Middle manager111
Supervisors/foremen/team leaders111
Operators/workers202
Gender
Male564
Female102
Note: R represents the range. M represents the median.
Table 3. Overall median (and interquartile) competence ratings (collapsed across seven elements) for the experimental group given by two observers.
ObserverMedianQuartile Array 1 (Q1)Quartile Array 3 (Q3)
O14.02.54.0
O24.02.54.0
Note: O1 and O2 represent the two observers.
Disclaimer/Publisher’s Note: The statements, opinions and data contained in all publications are solely those of the individual author(s) and contributor(s) and not of MDPI and/or the editor(s). MDPI and/or the editor(s) disclaim responsibility for any injury to people or property resulting from any ideas, methods, instructions or products referred to in the content.

