Article

Physiological and Thermal Sensation Responses to Severe Cold Exposure (−20 °C)

1
Department of Environmental Science, Faculty of Science, Atlantic Technological University Sligo, F91 YW50 Sligo, Ireland
2
Associated Laboratory for Energy, Transports and Aerospace—LAETA (PROA), Faculty of Engineering, University of Porto, 4200-465 Porto, Portugal
3
Associated Laboratory for Energy, Transports and Aerospace—LAETA (PROA), Faculty of Medicine, University of Porto, 4200-319 Porto, Portugal
*
Author to whom correspondence should be addressed.
Safety 2024, 10(1), 19; https://doi.org/10.3390/safety10010019
Submission received: 3 November 2023 / Revised: 24 January 2024 / Accepted: 5 February 2024 / Published: 12 February 2024

Abstract

:
Various jobs, indoors and outdoors, are subjected to severe cold temperatures during daily activities. Extremely low-temperature exposure and work intensity affect health, safety, and occupational performance. This work aimed to assess the physiological and thermal sensation responses before, during, and following a 60 min exposure to cold (−20 °C), during which occupational activities were developed. Using ingestible telemetric temperature pills, eight skin temperature sensors, blood pressure equipment, and the Thermal Sensation Questionnaire, experiments were conducted with 11 healthy male volunteers wearing highly insulating cold protective clothing. The most notorious alterations were reported in mean skin temperatures and thermal sensation responses during the first 20 min of cold exposure. Among the eight skin temperature points, the forehead and left hand showed a higher sensitivity to cold. The mean core temperature reported significant variations throughout the protocol, with decreases during the initial 10 min of cold exposure and posterior increases despite the cold environment. Blood pressure showed slight increases from the initial to the recovery period. Overall, outcomes contribute to current scientific knowledge on physiological and perception responses in extremely cold environments while describing the influence of protective clothing and occupational activities on these responses. Future research should be developed with additional skin temperature measurements in the extremities (fingers, face, and toes) and the analysis of thermal sensation potential associations with performance changes, which can also be of great significance for future thermal comfort models.

1. Introduction

Exposure to cold thermal environments is a major risk factor in many occupations, affecting workers’ health, safety, and occupational performance [1]. Extreme cold temperatures are present in industrial environments, outdoor activities in the winter, and indoor activities during all seasons [2]. Indoor cold exposure is mainly associated with working duties in the fresh food industry, with temperatures varying between 0 and 10 °C and frozen goods under −20 °C. Thermal environments are constant and predictable for these activities, facilitating cold risk management. However, they usually involve higher exposure and, therefore, higher risk for workers, causing or aggravating chronic and severe diseases such as cold-induced asthma, coronary and heart diseases, chronic obstructive pulmonary disease, airway infections, Raynaud’s phenomenon, carpal tunnel syndrome, cold urticaria, and immersion foot [3,4,5,6,7]. On the other hand, cold temperatures in outdoor work are observed in agriculture, forestry, fishery, mining, military missions, factory and construction work, and related occupations [8]. It is particularly relevant in high-latitude zones where winter lasts for many months (e.g., Norway, Canada, Finland, Sweden, and Russia) [9]. In these cases, climatic variations, including fluctuations in temperature, wind, and precipitation, hinder appropriate cold protection [10].
Cold temperature exposure has many consequences that can reduce a subject’s ability to execute occupational and survival skills [1], with these effects depending on factors such as age, gender, occupation, health and exercise activity [9]. When exposed to a cold environment, individuals recruit heat-conserving and heat-producing cold defence responses to limit and counteract the heat lost to the surrounding environment [11]. These defence responses are broadly grouped into behavioural and autonomic. The first involves measures from wearing a sweater to using central heating. Autonomic responses, on the other hand, include primarily arteriovenous shunt vasoconstriction and shivering [12,13]. The recruitment of shivering thermogenesis, in particular, can impair gross and fine neuromuscular performance and coordination, ultimately impacting the odds of survival [11,14]. Mean skin temperature contributes about 20% to the control of autonomic responses to each major cold defence, with the remainder being from deeper tissues, the thermal core, and neuraxis [12].
Working in extreme cold is associated with impairments in tactile sensitivity and finger mobility, severe tremors, hypothermia, frostbite, chilblain, nerve and muscle functionality reduction, and musculoskeletal symptoms [1,6,15,16,17,18]. In addition, the cooling of the tissues causes discomfort, decreased concentration and logical reasoning performance, and increased work accident rates [7,17]. Furthermore, working in a cold environment can impact some physiological parameters, leading to cardiovascular, respiratory, and dermatological complaints and diseases [19,20,21]. The symptoms of prolonged exposure to cold include cardiovascular strain and high metabolic cost [4,7], irritation, redness, inflammation, and, in severe cases, skin ulceration on the cheeks, ears, and fingers [17]. Also, issues of incident wheezing and productive coughing in previously healthy workers, who, upon receiving more prolonged and intense wheezing at low temperatures, require increased ventilation during strenuous manual work with subsequent airway dysfunction may be present [6]. As a result, different strategies have been implemented to deal with such environments, involving insulating clothing, heating systems, cooling practices, and working with periodical recovery times, aiming to protect workers from the impact of cold temperatures [18,22]. Despite their usefulness, more measures may be needed since many injuries and diseases are still related to cold exposure [19,23,24]. To improve the positive impact of these preventive measures, they should be based on scientific knowledge from studying the internal human physiological responses continuously and the external localised exposure effects to truly understand the mechanism of human cold stress and injury [25].
In recent years, research focused on occupational cold-related effects has increased. The most evaluated parameters include physiological variables (e.g., body core and skin surface temperature, oxygen consumption, blood pressure and heart rate) and perceived discomfort after cold exposure. However, cold exposure can affect many aspects simultaneously, and the impact of working in such conditions has not yet been comprehensively addressed [1,26]. While cold-related stress stimulates various responses in the endocrine and sympathetic nervous systems and activates thermoregulation mechanisms [20], physical exertion from occupational activities plays an important role in coping or not with that stress. In addition, most available research points to short cold exposure durations, primarily on temperatures ranging from −5 to −15 °C [25,27]. However, various indoor and outdoor occupational settings expose workers repeatedly to lower temperatures [2,28,29]. Cold storerooms are kept at temperatures below −20 °C, and winter in regions such as Northern Canada, Alaska, China, and Russia report average equivalent temperatures [8,30].
As observed, the existing research on exposure effects to extremely low temperatures has given a basis for how this cold exposure affects safety and performance. However, there are still research gaps to be addressed in occupational settings [31,32]. A comprehensive understanding of these effects on working activities is needed to enhance the safety and performance of workers in cold environments [1]. Furthermore, the efficacy of the strategies to prevent cold exposure effects within occupational settings should be evaluated and improved. In this work, experiments were conducted focusing on assessing the influence of exposure to a severe cold thermal environment (SCE) set at −20 °C, on subjective (through thermal sensation reporting) and objective (through physiological variables) indicators from subjects while performing manual handling tasks (simulating frozen food industry activities) and using cold protective equipment. This study evaluated 11 volunteers wearing highly insulating cold protective clothing to determine the effects of severe cold temperatures during occupational activities and the efficacy of clothing insulation garments.

2. Materials and Methods

2.1. Volunteers

Eleven healthy males who have not been acclimatised to working in extreme cold (age: 23.91 ± 3.36 (mean ± standard deviation) years; weight: 77.04 ± 7.78 kg; height: 178.56 ± 5.12 cm; BMI: 24.17 ± 2.04 kg/m2) participated in the experiments. They were non-smokers and did not ingest any prescription medicine, tea, coffee, alcohol, or spicy food for at least 12 h before the experiment. Participants were informed about the planned protocol and were told the trials’ objectives, potential risks, and benefits. The study and experimental protocols were approved by the Ethics Committee of the University of Porto (Report 06/CEUP/2015). Each volunteer read and signed an informed written consent form before starting. All of them wore cold protective garments: jacket with a hood (1.9 clo), trousers (0.4 clo), gloves (0.05 clo), and boots (0.1 clo) above regular clothes: socks (0.02 clo), underpants (0.1 clo), trousers (0.25 clo), an undershirt (0.09 clo), and a thinly long-sleeved shirt (0.2 clo). Considering the thermal insulation values for clothing ensembles from the ISO 9920:2007 [33], the insulation value (Icl) was approximately 3.16 clo while exposed to SCE.

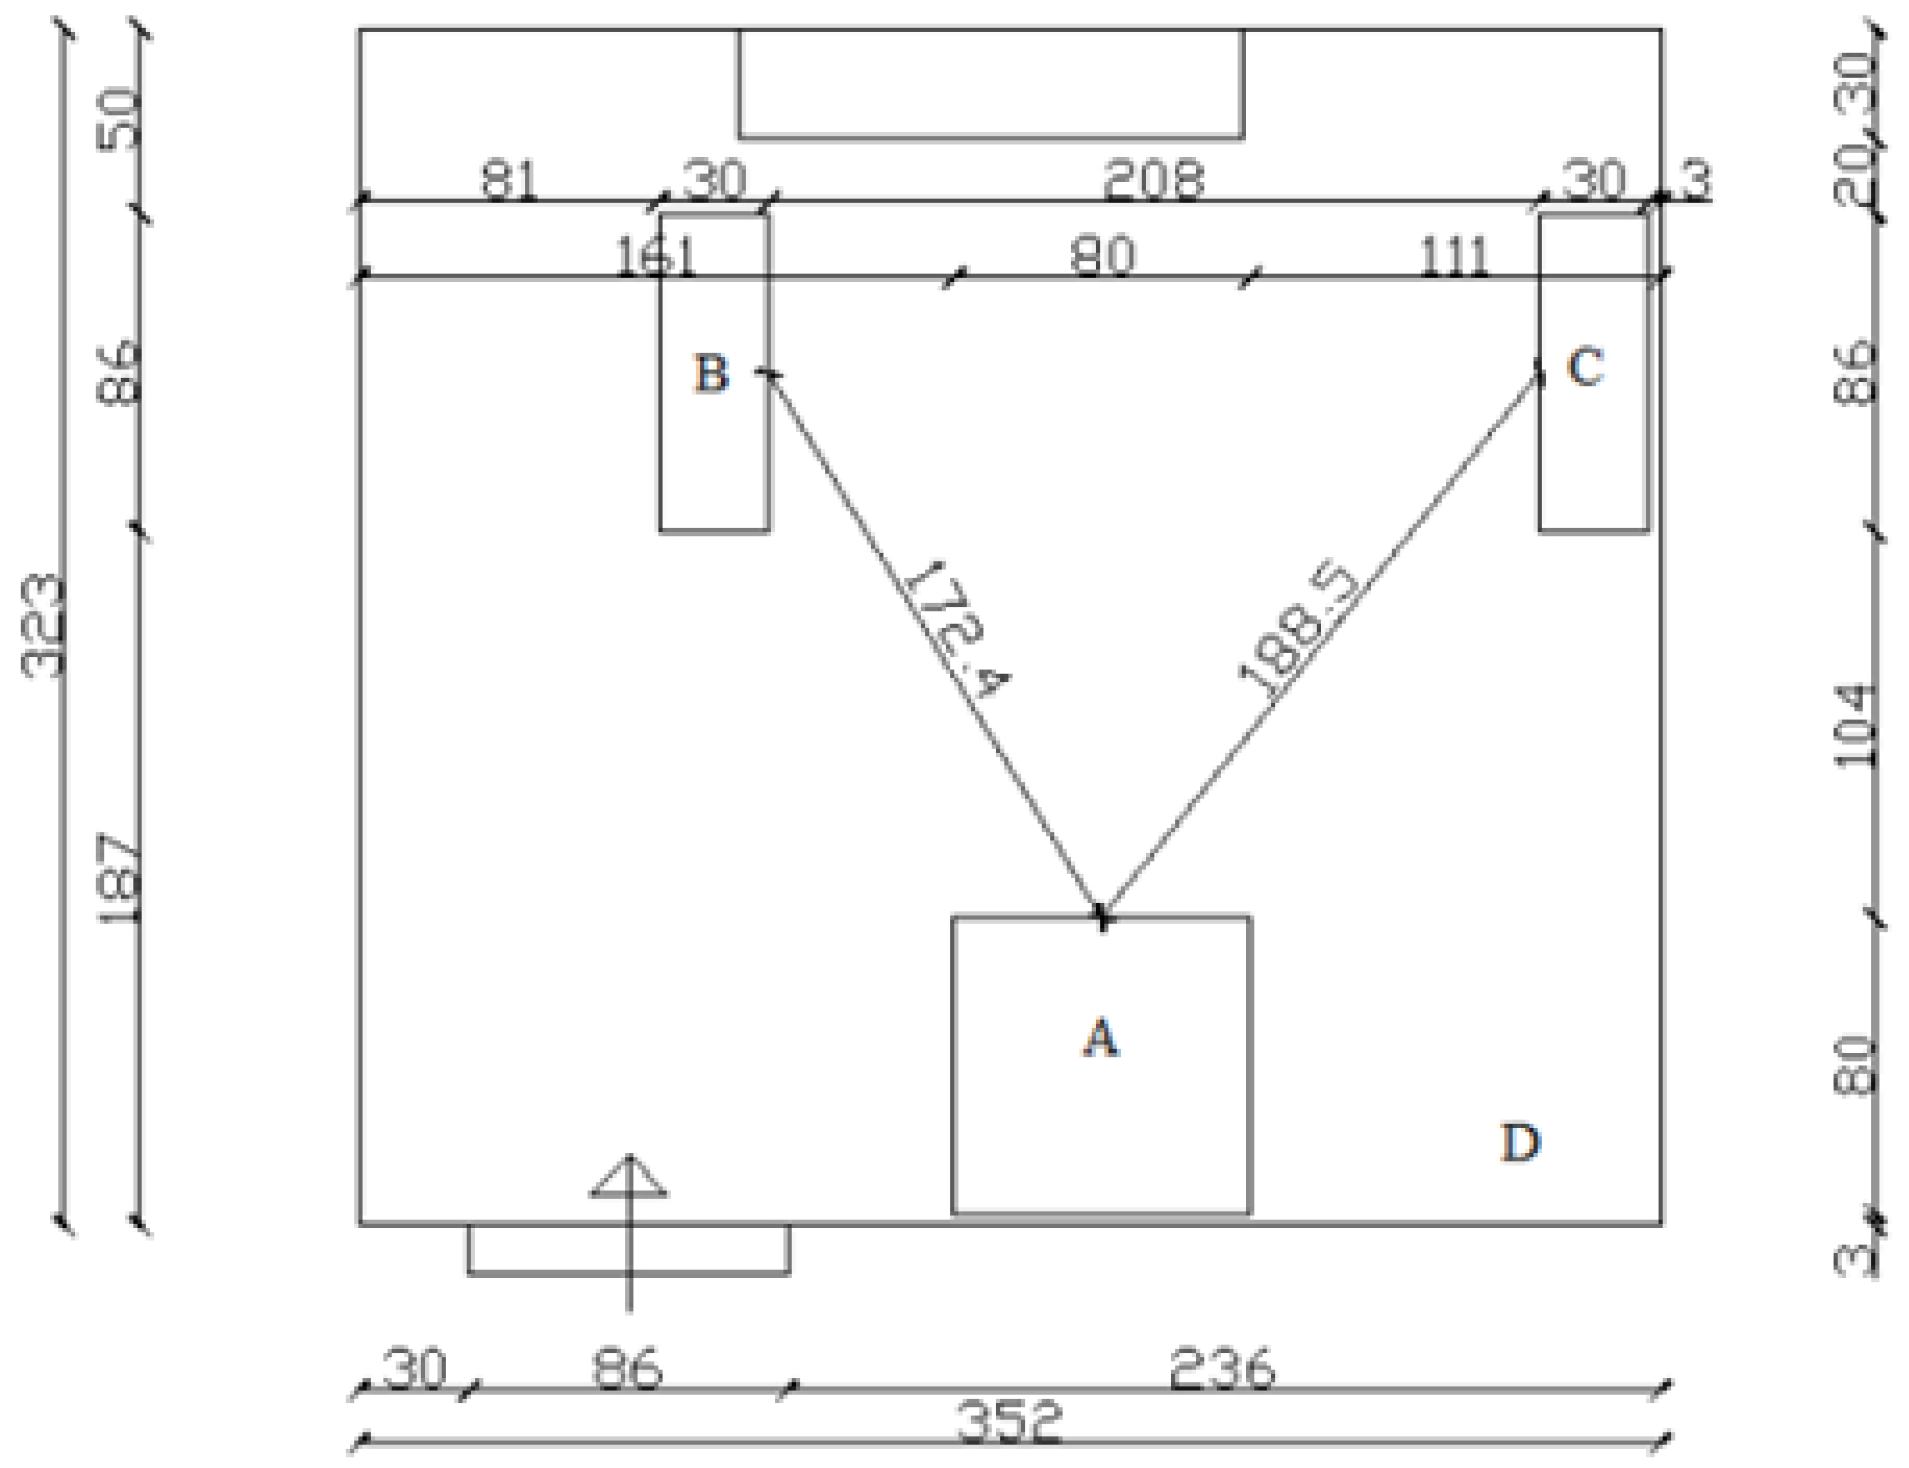
2.2. Experimental Conditions

Trials were performed in the Faculty of Engineering of the University of Porto (FEUP) at the Laboratory on Prevention of Occupational and Environmental Risks (PROA), specifically in a climatic chamber (3.20 m × 3.20 m) and a side laboratory room connected by a door. Exposure to SCE was conducted inside the climatic chamber Fitoclima 25000EC20 (Aralab, Rio de Mouro, Portugal), able to reach temperatures ranging from −20 °C to +50 °C (±0.2 °C), relative humidity from 30% to 98% (±5%), and equipped with O2 and CO2 sensors [34]. Outside the chamber (side room), the temperature and relative humidity of the laboratory were monitored with a thermo-hygrometer HANNA D0108069 (Hanna Instruments, Woonsocket, RI, USA) to ensure a neutral thermal environment set at 18 °C [35,36]. The experiment duration was three hours: 30 min before exposure while sitting (side room), 60 min in SCE while simulating occupational tasks (climatic chamber), and 90 min of recovery while sitting (side room).

2.3. Measurements

2.3.1. Physiological Responses

During the 3 h trial, skin temperature (Tskin) was continuously measured using eight Bioplux skin temperature sensors on the body parts determined in the ISO 9886:2004 [35]: (i) forehead, (ii) right scapula, (iii) left upper chest, (iv) right arm in upper location, (v) left arm in lower location, (vi) left hand, (vii) right anterior thigh, and (viii) left calf [35]. Intra-abdominal ingestible pill sensors (Hidalgo, Cambridge, UK) measured core temperature (Tcore) in real time. They were ingested with water at least five hours before each trial and recorded Tcore responses (15 s intervals) through the EQ02 Life Monitor—Electronics Sensor Module (Hidalgo, Cambridge, UK) by Bluetooth. An OMRON M10-IT Intellisense Upper Arm Blood Pressure Monitor (OMRON Healthcare Co, Ltd., Kyoto, Japan) was used to measure heart rate (HR) and systolic (SYS) and diastolic (DYS) blood pressure (BP) on the left arm three times (15 s intervals). The average HR, SYS, and DYS values were registered in six moments: 10 min before SCE exposure and 5, 15, 30, 60 and 90 min following exposure outside the chamber. They were not measured inside the chamber since it would have interfered with the activity sequence, and participants would have to remove the protective clothing.

2.3.2. Questionnaires

A general lifestyle questionnaire (GLQ) was applied to obtain details on the subject’s general information and lifestyle. The inquiries involved birthdate, occupation, drinking and smoking habits, ingestion of tea, coffee, or spicy food in the last 12 h, hours past from last meal, last meal description, medications, sleeping and waking up times, the number of sleeping hours, handedness and weekly frequency of sports practice. A second questionnaire, the Thermal Sensation Questionnaire (TSQ), was applied with inquiries based on Annex B of the ISO 10551:1993 [37] (questions 1 to 5) and three additional inquiries (questions 6, 7 and 8) directed to discern the participant’s localised sensation. The TSQ was responded to 10 times during each experiment: (1) 10 min before SCE exposure, (2) after beginning exposure, (3) after 20, (4) 40, and (5) 60 min of SCE, and (6) 5, (7) 20, (8) 40, (9) 60, and (10) 90 min after exposure to SCE. Figure 1 illustrates the different stages and measurements of the 3 h experiment.

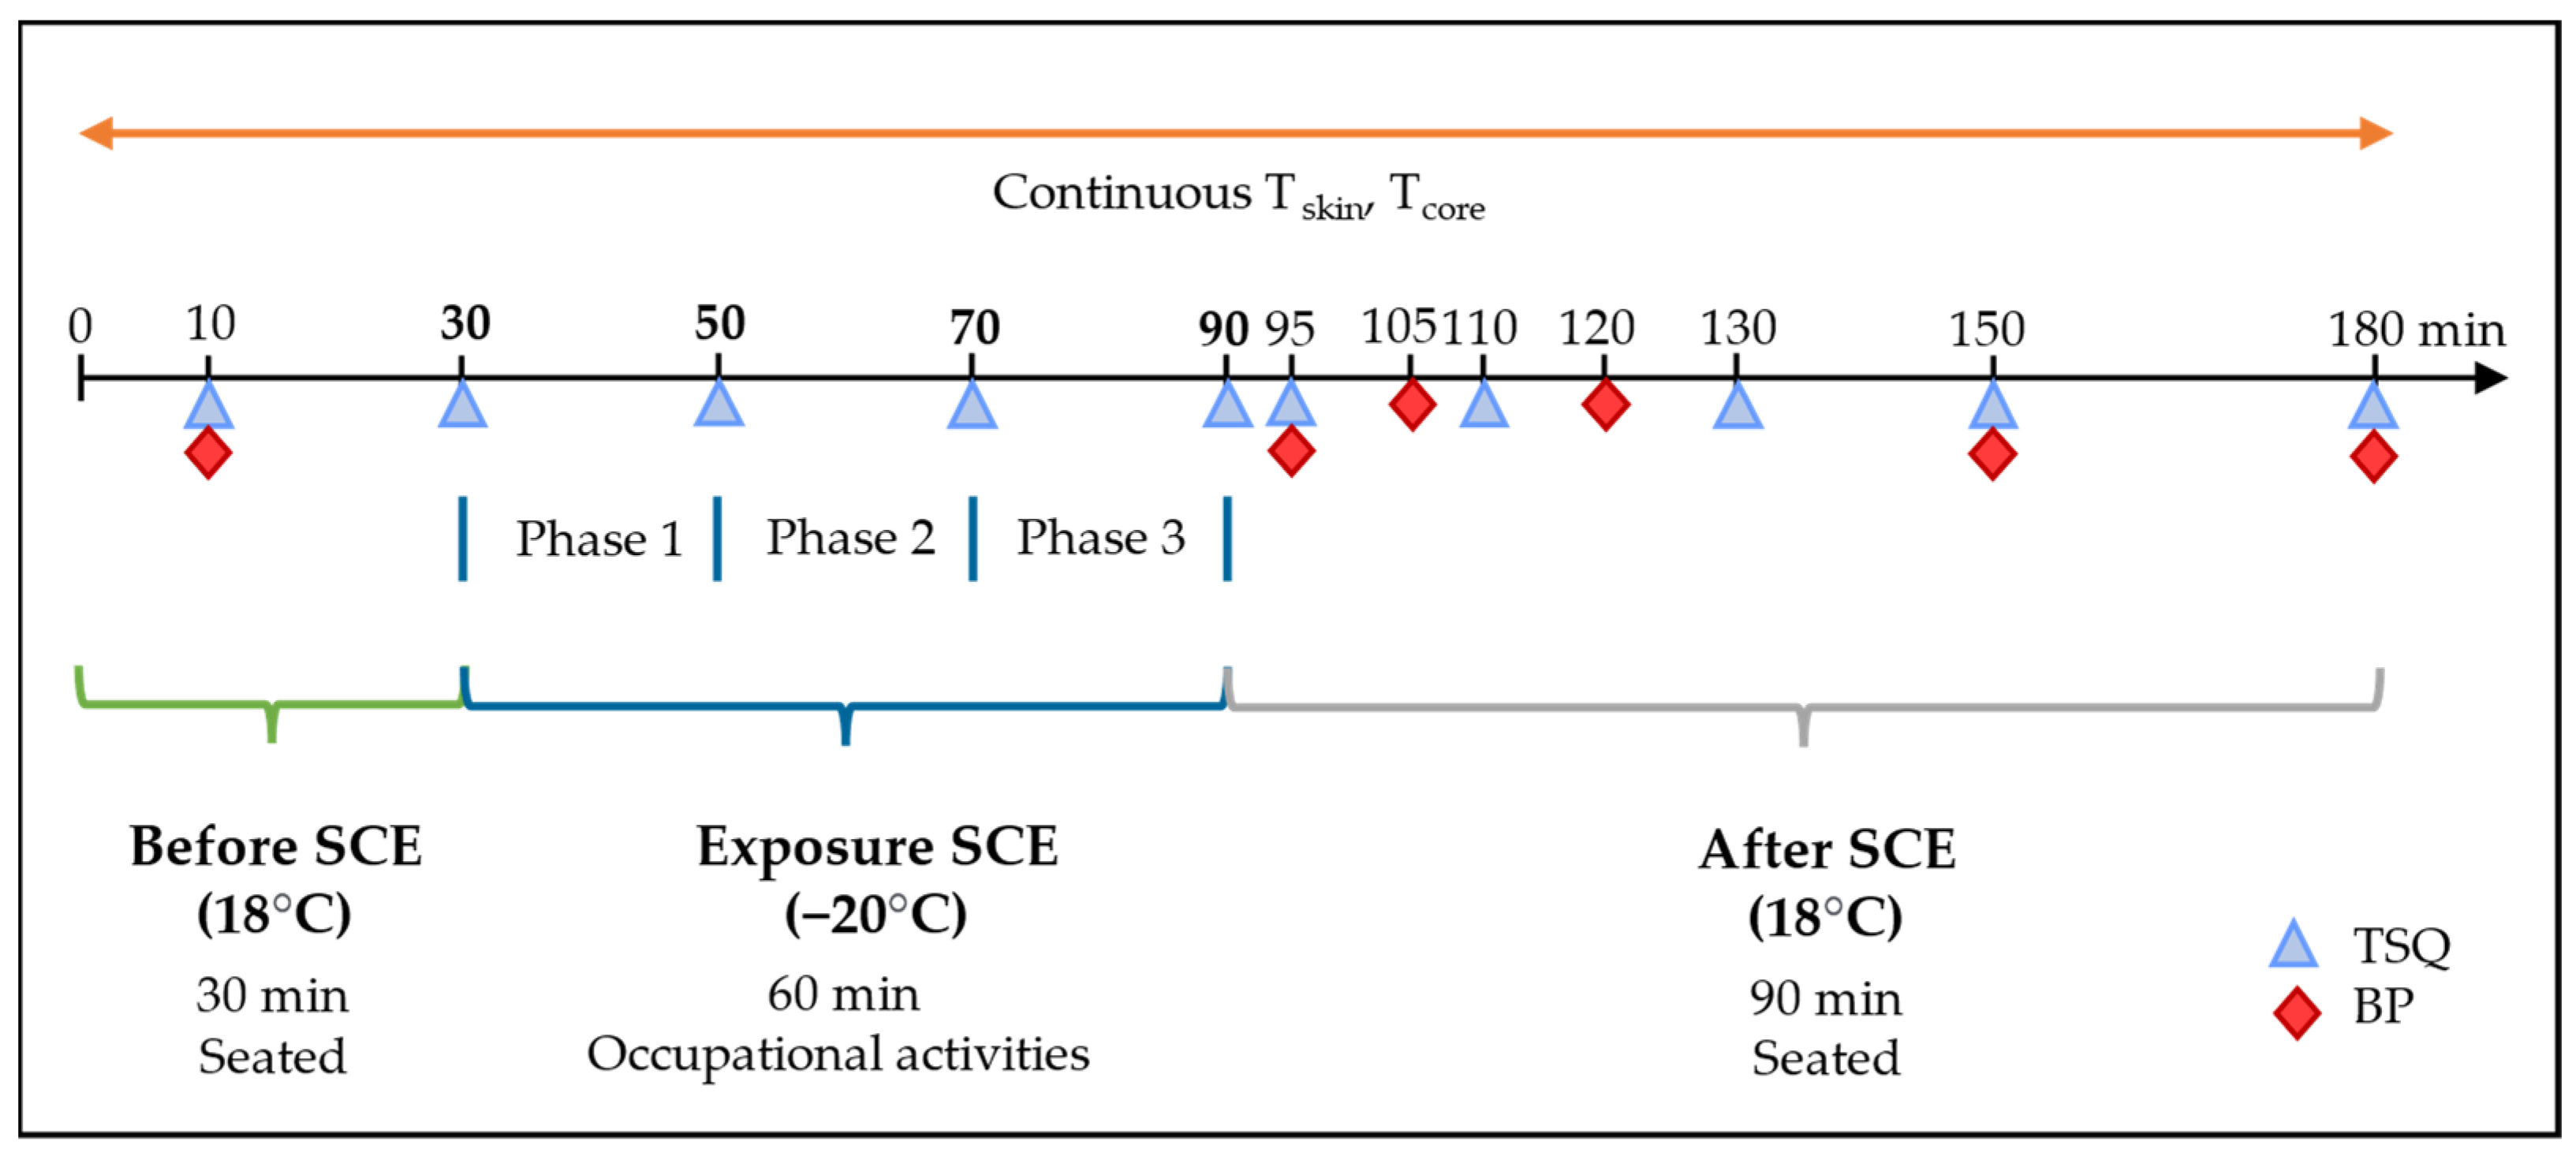
2.4. Experimental Protocol

2.4.1. Initial Contact and Medical Examinations

Before each trial, the research team met the participants to describe the aims, characteristics, and potential risks, sign the informed consent form, retrieve their general and lifestyle information, and schedule a medical examination. These examinations helped select healthy subjects and verified their suitability for the experiment. All subjects were evaluated for cardiovascular or respiratory diseases, gastrointestinal and musculoskeletal impairments, cold intolerance, cold urticaria or other forms of urticaria or angioedema, illness history, allergies, and any prescribed medication. One day before the experiment, the researchers met the participants again to inquire about health-related changes that might have happened in that period. The Tcore pill was provided with instructions on how and when to ingest it.

2.4.2. Before Going into the Climatic Chamber

As Figure 2 illustrates, the climatic chamber had four central sections: (A) a table on which every phase began and finished with three A4 paper boxes (weight per box: 5 kg), a box with 12 crumpled papers, and two pairs of plastic bottles with glass balls in them (each pair weight: 0.8 kg); (B) a cabinet with three shelves on different heights: 10, 80, and 150 cm (shelves 1, 3, and 5, respectively); (C) a cabinet with two shelves on different heights: 45 and 115 cm (shelves 2 and 4, respectively); and (D) a chamber section with two papers on the wall: one with the experimental protocol to remind the participants about the sequence of activities, and other with the TSQ. The experiments were controlled in real time and interrupted if any of these situations were identified: (i) the participant felt any symptoms of nausea, dizziness, and general malaise; (ii) the Tcore reached under 36 °C (lower risk threshold from the ISO 9886:2004 [35]); or (iii) the local Tskin (particularly on the extremities: fingers, face, and toes) reached 15 °C (lower risk threshold from the ISO 9886:2004 [35]).
Only one trial was performed per day, starting at the same time and with the laboratory at the same air temperature (18 °C) to minimise potential biases from the influence of the circadian rhythm [38]. The participants arrived at 09:15, and the Tcore pill was verified to ensure its proper functioning. Then, weight and height were registered, with participants wearing only the underpants. After putting on the sensors, they wore the Equivital chest belt. Later, they put on a t-shirt, a long-sleeved shirt, socks, and long-sleeved trousers, and all wires were placed in a small handbag to enable movement. The sensors were turned on, and the recording began 30 min before entering the climatic chamber. Afterward, they sat down and responded to the GLQ, and the protocol activities were described to them. The HR, BP, and TSQ responses were recorded 10 min before entering the chamber. Five minutes before entering, they put on the cold protective clothes (listed in Section 2.1.), leaving the eyes, nose, and cheeks uncovered. Lastly, the participants went into the climatic chamber.

2.4.3. Occupational Activities Inside the Chamber

For the duration of the SCE, the 20 min activity protocol was performed three times, with the durations being controlled with a chronometer. The researcher indicated accelerating or slowing the activities to ensure a similar duration and cadence among volunteers when needed. Table 1 describes the sequence and duration of activities in each 20 min phase. These activities were designed to simulate some typical manual handling activities developed by workers in the frozen food industry, which were observed during a previous study [39]. Heating the hands (mentioned during the sequence) was performed by rubbing them together briefly to keep them warm.

2.4.4. Following Exposure to SCE

The participant removed the cold protective gloves, boots, and jacket when exiting the chamber. Then, he sat down during the 90 min recovery period, and HR, BP, and TSQ responses were registered again. He was not allowed to drink, go to the toilet, or walk around until the trial ended. After 90 min, the Tskin and Tcore recordings ended, the equipment was removed, and the volunteer’s weight was registered again.

2.5. Data Analyses

Tcore was registered using the Equivital Manager and the EqView professional programs (Hidalgo, Cambridge, UK). Tcore values of −1 °C were considered outliers and excluded for further analyses. Tskin was recorded through the MonitorPlux program (BioPLUX, Lisbon, Portugal). The mean Tskin was determined by applying the weighting coefficients proposed by ISO 9886:2004 [35]. The obtained information was pre-processed using an algorithm developed in Python programming language version 3.9 (Python Software Foundation, Wilmington, DE, USA) to filter noisy data and obtain mean values per minute. Statistical analyses were then performed and included comparisons of means with the paired t-test (when appropriate), with a p-value of less than 0.05 considered significant and less than 0.001 determined as highly significant. Furthermore, simple linear regression analyses were performed between Tskin (mean and localised) and thermal sensation responses.

3. Results

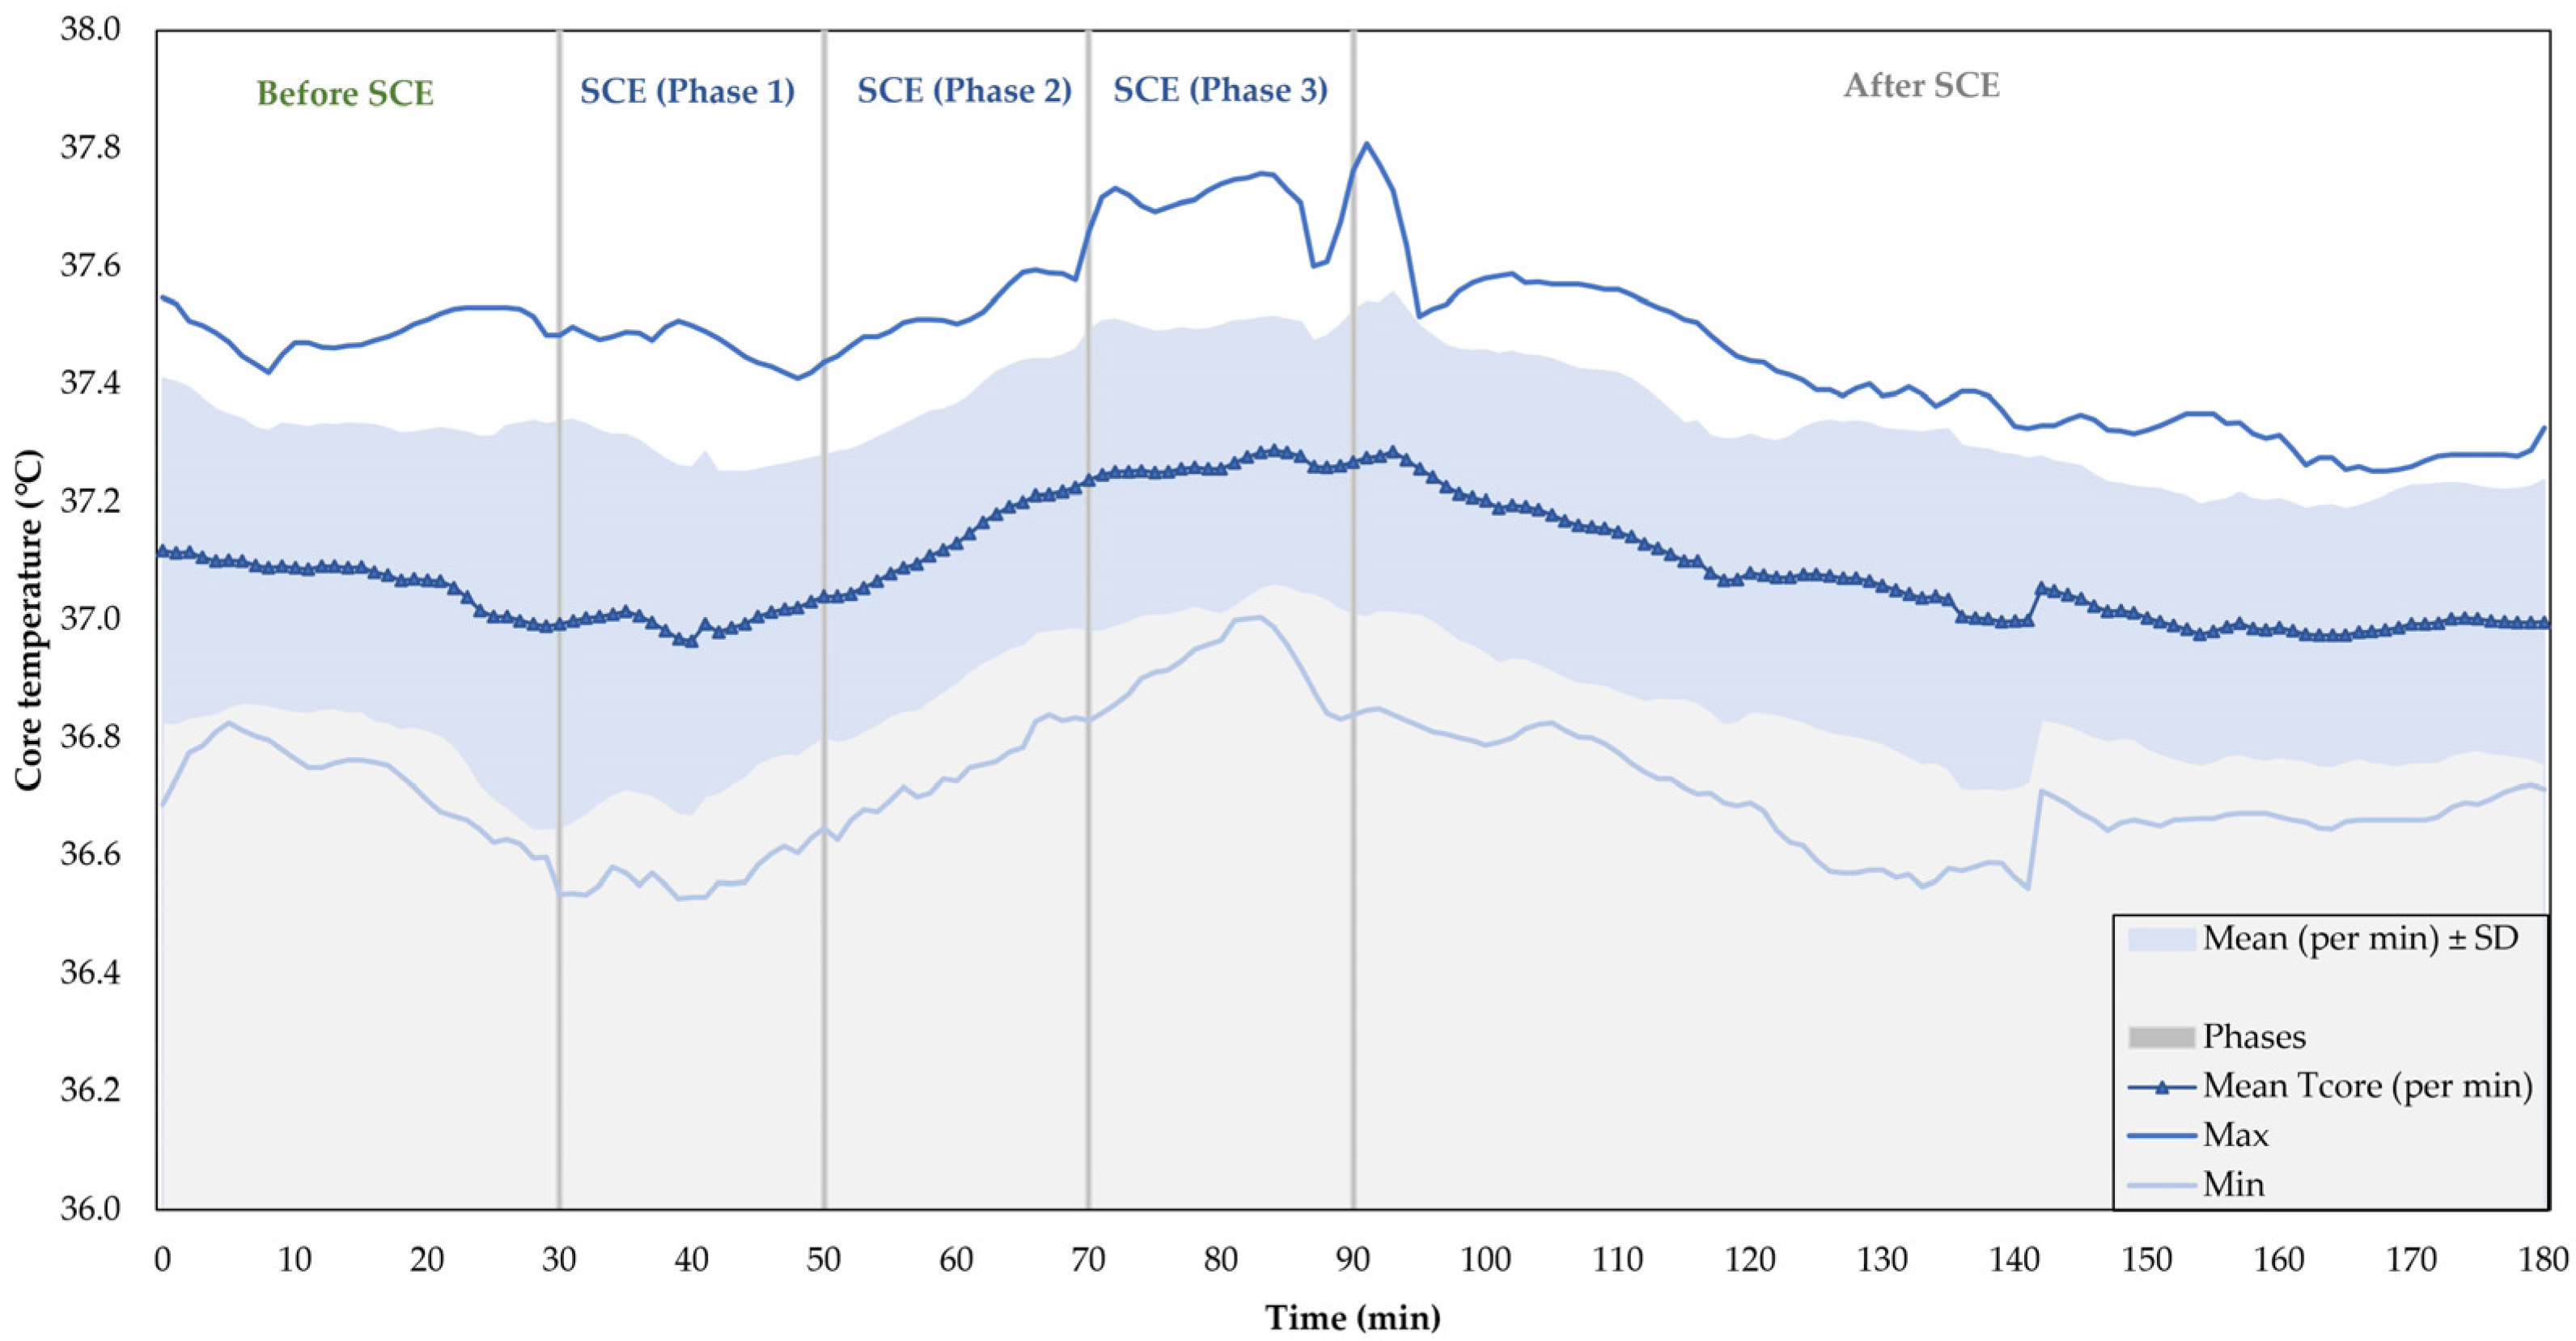
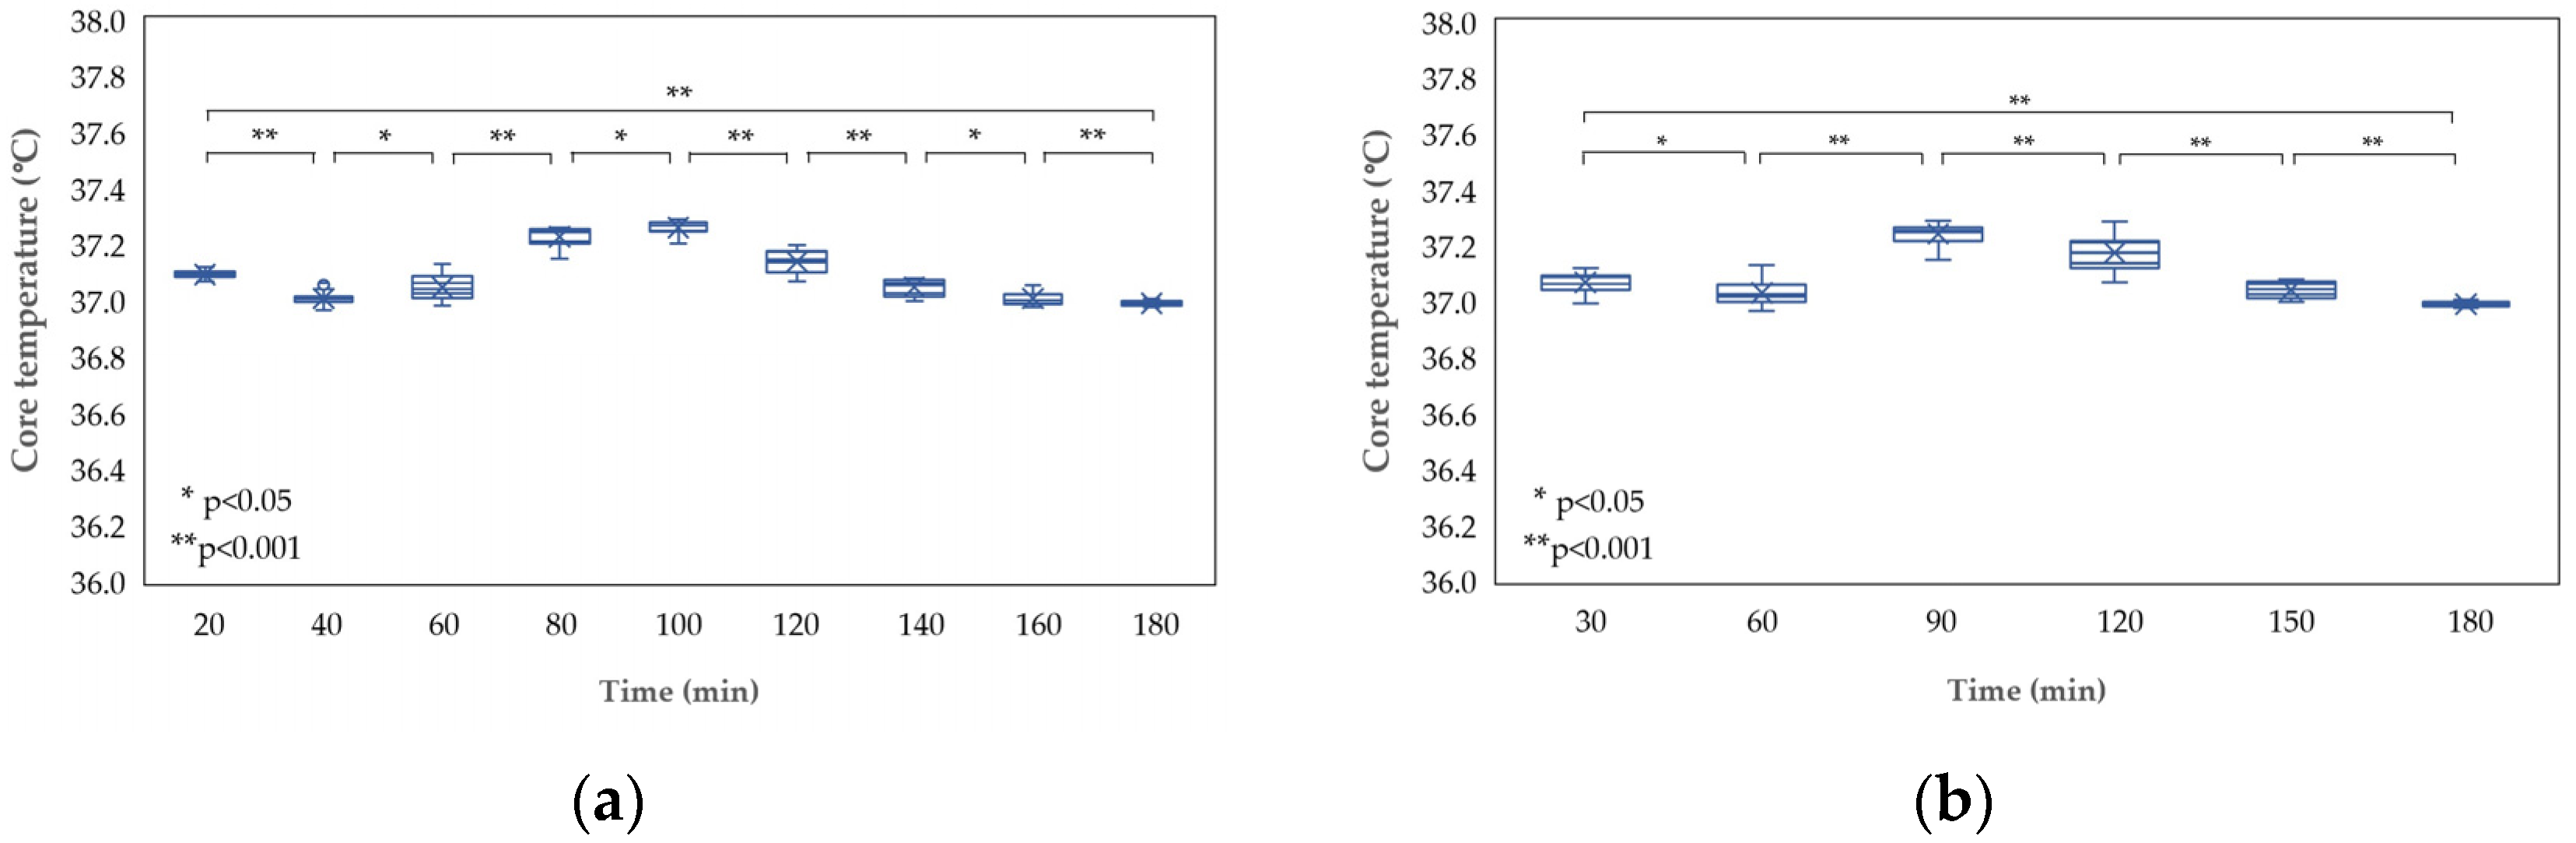
3.1. Core Temperature

Mean core temperature responses from the 11 subjects are shown in Figure 3. When analysing these results, reference values from ISO standards and limits determined for occupational settings [35,40] were considered. Temperatures showed normal ranges permanently, displaying mean values above the 36 °C limit from the ISO 9886:2004 [35] (Figure 3). Variations were identified during the trials but did not reach any risk indicator as the lowest values were reached for very short periods (fulfilling the guidelines from the referred ISO standard [35]). The most significant alteration was detected during SCE exposure, during which Tcore decreased the most to 37 °C (minute 40). After this moment, Tcore started increasing until ending the SCE exposure period. This outcome could be associated with higher metabolic heat production [40] and vasoconstriction [41] since participants were evaluated while performing various simulated occupational activities and wearing highly insulating clothing. Throughout the trials, the Tcore differences mainly were less than 1 °C between the lowest and highest values, ranging between 0.5 and 0.7 °C. Only one participant registered a 1.05 °C variation. Paired t-tests with the values every 20 and 30 min were used to analyse the significance of these variations. Figure 4 presents the outcomes where a highly significant difference (p < 0.001) in the mean Tcore was observed in almost all analysed periods.

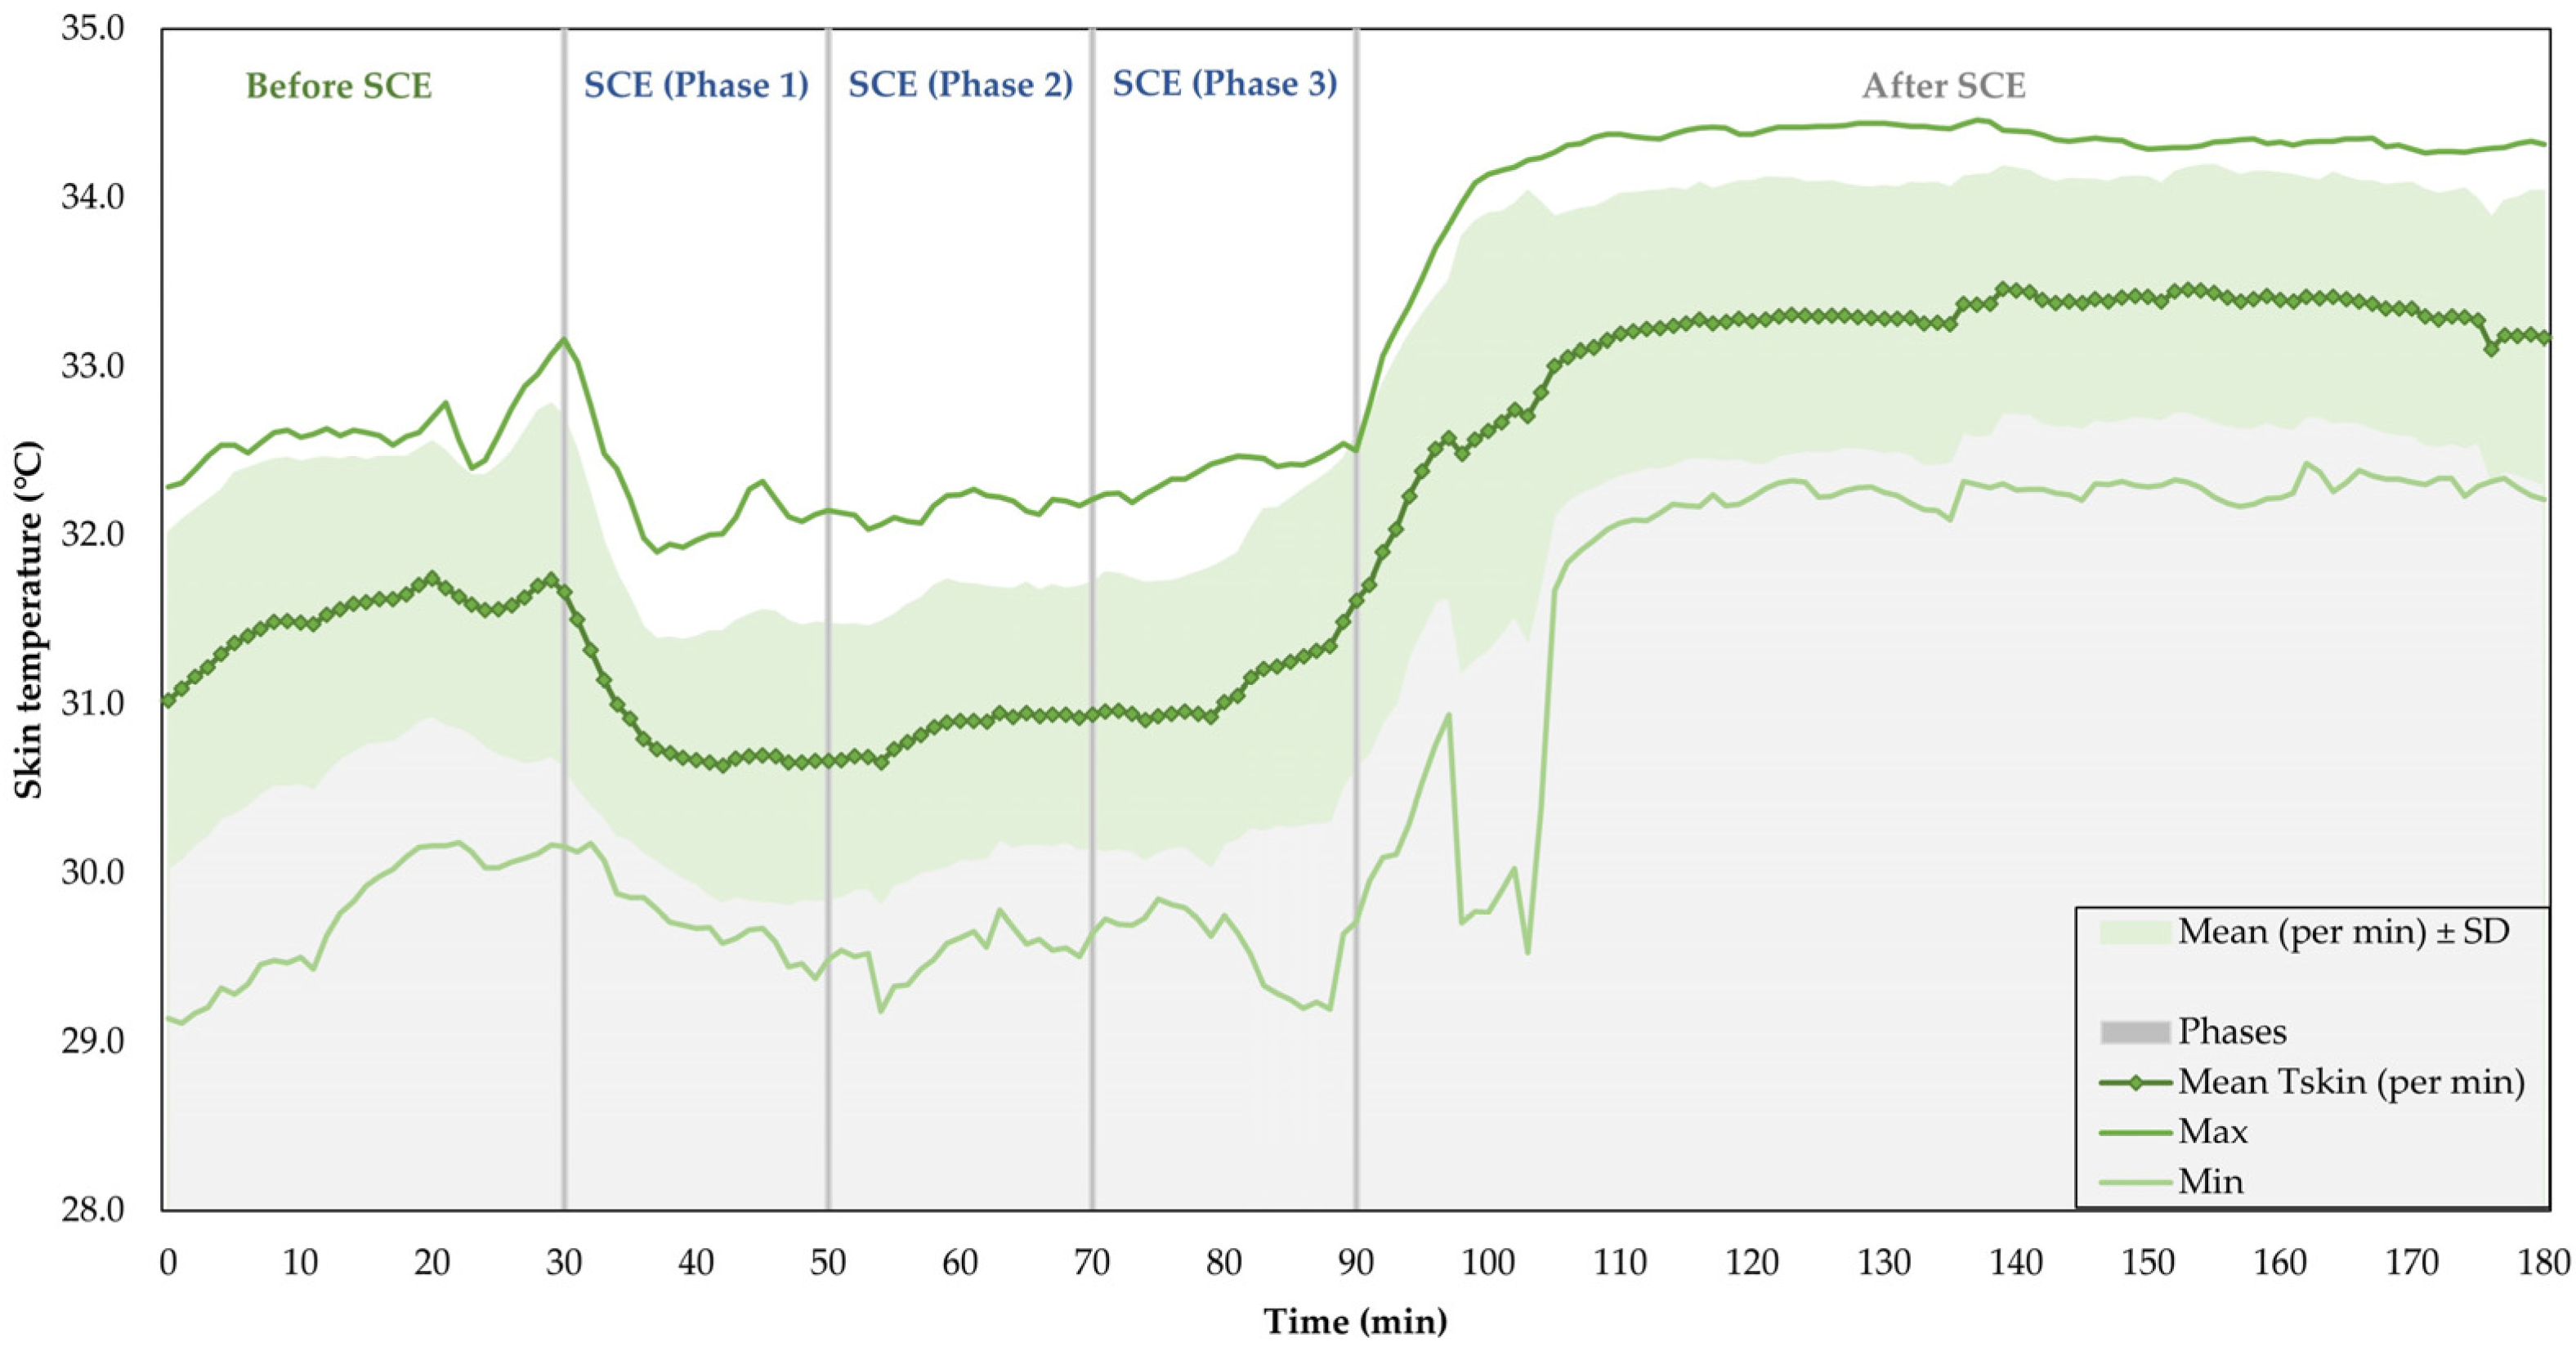
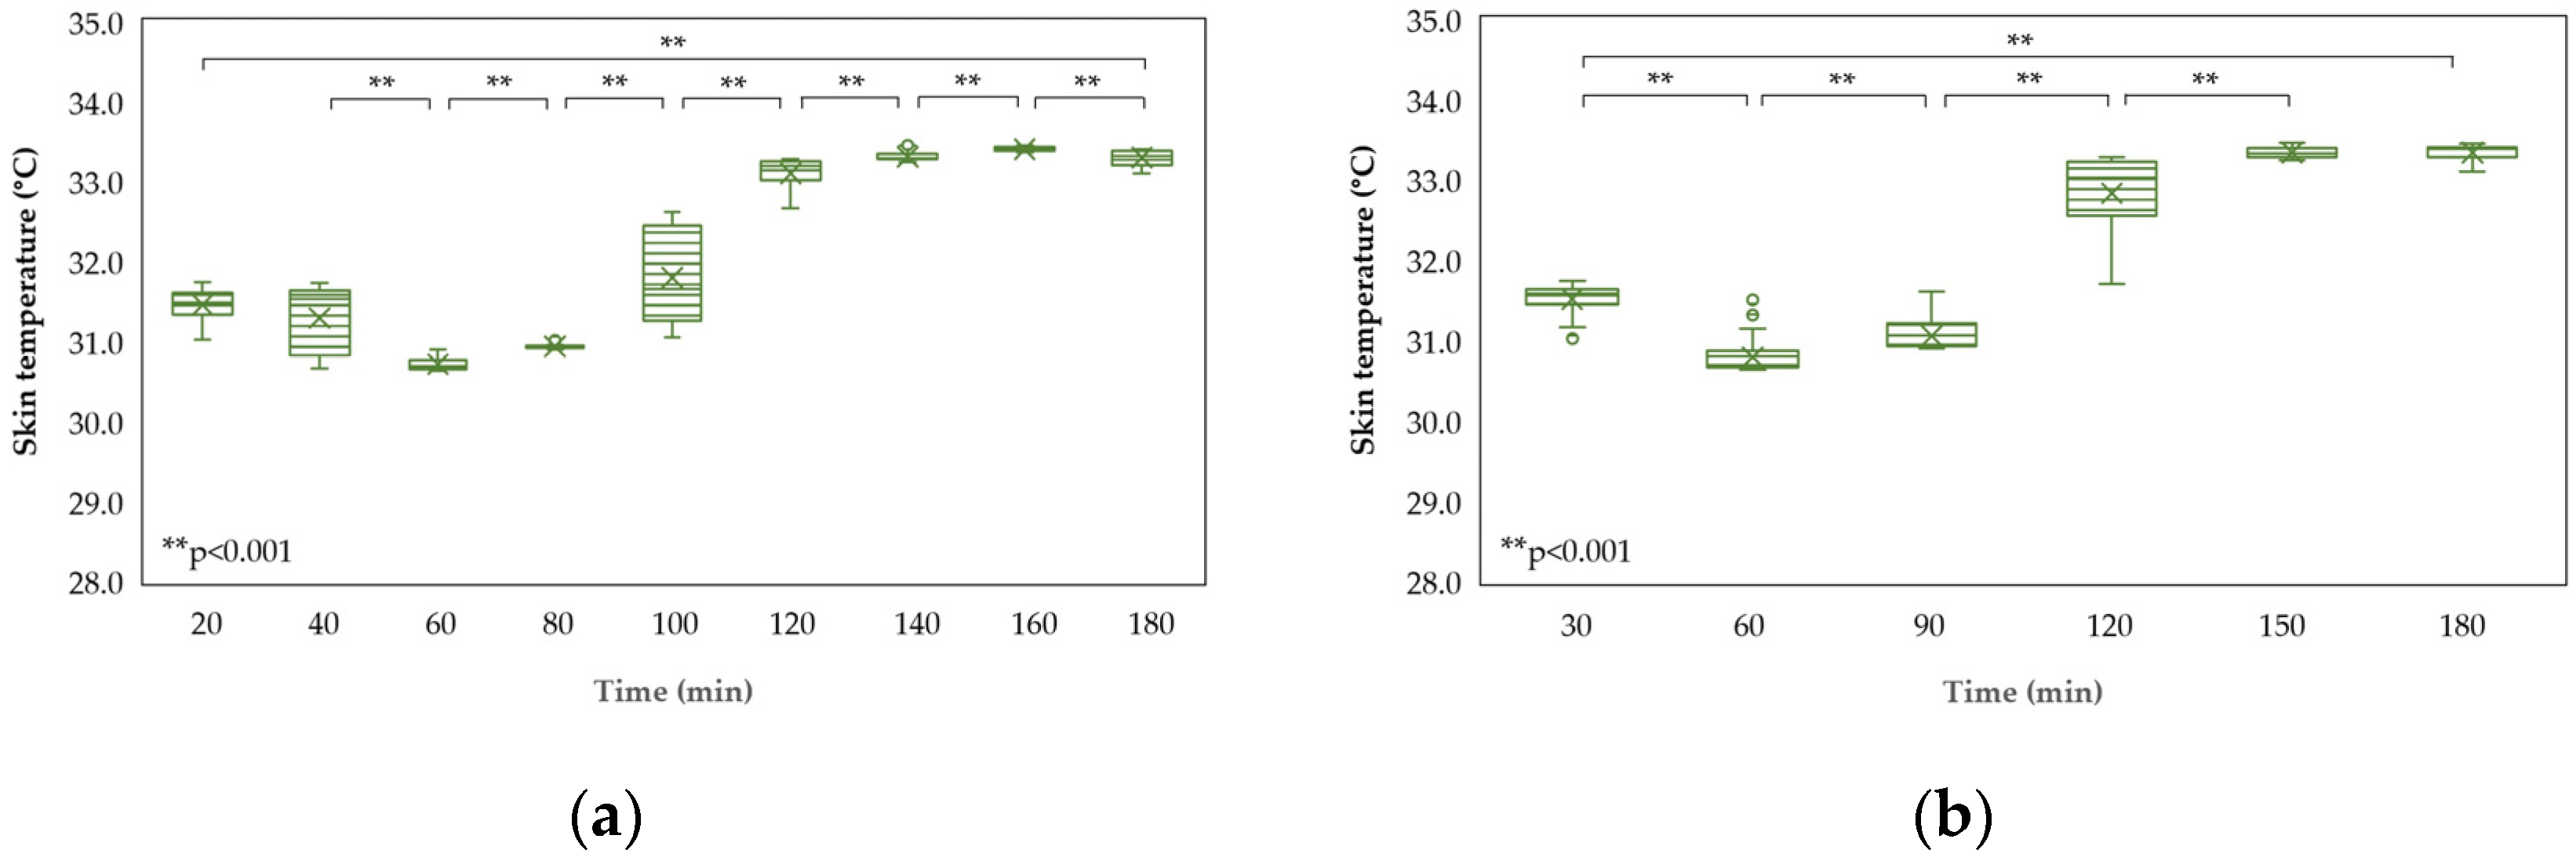
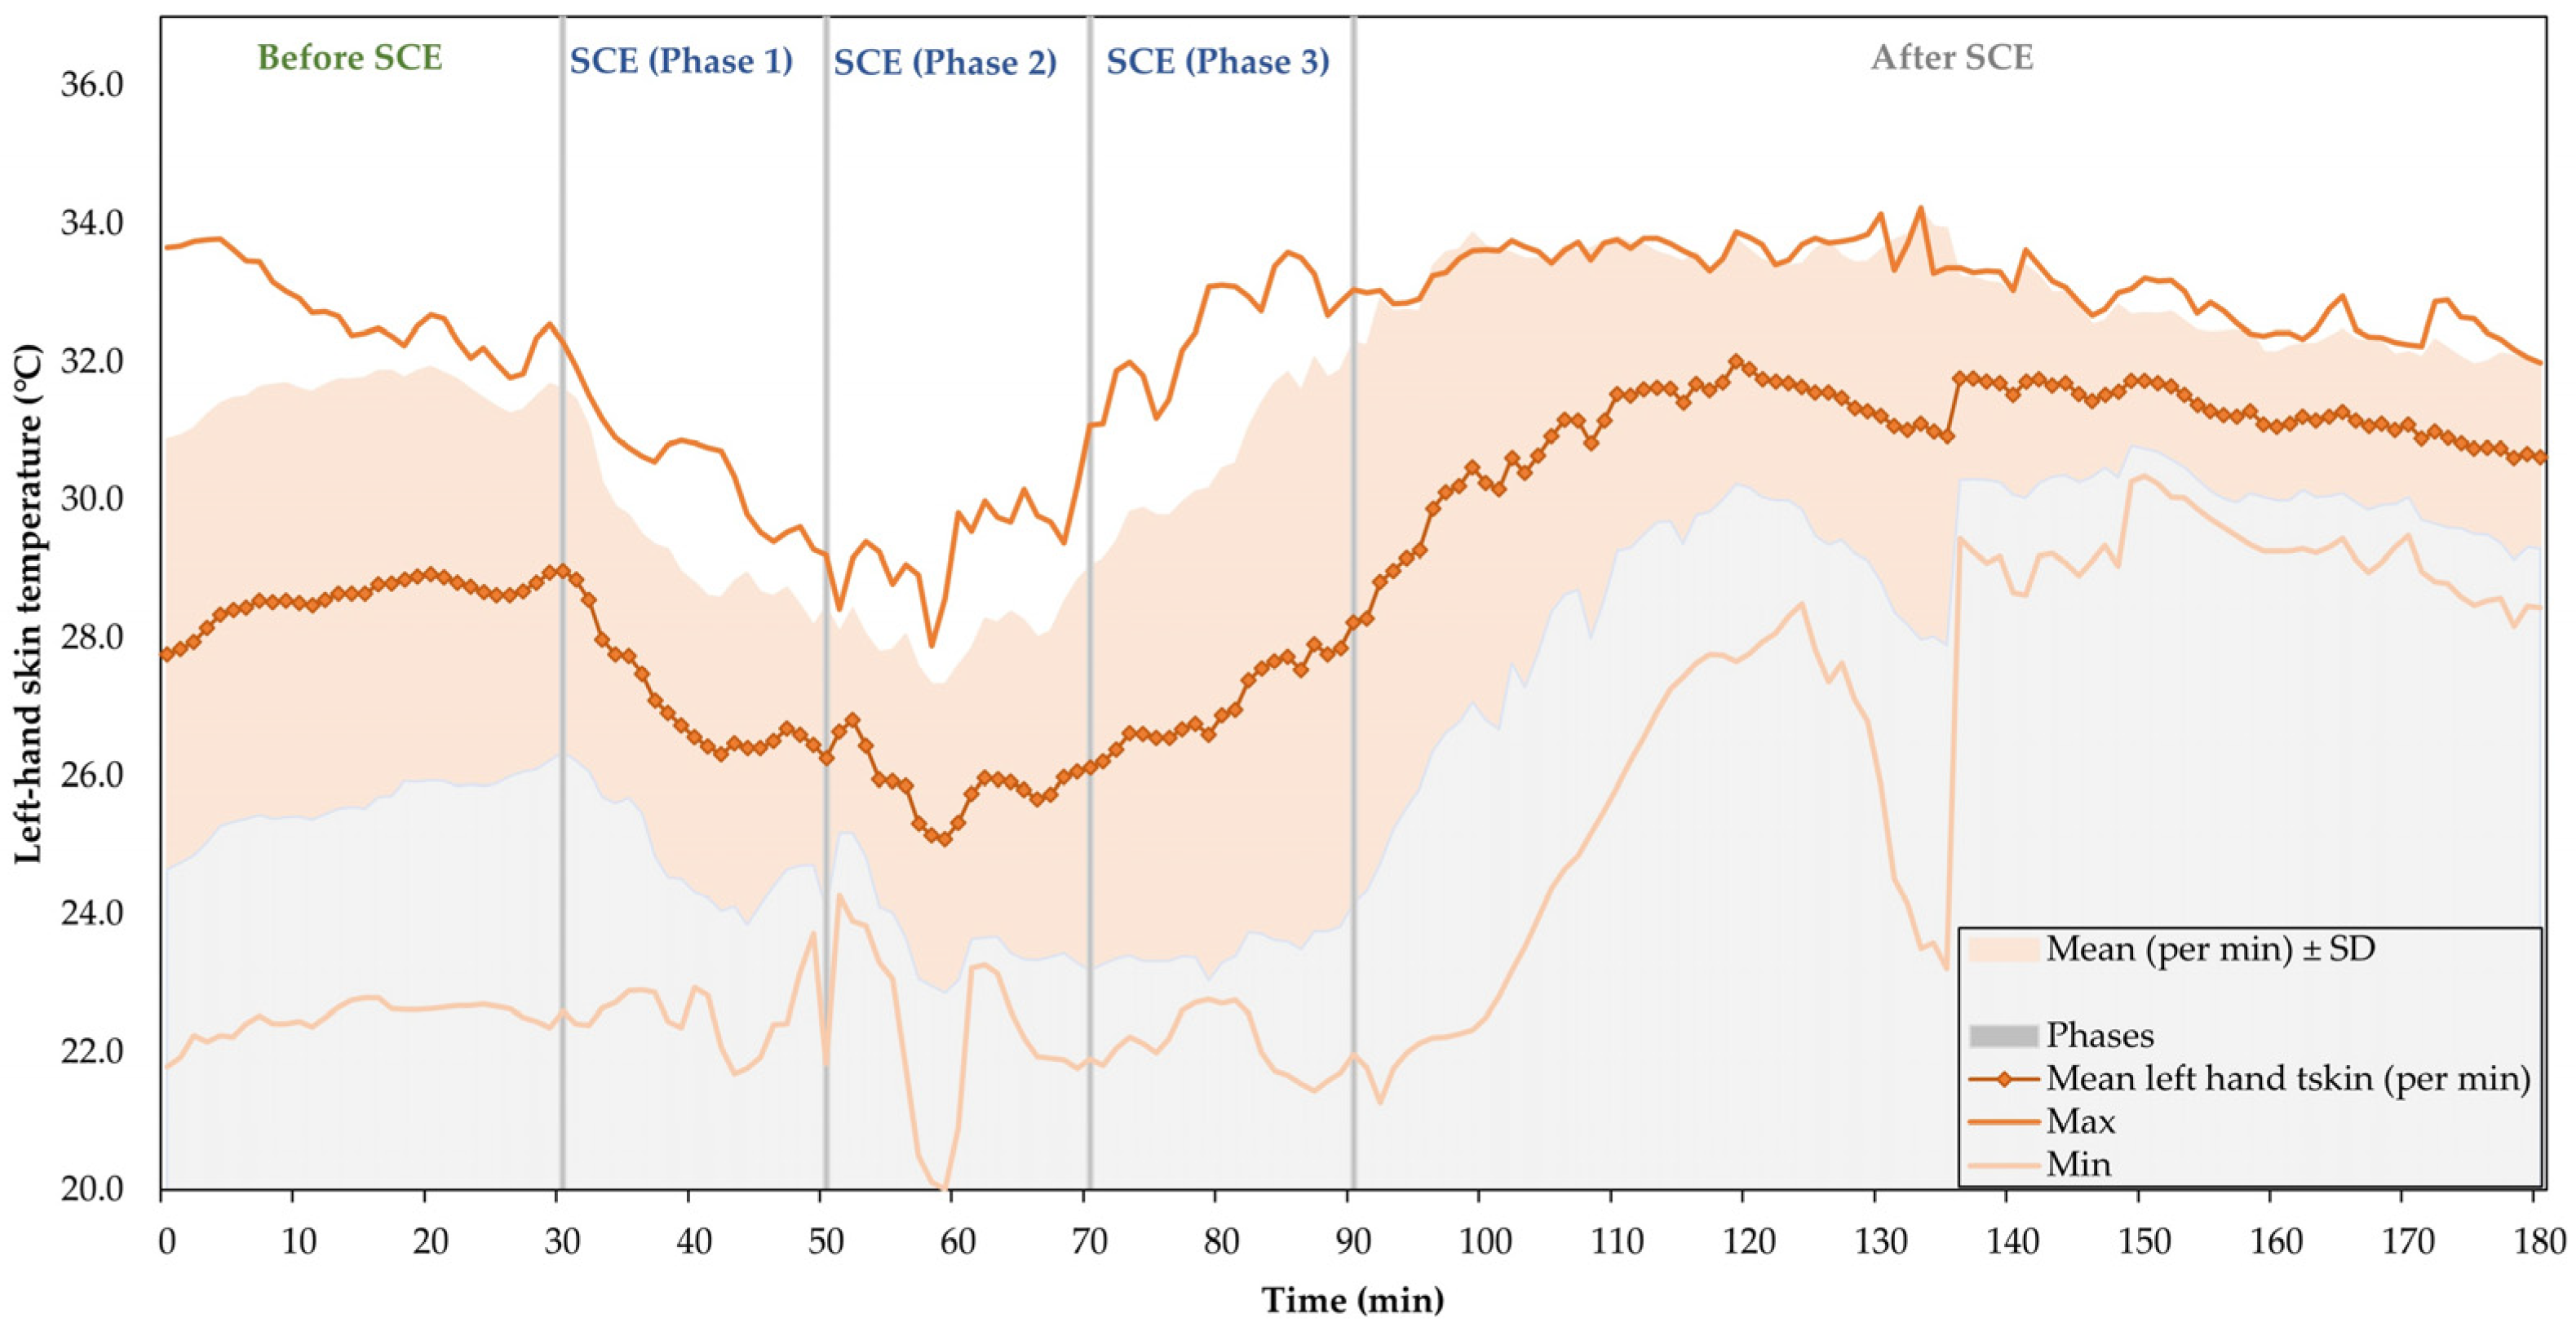
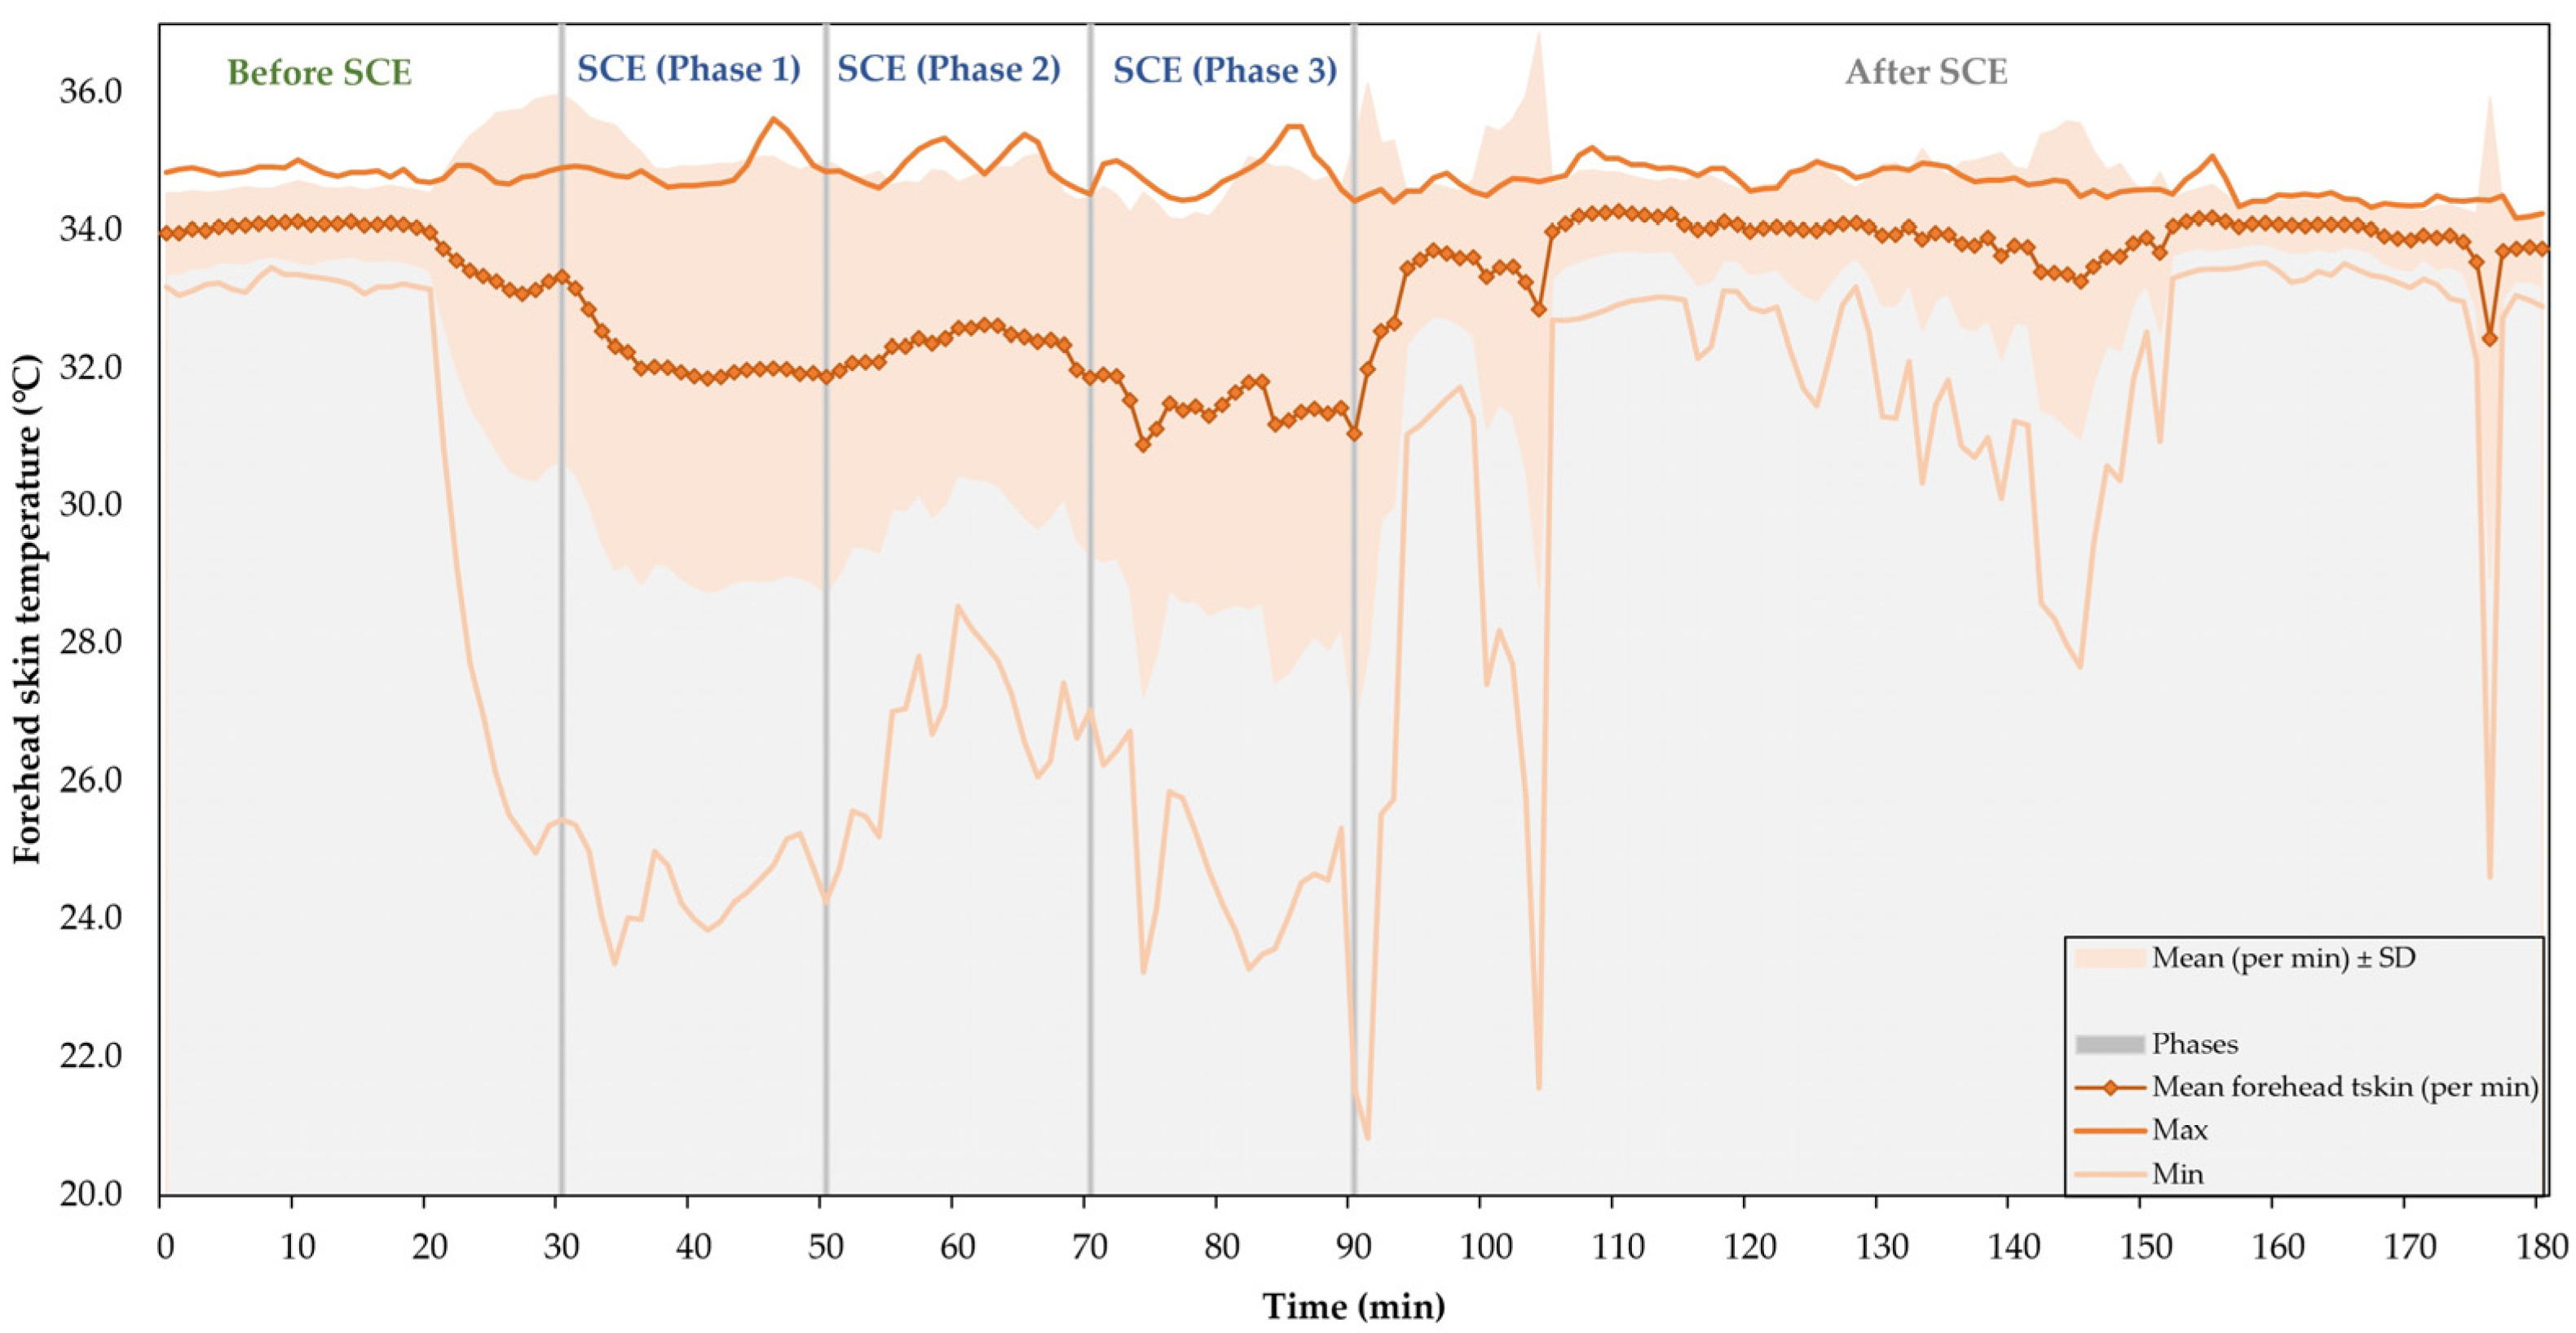
3.2. Skin Temperature

Mean skin temperature values (averaged from the eight measured points according to ISO 9886:2004 [35]) are illustrated in Figure 5. Overall, mean responses decreased the most during exposure until around 30.6 °C. They showed a slight increase in the initial minutes and remained stable during the initial 30 min of the experiment (before exposure to SCE) to decrease rapidly in the first minutes of exposure (approximately 1 °C). Given the sequence of activities, these outcomes were consistent. The sensors were placed on the participants without clothes. Later, they wore regular clothes, which caused the first temperature rise. Five minutes before SCE exposure, the participants wore cold protective clothing, leading to the subsequent temperature increase. Interestingly, average values after exposure were higher than those registered before exposure. Similar to the findings in core temperature recordings, physical exertion resulting from the simulated activities combined with the higher ambient temperature can be considered the main reason for these increases. Regarding the significance of the observed variations, t-test results revealed p-values of less than 0.001 for all considered periods (Figure 6).
The left hand and forehead reported higher variations among the eight skin temperature measured locations, denoting their higher influence in the mean Tskin differences. The left-hand mean temperatures (Figure 7) had the most notorious decrease in the eight Tskin points. Overall, they went from 27.8 °C to 25.1 °C following 30 min of exposure to −20 °C. After that, they began a slow increase potentially related to a more intense manual hand heating. The temperature rose to 28.2 °C at the end of the SCE exposure, with the recovery taking 30 min (without gloves). Remarkably, following the recovery period, mean values went above initial values and reached 30.6 °C. Similarly, the forehead (Figure 8) also described considerable temperature differences (the highest after the left hand). The temperature decreased throughout the SCE exposure from 33.3 to 31.0 °C (minute 30 to minute 90). The recovery time was approximately 25 min.

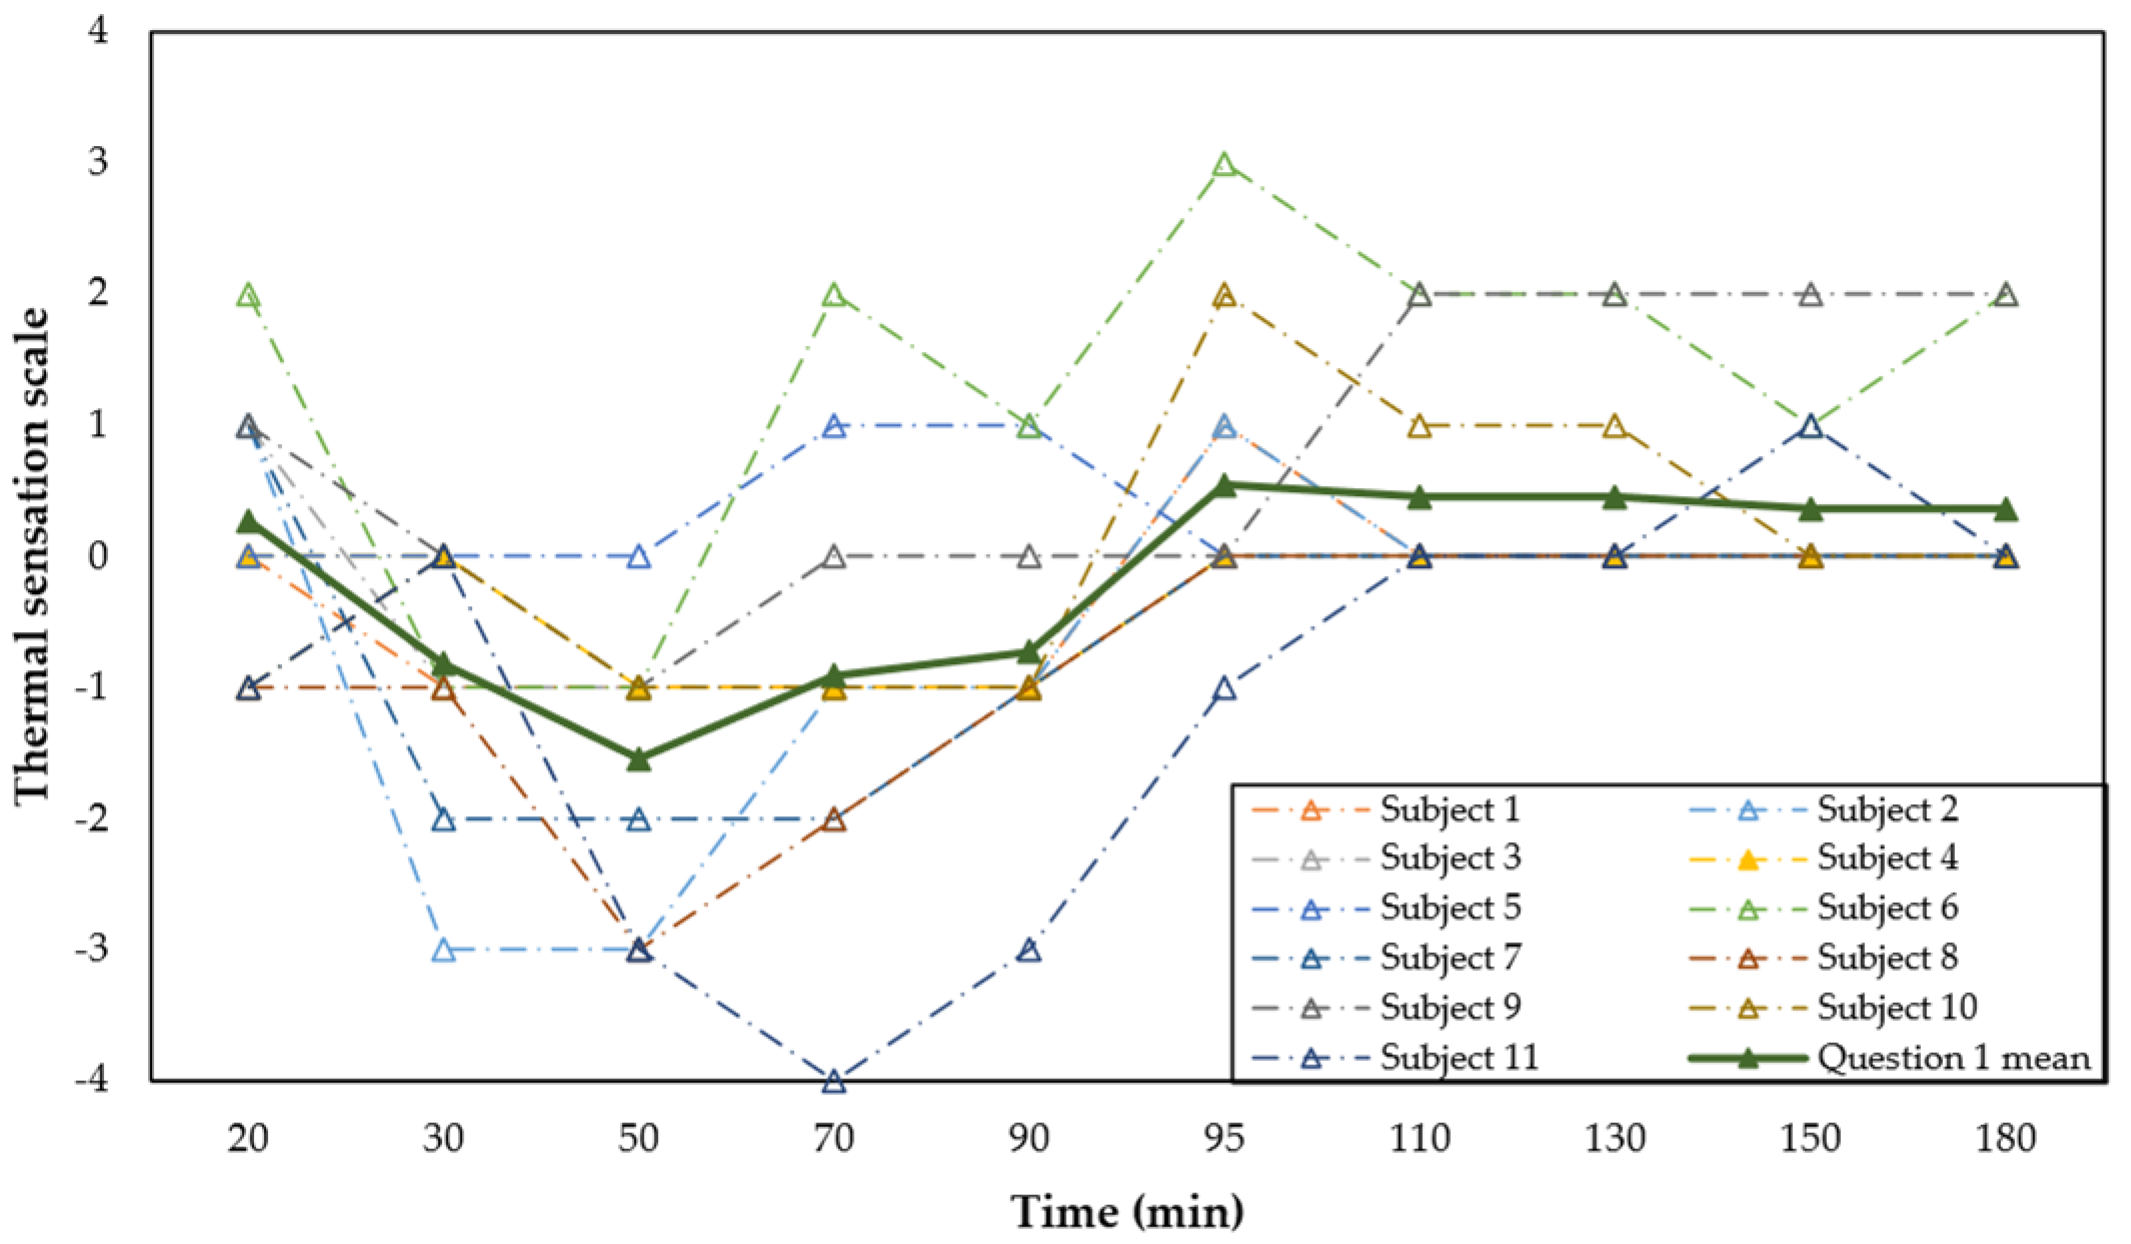
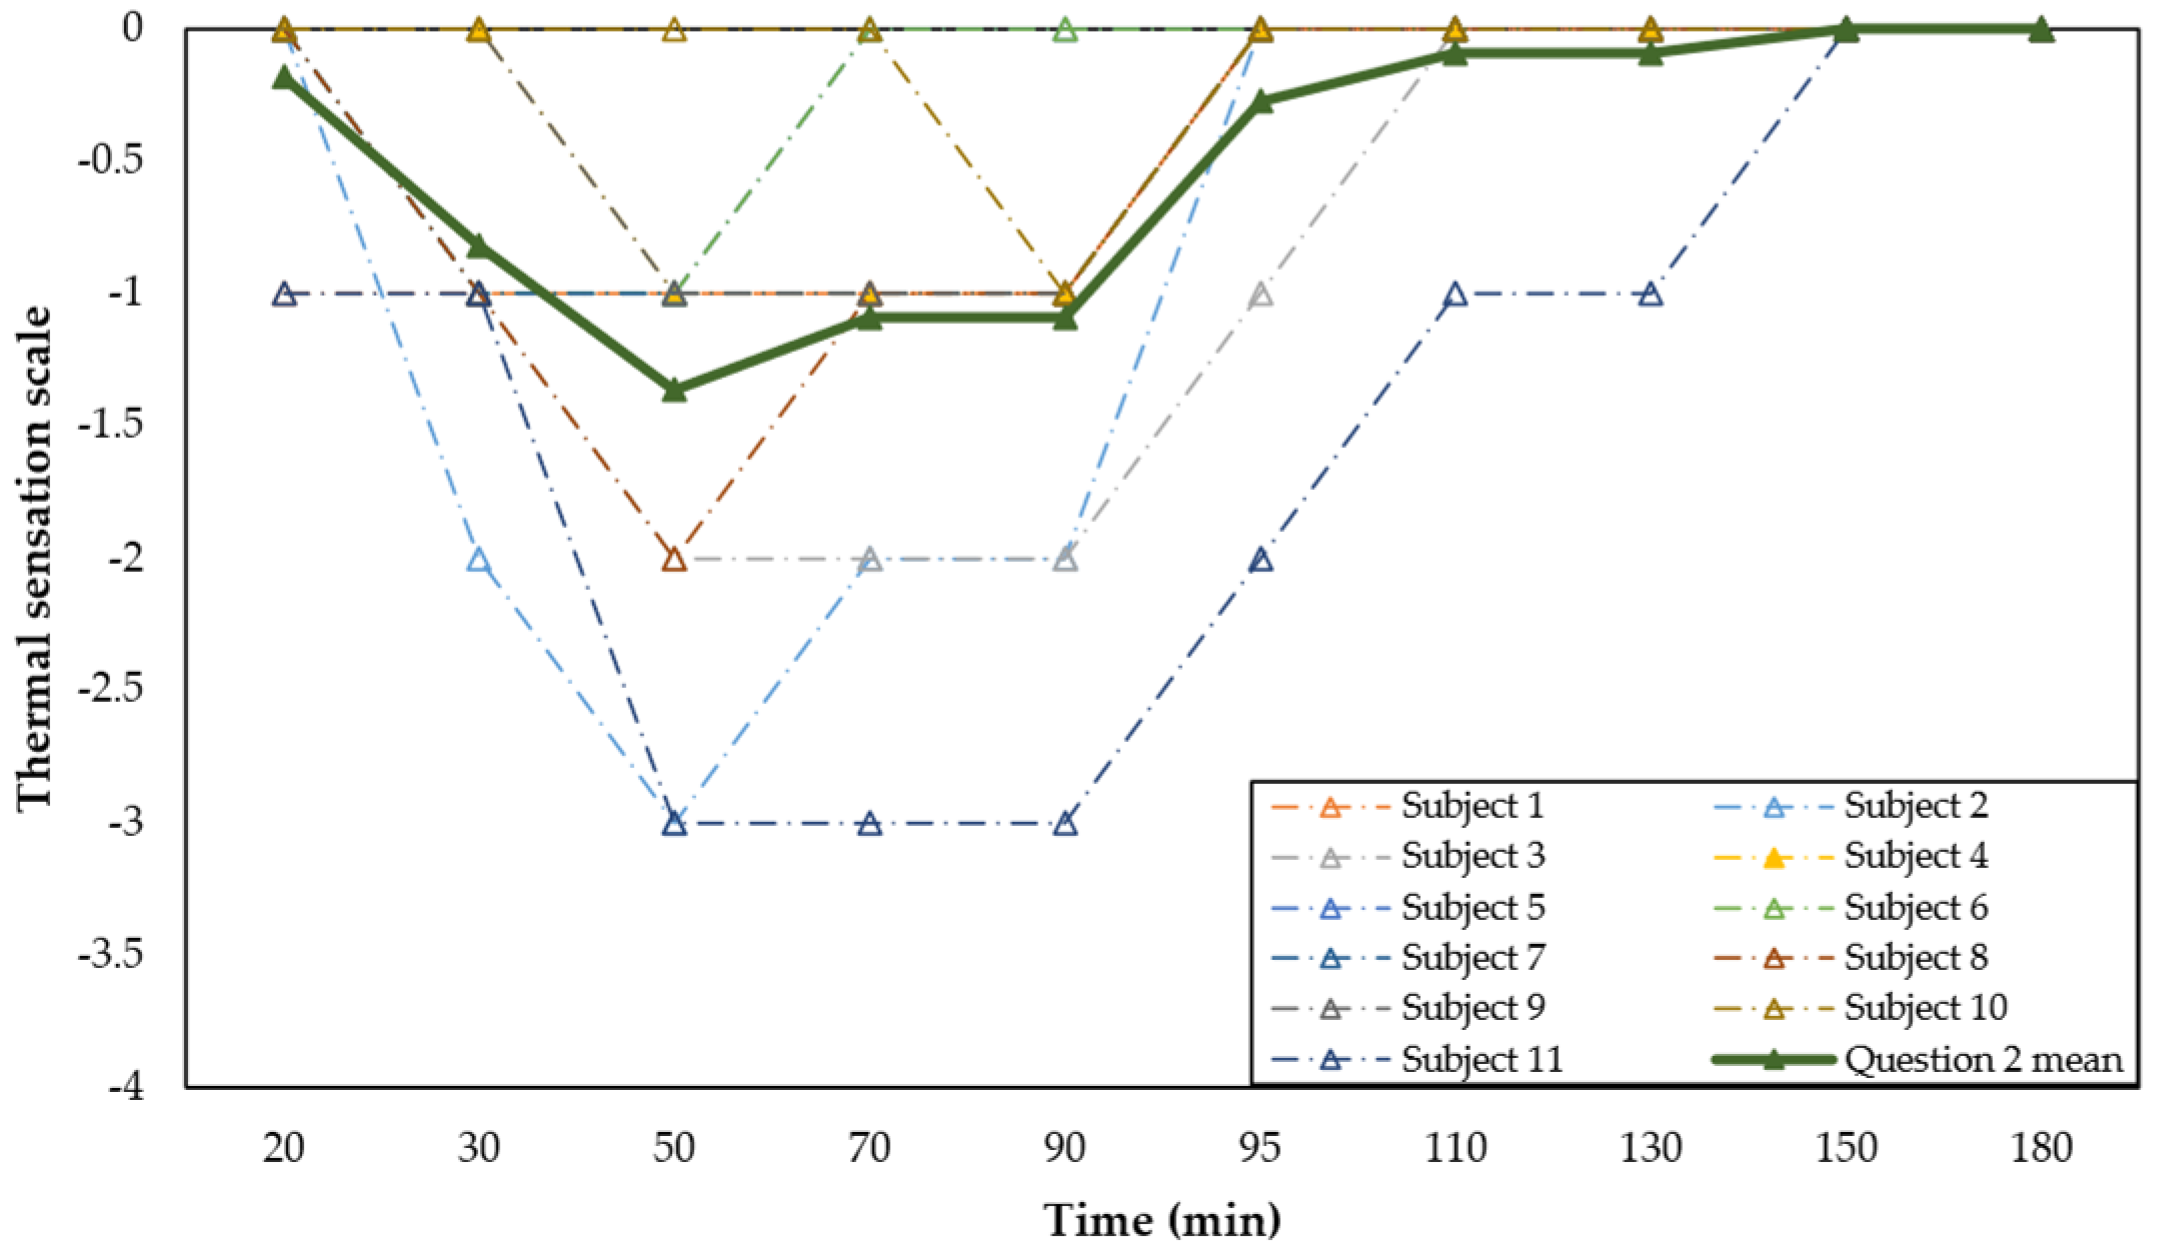
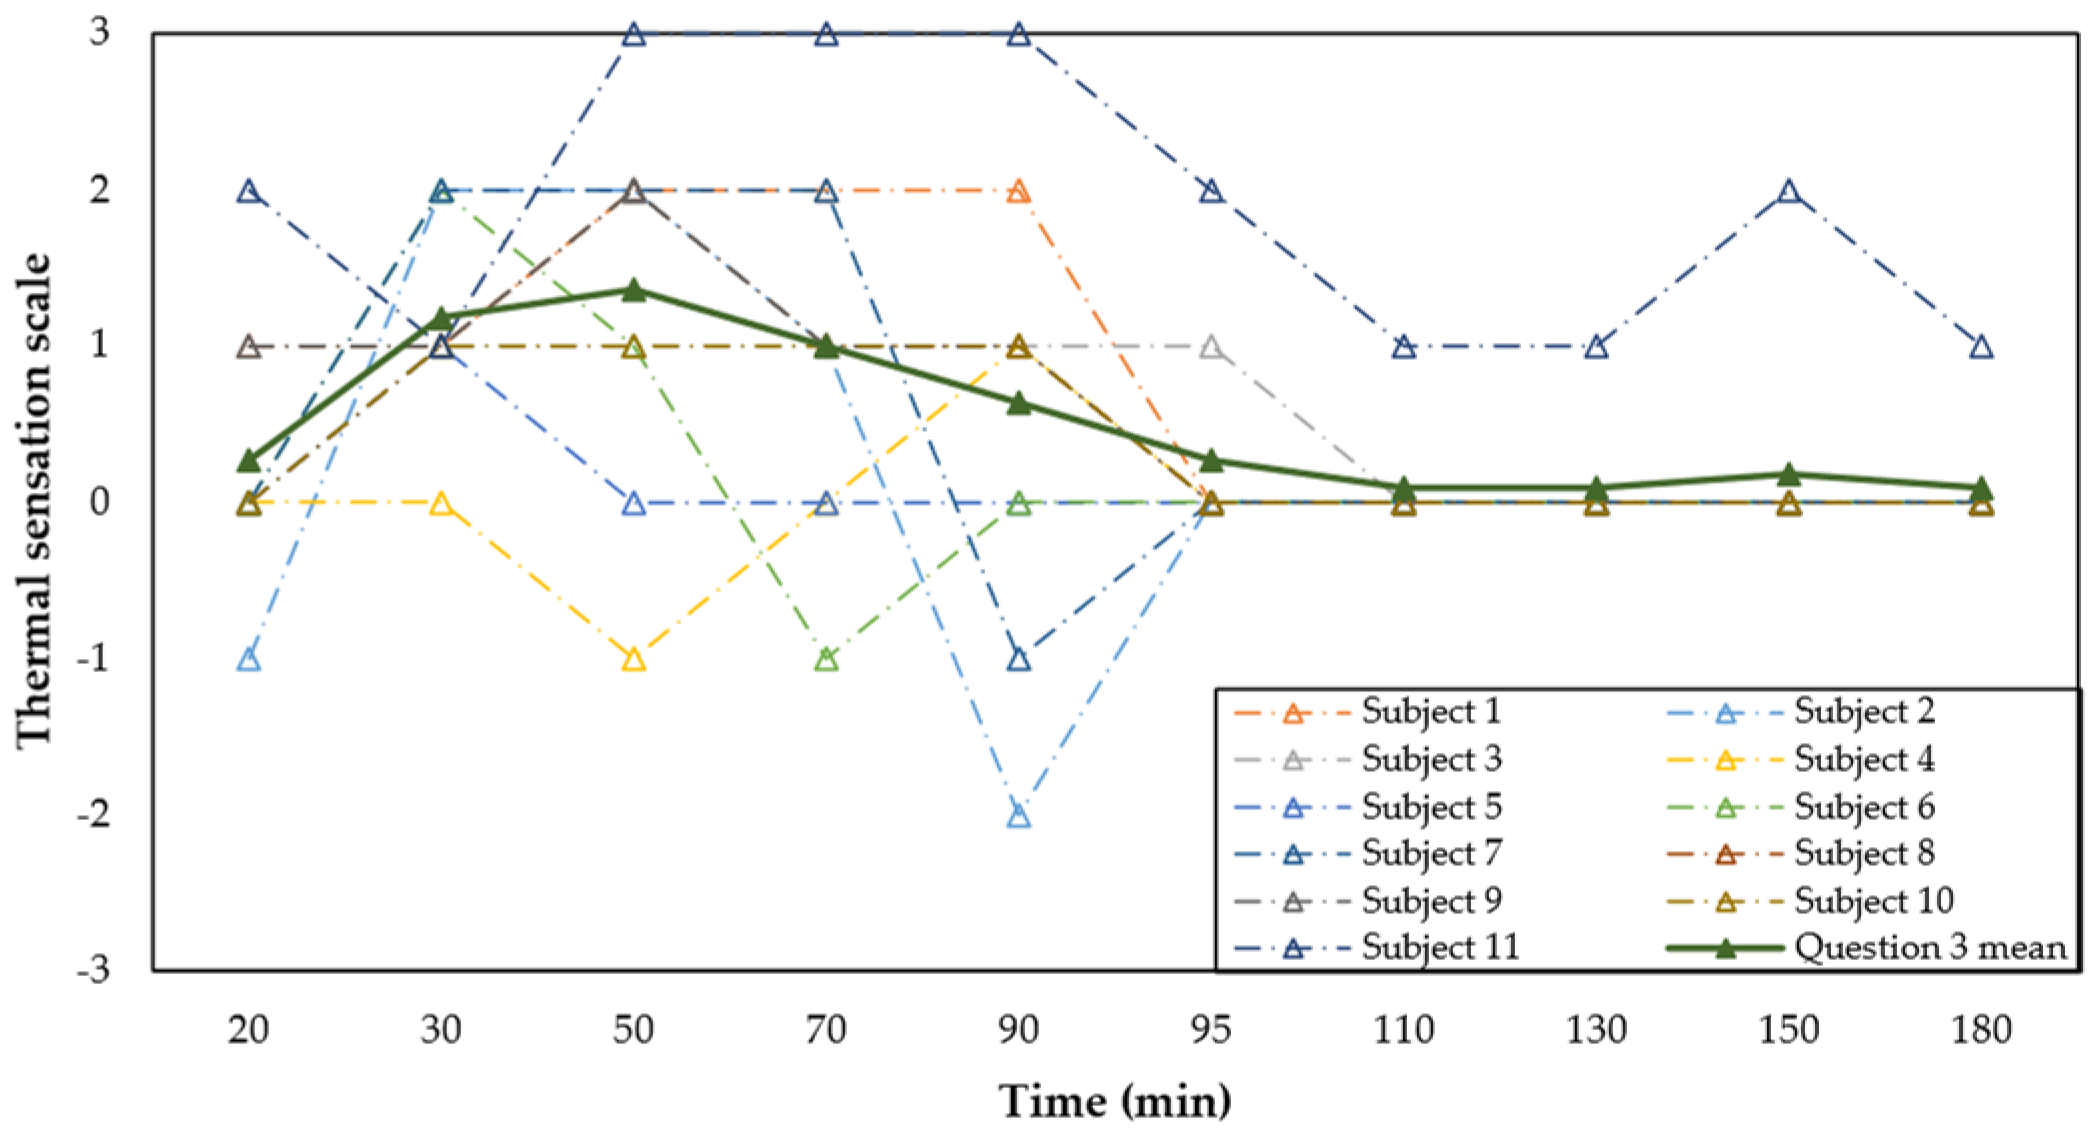
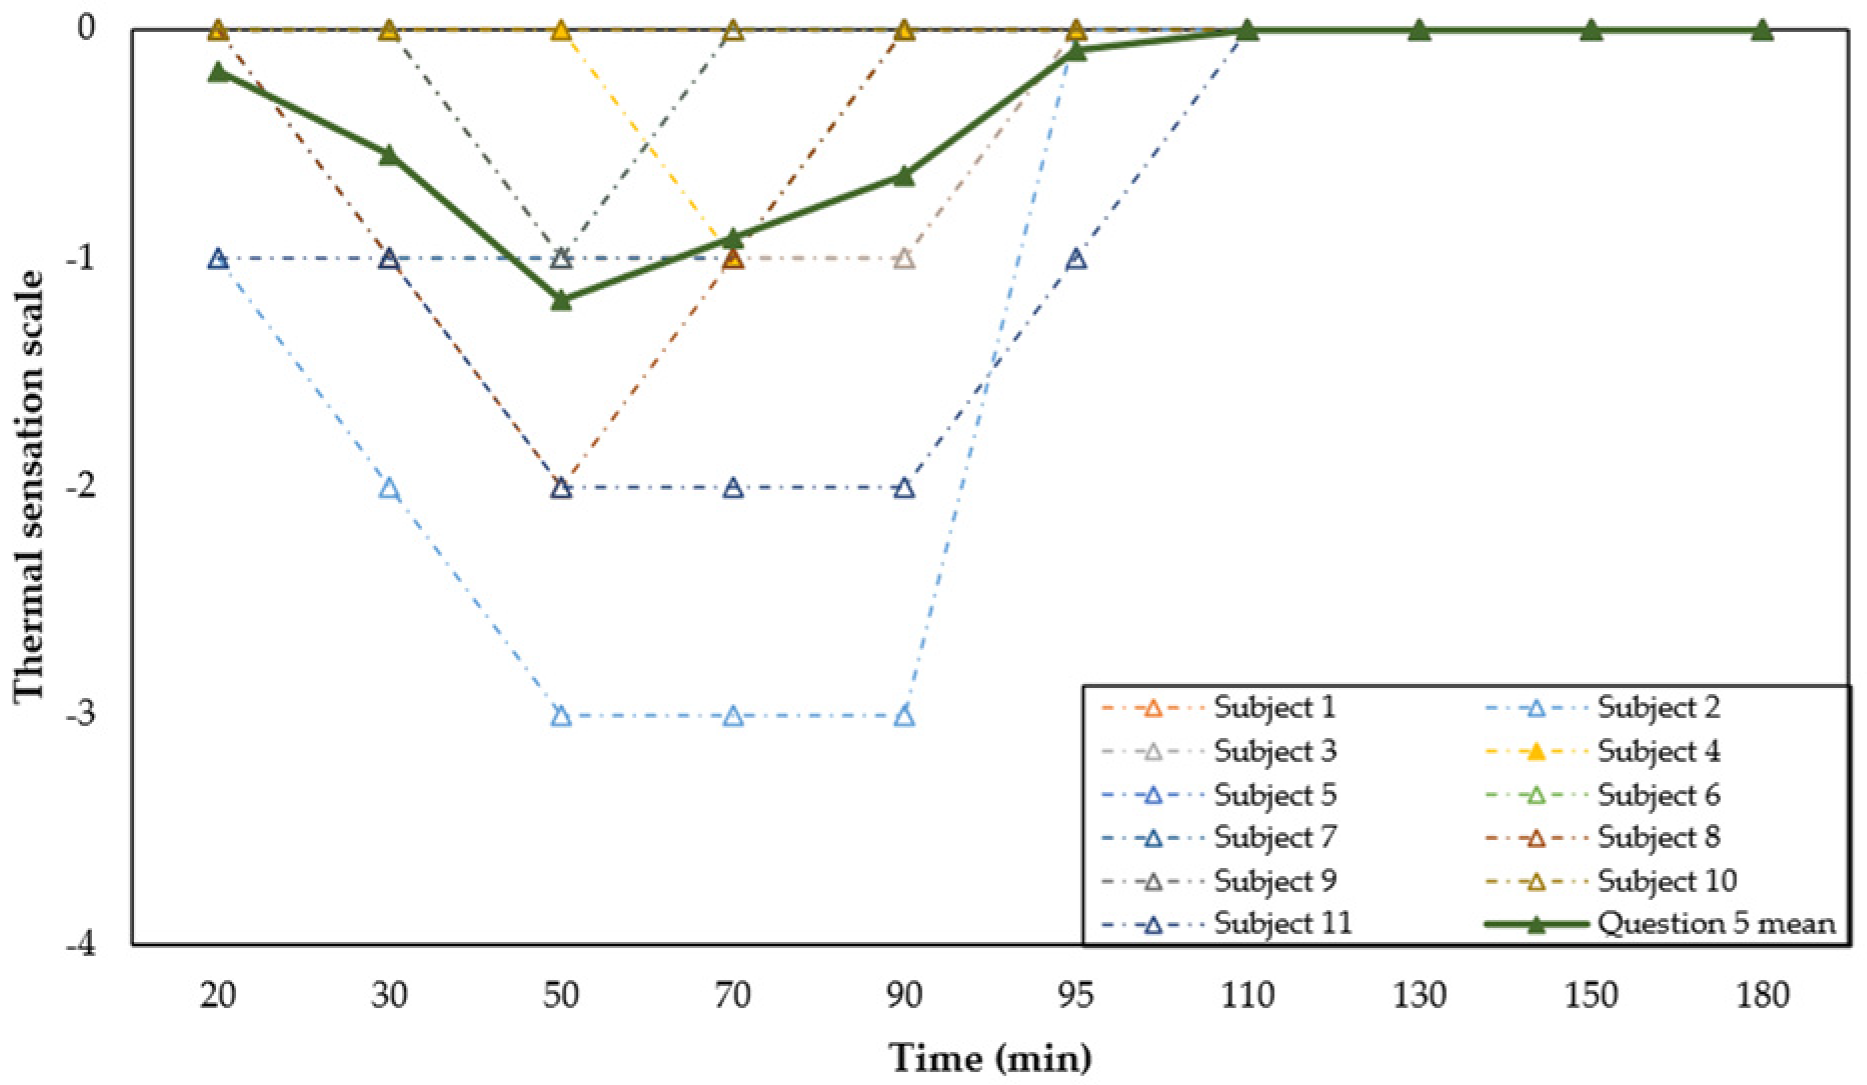
3.3. Thermal Sensation Questionnaire
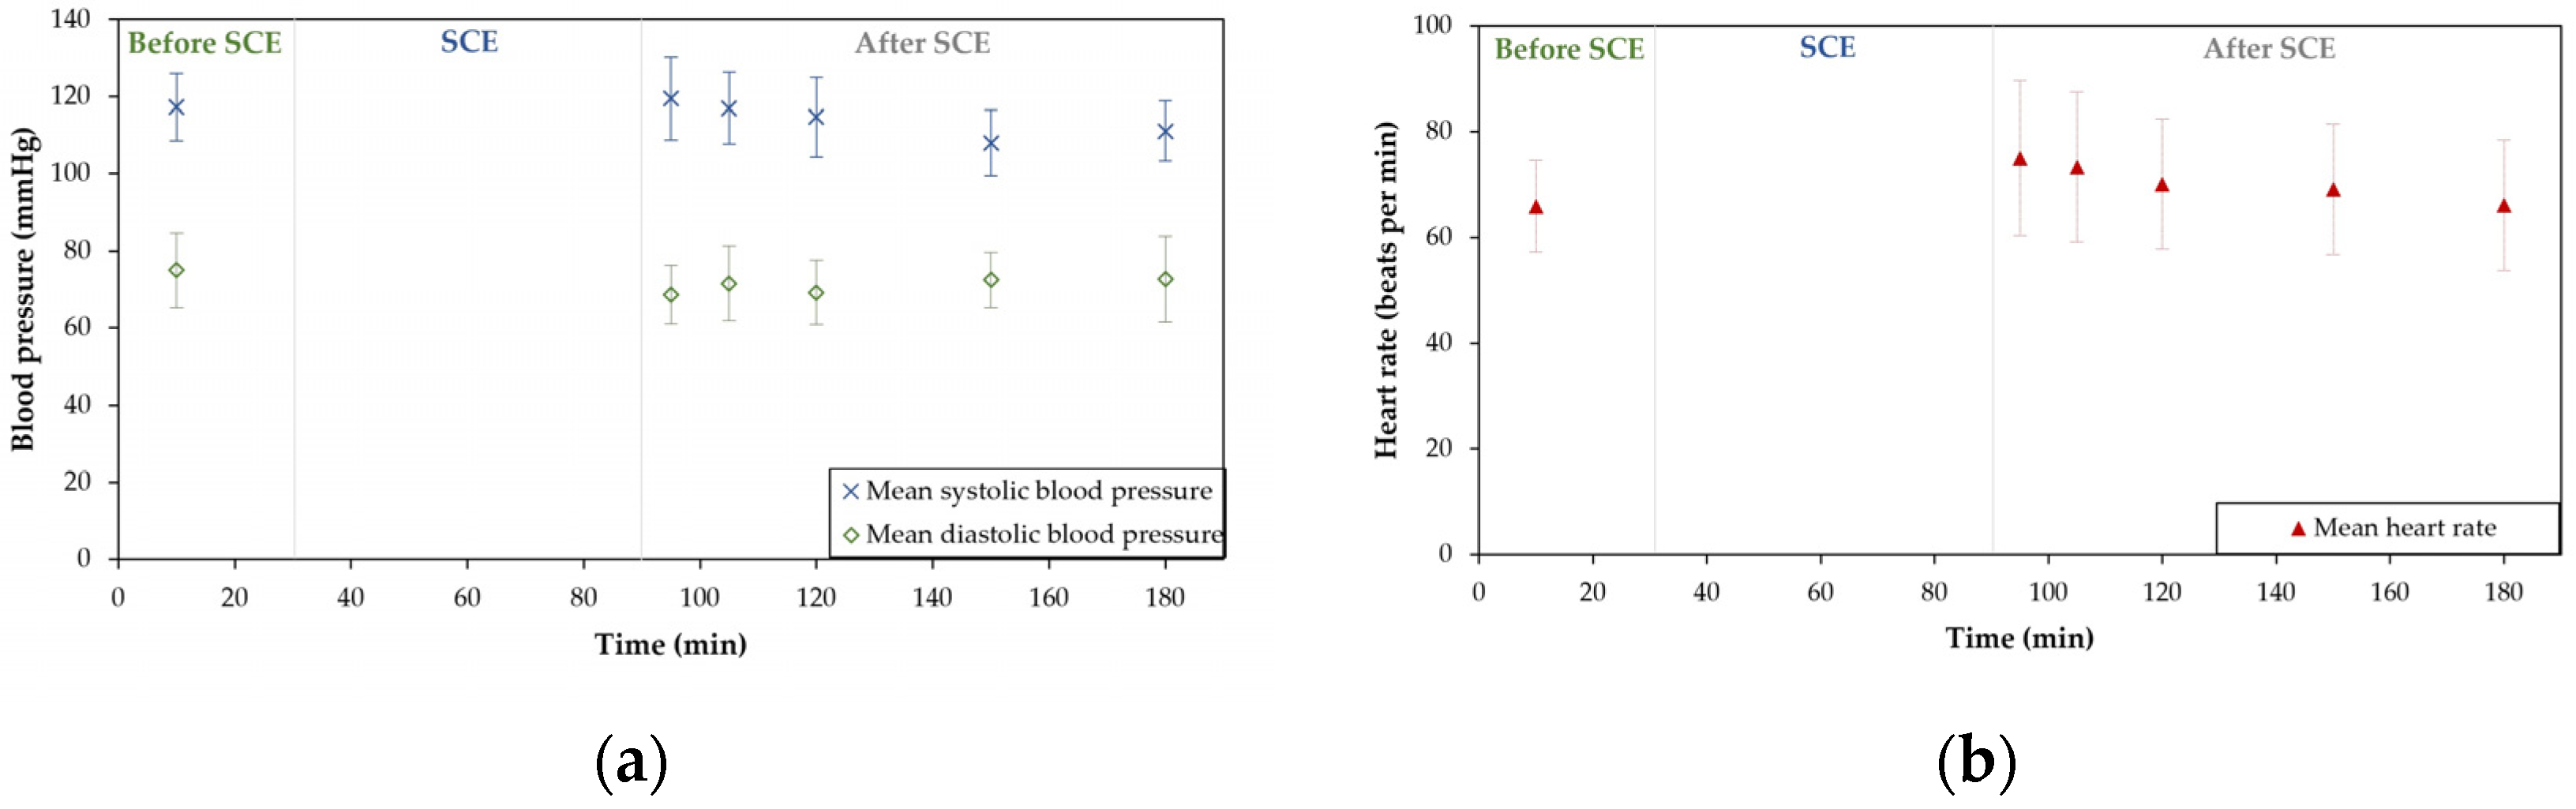
Responses on thermal sensation through the TSQ were registered 10 times throughout each trial. Questions 1 (Figure 9), 2 (Figure 10), and 3 (Figure 11) showed consistent results, with the most relevant findings identified during the initial 20 min of SCE exposure. During this period, subjects described a thermal sensation (first question of the TSQ) between “cool” and “slightly cool” (mean obtained value: −1.54). In the remaining time of SCE exposure, the cold thermal sensation decreased, and subjects experienced a psychological adaptation to cold and higher thermal comfort. Similarly, responses to question 2 described the environment as being between “uncomfortable” and “slightly uncomfortable” during this period while reporting their preference for an environment between “slightly warmer” and “warmer” (question 3). Also, as described in Figure 12, positive correlations between these items’ responses and mean and local (from the forehead and left hand) skin temperatures were observed.
Answers to question 4 (described in Figure 13) evidenced an overall acceptance of climatic conditions, with only three participants indicating to reject the climatic environment after 20 min of starting exposure to cold and two after 40 and 60 min, respectively. Concerning question 5, in which participants were asked to give their opinion on the environment based on a scale ranging from −4 (“unbearable”) to 0 (“perfectly bearable”), in general, answers ranged from −1 (“slightly difficult to bear”) to 0 (“perfectly bearable”), with the most notable results being evidenced in minute 50 (mean obtained value: −1.18). Furthermore, symptoms of sleepiness, vomiting, nausea, anxiety, dizziness, tiredness, and loss of motor coordination were addressed in Question 6. Volunteers described sleepiness during the recovery period, with half of them indicating this symptom in minute 150.
Regarding questions 7 (addressing localised pain) and 8 (addressing localised cold sensation), some participants reported experiencing pain and cold, mainly in the fingers, despite gloves protection. Five described feeling cold in their fingers after 20 min of exposure to SCE, while four felt pain. These cold and pain sensations started reducing in the second phase (two reported cold and three pain in the fingers) and remained constant until the SCE exposure was completed. They stopped right after completing the SCE period, while the left-hand temperature recovered quickly and even reached higher values than before exposure (Figure 7). Furthermore, participants indicated cold in the nose (four in minute 20 and three in minute 40) and cold and pain in the feet after 40 min of SCE exposure (five reported cold and one pain). Since the skin temperature sensors were not on the feet, describing a relationship between potential temperature decreases and pain and cold sensations was impossible. Still, reports of three participants’ cold in the toes and feet were observed even after 40 min of recovery. The foot pain was only registered until minute 95 (5 min after exposure).

3.4. Blood Pressure

Blood pressure parameters and heart rate were registered six times during each trial. As Figure 14 describes, values were within normal ranges (according to international recommended limits [42] and the ISO 9886:2004 standard [35] for BP and HR, respectively), and the most significant increases were recorded around minute 90 when subjects completed the period of exposure to SCE. Explicitly referring to HR, it showed an increase of approximately 10 bpm, demonstrating an expected response to the designed protocol of activities.

4. Discussion

The current study examined the effects of severe cold temperatures on male subjects’ physiology and thermal sensation during simulated occupational activities, with participants wearing personal cold protective equipment. The intra-abdominal Tcore, weighted mean Tskin (from eight measured points), HR and BP responses, and thermal sensation were examined for three hours, including a three-phase protocol with one hour of SCE (−20 °C). Overall, variables showed the most evident responses to cold during the initial phase of the exposure period. However, despite the significance of the variations, the most notable result was that they did not reach any risk limits when compared to international standards [35,42] and, in some cases, even increased from the initially recorded responses.

4.1. Physiological Variations

Previous investigations have evidenced that during exposure to severe cold temperatures, the core temperature can increase [25,30,40,43,44] or decrease [29,45,46,47,48,49,50]. Throughout the trials, the current study showed that Tcore and Tskin rose with higher physical exertion, even when subjected to SCE, and decreased with lower physical exertion, even during exposure to neutral temperature conditions. In general, mean core temperature responses were higher than other studies addressing exposure to similar air temperatures. Authors have previously described that the core temperature mainly decreased when the protocol activities involved participants sitting, order picking, or loading [45,46,47,48,49,50]. In contrast, the core temperature increased in investigations involving a higher physical intensity (e.g., walking on a treadmill [40,43,44]). Therefore, they concluded that internal temperature (mostly measured rectally) was higher when the working activity was heavier. A heavier exercise’s elevation of heat production kept both core and skin temperatures higher than a lower exercise level.
On the other hand, recent studies differed from these outcomes and evidenced that core temperature (measured intra-abdominally) can slightly increase during cold exposure, even when evaluating sedentary activities. Wu et al. [30] studied the responses of 12 young male individuals exposed to 30 min of severe cold (−20 °C), during which core temperature increased progressively to approximately 37.4 °C. In their trials, participants (with a clothing thermal insulation of about 2.16 clo) remained seated before, during, and after exposure to cold. The same research group examined the impact of ambient temperatures of −5, −10, and −15 °C on 12 participants (seated and with the same thermal insulation) and found that core temperatures increased and stabilised in the last minutes of exposure [25]. These discrepancies in results are attributed to the Tcore measurement location since temperatures of the rectal and tympanic regions (as in the first cases) are considered inappropriate for estimating the strain sustained by a subject [35].
As a result, normative guidelines [35] indicate that core temperature responses should consider the oesophagal or abdominal temperature. The current study determined the core temperature by measuring the abdominal temperature using swallowed pill sensors. The goal was to evaluate the human responses to occupational cold exposure, including simulated manual handling activities and wearing cold protective clothing (3.16 clo). Given these experimental conditions, outcomes showed significant variations but always remained within normative limits (above 36 °C [35]). The results described an increasing trend from minute 10 (of SCE exposure) and reached the highest values right after the 60 min of exposure to SCE. In this period, participants had already performed 60 min of physical activity that, together with the higher clothing insulation (compared to similar studies [25,30]), increased internal temperature despite the cold environment.
Regarding skin temperature, the calculated mean Tskin values showed a decrease from 31.5 to 30.7 °C in the initial 20 min of SCE exposure. After that, Tskin had small rises, reaching 31.6 °C when the SCE exposure ended. The recovery started after the cold exposure and reached higher temperatures than the initial ones. These temperature decreases are consistent with the available literature; however, they are not as low as the values reported by some authors [40,46,51]. For example, a previous study [51] evaluating walking and jogging activities and similar conditions (60 min of exposure to −20.0 °C) reported that Tskin decreased to 27.0 °C. However, variations from baseline values could not be obtained in this case.
Overall, core and mean skin temperature did not decrease substantially during SCE due to clothing insulation and manual handling activities. Indeed, body temperature, mainly skin temperature, has been previously found to be significantly affected by clothing insulation during exposure to cold environments [52,53]. Some authors have suggested that specific clothing items attenuate the effects of cold exposure. Gloves, hats, and scarves are crucial since they help protect those body areas most involved in influencing blood pressure responses [53,54]. Nonhairy skin (such as the hands and face) contains more thermal receptors than other skin zones; therefore, these areas are more sensitive to the effects of cold [55,56]. Furthermore, protecting the head from cold reduces the sympathetically mediated rise in blood pressure parameters in young individuals [53], and wearing hats, for example, promotes faster recovery of forehead skin temperature and blood pressure. Consistently, in this study’s assessment of local skin temperature, the level of the change in the eight skin temperature points varied, and both left-hand and forehead temperatures were evidenced as the most altered skin points.
As the current study demonstrated, local body exposure has an essential part in altering temperature responses, with this local exposure resulting from clothing asymmetry. For instance, when an individual does not wear gloves during cold exposure, his hands are exposed to cold temperatures, while other body areas heavily protected with clothes are not. Therefore, thermal comfort and physiological alterations may differ under various local exposure situations. Available literature has shown that most studies do not focus on local exposure; however, some have applied methods to evaluate non-uniform thermal settings. Huizenga et al. used air sleeves to cool or heat local body areas to examine thermal sensation and physiological alterations [57]. Arens et al. described that overall thermal sensation was affected by local thermal sensation and that hand cooling or heating had more influence than other body areas [58]. Moreover, Jin et al. observed that a cold head affects general thermal comfort [58]. As the results and available literature confirm, monitoring local skin points and implementing measures to reduce heterogeneous exposure to cold appears essential to controlling and preventing the consequences of cold exposure.

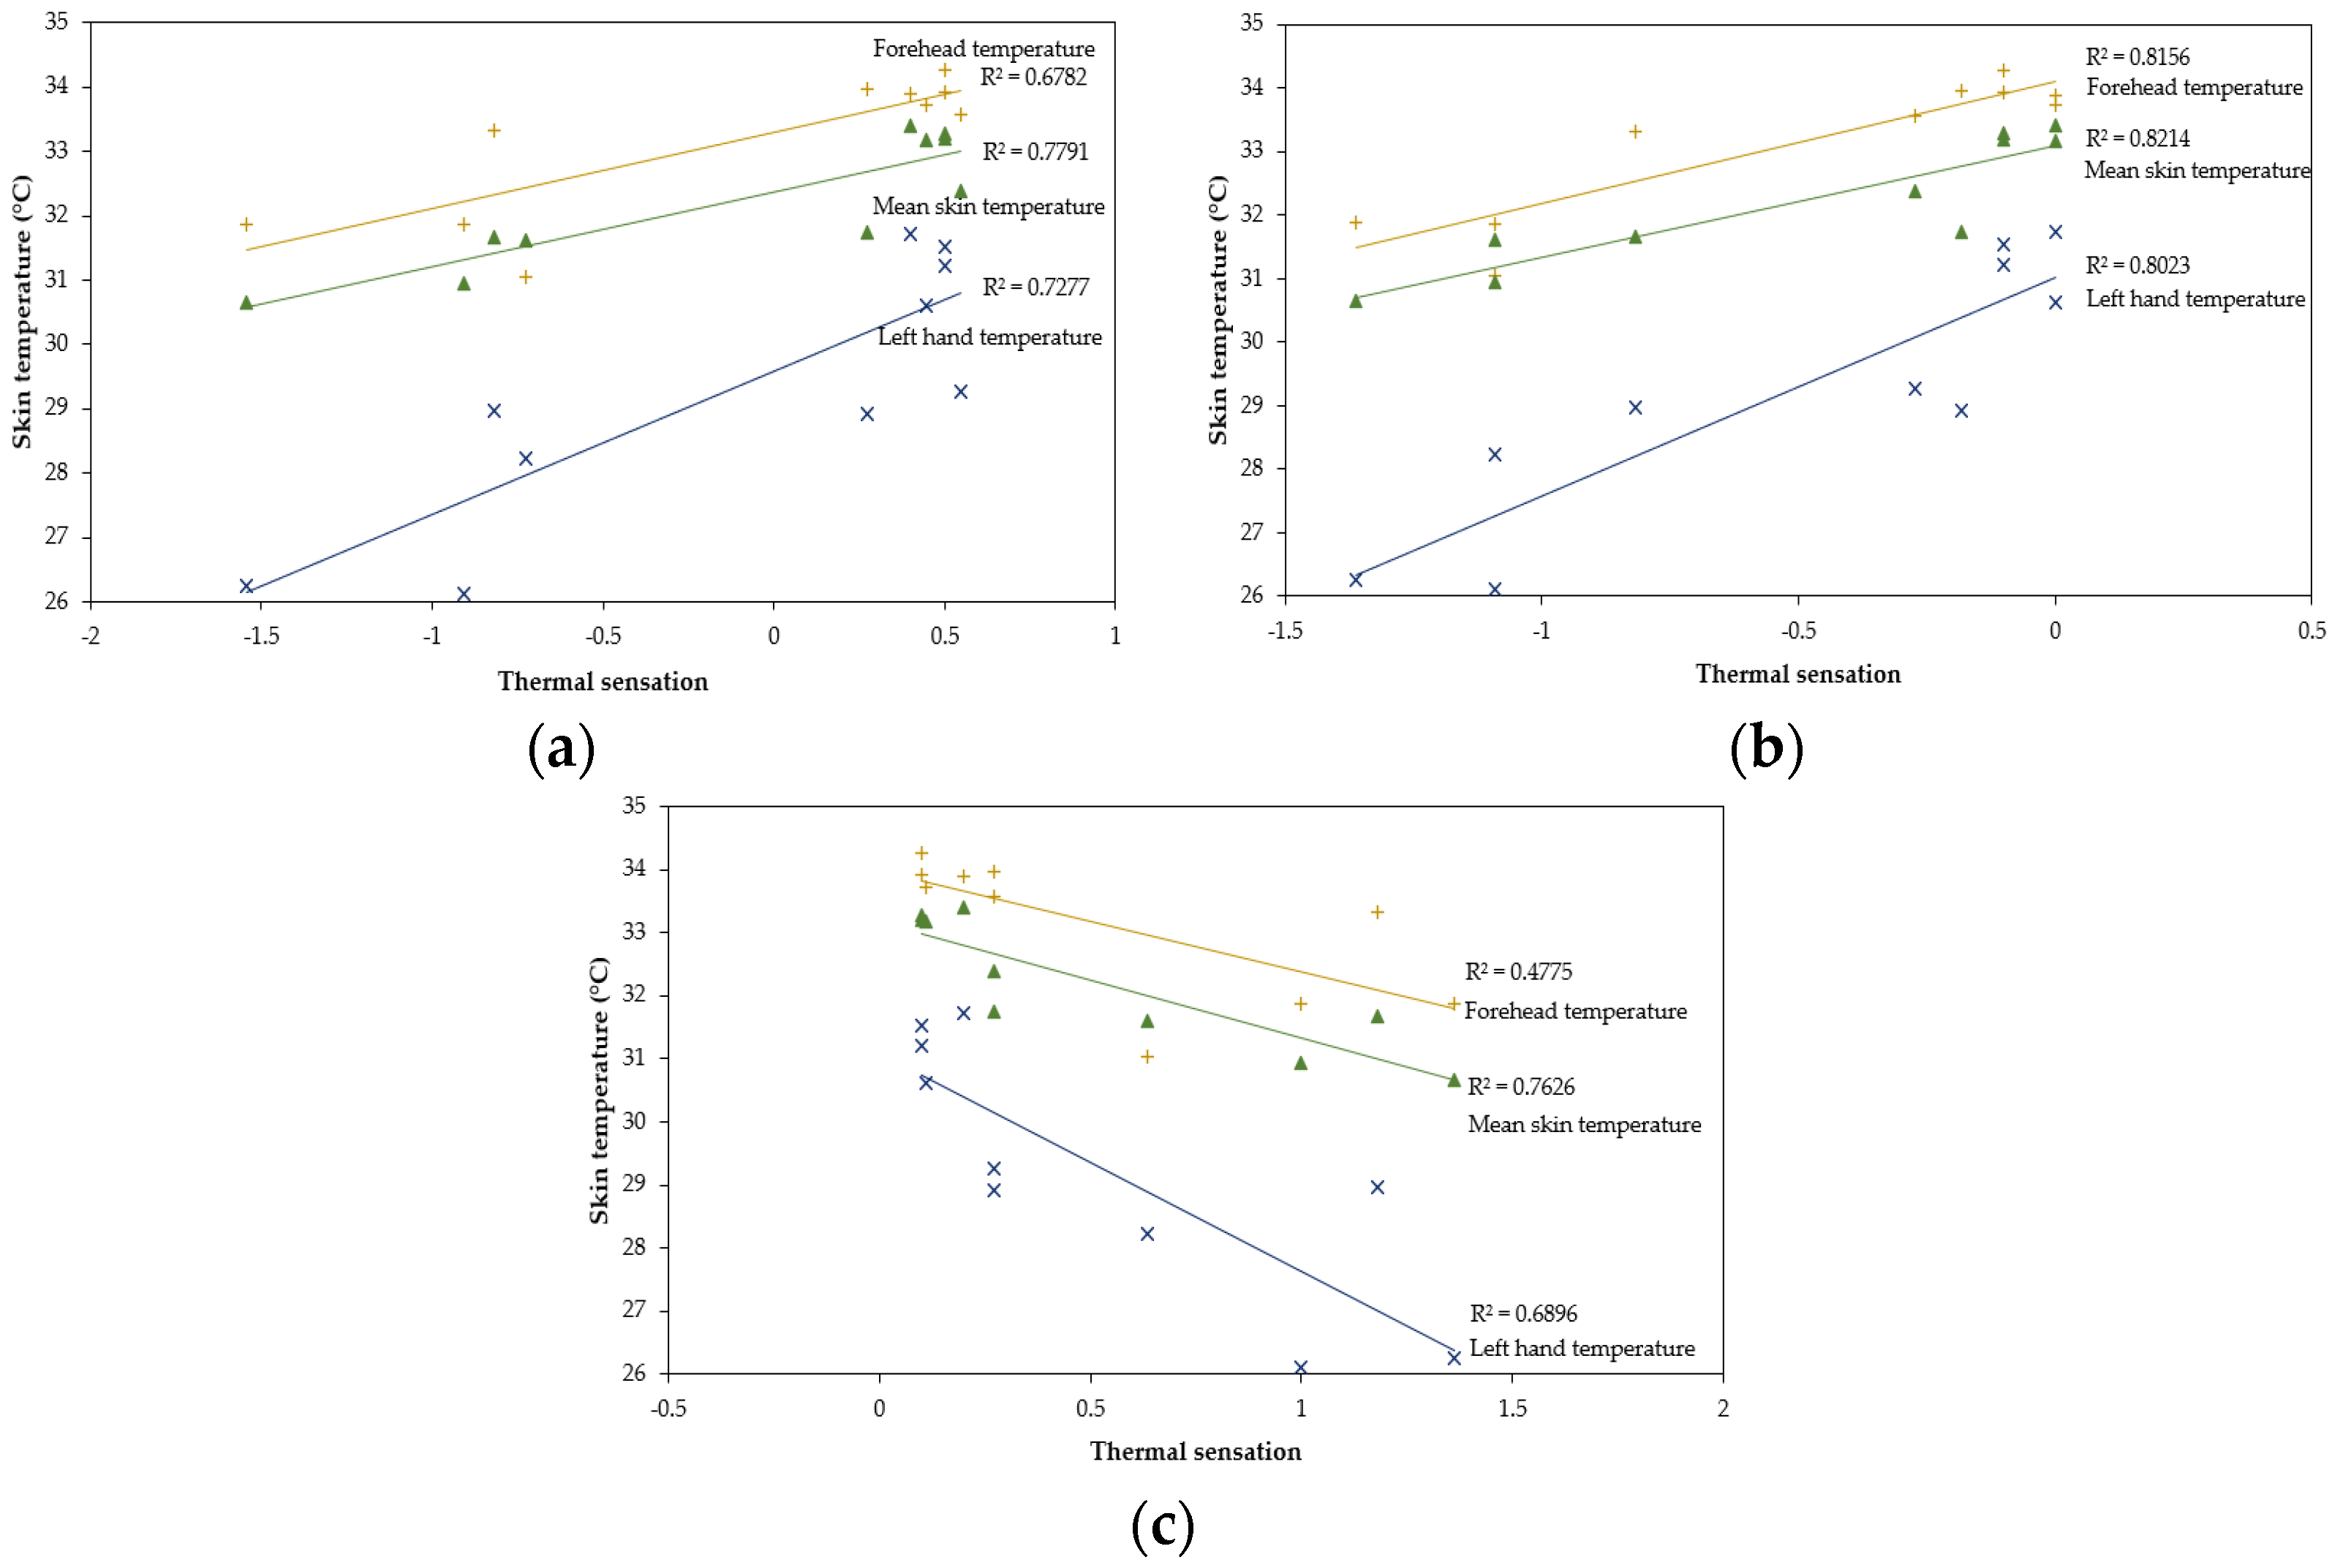
4.2. Thermal Sensation and Localised Skin Temperature

Given the temperature differences from various skin points of the same individual, literature has demonstrated that studying the associations between individual thermal exposure and thermal sensation and preference is fundamental to enhancing the understanding of the thermal adaptation process [59]. As previously described, mean Tskin responses decreased during exposure but recovered and even exceeded pre-exposure values. Answers to questions 1, 2, and 3 of the TSQ were consistent with the mean skin temperature responses before and during cold exposure. However, following 40 min of cold exposure, there seemed to be a psychological adaptation to cold, and the reactions to the TSQ evidenced higher thermal comfort. Even though subjects felt less cold (Figure 9), the mean Tskin remained low. There was a faster thermal sensation stabilisation in the recovery period than the physiological variables. Still, panels from Figure 12 describe good correlations between local and weighted mean skin temperatures with the TSQ responses, which aligns with previous literature findings [27].
Regarding cold and pain sensations resulting from the low temperatures (addressed in Questions 7 and 8), outcomes indicating fingers and feet as the most reported places where participants experienced cold, pain, or both suggest that these skin areas should also be monitored. Upcoming research can include these measuring points and comprehensively study the relationships between skin temperatures and thermal sensations. Furthermore, in light of these outcomes, new validated questionnaires also appear necessary to evaluate cold thermal sensation, with questions related to cold and pain sensations of specific body areas (such as those included in this study) with standardised scales.

4.3. Practical Implications for Occupational Settings

Workers in various professions are subjected to cold temperatures while performing manual handling activities [1]. On the other hand, several studies have found the extremities to be one of the main constraints in sustaining performance at low temperatures [40,44,46,47,50]. The current work did not measure the changes in performance during simulated manual handling activities. Still, from the findings in which local skin points appear essential for understanding and controlling the cold effects, it can be inferred that there is a direct link between some local skin points and maintaining or not working performance during these activities.
From the occupational perspective, manual performance can still be compromised if the finger, hand, or forearm is individually cooled while the other body areas remain warm. Hands cooling diminishes manual performance and tactile sensitivity and can increase the risk of accidents [56]. This impact on manual performance has also been addressed in Imamura et al.’s study [60] by testing the influence of protective clothing, gloves, and physical activity on manual performance during cold exposure. Both studies described that low temperatures diminished finger and manual dexterity and that gloves impaired performance in all manual tests. Furthermore, it was evidenced that finger dexterity was more impacted than manual dexterity and that exercise helped diminish cold effects. Physical exercise could significantly increase finger temperature and partly restore manual performance during cold exposure. The current study observed that, even though left hand temperatures were the most altered by cold, they recovered fast, even during exposure to SCE, which can be attributed to the heating from continuous physical activity.
As a result, adequate spacing and duration of work-rest periods are crucial for optimising working conditions in severe cold settings. An appropriate workload can effectively maintain the mean body temperature and the temperature in the extremities in a cold environment [47]. Metabolic heat production should be kept at least at a moderate level of physical activity over time, and tasks should be planned to minimise the exposure of uncovered body areas [40]. It was also observed that the protective clothing worn during exposure to cold temperatures and the protocol of activities also influenced the increases in core and skin temperatures, except for the forehead and the extremities. Therefore, gloves and boots could be improved to maintain satisfactory performance and comfort during prolonged exposures.
Our study contributed with relevant insights into the physiological and thermal perception associations during a 1 h exposure to severe cold temperatures. More importantly, it explored these associations using a protocol simulating manual handling activities commonly observed in daily frozen food industry work. While research studying the impact of severe cold is increasing, more investigation is still needed for occupational applications. For future work, studies should be developed addressing the impact of severe cold thermal environments on core and skin temperature variations, considering both genders, with increased cold exposure duration, conducting and monitoring the performance of different activities but focusing on industrial working activities. In addition, upcoming investigations should be performed by measuring oesophageal or intraabdominal core temperatures [35] and adding more skin temperature points in the extremities (face, fingers, and toes), which were the most reported body parts with pain and cold sensations. Also, the need to adjust current guidelines from international safety agencies was evidenced, mainly by adding work–rest period recommendations for working in severe cold environments with temperatures between −20 and −25 °C, the range commonly observed in the frozen food industry [39]. Finally, in light of the referred thermal sensation responses, new validated questionnaires must be developed to assess thermal sensation, pain, and overall health status of workers subjected to cold environments. These questionnaires could find starting points in the Cold Work Health questionnaire (Annex D of the ISO 15743:2008 [61]) and the TSQ (Annex B of the ISO 10551:1993 [37]), but also considering questions for specific body parts.

4.4. Limitations

The current study has some limitations and improvement points. First, the sample size could have been bigger and mixed-gender representative to support the reliability of outcomes and allow a more comprehensive statistical analysis, even though the recruitment process was rigorous and potential candidates were excluded due to the selection criteria: healthy male non-cigarette smokers. Also, a control group with participants not exposed to severe cold temperatures was not included and should undoubtedly be incorporated in future research. Still, despite these constraints, significant variations could be observed throughout the protocol, and the number of participants is consistent with most recent studies [13,25,27,30,52,62]. In addition, when registering HR and BP, more (or continuous) measurements could have been considered to have a complete view of the evolution of these parameters (mainly for the period of SCE exposure) since they are important risk indicators to prevent cardiovascular diseases [53,63]. Finally, although most available literature points to exposure times of one hour or less [30,46,51], more prolonged exposure may have been needed to describe the effects of cold temperatures using highly protective clothing and performing occupational tasks. Future studies should consider a more extended period and sample size to accurately describe occupational cold exposure and evaluate if performance decreases with exposure time.

5. Conclusions

The current work performed a series of trials to study the physiological and thermal responses before, during, and after severe cold exposure (−20 °C). The main conclusions are summarised as follows:
The weighted mean Tskin decreased in the initial 20 min of exposure (−20 °C) due to light physical exertion activities but then increased until the end of cold exposure. The Tcore decreased only the initial 10 min of SCE exposure and then increased until the end of the exposure period. Since skin and core temperatures increased with higher physical exertion despite exposure to SCE, physical exertion is the main parameter to consider when assessing both variables;
  • The results highlighted the influence of local exposure in evaluating thermal comfort in these conditions. When cold sensation increased, so did pain sensations in the body areas where the skin temperature decreased the most. Consequently, validated TSQ models should be developed to add inquiries addressing thermal sensation on specific body areas, such as those included in this work;
  • Exposure to severe cold thermal environments remains a relevant risk factor in working settings. This study demonstrated that preventive measures such as adequate clothing insulation and work–rest pacing are fundamental to diminish its effects;
  • Future research should monitor changes in performance during different physical exertion activities controlling oesophageal or intra-abdominal Tcore and Tskin on at least eight body areas (or include points on the extremities: fingers and toes), which can also be of great significance for future thermal comfort models.

Author Contributions

Conceptualisation, T.Z., J.S.B. and J.G.; methodology, T.Z., J.T.C., J.G. and J.S.B.; software, T.Z.; validation, T.Z. and J.S.B.; formal analysis, D.B. and J.S.B.; investigation, T.Z.; resources, J.S.B. and J.G.; data curation, T.Z. and D.B.; writing—original draft preparation, T.Z. and D.B.; writing—review and editing, D.B., J.S.B. and J.G.; visualisation, D.B. and J.S.B.; supervision, J.S.B. and J.T.C.; project administration, J.S.B.; funding acquisition, J.S.B. All authors have read and agreed to the published version of the manuscript.

Funding

This research was funded by the Doctoral Program in Occupational Safety and Health of the University of Porto, grant number demsso.tz. PD9986 and the APC were funded by the Biomechanics and Health Unit of the Associated Laboratory for Energy, Transports and Aerospace—LAETA (grant UIDB/50022/2020), funded by the Multiannual Funding Programme for R&D Units of the FCT—Portuguese Foundation for Science and Technology.

Institutional Review Board Statement

The study was conducted in accordance with the Declaration of Helsinki, and the Ethics Committee of the University of Porto approved the research and experimental protocols (Report 06/CEUP/2015).

Informed Consent Statement

Informed consent was obtained from all subjects involved in the study.

Data Availability Statement

The original contributions presented in the study are included in the article. Primary datasets will be made available by the authors on request.

Acknowledgments

The authors would like to thank all the volunteers who participated and contributed to this work.

Conflicts of Interest

The authors declare no conflicts of interest. The funders had no role in the study’s design, in the collection, analyses, or interpretation of data, in the writing of the manuscript, or in the decision to publish the results.

References

  1. Ray, M.; King, M.; Carnahan, H. A review of cold exposure and manual performance: Implications for safety, training and performance. Saf. Sci. 2019, 115, 1–11. [Google Scholar] [CrossRef]
  2. Tochihara, Y. Work in artificial cold environments. J. Physiol. Anthropol. Appl. Hum. Sci. 2005, 24, 73–76. [Google Scholar] [CrossRef] [PubMed]
  3. D’Amato, M.; Molino, A.; Calabrese, G.; Cecchi, L.; Annesi-Maesano, I.; D’Amato, G. The impact of cold on the respiratory tract and its consequences to respiratory health. Clin. Transl. Allergy 2018, 8, 20. [Google Scholar] [CrossRef] [PubMed]
  4. Cheung, S.S.; Lee, J.K.W.; Oksa, J. Thermal stress, human performance, and physical employment standards. Appl. Physiol. Nutr. Metab. 2016, 41, S148–S164. [Google Scholar] [CrossRef]
  5. Piedrahita, H.; Oksa, J.; Malm, C.; Rintamäki, H. Health problems related to working in extreme cold conditions indoors. Int. J. Circumpolar Health 2008, 67, 279–287. [Google Scholar] [CrossRef]
  6. Stjernbrandt, A.; Hoftun Farbu, E. Occupational cold exposure is associated with neck pain, low back pain, and lumbar radiculopathy. Ergonomics 2022, 65, 1276–1285. [Google Scholar] [CrossRef]
  7. Mäkinen, T.M.; Hassi, J. Health problems in cold work. Ind. Health 2009, 47, 207–220. [Google Scholar] [CrossRef]
  8. Mäkinen, T.M.; Raatikka, V.-P.; Rytkönen, M.; Jokelainen, J.; Rintamäki, H.; Ruuhela, R.; Näyhä, S.; Hassi, J. Factors affecting outdoor exposure in winter: Population-based study. Int. J. Biometeorol. 2006, 51, 27–36. [Google Scholar] [CrossRef]
  9. Mäkinen, T.M. Human cold exposure, adaptation, and performance in high latitude environments. Am. J. Hum. Biol. Off. J. Hum. Biol. Assoc. 2007, 19, 155–164. [Google Scholar] [CrossRef] [PubMed]
  10. Chen, X.; Xue, P.; Gao, L.; Du, J.; Liu, J. Physiological and thermal response to real-life transient conditions during winter in severe cold area. Build. Environ. 2019, 157, 284–296. [Google Scholar] [CrossRef]
  11. Gordon, K.; Blondin, D.P.; Friesen, B.J.; Tingelstad, H.C.; Kenny, G.P.; Haman, F. Seven days of cold acclimation substantially reduces shivering intensity and increases nonshivering thermogenesis in adult humans. J. Appl. Physiol. 2019, 126, 1598–1606. [Google Scholar] [CrossRef]
  12. Sessler, D.I. Thermoregulatory defense mechanisms. Crit. Care Med. 2009, 37, S203–S210. [Google Scholar] [CrossRef]
  13. Arnold, J.T.; Hemsley, Z.; Hodder, S.G.; Havenith, G.; Lloyd, A.B. Reliability and validity of methods in the assessment of cold-induced shivering thermogenesis. Eur. J. Appl. Physiol. 2020, 120, 591–601. [Google Scholar] [CrossRef] [PubMed]
  14. Dumont, L.; Lessard, R.; Semeniuk, K.; Chahrour, H.; McCormick, J.J.; Acosta, F.M.; Blondin, D.P.; Haman, F. Thermogenic responses to different clamped skin temperatures in cold-exposed men and women. American Journal of Physiology-Regulatory. Integr. Comp. Physiol. 2022, 323, R149–R160. [Google Scholar] [CrossRef] [PubMed]
  15. Oksa, J.; Ducharme, M.B.; Rintamaki, H. Combined effect of repetitive work and cold on muscle function and fatigue. J. Appl. Physiol. 2002, 92, 354–361. [Google Scholar] [CrossRef] [PubMed]
  16. Golmohammadi, R.; Darvishi, E. The combined effects of occupational exposure to noise and other risk factors—A systematic review. Noise Health 2019, 21, 125–141. [Google Scholar] [CrossRef] [PubMed]
  17. Marzoque, H.J.; Cunha, R.F.d.; Lima, C.M.G.; Nogueira, R.L.; Machado, V.E.d.A.; de Alencar Nääs, I. Work Safety in slaughterhouses: General aspects. Res. Soc. Dev. 2021, 10, e55310111980. [Google Scholar] [CrossRef]
  18. Raimundo, A.M.; Oliveira, A.V.M.; Gaspar, A.R.; Quintela, D.A. Thermal conditions in freezing chambers and prediction of the thermophysiological responses of workers. Int. J. Biometeorol. 2015, 59, 1623–1632. [Google Scholar] [CrossRef] [PubMed]
  19. Farbu, E.H.; Skandfer, M.; Nielsen, C.; Brenn, T.; Stubhaug, A.; Höper, A.C. Working in a cold environment, feeling cold at work and chronic pain: A cross-sectional analysis of the Tromsø Study. BMJ Open 2019, 9, e031248. [Google Scholar] [CrossRef]
  20. Pettersson, H.; Olsson, D.; Järvholm, B. Occupational exposure to noise and cold environment and the risk of death due to myocardial infarction and stroke. Int. Arch. Occup. Environ. Health 2020, 93, 571–575. [Google Scholar] [CrossRef]
  21. Gasparrini, A.; Guo, Y.; Hashizume, M.; Lavigne, E.; Zanobetti, A.; Schwartz, J.; Tobias, A.; Tong, S.; Rocklöv, J.; Forsberg, B.; et al. Mortality risk attributable to high and low ambient temperature: A multicountry observational study. Lancet 2015, 386, 369–375. [Google Scholar] [CrossRef] [PubMed]
  22. Bach, A.J.; Maley, M.J.; Minett, G.M.; Stewart, I.B. Occupational cooling practices of emergency first responders in the United States: A survey. Temperature 2018, 5, 348–358. [Google Scholar] [CrossRef] [PubMed]
  23. Martínez-Solanas, È.; López-Ruiz, M.; Wellenius Gregory, A.; Gasparrini, A.; Sunyer, J.; Benavides Fernando, G.; Basagaña, X. Evaluation of the Impact of Ambient Temperatures on Occupational Injuries in Spain. Environ. Health Perspect. 2018, 126, 067002. [Google Scholar] [CrossRef]
  24. Fu, S.H.; Gasparrini, A.; Rodriguez, P.S.; Jha, P. Mortality attributable to hot and cold ambient temperatures in India: A nationally representative case-crossover study. PLoS Med. 2018, 15, e1002619. [Google Scholar] [CrossRef]
  25. Wu, J.; Hu, Z.; Han, Z.; Gu, Y.; Yang, L.; Sun, B. Human physiological responses of exposure to extremely cold environments. J. Therm. Biol. 2021, 98, 102933. [Google Scholar] [CrossRef]
  26. King, M.; Ray, M.; Mulligan, D.; Carnahan, H. Does training in the cold improve cold performance? Int. J. Ind. Ergon. 2020, 76, 102926. [Google Scholar] [CrossRef]
  27. Li, C.; Wu, J.; Fan, C.; Sun, B.; Hu, Z. Human thermal perception in extremely cold environments: A study of overall and local responses. Energy Build. 2024, 303, 113773. [Google Scholar] [CrossRef]
  28. Kim, J.-Y.; Jung, K.-Y.; Hong, Y.-S.; Kim, J.-I.; Jang, T.-W.; Kim, J.-M. The relationship between cold exposure and hypertension. J. Occup. Health 2003, 45, 300–306. [Google Scholar] [CrossRef]
  29. Xiong, J.; Lian, Z.; Zhang, H. Effects of exposure to winter temperature step-changes on human subjective perceptions. Build. Environ. 2016, 107, 226–234. [Google Scholar] [CrossRef]
  30. Wu, J.; Sun, B.; Hu, Z.; Li, L.; Zhu, H. Physiological responses and thermal sensation during extremely cold exposure (−20 °C). Build. Environ. 2021, 206, 108338. [Google Scholar] [CrossRef]
  31. Zlatar, T.; Baptista, J.; Costa, J. Physical Working Performance in Cold Thermal Environment: A Short Review. In Occupational Safety and Hygiene III; Taylor & Francis Group: London, UK, 2015; pp. 401–404. [Google Scholar]
  32. Zlatar, T.; Torres Costa, J.; Vaz, M.; Santos Baptista, J. Influence of severe cold thermal environment on core and skin temperatures: A systematic review. Work 2019, 62, 337–352. [Google Scholar] [CrossRef]
  33. ISO 9920:2007; Ergonomics of the Thermal Environment–Estimation of Thermal Insulation and Water Vapour Resistance of a Clothing Ensemble. International Organization for Standardization: Geneva, Switzerland, 2007.
  34. Guedes, J.C.; Costa, E.Q.; Baptista, J.S. Using a Climatic Chamber to Measure the Human Psychophysiological Response under Different Combinations of Temperature and Humidity. Thermol. Int. 2012, 22, 49–54. Available online: http://ww.uhlen.at/thermology-international/archive/EAT2012_Book_of_Proceedings.pdf#page=50 (accessed on 13 December 2023).
  35. ISO 9886:2004; Ergonomics—Evaluation of Thermal Strain by Physiological Measurements. International Organization for Standardization: Geneva, Switzerland, 2004.
  36. ISO 7730:2005; Ergonomics of the Thermal Environment. Analytical Determination and Interpretation of Thermal Comfort Using Calculation of the PMV and PPD Indices and Local Thermal Comfort Criteria. CEN (European Committee for Standardization): Geneva, Switzerland, 2005.
  37. ISO 10551:1993; Assessment of the Influence of the Thermal Environment Using Subjective Judgement Scales. International Standards Organization: Geneva, Switzerland, 1993.
  38. Ozaki, H.; Nagai, Y.; Tochihara, Y. Physiological responses and manual performance in humans following repeated exposure to severe cold at night. Eur. J. Appl. Physiol. 2001, 84, 343–349. [Google Scholar] [CrossRef]
  39. Zlatar, T.; Barkokébasb, B., Jr.; Bezerra, L.M.; Araujo Brito, M.M.; Costa, J.T.; Vaz, M.; dos Santos Baptista, J. Safety and health risks for workers exposed to cold thermal environments: A frozen food processing industry perspective. Work 2021, 70, 645–655. [Google Scholar] [CrossRef] [PubMed]
  40. Mäkinen, T.T.; Gavhed, D.; Holmér, I.; Rintamäki, H. Effects of metabolic rate on thermal responses at different air velocities in −10 °C. Comp. Biochem. Physiol. Part A Mol. Integr. Physiol. 2001, 128, 759–768. [Google Scholar] [CrossRef] [PubMed]
  41. Charkoudian, N. Mechanisms and modifiers of reflex induced cutaneous vasodilation and vasoconstriction in humans. J. Appl. Physiol. 2010, 109, 1221–1228. [Google Scholar] [CrossRef] [PubMed]
  42. Whelton, P.K.; Carey, R.M.; Mancia, G.; Kreutz, R.; Bundy, J.D.; Williams, B. Harmonization of the American College of Cardiology/American Heart Association and European Society of Cardiology/European Society of Hypertension blood pressure/hypertension guidelines: Comparisons, reflections, and recommendations. Eur. Heart J. 2022, 43, 3302–3311. [Google Scholar] [CrossRef] [PubMed]
  43. Brajkovic, D.; Ducharme, M.B. Facial cold-induced vasodilation and skin temperature during exposure to cold wind. Eur. J. Appl. Physiol. 2006, 96, 711–721. [Google Scholar] [CrossRef] [PubMed]
  44. Gavhed, D.C.E.; Holmér, I. Thermal responses at three low ambient temperatures: Validation of the duration limited exposure index. Int. J. Ind. Ergon. 1998, 21, 465–474. [Google Scholar] [CrossRef]
  45. Baldus, S.; Kluth, K.; Strasser, H. Order-picking in deep cold—Physiological responses of younger and older females. Part 2: Body core temperature and skin surface temperature. Work 2012, 41, 3010–3017. [Google Scholar] [CrossRef]
  46. Daanen, H.A.M. Manual Performance Deterioration in the Cold Estimated Using the Wind Chill Equivalent Temperature. Ind. Health 2009, 47, 262–270. [Google Scholar] [CrossRef]
  47. Kim, T.G.; Tochihara, Y.; Fujita, M.; Hashiguchi, N. Physiological responses and performance of loading work in a severely cold environment. Int. J. Ind. Ergon. 2007, 37, 725–732. [Google Scholar] [CrossRef]
  48. Kluth, K.; Baldus, S.; Strasser, H. Order-picking in deep cold—Physiological responses of younger and older females. Part 1: Heart rate. Work 2012, 41, 3002–3009. [Google Scholar] [CrossRef] [PubMed]
  49. Kluth, K.; Penzkofer, M.; Strasser, H. Age-Related Physiological Responses to Working in Deep Cold. Hum. Factors Ergon. Manuf. Serv. Ind. 2013, 23, 163–172. [Google Scholar] [CrossRef]
  50. Wiggen, Ø.N.; Heen, S.; Revik, H.; Reinertsen, R.E. Effect of Cold Conditions on Manual Performance while Wearing Petroleum Industry Protective Clothing. Ind. Health 2011, 49, 443–451. [Google Scholar] [CrossRef] [PubMed]
  51. Oksa, J.; Kaikkonen, H.; Sorvisto, P.; Vaappo, M.; Martikkala, V.; Rintamäki, H. Changes in maximal cardiorespiratory capacity and submaximal strain while exercising in cold. J. Therm. Biol. 2004, 29, 815–818. [Google Scholar] [CrossRef]
  52. Hu, S.; Maeda, T. Productivity and physiological responses during exposure to varying air temperatures and clothing conditions. Indoor Air 2020, 30, 251–263. [Google Scholar] [CrossRef] [PubMed]
  53. Li, Y.; Alshaer, H.; Fernie, G. Blood pressure and thermal responses to repeated whole body cold exposure: Effect of winter clothing. Eur. J. Appl. Physiol. 2009, 107, 673. [Google Scholar] [CrossRef]
  54. Orysiak, J.; Młynarczyk, M.; Irzmańska, E. The Impact of Protective Gloves on Manual Dexterity in Cold Environments—A Pilot Study. Int. J. Environ. Res. Public Health 2022, 19, 1637. [Google Scholar] [CrossRef]
  55. Irzmańska, E.; Wójcik, P.; Adamus-Włodarczyk, A. Manual work in cold environments and its impact on selection of materials for protective gloves based on workplace observations. Appl. Ergon. 2018, 68, 186–196. [Google Scholar] [CrossRef]
  56. Rintamäki, H.; Rissanen, S.; Mänttäri, S.; Oksa, J.; Jussila, K.; Group, M.R. 392 Low hand temperatures can be a risk factor in arctic surface mining. Inj. Prev. 2016, 22, A143. [Google Scholar] [CrossRef]
  57. Huizenga, C.; Zhang, H.; Arens, E.; Wang, D. Skin and core temperature response to partial- and whole-body heating and cooling. J. Therm. Biol. 2004, 29, 549–558. [Google Scholar] [CrossRef]
  58. Arens, E.; Zhang, H.; Huizenga, C. Partial- and whole-body thermal sensation and comfort—Part I: Uniform environmental conditions. J. Therm. Biol. 2006, 31, 53–59. [Google Scholar] [CrossRef]
  59. Ji, W.; De Dear, R.; Kim, J.; Zhu, Y.; Cao, B.; Liu, S. Study on the influence of climatic thermal exposure environment changed from cold to hot on human thermal preference. Build. Environ. 2022, 207, 108430. [Google Scholar] [CrossRef]
  60. Imamura, R.; Rissanen, S.; Kinnunen, M.; Rintamäki, H. Manual performance in cold conditions while wearing NBC clothing. Ergonomics 1998, 41, 1421–1432. [Google Scholar] [CrossRef]
  61. ISO 15743:2008; Ergonomics of the Thermal Environment—Cold Workplaces—Risk Assessment and Management. International Standards Organization: Geneva, Switzerland, 2008. Available online: https://www.iso.org/standard/38895.html (accessed on 13 December 2023).
  62. Yang, L.; Wu, J.; Hu, Z.; Gao, F.; Hu, X. Effects of workload on human cognitive performance of exposure to extremely cold environment. Physiol. Behav. 2021, 230, 113296. [Google Scholar] [CrossRef]
  63. Ikäheimo, T.M. Cardiovascular diseases, cold exposure and exercise. Temperature 2018, 5, 123–146. [Google Scholar] [CrossRef]
Figure 1. Testing schedule for each participant before, during, and after severe cold exposure.
Safety 10 00019 g001
Figure 2. The climatic chamber ground plan with dimensions in centimetres.
Safety 10 00019 g002
Figure 3. Overall core temperature responses during the 3 h protocol. The markers point to the mean core temperature and the blue shadowed area corresponds to the standard deviations registered per minute. The lines refer to the minimum and maximum individual responses reported.
Safety 10 00019 g003
Figure 4. Core temperature responses of all participants every 20 and 30 min (panels (a) and (b), respectively) and the significance of variations among groups. The error bars indicate the standard deviations registered in each case.
Safety 10 00019 g004
Figure 5. Overall skin temperature responses during the 3 h protocol. The markers point to the mean skin temperature and the green shadowed area corresponds to the standard deviations registered per minute. The lines refer to the minimum and maximum individual responses.
Safety 10 00019 g005
Figure 6. Skin temperature responses of all participants every 20 and 30 min (panels (a) and (b), respectively) and the significance of variations among groups. The error bars indicate the standard deviations registered in each case.
Safety 10 00019 g006
Figure 7. Left-hand skin temperature responses during the 3 h protocol. The markers point to the mean left-hand temperature and the orange shadowed area corresponds to the standard deviations registered per minute. The lines refer to the minimum and maximum individual responses.
Safety 10 00019 g007
Figure 8. Forehead skin temperature responses during the 3 h protocol. The markers point to the mean forehead temperature and the orange shadowed area corresponds to the standard deviations registered per minute. The lines refer to the minimum and maximum individual responses.
Safety 10 00019 g008
Figure 9. Individual and mean responses (dashed and dark green lines, respectively) to Question 1 (How do you feel at this precise moment?) of the TSQ. Scale: −4 (very cold), −3 (cold), −2 (cool), −1 (slightly cool), 0 (neutral), 1 (slightly warm), 2 (warm), 3 (hot), 4 (very hot).
Safety 10 00019 g009
Figure 10. Individual and mean responses (dashed and dark green lines, respectively) to Question 2 (How do you find this?) of the TSQ. Scale: −4 (Extremely uncomfortable), −3 (very uncomfortable), −2 (uncomfortable), −1 (slightly uncomfortable), 0 (comfortable).
Safety 10 00019 g010
Figure 11. Individual and mean responses (dashed and dark green lines, respectively) to Question 3 (At this moment, would you prefer to be?) of the TSQ. Scale: −3 (much cooler), −2 (cooler), −1 (slightly cooler), 0 (neutral, without change), 1 (slightly warmer), 2 (warmer), 3 (much warmer).
Safety 10 00019 g011
Figure 12. Correlations between thermal sensation and local skin temperature: weighted mean, forehead, and left hand for Questions 1 (How do you feel at this precise moment? panel (a), 2 (How do you find this? panel (b) and 3 (At this moment, would you prefer to be? panel (c). In each case, markers indicate the relationship between mean temperature and mean TSQ responses.
Safety 10 00019 g012
Figure 13. Individual and mean responses (dashed and dark green lines, respectively) to Question 5 (Is this environment in your opinion…?) of the TSQ. Scale: −4 (unbearable), −3 (very difficult to bear), −2 (fairly difficult to bear), −1 (slightly difficult to bear), 0 (perfectly bearable).
Safety 10 00019 g013
Figure 14. Blood pressure and heart rate responses from all participants before and after SCE (panels (a) and (b), respectively). The markers represent the mean values and the error bars indicate the standard deviations reported in each case.
Safety 10 00019 g014
Table 1. The sequence of activities during SCE.
SequenceActivityDuration
1Answer the TSQ4 min
2Walk and heat the hands (1 min)
3Put four papers in every box (one by one)
4Close the boxes
5Move each box to shelf 1
6Rest for 1 min (heat the hands)
7Move each box from shelf 1 to 2 (one by one)4 min
Rest 5 s (heat the hands)
8Move each box from shelf 2 to 3 (one by one)
Rest 5 s (heat the hands)
9Move each box from shelf 3 to 4 (one by one)
Rest 5 s (heat the hands)
10Move each box from shelf 4 to 5 (one by one)
11Rest for 1 min (heat the hands)5 min
12Do the game with glass balls ten times
13Rest for 1 min (heat the hands)
14Move each box from shelf 5 to 4 (one by one)4 min
Rest 5 s (heat the hands)
15Move each box from shelf 4 to 3 (one by one)
Rest 5 s (heat the hands)
16Move each box from shelf 3 to 2 (one by one)
Rest 5 s (heat the hands)
17Move each box from shelf 2 to 1 (one by one)
18Rest for 1 min (heat the hands)3 min
19Put each box on the table (one by one)
20Open the boxes
21Put four papers from each box to the starting point (one by one)
22Walk and heat the hands (1 min)
Disclaimer/Publisher’s Note: The statements, opinions and data contained in all publications are solely those of the individual author(s) and contributor(s) and not of MDPI and/or the editor(s). MDPI and/or the editor(s) disclaim responsibility for any injury to people or property resulting from any ideas, methods, instructions or products referred to in the content.

